1
System Operation
Graphic Displays and Tools
Topology
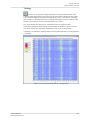
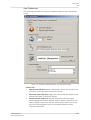
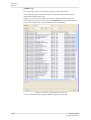
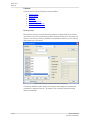
Use this icon to generate a topology display of a selected measurement point.
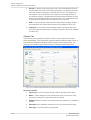
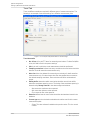
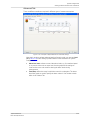
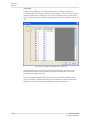
Topology shows the frequency versus the time or speed and the amplitude color coded.
This is a useful display to study transient data like run-ups or coast-downs. A topology
plot is similar to a 3D plot, but the user is looking at the data from above. With the color
encoding, it is easier for the eye to identify patterns in the data.
As in other displays, the data can be recalculated on the fly to display data in
acceleration, velocity or displacement, and in the depth of date/time, speed or process.
Just like in 3D plot, even spreading of date/time on the z-axis is also possible.
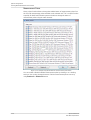
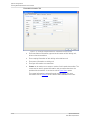
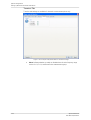
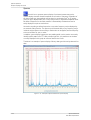
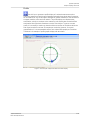
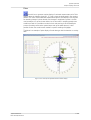
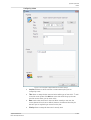
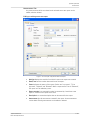
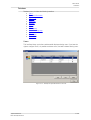
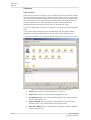
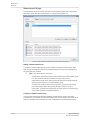
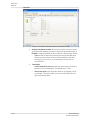
The below is an example of topology display of binary data type with no overlay data and
no live data.
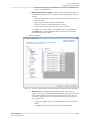
Figure 4-46: Example of @ptitude Observer Topology display
@ptitude Observer
User Manual, Revision I
4-97