1
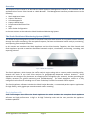
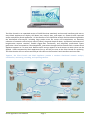
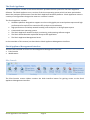
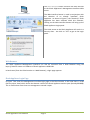
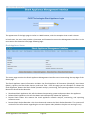
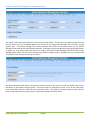
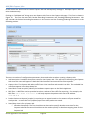
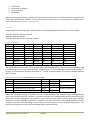
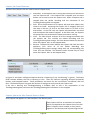
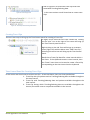
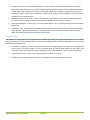
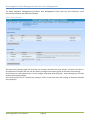
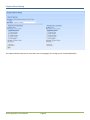
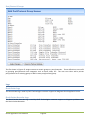
User Manual THE SHARK DISTRIBUTED MONITORING SYSTEM PUBLISHED BY CACE Technologies, Inc. 1949 5th Street, Suite 103 Davis, CA 95616 Copyright © 2010 CACE Technologies, Inc. All rights reserved. No part of the contents of this manuscript may be reproduced or transmitted in any form or by any means without the written permission of the publisher. Wireshark and the Wireshark icon are registered trademarks of Wireshark Foundation, Inc. Microsoft Word, DOS, Windows XP, Microsoft Excel, Microsoft Wordpad, and Windows Vista are registered trademarks of Microsoft, Inc. Acrobat Reader is a registered trademark of Adobe Systems, Inc. The example companies, organizations, products, domain names, e-mail addresses, logos, people, places, and events depicted herein with the exception of those aforementioned, are fictitious. Shark Appliance User Manual Document Revision: Document Date: 4.1 October 2010 http://www.cacetech.com Shark Appliance User Manual Page 2 Contents 1. 2. 3. 4. Overview .......................................................................................................................................... 6 The Shark Distributed Monitoring System (SDMS) ............................................................................. 6 The Shark Appliance ......................................................................................................................... 8 Shark Appliance Management Interface ............................................................................................ 8 Pilot Console................................................................................................................................................. 8 Web Browser ................................................................................................................................................ 9 Shark Appliance Login Page ......................................................................................................................... 9 Shark Appliance Status ...............................................................................................................................10 Navigation Buttons.....................................................................................................................................11 5. The Shark Packet Recorder ............................................................................................................. 11 Capture Jobs (Shark Appliance Packet Recorder) ......................................................................................13 Add/Edit Capture Jobs................................................................................................................................14 Trending/Indexing Parameters ..................................................................................................................15 The Parameters ..........................................................................................................................................17 Capture Job Control Buttons ......................................................................................................................18 Capture Jobs in the Pilot Console Devices Panel .......................................................................................18 Pilot Console Operations on Job Interfaces ...............................................................................................19 Capture Jobs in the Pilot Console Files Panel.............................................................................................19 Pilot Console Operations on Job Traces – Trace Clips................................................................................20 Creating Trace Clips ............................................................................................................................21 Time Control Panel for Creating Trace Clips.......................................................................................21 Using Time Selection to Create a Trace Clip.......................................................................................24 Using Views as Job Trace Indices........................................................................................................26 Using Events to Create Trace Clips .....................................................................................................26 6. Export Job Packets .......................................................................................................................... 28 7. User Management .......................................................................................................................... 30 Shark Appliance Credential Manager.........................................................................................................30 User and Group Access Control..........................................................................................................30 Shark Appliance Web Management Interface User Management ............................................................32 View Users/Groups.............................................................................................................................32 Add Users/Groups ..............................................................................................................................33 8. Capture Board Setup....................................................................................................................... 34 9. Port/Protocol Definition ................................................................................................................. 35 Port/Protocol Names .................................................................................................................................35 Port/Protocol Groups .................................................................................................................................36 10. Logs ............................................................................................................................................... 36 Shark Probe Logs ........................................................................................................................................36 Shark Packet Recorder Logs .......................................................................................................................36 11. Shark Probe Configuration File ........................................................................................................ 37 12. Logout ............................................................................................................................................ 37 Figures Figure 1: SDMS Shark Appliances........................................................................................................................ 6 Figure 2: Pilot Console ........................................................................................................................................ 7 Figure 3: An Example Shark Distributed Monitoring System Deployment ........................................................ 7 Figure 4: Pilot Console Remote Ribbon .............................................................................................................. 8 Figure 5: Web Interface Selection....................................................................................................................... 9 Figure 6: Security Alert........................................................................................................................................ 9 Shark Appliance User Manual Page 3 Figure 7: Management Interface Login............................................................................................................. 10 Figure 8: Shark Appliance Status Page .............................................................................................................. 10 Figure 9: Shark Appliance Storage Systems ...................................................................................................... 12 Figure 10: Shark Appliance Packet Recorder – No Capture Jobs ...................................................................... 13 Figure 11: Storage Format Options ................................................................................................................... 13 Figure 12: Adding a Capture Job ....................................................................................................................... 14 Figure 13: Trending/Indexing Parameters ........................................................................................................ 15 Figure 14: Trending/Indexing Enabled .............................................................................................................. 17 Figure 15: Synchronized Trending..................................................................................................................... 17 Figure 16: Trending/Indexing Disabled ............................................................................................................. 17 Figure 17: Managing a Capture Job .................................................................................................................. 18 Figure 18: Job Interface in Devices Panel ......................................................................................................... 19 Figure 19: Jobs Repository Folder in the Files Panel ......................................................................................... 20 Figure 20: Trace Clip for JLB .............................................................................................................................. 21 Figure 21: Trace Clips with Trending and Indexes ............................................................................................ 21 Figure 22: Creating a Trace Clip ........................................................................................................................ 21 Figure 23: Add a Trace Clip ............................................................................................................................... 21 Figure 24: Time Control Panel for Creating Trace Clips .................................................................................... 22 Figure 25: Trace Clip Time Selection ................................................................................................................. 22 Figure 26: Packets Only ..................................................................................................................................... 23 Figure 27: Packets Plus Trending/Indexing Data .............................................................................................. 23 Figure 28: Packets Plus Trending/Indexing Data .............................................................................................. 23 Figure 29: Trending/Indexing Data Only ........................................................................................................... 23 Figure 30: Combination of Trending/Indexing Data Only and Packets Plus Trending/Indexing Data .............. 23 Figure 31: Bring Up Filter Editor........................................................................................................................ 23 Figure 32: Filter Editor ...................................................................................................................................... 24 Figure 33: Time Selection in a Strip Chart ......................................................................................................... 24 Figure 34: Time Selection Dragged Over Job Trace to Create a Trace Clip ....................................................... 25 Figure 35: View Applied to a Trace Clip ............................................................................................................ 25 Figure 36: Visual Indices for a Job Trace ........................................................................................................... 26 Figure 37: Event List .......................................................................................................................................... 27 Figure 38: Creating a Trace Clip from an Event................................................................................................. 27 Figure 39: Trace Clip Corresponding to an Event.............................................................................................. 28 Figure 40: Export Job Packets ........................................................................................................................... 28 Figure 41: Link To Export Packets ..................................................................................................................... 29 Figure 42: Open or Save Packets to be Exported .............................................................................................. 29 Figure 43: View Shark Appliance Usesr/Groups ............................................................................................... 32 Figure 44: Add Users/Groups ............................................................................................................................ 33 Figure 45: TurboCap Board Setup ..................................................................................................................... 34 Figure 46: Edit Port/Protocol Names ................................................................................................................ 35 Figure 47: Edit Port/Protocol Group Names ..................................................................................................... 36 Figure 48: Shark Probe Configuration File ........................................................................................................ 37 Icons Icon 1: Web Interface.......................................................................................................................................... 9 Icon 2: Back Button ........................................................................................................................................... 11 Icon 3: Refresh Button ...................................................................................................................................... 11 Icon 4: Forward Button ..................................................................................................................................... 11 Icon 5: Job Interface ......................................................................................................................................... 19 Icon 6: Jobs Repository Folder ......................................................................................................................... 19 Shark Appliance User Manual Page 4 Icon 7: Job Trace w/o Trending/Indexing ......................................................................................................... 19 Icon 8: Job Trace with Trending/Indexing ......................................................................................................... 20 Icon 9: Job Trace with Mixed Trending/Indexing .............................................................................................. 20 Icon 10: Trace Clip ............................................................................................................................................. 20 Icon 11: Trace Clip with Index ........................................................................................................................... 20 Icon 12: Trace Clip with Trending ..................................................................................................................... 20 Shark Appliance User Manual Page 5 Overview The purpose of this manual is to describe the Shark Appliance Management Interface. This interface can be accessed either from a Pilot Console or a Web Browser. The Management Interface provides access to the following: Shark Appliance Status Capture Job Setup User Management Capture Board Setup Port/Protocol Definition Files Logs Shark Probe Configuration In the next section we introduce the Shark Distributed Monitoring System. The Shark Distributed Monitoring System (SDMS) The SDMS has been designed to provide a complete enterprise-wide solution for increased network visibility through live traffic monitoring, line-rate packet capture, real-time and historical traffic analysis, monitoring, and reporting from multiple locations. In this section we introduce the Shark Appliance and the Pilot Console. Together, the Pilot Console and Shark Appliance provide a seamless distributed network analysis, visualization, monitoring, recording, and reporting solution. Figure 1: SDMS Shark Appliances The Shark Appliance, which houses the traffic analysis engine along with a custom packet recording utility, extends the reach of our CACE Pilot analyzer to geographically-dispersed network locations. Shark Appliances are designed for placement at strategic points throughout your network, thereby providing the visibility necessary for global monitoring and troubleshooting. The Shark Appliance comes as a fully configured rack mount PC including one or more TurboCap™ boards for network traffic capture. The Shark Appliance software includes the Shark Packet Recorder, a customized packet capture application for high fidelity, multi-gigabit per second network traffic recording. Shark Appliance Kit CACE Technologies also offers the Shark Appliance Kit which includes the complete Shark Appliance software and high-performance 1 GigE or 10 GigE TurboCap cards and the user provides the appliance hardware platform. Shark Appliance User Manual Page 6 Figure 2: Pilot Console The Pilot Console is an expanded version of CACE Pilot that seamlessly and securely interfaces with one or more Shark Appliances to display, drill down into, rewind, alert, and report on, network traffic captured and/or analyzed by Shark Appliances. All the features of the CACE Pilot analysis tool have been migrated to the distributed environment, including large packet trace file access and manipulation, an extensive collection of network traffic analysis metrics (Views), drag and drop drill-down, visualization and analysis of long-duration capture statistics, flexible trigger-alert mechanism, and simplified, professional report generation. Once connected to a Shark Appliance, interaction through the Pilot Console with a remote Shark Appliance appears as if it were local. Remote traffic sources appear as local sources to which Views can be applied. Views computed by Shark Appliances (live or off-line) are sent to the Pilot Console for rendering. The Pilot Console also can access and analyze live traffic on the Console’s local interfaces and trace files. Together, the Pilot Console and Shark Appliance provide a seamless distributed network analysis, visualization, monitoring, recording, and reporting solution. Figure 3: An Example Shark Distributed Monitoring System Deployment Shark Appliance User Manual Page 7 The Shark Appliance The Shark Appliance includes a rack-mount PC which provides the host system for the Shark Appliance Software. The Shark Appliance runs a version of the Linux operating system which has been optimized to obtain the maximum performance from the Shark Appliance hardware platform. Shark Appliances come in a variety of configurations designed to meet our customer’s needs. The Shark Appliance includes: Hardware platform designed to support zero-loss multi-gigabit per second packet capture and highperformance live and off-line network traffic analysis and visualization High-performance TurboCap network board(s) with multiple 1 or 10 GigE capture ports Customized Linux operating system The Shark Appliance network analysis, monitoring, and reporting software engine The Shark Packet Recorder optimized dump-to-disk application The Shark Appliance Management Server In the remainder of this manual, we describe the Shark Appliance Management Interface. Shark Appliance Management Interface There are two methods to access the Shark Appliance Management Interface: Pilot Console Web Browser Pilot Console Figure 4: Pilot Console Remote Ribbon The Pilot Console remote ribbon contains the Web Interface button for gaining access to the Shark Appliance Management Interface. Shark Appliance User Manual Page 8 The Web Interface button connects the Pilot Console to the Shark Appliance’s Management Interface Web server. Icon 1: Web Interface The Web Interface button is used in conjunction with the selection of an already “attached” Shark Appliance. As shown in Figure 5, the “dorothy2” Shark Appliance has been selected. With this selection, clicking on the Web Interface button will bring up the Shark Appliance Login panel. Figure 5: Web Interface Selection The initial access to the Shark Appliance will result in a Security Alert. Just click on “Yes” to get to the Login panel Figure 6: Security Alert Web Browser The Shark Appliance Management Interface can also be accessed from a Web Browser using the https://<domain name or IP address of Shark Appliance>:8080 URL. In both cases (from the Pilot Console or a Web Browser), a login page appears. Shark Appliance Login Page In Figure 7 we show the Management Interface login page in the Pilot Console. In this case there is a tab (like any other View) which shows the domain name of the Shark Appliance and the port (dorothy3:61898). This is useful when more than one management console is open. Shark Appliance User Manual Page 9 Figure 7: Management Interface Login The appearance of the login page is similar in a Web browser, with the exception that no tab is shown. In both cases, the user must provide a Username and Password to access the Management Interface. In the next section we show the initial page following login. Shark Appliance Status Figure 8: Shark Appliance Status Page The status page contains the Shark Appliance Management Interface menu items along the top edge of the Status page. The Shark Appliance status information includes: the Shark Appliance PC hostname (dorothy6), User Name (admin), Uptime, the Pilot Probe Version, and Local Time. From this page you can shutdown or reboot the Shark Appliance, Restart the Shark Probe (network analysis, monitoring, and reporting software server), and Restart the Shark Packet Recorder. Shutdown Shark Appliance: this will shut down the operating system and power-down the appliance Reboot Shark Appliance: this will shut down and subsequently reboot the appliance Restart Shark Probe: this restarts the shark appliance network analysis, monitoring, and reporting software server Restart Shark Packet Recorder: this shuts down and restarts the Shark Packet Recorder. The system will retain all of the information regarding the current Capture Jobs (whether the jobs are running or not) Shark Appliance User Manual Page 10 Navigation Buttons Buttons 1: Web Navigation Buttons The upper left-hand corner of the Management Interface contains three buttons shown to the left. The left and right arrows are for standard Web “back” and “forward” navigation. The middle button is the “refresh” button. Icon 2: Back Button Icon 3: Refresh Button Icon 4: Forward Button The Shark Packet Recorder The usual approach to capturing high-speed and/or long duration traffic is to create a file rotation scheme whereby the capture is broken down into a large collection of small trace files with names indicating the time intervals covered by the individual files. It is not difficult to see that this approach can lead to thousands of small files making analysis and troubleshooting extremely tedious, especially when the traffic of interest spans multiple trace files. The Shark Appliance includes a “dump-to-disk” facility called the Shark Packet Recorder which uses a new approach for dealing with high-speed and/or long-duration traffic capture scenarios. CACE Technologies’ Packet Recorder is based on an optimized packet data store and a novel approach which makes use of time filters which together eliminate the need for a file rotation scheme for capturing, analyzing, and viewing massive amounts of network traffic. The Packet Recorder saves network traffic in the packet data store as objects called Job Traces. CACE Technologies has created a new and intuitive approach for creating Trace Clips, which correspond to arbitrary time intervals within a Job Trace. An important feature of a Trace Clip is that it does not require any additional storage beyond the underlying Job Trace. A Trace Clip essentially acts as a time filter on the underlying Job Trace. One of the ways a Trace Clip can be created is by dragging a time selection from a chart on to the underlying Job Trace object – the Trace Clip will be created automatically! Trace Clips are used to isolate specific and manageable portions of a Job Trace for analysis and visualization and behave just like ordinary trace files. Using Send To File, Trace Clips can be converted to ordinary pcap files on the Shark Appliance (no packets leave the appliance). Some terminology: Capture Job: A Capture Job refers to the specific parameters associated with at “packet recording session.” These parameters include a name, the live network traffic interface to be used, a BPF filter, Shark Appliance User Manual Page 11 starting and stopping criteria, and an upper bound on the amount of storage to be used by the Capture Job. Job Trace: Each Capture Job is associated with exactly one Job Trace which has the same name as the Capture Job. The Job Trace represents the network traffic saved in the packet data store. Trace Clips: CACE Technologies has created a new approach which enables quick and easy access to arbitrary time intervals in a Job Trace. Time intervals within a Job Trace are called Trace Clips and there are a number of simple and visually oriented ways in which Trace Clips can be created using the Pilot Console. Trace Clips do not require any additional storage and behave exactly like ordinary trace files. Jobs Repository: The Files Panel for a Shark Appliance contains a folder called the Jobs Repository. This folder has a representation of each Job Trace in the Appliance. This representation consists of an icon and the name of the corresponding Capture Job. Capture Job Interface: The Devices Panel for a Shark Appliance contains an icon and a name for each of the live capture interfaces associated with Capture Jobs on the Shark Appliance. Views can be applied to the Job Interface creating a visual analysis and representation of the corresponding Job Trace. Trace clips can be automatically created by dragging a time interval selection from a View on the Job Interface to the corresponding Job Trace! Figure 9: Shark Appliance Storage Systems The Shark Appliance includes two separate disk configurations: The OS Disk contains the Shark Appliance file system, Shark Appliance software, pcap trace files, View metrics, and Trending/Indexing data for Job Traces and pcap files. The RAID Array contains the Shark Packet Recorder storage system for saving Job Traces. This storage system is optimized to provide high-speed writing to disk and fast read access to arbitrary time intervals within a Job Trace. Shark Appliance User Manual Page 12 Capture Jobs (Shark Appliance Packet Recorder) Figure 10: Shark Appliance Packet Recorder – No Capture Jobs The Capture Jobs menu item takes you to the screen shown above. The sections on Packet Storage Info and OS File System Info are displayed before the section of this page that describes the currently running capture jobs. The Packet Storage Info section provides total space and available space on the Packet Storage system used by the Shark Packet Recorder. Clicking on the Format button brings up the page shown in Figure 11. This panel shows the block size used by the Shark Packet Recorder and offers the Format Storage button which can be used to reformat the Packet Storage System. Needless to say, you should be very careful if you choose to exercise this option. Figure 11: Storage Format Options The Reserved space field makes it possible to prevent access to the sectors at the very end of each of the disk drives in the packet storage system. The inner tracks of hard drives (at the “end” of the hard drive) have slower data transfer rates than the outermost tracks. This field can be used to get a more uniform write-to-disk speed by restricting access to some percentage of the disk drives. Shark Appliance User Manual Page 13 Add/Edit Capture Jobs In this section we show how to create a Capture Job and subsequently manage it. Multiple Capture Jobs can exist simultaneously. Clicking on “Add New Job” brings up a new Capture Job form on the Capture Job page. This form is shown in Figure 12. The form has two tabs: Packet Recording Parameters and Trending/Indexing Parameters. We will consider the Packet Recording Parameters in this section and the Trending/Indexing Parameters in the following section. Figure 12: Adding a Capture Job There are a number of configuration parameters that need to be set when creating a Capture Job: Job Description. Provide a descriptive name for the Capture Job. This will help in identifying the Capture Job since this name will appear in both the Pilot Console’s Devices and Files source panels. Capture Port. The Capture Job takes traffic from a live interface and records it to disk. The available live interfaces appear in the drop-down list. Start Blink is used to quickly identify the hardware capture port on the Shark Appliance BPF Filter. A BPF filter can be provided to select a subset of the traffic for capturing. For example, the BPF filter “src host 172.18.5.4” will only capture the packets with source IP address 172.18.5.4 Packet Portion to Capture (snaplen) is used to put an upper bound on the amount of bytes saved for each packet – at most the first (snaplen) bytes from each packet are saved. Start/Stop criteria for a Capture Job o Absolute Start/Stop. The first check box can be used to specify absolute start time for the Capture Job and the second check box can be used to specify an absolute stopping time for the Capture Job Shark Appliance User Manual Page 14 o Stop Capturing after. These check boxes can be used to specify stopping conditions based on size of the Capture Job in terms of megabytes or number of packets. Capture duration can also be used as a stopping condition. Keep on disk. These parameters are used to limit the maximum amount of storage used by the Capture Job. Once a limit is reached, then the oldest packets are discarded so as to not exceed the limit. If more than one condition is chosen, then the most stringent condition is applied. Note: When multiple conditions have been selected the most stringent condition is the controlling condition. For example, if an absolute time stopping condition and a stopping condition based on the number of captured packets are selected, then the first condition to be satisfied will stop the capture job. Trending/Indexing Parameters In this section we describe the use of Trending/Indexing Parameters. Figure 13: Trending/Indexing Parameters Before we describe the Trending/Indexing Parameters, we present a simplified version of the underlying computation performed by the Pilot Probe when the Trending/Indexing is enabled. For each packet, the Conversation Identifier consists of the 5-tuple: 1. Source IP address Shark Appliance User Manual Page 15 2. 3. 4. 5. Source Port Destination IP address Destination Port IP Protocol When the Trending/Indexing is enabled, the Pilot Probe computes the sum of the total bytes and packets for each unique conversation identifier in the traffic stream for each second. This information is stored in a file and is referred to as Trending/Indexing Data. Example Suppose that the incoming traffic stream consists of the following packets over the first three seconds: Second 1: packet 1, packet2, packet3 Second 2: packet4, packet5 Second 3: packet6, packet7, packet8, packet9 Traffic Recording Pkt. No. Src IP 1 1.2.3.4 2 1.2.3.4 3 5.6.7.8 4 1.2.3.4 5 1.2.3.4 6 5.6.7.8 7 8.7.6.5 8 5.6.7.8 9 5.6.7.8 Src Port 10 10 20 10 10 20 30 20 20 Dst IP 4.3.2.1 4.3.2.1 8.7.6.5 4.3.2.1 4.3.2.1 8.7.6.5 5.6.7.8 8.7.6.5 8.7.6.5 Dst Port 15 15 30 15 15 30 20 30 30 IP Proto UDP UDP TCP UDP UDP TCP TCP TCP TCP Size (bytes) 250 300 1000 75 80 1100 68 950 1000 The above table represents the first 3 seconds of a Traffic Recording where the Conversation Identifier and corresponding size for each packet is shown. There are two distinct conversation identifiers during the 1st second, one conversation identifier during the 2nd second, and two distinct conversation identifiers during the 3rd second. Trending/Indexing Data computed by the Pilot Probe Second Conversation Identifier Bytes 1 (1.2.3.4, 10, 4.3.2.1, 15, UDP) 550 1 (5.6.7.8, 20, 8.7.6.5, 30, TCP) 1000 2 (1.2.3.4, 10, 4.3.2.1, 15, UDP) 155 3 (5.6.7.8, 20, 8.7.6.5, 30, TCP) 3050 3 (8.7.6.5, 30, 5.6.7.8, 30, TCP) 68 Packets 2 1 2 3 1 Reference Pointer to Packet 1 Pointer to Packet 4 Pointer to Packet 6 When the Trending/Indexing is Enabled, the Pilot Probe computes the corresponding Trending/Indexing data from the captured traffic. As seen in the above example, the Trending/Indexing data computed by the Pilot Probe contains aggregated “conversation” information for each second, namely, total bytes and total packets per unique conversation identifier. In addition, for each second the Trending/Indexing data contains a pointer into the Traffic Recording to the location of the first packet in the corresponding second. The benefit of this pointer into the Traffic Recording will be explained below. Shark Appliance User Manual Page 16 Note: This example is presented to give the reader a simplified view into how the Trending/Indexing data is computed. The actual implementation includes important additional fields and indices. End Example The Trending/Indexing data is all that is needed to compute many of the View metrics associated with the traffic stream. For example, Bandwidth Over Time, Network Usage By Traffic Type, IP Conversations, and Protocol Distribution are just a few of the Views that can take advantage of the existence of Trending/Indexing data. The Parameters Figure 14: Trending/Indexing Enabled Figure 15: Synchronized Trending Figure 16: Trending/Indexing Disabled Note: Trending/Indexing Enabled With the Trending/Indexing Enabled checkbox selected and the “Synchronize” checkbox not selected, the Keep on Disk parameters control the size and duration of the Conversation Index. o If the Days checkbox is selected, then the duration of the Trending/Indexing data is limited in duration by the number of days entered in the field o If the MB checkbox is selected, then the size in Mega Bytes of the Trending/Indexing data is bounded by the value in the MB field. NOTE. In this case, the duration of the Trending/Indexing data is set independently from the Packet Recording and is typically set to be much longer than the duration of the Packet Recording, especially since the Trending/Indexing data, in general, requires much less storage than the Packet Recording for the same duration. Synchronized Trending/Indexing When both Trending and Synchronize with Packet Recording are selected, then the duration of the Trending/Indexing data is kept synchronized with the duration of the corresponding Capture Job. No Trending/Indexing If the Trending/Indexing Enabled checkbox is not selected, then the Trending/Indexing data are not created for this Capture Job The Capture Job Recording is stored on the Shark Packet Recorder storage and the Trending/Indexing data are stored on the OS File System storage. Shark Appliance User Manual Page 17 Capture Job Control Buttons There are four buttons that are used to control a Capture Job. Buttons 2: Capture Job Control Buttons Start/Stop. If the Capture Job is running then the Stop can be used to stop the Capture Job. If the Capture Job is stopped, then the Start button can be used to start the Capture Job. When a Capture Job is stopped both the packet recording and the calculation of the Trending/Indexing data are stopped. Save. Once the parameters of a Capture Job have been edited, they need to be saved. Assuming the Capture Job is stopped, there are two ways to do this: (1) click on the Save button or (2) click on the Start button. In the first case, the Capture Job parameters are saved and the Capture Job remains stopped. In the latter case, the Capture Job parameters are saved and the Capture Job starts running. Clear. The Clear button removes all of the storage associated with the Capture Job. This includes the Packet Recording and the Trending/Indexing data storage. The Clear button should only be used when the Capture Job is in the Stopped state. Remove. The Remove button deletes the Capture Job from the Shark Appliance (this clears all of the Packet Recording and Trending/Indexing data storage) along with the corresponding Job Trace and Job Interface. The Remove button should only be used when the Capture Job is in the Stopped state. Figure 17: Managing a Capture Job In Figure 17 we show a configured Capture Job that is Capturing (it say “Job Running” in green). The Status fields indicate whether the Job is Capturing or Not. There are statistics regarding: Dumped (Captured) Packets, and Dropped Packets. These parameters are shown for the Last Second, Last Minute, and Last Hour. The Packet Capture Size gives the amount of storage currently used by the Capture Job. If the Job is Running and Trending/Indexing is Enabled, then so also is the computation of the Trending/Indexing data, otherwise the Trending/Indexing data calculation is also stopped. Capture Jobs in the Pilot Console Devices Panel Each Capture Job appears as a Job Interface in the Devices panel. Each Capture Job has an associate live interface which corresponds to the Capture Port of the Job. When a Capture Job is created, an icon (Icon 5) appears in the Devices panel representing the Job Shark Appliance User Manual Page 18 Interface. The name of the interface is the same as the name of the Capture Job. Figure 18 shows five Job Interfaces, namely, 4TB ForManual NoIndexing SynchronousForManual TrendingForManual Icon 5: Job Interface These interfaces behave as ordinary live traffic sources. The actual physical interface corresponds to the Capture Port setting in the corresponding Capture Job. Figure 18: Job Interface in Devices Panel Pilot Console Operations on Job Interfaces All of the operations that are available for live interfaces can be applied to a Capture Job Interface. Note: When drill down is applied to a “live view,” the new view shows results from the time the view was applied. Also, drill down cannot be applied to time selections in a live view. These limitations apply to the “live” Interfaces only. Capture Jobs in the Pilot Console Files Panel Icon 6: Jobs Repository Folder The Files Panel for a Shark Appliance contains a Jobs Repository Folder (Icon 6). The Jobs Repository folder contains a Job Trace for each Capture Job. The Job Trace has the same name as the Capture Job and represents the network traffic “recording.” Each Job Trace has an associated icon which represents the extent to which the Trending/Indexing data is available. Icon 7 denotes a Trending/Indexing data. Icon 8 denotes a Capture Job with Trending/Indexing Capture Job without Icon 7: Job Trace w/o Trending/Indexing Shark Appliance User Manual Page 19 enabled in which the Trending/Indexing data and the Job Trace packet recording durations are the same. Icon 8: Job Trace with Trending/Indexing Icon 9: Job Trace with Mixed Trending/Indexing Icon 9 denotes a Capture Job with Trending/Indexing enabled, but for which the duration of Trending/Indexing data duration is longer than the duration of the Job Trace recording. In Figure 19 we show the contents of the Jobs Repository folder in the Devices Panel. It contains five Job Traces. Capture Job “NoIndexing” has Trending/Indexing Disabled and the rest of the Capture Jobs have Trending/Indexing Enabled. The “SynchronousForManual” Capture Job has identical durations for the Job Trace and the Trending/Indexing data. Finally, the remaining 3 Capture Jobs have Trending/Indexing data durations which are longer than their corresponding Job Traces. Figure 19: Jobs Repository Folder in the Files Panel Pilot Console Operations on Job Traces – Trace Clips It is not unusual for a Job Trace to be multiple terabytes in size making direct operations impossible. In this section we show how we can easily manage and analyze these potentially massive network traffic recordings. Time intervals within a Job Trace are called Trace Clips and there are a number of simple and visually oriented ways in which Trace Clips can be created using the Pilot Console. Trace Clips do not require any additional storage and behave exactly like ordinary trace files. Icon 10: Trace Clip Icon 11: Trace Clip with Index Icon 12: Trace Clip with Trending Shark Appliance User Manual A Trace Clip identifies a time interval within a Job Trace. Trace Clips are found in the Files Panel and located under the corresponding Job Trace and are identified by the icon shown to the left Icon 10 shows the Trace Clip icon for a packetsonly trace clip. Icon 11 denotes a trace clip where both the Trending/Indexing data and the Packets are available. Icon 12 denotes a trace clip where the Trending/Indexing data are available but the packets are not necessarily available. In Figure 20 we show a Trace Clip named JLB_TraceClip for which there is no Trending/Indexing data available. Page 20 And in Figure 21 we show two trace clips that have associated Trending/Indexing data. In the next sections we will show how to create trace clips. Figure 20: Trace Clip for JLB Figure 21: Trace Clips with Trending and Indexes Creating Trace Clips There are two ways to bring up the Time Control panel for creating a Trace Clip. In Figure 22 we show the Job Trace named JLB. Clicking Figure 22: Creating a Trace Clip on the “plus” icon to the right of the name will bring up the Time Control panel shown in Right clicking on the Job Trace will brings up a context menu (Figure 23) with the Menu Item “Add Trace Clip.” Selecting this menu item will bring up the Time Control Panel. Figure 23: Add a Trace Clip Recall that a Trace Clip identifies a time interval within a Job Trace. If the clipboard contains a time interval, then the “Paste” menu item can be used to create a Trace Clip corresponding to the time interval on the clipboard. Time Control Panel for Creating Trace Clips In this section we show how to create trace clips. As we saw above, there are three possibilities: 1. Trace Clip with just packets and no Trending/Indexing data available throughout the time interval 2. Trace Clip with Trending/Indexing data and packets available throughout the time interval 3. Trace Clip during which Trending/Indexing data are available throughout the interval, but either some or no packets available in the interval Shark Appliance User Manual Page 21 Figure 24: Time Control Panel for Creating Trace Clips Figure 24 shows the Time Control panel for creating a Trace Clip which is essentially the process of selecting a time interval (time filter) and an optional filter (see the Browse Filters button in the upper-right side of the panel). The Trace Clip can be named using the Description text field. The rest of the options in the Time Control panel provide alternative ways of selecting a time interval and optional filter. Once the selections are made, clicking on “OK” will create a Trace Clip corresponding to the selections. There are multiple ways to create a Trace Clip using the Time Control Panel. Figure 25: Trace Clip Time Selection Selecting the Start Time for the trace clip (From) and either the absolute end time (To) or the duration of the Trace Clip from the Start Time is probably the most common way to create a Trace Clip (time interval) using the Time Control panel. The reason for this is that networking issues are most often identified by a particular onset time and duration. Another set of options use the multi-level zoom “scroll” bars to select a time interval. This has the advantage of making it clear whether the selected time interval contains “Packets only” or “Trending/Indexing data and Packets” or just “Trending/Indexing Data and no Packets.” Shark Appliance User Manual Page 22 Figure 26: Packets Only In all cases, the lower bar is a graphical representation of the duration of the Job Trace. In the case of packets plus Trending/Indexing data, the duration of the lower scroll bar is the maximum of the packet capture duration and the duration of the Trending/Indexing data. Below we show a series of images representing the various configurations of Packets and Trending/Indexing data. Figure 27: Packets Plus Trending/Indexing Data Figure 28: Packets Plus Trending/Indexing Data Figure 29: Trending/Indexing Data Only Figure 30: Combination of Trending/Indexing Data Only and Packets Plus Trending/Indexing Data Figure 31: Bring Up Filter Editor Shark Appliance User Manual Page 23 Lastly, In Figure 31 we show the “Browse Filters” button which brings up the Filter Editor for selecting a filter in addition to the time interval. In this way, the Trace Clip not only represents a time interval, but also contains a packet filter. It is important to select a filter that is compatible with the Trend Data. Figure 32: Filter Editor In Figure 32 we show the Filter Editor. Note that nearly all of the filters in the “factory” set are Trending/Indexing-compatible Pilot Filters. Using Time Selection to Create a Trace Clip Figure 33: Time Selection in a Strip Chart In Figure 33 we show a time selection in a strip chart. The strip char was obtained by applying the Bandwidth Over Time view to the JLB Job Interface. In Figure 34 we switch from the Devices Panel to the Files Panel where we see the corresponding JLB Job Trace. The trace clip was created by clicking and dragging the selected time interval (in the strip chart) over the Job Trace. This automatically created the Trace Clip shown below the JLB Job Trace. Notice that the Job Trace is over 30GB, but the Trace Clip is only 256MB. Shark Appliance User Manual Page 24 Figure 34: Time Selection Dragged Over Job Trace to Create a Trace Clip In Figure 35 we have applied the Bandwidth Over Time view to the Trace Clip below JLB. Notice the similarity to the view in Figure 34. Figure 35: View Applied to a Trace Clip Note: It is important to note that the view in Figure 34 has been obtained through the analysis of a live source while the view and Figure 35 was obtained by applying the same analysis to the packets saved in the Trace Clip. Trace Clips have all of the properties of ordinary trace files and can be analyzed using all of the capabilities of CACE Pilot. Shark Appliance User Manual Page 25 Using Views as Job Trace Indices The examples in the previous section show how to use a strip chart to locate time intervals of interest within a Job Trace and to easily create a Trace Clip for further analysis. This is a general technique whereby Views can be used as visual “indices” into a Job Trace. Figure 36: Visual Indices for a Job Trace Using Events to Create Trace Clips It is important to be able to easily locate an event in a Job Trace. This is easily accomplished by dragging the event in question over the Job Trace – a Trace Clip will be automatically containing traffic occurring before and after the event. This is illustrated below. Shark Appliance User Manual Page 26 Figure 37: Event List In Figure 37 we show the Event List and a particular event (4124) that has been highlighted both in the Event List and on the Strip Chart. The events were created using a Watch on the live traffic corresponding to the JLB Capture Job. Creating a Trace Clip around the (temporal) location of the event is as easy as dragging the event from the Event List to the JLB Job Trace. Dragging Event 4124 from the Event List and dropping it on the JLB Job Trace brings up the Time Control panel for creating the Trace Clip. See Figure 38. Figure 38: Creating a Trace Clip from an Event The Time Control panel can be used to enlarge or shrink the time interval of the Trace Clip around the event. The Trace Clip is shown in Figure 39. Shark Appliance User Manual Page 27 Figure 39: Trace Clip Corresponding to an Event Export Job Packets The Export tab takes us to the page shown in Figure 40. This page can be used to export packets from a Capture Job. The Job to Report field is a drop-down list with an entry for each Capture Job. The Export Parameters fields are used to select a time interval within the Capture Job, similar to creating a Trace Clip. Figure 40: Export Job Packets Once the parameters are chosen, clicking on the Apply button creates a link that can be used to export the packets. Clicking on the Apply Button does not start the download, but rather creates a link that can be used to start the download. An example link is shown outlined in red in Figure 41. Shark Appliance User Manual Page 28 Figure 41: Link To Export Packets Clicking on the Export link brings up the Open/Save panel (See Figure 42). Selecting “Save” will bring up a file browser on the local machine (where the Pilot Console is running) to select the location of the exported packets. If “Open” is selected, Wireshark will open on the local machine and the exported packets will be opened with Wireshark. Figure 42: Open or Save Packets to be Exported Shark Appliance User Manual Page 29 User Management Shark Appliance Credential Manager User and Group Access Control All communications between the Shark Appliances and the Pilot Console use SSL-encrypted Web communications and require that each request from a Pilot Console contains HTTP basic access authentication credentials (HTTP Authentication). The Shark Appliance passes the authentication credentials to the Shark Appliance’s Credential Manager. The Credential Manager determines if the user has a “privilege” that permits the execution of the requested operation. If the Credential Manager rejects the operation, the Shark Appliance returns the “not enough privileges” error to the Pilot Console making the request. Otherwise the Shark Appliance executes the operation. Credential Manager The Credential Manager associated with a Shark Appliance is governed by the User configuration file colocated with the Shark Appliance. A user can be part of one or more groups. Each user can “own” a set of resources: for example, the files or the folders that he has created, or the views that he has applied. Unless he is an administrator, a user has visibility and control only on his resources: A user cannot see a file or a view created by another user. A user cannot close a view or to delete a file that have been created by somebody else. Resources, however, can be shared. Members of a group normally share a common folder that has the same name of the group. This folder can be use for trace file sharing, and all the users in the group have read and write access to the folder. When you drag a file into this folder, all the other member of the group will immediately see it and will be able to manipulate it. Views can be shared with single users or groups by right-clicking on them and selecting “share with”. As soon as a view is shared, the selected user or group will immediately see it in their sources panel. User and groups are configured by editing the User configuration file in the Pilot Console folder. Privileges The User Configuration file is used to configure the privileges for users and groups. A privilege is a capability that can be granted or revoked, and is specified as an attribute of the User or Group tag in the users file. The privileges that the Shark Appliance currently implements are: IsAdministrator: if set to true, gives a user or a group full access Shark Appliance. Administrators see all the resources in the system, including views, files and folders that have been created by other users. Administrators have full control on all these resources. CanApplyViewsOnFiles: if set to true, allows the user or the group to apply views to files residing on the Shark Appliance. CanApplyViewsOnInterfaces: if set to true, allows the user or the group to apply views to the network interfaces on the Shark Appliance. CanCreateFiles: if set to true, the user or the group can create files on the Shark Appliance, by selecting the “send to file” buttons in the Pilot Console. CanImportFiles: if set to true, the user can import files into the Shark Appliance, through drag and drop or by clicking on the “Import Files Into Shark Appliance” button in the Remote ribbon. Shark Appliance User Manual Page 30 CanExportFiles: if set to true, allows the user to export files from the Shark Appliance, and move them to the Pilot Console or to another Shark Appliance (assuming the user has sufficient privilege on the target Shark Appliance to create a trace file). When this privilege is not granted, the user is not able to export a trace file to Wireshark, because that involves exporting packets out of the Shark Appliance to the Pilot Console. CanShareViews: if set to true, the user can share the views that he created on the Shark Appliance with other users or groups connected to the Shark Appliance from other Consoles. CanAccessProbeFiles: if set to true, the user will be able to “see” the trace files located on the Shark Appliance. HasFolder: if set, Shark Appliance creates a shared folder for the group with the name of the group (only applies to groups). All the users in the group will have access to this folder. Otherwise, the folder will not be visible to the members of the group. Privilege Policy Since both users and groups can be granted or revoked roles, and since a user can be part of one or more groups, conflicts can arise between the user roles and the groups roles. The Shark Appliance solves conflicts through the following rules: Granting or revoking a role to the user has precedence over granting or revoking it to the groups the user is part of. In other words, if a role is present (both as true or false) under the user tag in the users file, the fact that the same role is present for any of the groups the user is part of is ignored. If a role is not set for a user, it is inherited from the groups it is part of. If different groups have conflicting roles, the highest privilege is assigned to the user. Shark Appliance User Manual Page 31 Shark Appliance Web Management Interface User Management The Shark Appliance Management Interface’s User Management menu item has two submenus: View User/Group Accounts and Add Users/Groups. View Users/Groups Figure 43: View Shark Appliance Usesr/Groups The View Users /Groups page lists all of the user accounts and all of the User Groups. For each user there is an indication of whether the user has the Admin privilege level and the group to which the user belongs. Each Group has a description and a list of privileges associated with the group. Users belonging to a Group assume the Group privileges. Users and Groups can be removed by putting a check in the check box and clicking on Remove Selected Users (Groups). Shark Appliance User Manual Page 32 Add Users/Groups Figure 44: Add Users/Groups Adding a User is accomplished by providing the User Name and Password and then clicking on Add User. Similarly, a Group can be added by providing a Group Name, Group Description, clicking on the privileges to be associated with the Group, and then clicking on Add Group. Shark Appliance User Manual Page 33 Capture Board Setup Figure 45: TurboCap Board Setup The Capture Board Setup menu item takes you to the page(s) for setting up the TurboCap Board(s). Shark Appliance User Manual Page 34 Port/Protocol Definition Port/Protocol Names The Port/Protocol Definitions section can be used to have the Shark Probe identify user or application protocols when parsing packets. Non-standard port/protocols appear as “other” in many Views. This provides the user the opportunity to introduce new meanings for port/protocol pairs. Note: Be very careful to add port/protocol definitions sorted by port number and to adhere to the file’s format. Figure 46: Edit Port/Protocol Names Shark Appliance User Manual Page 35 Port/Protocol Groups Figure 47: Edit Port/Protocol Group Names The file shown in Figure 47 assigns names to certain groups or port/protocols. These definitions are useful in grouping port/protocols into categories such as Email, Web, etc. The user can either add a private port/protocol to an existing group or add his own port/protocol group. Logs Shark Probe Logs The Shark Probe log is used by CACE Technologies customer support to diagnose Shark Appliance issues. Shark Packet Recorder Logs The Shark Packet Recorder log is used by CACE Technologies customer support to diagnose problems with the Shark Packet Recorder. Shark Appliance User Manual Page 36 Shark Probe Configuration File Figure 48: Shark Probe Configuration File The Shark Probe Configuration file is best used by CACE Technologies support personnel. Logout Logs off the Web Management interface of the Shark Appliance. Shark Appliance User Manual Page 37