1
Simulator
User’s Manual
Version: 2.0
Copyright © 2003-2008 AnaliteX
Visit our web-page at: www.analitex.com
June 2008
2
1-2 Contents
Contents
________________________________________________
1.
2.
Installation................................................................................................................ 1-1
User interface ........................................................................................................... 2-1
2.1. What can we do using Simulator? ..................................................................... 2-1
2.2. Loading the structural information .................................................................... 2-2
2.3. Toolbars ............................................................................................................. 2-3
2.4. Multislice toolbar buttons description ............................................................... 2-4
2.5. Working with the image toolbar........................................................................ 2-5
2.6. Palette control .................................................................................................... 2-6
3. Docking panes .......................................................................................................... 3-7
3.1. Microscope docking pane.................................................................................. 3-7
3.2. Contrast Transfer Function (CTF) docking pane .............................................. 3-8
3.3. Diffraction docking pane ................................................................................... 3-9
4. Contrast Transfer Function view ........................................................................... 4-10
5. Multislice settings .................................................................................................. 5-11
5.1. Zone Axis settings ........................................................................................... 5-11
5.2. Imaging............................................................................................................ 5-13
5.2.1. Defocus .................................................................................................... 5-13
5.2.2. Aperture ................................................................................................... 5-13
5.2.3. Linear imaging ......................................................................................... 5-14
5.2.4. Non-linear imaging for partially coherent and incoherent illuminations. 5-14
5.3. Objective lens setup ........................................................................................ 5-15
5.4. Pendellösung plots........................................................................................... 5-15
6. Multislice calculations ........................................................................................... 6-16
6.1. Cautions........................................................................................................... 6-16
7. Reviewing the calculation results ............................................................................ 7-1
7.1. Adjacent cells .................................................................................................... 7-1
7.2. Exploring projected potential ............................................................................ 7-2
7.3. Exploring the exit wave function ...................................................................... 7-3
7.4. Exploring HREM images .................................................................................. 7-4
7.5. Montage mode ................................................................................................... 7-5
7.6. Exploring diffraction ......................................................................................... 7-6
8. Working with non-crystalline objects ...................................................................... 8-1
9. Simulator: Reciprocal space viewer......................................................................... 9-1
9.1. The Reciprocal space viewer toolbar ................................................................ 9-2
9.2. The Preferences menu ....................................................................................... 9-5
9.3. Working side pane dialog bars. ......................................................................... 9-6
9.3.1. The Diffraction dialog pane ....................................................................... 9-6
9.3.2. The Kikuchi dialog pane ............................................................................ 9-8
9.3.3. The Precession dialog pane........................................................................ 9-9
9.4. Simulating Precession Patterns ....................................................................... 9-11
9.5. Symmetry determination from precession patterns ......................................... 9-12
9.6. Precession electron diffraction pattern of Mayenite along [111]: ................... 9-12
10.
References ........................................................................................................... 10-1
1-2
1-1 Installation
_______________________________________________________________________
Simulator is part of the eMap & Simulator suite of programs for advanced calculations in
electron crystallography.
1. Installation
Simulator runs under Windows ® 2000, XP and Vista. About 65MB of hard disk
space is needed for the whole package (eMap and Simulator) programs.
NOTE: Windows ® 2000 users may need to install Windows Installer 3.1
(available on the CD). The latest redistributable version of Windows Installer is available
from the www.microsoft.com web site or from the installation CD (file:
WindowsInstaller-XXXXXX.exe). Both eMap and Simulator require MSXML (Microsoft
XML engine). The redistributable of MSXML is available from the installation CD (file:
msxml.msi) or from www.microsoft.com.
If you have an old version of eMap/Simulator you must deinstall that first, before
installing a new version.
Install the program by clicking on Setup.exe
located in the directory
eMap on the CD. The program will ask you to choose destination location, the default is
C:\Program Files\AnaliTEX\eMap. Use Browse if you want to put the program in
another directory, or on another drive. When the directory and drive are as required, click
Next. Then you will be asked to select program folders under which eMap is run from the
Start menu. Select the program folder (default = eMap) and click on Finish.
Copy the manual (Multislice simulator 1.0 manual.pdf) from the directory eMap
on the CD into the directory to where eMap.exe is located.
1-1
2-1 Contrast Transfer Function view
_______________________________________________________________________
2. User interface
The Multislice Simulator as any other processing module can be started from the
Start page by clicking on the Dynamical simulation link. NOTE: This page will only
appear if the MS Internet Explorer is installed. In case eMap will fail to locate the
Internet Explorer then the simplified Installed components dialog will appear.
2.1.
What can we do using Simulator?
Simulator provides you with a great possibility of calculating and displaying
different types of information needed in the area of Transmission Electron Microscopy
(TEM). The following set demonstrates some of the features that Simulator offers:
•
Projected potential;
•
Exit wave function;
•
Electron Diffraction (ED) patterns;
•
High Resolution Electron Microscopy (HREM) images.
2-1
2-2 Contrast Transfer Function view
_______________________________________________________________________
2.2.
Loading the structural information
The most commonly used file formats are available to you in the Simulator. You
can open PDB, CIF, INS, and XYZ formatted files, plus an XML formatted file used by
Simulator to store the structural information as well as calculation settings.
Simulator will start with an empty page if you click on the Dynamical
simulations link on the Start page. In this case you should open your file with structural
information. If you can find the file you previously opened on the Start page then you
can open it directly in Simulator by clicking on the file name in the Recent files column
of the Start page. In this case Simulator will load and display the crystal structure read
from your file.
2-2
2-3 Contrast Transfer Function view
_______________________________________________________________________
Open the file Mayenite-ICSD-6287.cif and you will see this:
2.3.
Toolbars
The following two toolbars are available when Simulator starts: Multislice
toolbar and Image properties toolbar. If you observing an electron diffraction pattern
then the third toolbar becomes visible (Reciprocal space viewer, see Reciprocal space
viewer Chapter 9 for details).
If no previously calculated data is available, then the Multislice toolbar will have
the following appearance
Some of the buttons are disabled.
Some buttons become available only after some calculations have been done.
These buttons are also available when you save your calculation data on the disk. In this
case Simulator checks these files during start and loads the corresponding data from disk.
Most of the buttons are enabled.
2-3
2-4 Contrast Transfer Function view
_______________________________________________________________________
2.4.
Multislice toolbar buttons description
Calculation button (Run). Performs the multislice calculation with given
settings (see chapter 6).
Change settings button. Modify most of the multislice settings here (see
chapter 5).
Contrast Transfer Function (CTF) view. Modify some settings of CTF and
observe the CTF curve in real time for the selected microscope (see chapter
4).
Projected potential view. Observe the calculated projected potential (see
section 7.2).
Exit wave function view. Observe the calculated exit wave functions for
selected thickness values (see section 7.3).
High resolution electron microscopy (HREM) image. Observe the calculated
HREM images for selected thickness and defocus values (see section 7.4).
Electron diffraction pattern. Observe the calculated electron diffraction
patterns based on the calculated Exit wave functions for selected thickness
values (see section 7.6).
Crystal structure view (for current zone axis only). See the structure from the
present direction (zone axis).
Microscopes docking pane. Specify the electron microscope to be used in the
simulation (see section 3.1).
Adjacent cells dialog. Select the required number of adjacent unit cells (see
section 7.1).
2-4
2-5 Contrast Transfer Function view
_______________________________________________________________________
2.5.
Working with the image toolbar
The second available toolbar in Simulator allows working with calculated images.
See Chapter 7 for full details.
Standard arrow pointer.
Magnifying glass – zooming in and out
Zooming in is done using the Magnifying glass on the toolbar and then clicking
anywhere within the image.
NOTE: the cursor will change from standard to the magnifying glass with a
‘+’ symbol inside.
Zooming out can be done using the same toolbar button and holding the CTRL
keyboard button while pressing the left mouse button within the view.
NOTE: the cursor will change from standard to the magnifying glass with a
‘–’ symbol inside.
Grayscale palette. Sets the colors of the current image view into grayscale.
Color palette. Sets the color palette of the current image view.
Resets the palette sliders into their initial positions.
Provides the possibility to modify the color palette. NOTE: not available in the
current release of the Simulator.
2-5
2-6 Contrast Transfer Function view
_______________________________________________________________________
2.6.
Palette control
There is a special palette control available in any of the image view modes. This
control helps in modifying the brightness and contrast values of all images in the current
view. Visible in Projected potential (Chapter 7.2), Exit wave function (Chapter 7.3) and
HREM image views (Chapter 7.4).
The following 3 screenshots show the way of changing the brightness and contrast
by dragging one of 3 sliders on the left side of the control. The slider in the middle
remains equidistant from the upper and lower sliders when dragging one of these two
sliders. During dragging the middle slider, the program tries to keep distances to upper
and lower sliders equal (except in the cases when upper slider reaches the upper bound
and then remains at the same position or when the lower slider reaches the bottom bound
and then remains at the same position).
Neutral positions of palette
sliders.
Dragging the upper slider
down.
2-6
Dragging the bottom slider
up.
3-7 Contrast Transfer Function view
_______________________________________________________________________
3. Docking panes
This chapter describes the available Docking panes
.
They can be used when simulating HRTEM images and electron diffraction patterns, as
described in Chapter 4.
3.1.
Microscope docking pane
This pane is designed to work with microscopes.
The user can:
• Browse microscopes in the Tree control;
• Edit selected microscope parameters;
• Create a new microscope with specified
parameters;
• Save the existing updates.
3-7
3-8 Contrast Transfer Function view
_______________________________________________________________________
3.2.
Contrast Transfer Function (CTF) docking pane
This pane is designed to work with the
parameters of the Contrast Transfer Function
(CTF). The user can:
•
•
•
•
•
Change the defocus value by dragging
the Defocus slider;
Manually edit the defocus value by
typing in the edit box under the Defocus
slider. In order to apply changes, the
user must do a mouse-click outside the
edit box. The defocus values are in [nm];
Change the convergence angle value by
dragging the Convergence slider;
Show/hide the Chromatic and Spatial
Envelopes by marking/unmarking the
corresponding check boxes;
Set the defocus value to the Scherzer
defocus by pressing the Scherzer
button.
All changes will be applied to the CTF plot in
run-time (see section 4). However, they will not
affect the image simulations.
3-8
3-9 Contrast Transfer Function view
_______________________________________________________________________
3.3.
Diffraction docking pane
This pane is designed to work with the
parameters of the simulated electron diffraction
pattern. The user can:
•
•
•
•
•
3-9
Draw/hide the hkl-indices and text
annotations on the diffraction pattern
view by marking/unmarking the
corresponding check boxes;
Change the convergence angle (the spot
size, in mrad);
Change the threshold values of
reflections to be shown on the
diffraction pattern view;
Change the thickness of the diffraction
pattern to be shown. Only diffraction
patterns at specified thickness are
available (see Thickness in the Zone
Axis property page, section 5-11);
Manually edit the convergence angle,
reflection threshold and thickness values
by typing into the corresponding edit
boxes under the sliders. In order to apply
changes, the user must do a mouse-click
outside the edit box. In case the
manually modified Thickness value
doesn’t correspond to any specified
thickness values, the diffraction pattern
at closest calculated thickness will be
shown.
4-10 Contrast Transfer Function view
_______________________________________________________________________
4. Contrast Transfer Function view
The user can observe the Contrast Transfer Function (CTF) and modify the main
parameters of the CTF in real time for the selected microscope, using
3-2 for the details on the properties of the CTF docking pane.
4-10
. See section
5-11 Multislice calculations
_______________________________________________________________________
5. Multislice settings
This chapter explains the basic settings, which the user can change in order to
achieve the required results, using the multislice method implemented in the Multislice
Simulator. The dialog with all available settings can be opened using the Settings
button on the Multislice toolbar (see section 2-4). The
should be activated
(default when entering the
5.1.
).
Zone Axis settings
This property page can be used for modifying the basic settings of the multislice
calculator related to the crystal direction. Among them are:
•
The Zone Axis – can be changed using 3 indices u, v and w;
•
The reciprocal resolution g-max – limits the total number of beams to be
used in the calculations (in reciprocal Ångströms, Å–1); g-max 2
corresponds to a maximal resolution of 0.5 Å.
•
The number of slices to split the unit cell along the projection direction.
Simulator calculates the translation vector along the projection direction
and suggests the number of slices per unit cell so that the slice thickness is
~ 1 Å. The user can modify this number. However, some factors should be
considered when choosing other values (see section 6-16 for more details);
•
The Thickness range (start and end values) and the step between the
bounding values;
•
Beam tilt off from the specified zone axis can be set through the Laue
circle position by changing the h and k values (can be real numbers) along
corresponding 2D axes in reciprocal space. The configuration without any
beam tilt corresponds to (00) for h and k.
5-11
5-12 Multislice calculations
_______________________________________________________________________
The calculations results will be saved for future use only if the specified check
boxes (for example Save potential) will be marked. The files with calculation results will
be deleted after closing Simulator.
Only images and diffraction patterns for specified thickness values can be shown
after the calculations are done. In case with Thickness start = 20 Å, step = 20 Å and
end = 100 Å only 5 exit wave functions, 5 electron diffraction patterns and at least 5 rows
of HREM images (number of those within each row depends on the number of the
specified defocus values) will be stored for reviewing. The corresponding 5 thickness
values are 20 Å, 40 Å, 60 Å, 80 Å and 100 Å. The diffraction patterns can only be shown
one by one (see Chapter 7.6), while the others can all be seen in Montage mode (see
Chapter 7.5), i.e. all at the same time.
NOTE: The use of absorption during the structure factors calculation is not
available in the current version of Simulator.
The slicing scheme used in the current version of Simulator assumes that if the
cell extension in the projection direction is larger than 20Å, the user should consider
using the 3D potential. In this case a WARNING will appear as this:
NOTE: the 3D potential calculations are not available in the current version of
Simulator.
5-12
5-13 Multislice calculations
_______________________________________________________________________
5.2.
Imaging
The Imaging property page allows the user to control the settings for the HREM
images during the multislice calculations. Click on settings
and then
.
5.2.1. Defocus
The defocus range can be assigned by selecting the starting point (start), the
finish (end) and the step between start and end. If only one defocus value should be
calculated then the start value must be equal to the end value. If the step is set to 0 and
the start is different from the end, then only 2 defocus values will be calculated.
The Save HREM check box sets the flag that indicates if the calculated HREM
images should be saved in the corresponding files for later use.
5.2.2. Aperture
The aperture radius value is in reciprocal Ångström (Å–1). It is possible to
specify the centre of the aperture by changing the centre h and k values. NOTE: These
values can be real. The (00) setting corresponds to the aligned aperture position.
5-13
5-14 Multislice calculations
_______________________________________________________________________
5.2.3. Linear imaging
Finite energy spread envelope function Ec (chromatic aberration envelope):
1
2
E c (u ) = exp − (πλδ ) u 4
2
where δ is the defocus spread.
Finite size of the electron source Es (spatial coherence envelope):
{
2
[
E s (u , ∆f ) = exp − (πs 0 λ ) u 2 ∆f + C s λ2 u 2
]}
2
where ∆f is the defocus value, s0 is the convergence angle, Cs is the spherical aberration.
Perfectly coherent illumination transfer function
T (u , ∆f ) = A(u ) exp[− iχ (u , ∆f )]E s (u , ∆f )E c (u )
Scherzer defocus
∆f Scherzer = −1.2 C s λ
Lichte defocus
∆f Lichte = −0.75C s (u max λ )
2
where umax is the maximum transmitted spatial frequency.
5.2.4. Non-linear imaging for partially coherent and incoherent
illuminations
Takes place in case when we need to take into account the effects associated with
the finite size of the electron source (beam divergence effects) and fluctuations of
defocus spread (due to the energy spread of the electron source or instabilities of the
objective lens current). In this case the spatial extent of the electron source is large and
the image can be considered as incoherent when formed with different defocus and with
electrons emitted from different positions on the electron source. The resulting image is
given by the average of the set of images formed for all angles of incidence and defocus
values.
NOTE: The non-linear imaging will be used when TCC is selected in the
Imaging property page.
5-14
5-15 Multislice calculations
_______________________________________________________________________
5.3.
Objective lens setup
NOTE: Both 2-fold and 3-fold astigmatisms and coma are available only for the
Linear imaging in the current version of Simulator. After
5.4.
click on
.
Pendellösung plots
The user can specify the beam(s) the amplitudes and phases of which should be
kept during the multislice calculations for every calculated slice. In this case the
information will be stored in the file Pendellosung-XXXX.dat in the same folder as the
loaded structure file. After
click on
The reflections can be defined in two different ways:
• Defining 3D Miller indices of the reflections by filling in the left 3 boxes
with h, k and l indices. In this case the 3D indices should fit the zone axis
equation hu + kv + lw = 0.
• Defining 2D plane indices in the local axes (h’,k’).
The transition between indices is possible using <= and => buttons. Indices can be
Added, Removed and Updated using corresponding buttons. The data can be viewed
using Excell. The format is thickness, Amplitude, Phase (and further pairs of Amplitude,
Phase, if more than one beam has been selected). Can be viewed using Excel.
5-15
6-16 Multislice calculations
_______________________________________________________________________
6. Multislice calculations
The multislice calculations will start after pressing the Run button
section 2-4). The following progress dialog will be shown:
(see
If you are working with the same structure file and are trying to repeat the same
calculations or calculations with modified settings, then Simulator will ask if you would
like to clean up, e.g. by removing files generated by previous Run. In this case Simulator
will come up with the following question:
In case of pressing the Cancel button the calculations will be terminated.
Simulator will try to use the data left from any available previous calculations.
6.1.
Cautions
The major error source in the multislice calculations is the slice thickness ([1] and
[2]). The upper limit of the slice thickness can be estimated as ∆z < 2∆r 2 / λ where ∆r is
the distance within which the potential doesn’t change appreciably. In case of 300 kV
electrons and ∆r = 0.1 Å we have ∆z < 1 Å. An acceptable accuracy is typically achieved
when the slice thickness is chosen as the radius of an atom, i.e. 1-2 Å.
Artificial HOLZ reflections may appear in case the slice thickness is too big or if
the resolution is too high.
6-16
6-17 Multislice calculations
_______________________________________________________________________
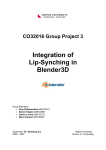
MgO [001] simulated electron diffraction pattern. The contrast of the diffraction pattern
to the right is enhanced with respect to the left pattern. The HOLZ rings can be clearly
observed. The slice thickness was too big and the selected resolution was too high. This
led to the leak of some intensity from ZOLZ into HOLZ which is incorrect in this case.
6-17
7-1 Reviewing the calculation results
_______________________________________________________________________
7. Reviewing the calculation results
This chapter explains how to inspect the results of calculations using different
viewing options. They are activated using any of the options
7.1.
.
Adjacent cells
The user can create a view with several cells adjacent one to the other. Default
value is 1x1 (single cell). In order to modify the number of adjacent cells, the user should
click on the Adjacent cells button on the Multislice toolbar (see section 2-4). The
following dialog will appear. Using the mouse, one can choose the required number of
cells in both x- and y-directions by holding the left mouse button and moving it across the
dialog box. In this case the number of adjacent cells changes dynamically and will be
accepted when the user releases the left mouse button. The other way of choosing the
number of adjacent cells is by clicking within the corresponding square in the Adjacent
cells dialog box.
The Adjacent cells dialog with 3x3 cells selected.
7-1
7-2 Reviewing the calculation results
_______________________________________________________________________
7.2.
Exploring projected potential
The Projected potential mode can be selected, by
toolbar (see section 2-4). A single image will always be shown.
7-2
from the Multislice
7-3 Reviewing the calculation results
_______________________________________________________________________
7.3.
Exploring the exit wave function
The Exit wave function mode can be selected by
from the Multislice
toolbar (see section 2-4). The thickness dependence of the exit wave function is
represented vertically starting from the smallest calculated thickness (top) and finishing
with the highest thickness (bottom). The user can lower the magnification or use the
scroll bars on the sides of the window in order to see all the simulated HREM images.
The exit wave functions will be displayed only for specified thickness values. A set of
images will be shown, if you have specified a range of focus values, so-called Montage
mode (see Chapter 7.5).
7-3
7-4 Reviewing the calculation results
_______________________________________________________________________
7.4.
Exploring HREM images
The HREM images mode can be selected by
from the Multislice toolbar
(see section 2-4). The thickness dependence of the HREM images is represented
vertically starting from the smallest calculated thickness (top) and finishing with the
highest thickness (bottom). The defocus dependence of the HREM images is represented
horizontally starting from the smallest calculated defocus (left) and finishing with the
highest defocus value (right). The user can demagnify (by holding down CTRL while leftclicking the mouse) or use the scroll bars on the sides of the window in order to see all
the simulated HREM images. The HREM images for the specified thickness and defocus
values will be displayed, in montage mode (see 7.5).
7-4
7-5 Reviewing the calculation results
_______________________________________________________________________
7.5.
Montage mode
Simulator provides the montage mode to help the user to observe more than one
simulated image at the same time. You can use the Magnifying glass to Zoom in and out
in order to see more simulated images (see section 2-5 for details on Magnifying glass).
7-5
7-6 Reviewing the calculation results
_______________________________________________________________________
7.6.
Exploring diffraction
The Electron diffraction patterns mode can be selected from the Multislice toolbar (see
section 2-4). Use the thickness slider on the Diffraction pane in order to select the
calculated electron diffraction pattern at the required thickness. Shown one by one.
Mayenite electron diffraction patterns. Thickness 20 Å (above) and 100 Å (below).
If you specified 5 thickness values in
then there will be 5 thickness values available here.
7-6
(see Chapter 5.1),
8-1 Working with non-crystalline objects
_______________________________________________________________________
8. Working with non-crystalline objects
Simulator is capable to simulate HREM images and electron diffraction patterns
for non-crystalline objects and nano-materials. This chapter presents an example of
simulations of 7-shell gold nanoparticle.
HREM image for defocus –700 Å.
8-1
8-2 Working with non-crystalline objects
_______________________________________________________________________
7-shells Au nanoparticle electron diffraction pattern.
Default settings in the Diffraction docking pane.
8-2
8-3 Working with non-crystalline objects
_______________________________________________________________________
7-shells Au nanoparticle electron diffraction pattern.
The Reflections threshold was manually changed to 0.0025.
8-3
Simulator: Reciprocal Space Viewer
_______________________________________________________________________
Simulator: Reciprocal Space Viewer
8-1
9-1 Simulator: Reciprocal space viewer
_______________________________________________________________________
9. Simulator: Reciprocal space viewer
The reciprocal space viewer module is designed for the visualization of reciprocal
space. If you have just been running multi-slice simulations, it is best to close down and
restart eMap – else the Diffraction panes (seen to the right of the figure below) will not
icon and then open a file by
be displayed. Click on the
C:/Program files/Analitex/eMap/Examples/mayenite.hkl
9-1
, for example:
9-2 Simulator: Reciprocal space viewer
_______________________________________________________________________
9.1.
The Reciprocal space viewer toolbar
These icons give direct access to many of the functions available under
The normal mouse pointer for picking reflections on the diffraction pattern.
Placing the mouse pointer over any reflection (high-lighted in yellow) on the
main view will display the corresponding reflection information in the rightbottom corner of the view. This information includes the hkl Miller indices
of the reflections, the d-value in Ångströms, the |Fhkl| amplitude of the
reflection, the crystal structure phase and the kinematical Intensity (usually
|Fhkl|2). Placing the mouse pointer over squared points on the Stereographical
projection view (see section 9.3.1 for details) and then pressing
display the corresponding direction/zone axis;
will
Free rotation tool (around x/y axes) for navigation in reciprocal space.
Directly related to the rotation of the
crystal in an X-ray diffractometer or
an electron microscope. In order to
get the correct results, the Ewald
sphere toolbar button
should be
switched ON (see below, page 9.4).
In-plane rotation of the
diffraction pattern around
the z-axis which always
points into the screen.
Useful when comparing
with
an
experimental
diffraction pattern.
Rotation about vertical
and horizontal axes.
9-2
9-3 Simulator: Reciprocal space viewer
_______________________________________________________________________
Mouse zooming
Clicking
and
holding the left
mouse button on
any point on the
main view will fix
the
starting
reference point for
the zooming.
The left mouse button should be pressed and held down during the whole
zooming procedure. Releasing the left mouse button will stop the zooming.
Moving the mouse towards the centre of the diffraction pattern from the
starting point will zoom down the diffraction pattern, while moving away
from the centre will zoom up;
Spot amplitudes mode – Can be F (structure factor amplitudes) or (default)
F2 (squared structure factor amplitudes).
Switches ON/OFF the displaying of the in-plane axes.
Switches ON/OFF the displaying of the resolution circles.
Spot visualization mode. Clicking on the arrow
will bring up an extra
small toolbar where the user can choose the corresponding mode:
3 different visualization modes are available: 1) solid spot
mode 2) Gaussian shape grayscale mode and 3) disk mode.
9-3
9-4 Simulator: Reciprocal space viewer
_______________________________________________________________________
Switches ON/OFF the coloring of reflections. If the button is ON, then all
reflections will be colored according their crystallographic phases.
Red color corresponds to close to 0°; blue close
to 180°, yellow close to 270° and green close to
90°. Default is OFF. Centrosymmetric
projections will only show red and blue
reflections.
Note: Coloring is available for solid spot and
disk mode only, i.e.not the middle one of the
three options:
.
Switches ON/OFF taking the Ewald sphere into account. If the Ewald sphere
is in the OFF mode the High Order Laue Zone (HOLZ) reflections cannot be
observed, but on the other hand all reflections as far out as they have been
calculated are seen for the zero order Laue zone (ZOLZ)
Ewald sphere: OFF: only ZOLZ is seen. Ewald sphere ON: ZOLZ & HOLZ
Specifies the current zone axis indices
Shows the dialog box where the user can
specify the radii of the visible resolution
circles.
9-4
9-5 Simulator: Reciprocal space viewer
_______________________________________________________________________
9.2.
The Preferences menu
In addition to the functions of the Reciprocal
Space Viewer toolbar (described above), several other
diffraction type visualization modes are available
through the Preferences of the main menu. These modes
are:
•
Regular 2D diffraction mode
(default). Can be controlled using the
Diffraction pane (see 9.3.1);
•
Kikuchi lines. Can be controlled using the
Kikuchi pane (see 9.3.2);
•
Rotation mode and Rotation animation; In
rotation mode, the electron beam is rocked back
and forth in one direction, or equivalently, the
sample is tilted back and forth in that direction.
It is fixed to the range [-1ºto +1º], with 30
steps.
•
Precession mode and Precession animation.
Can be controlled using the Precession pane
(see 9.3.3).
Set scale
allows you to
scale the simulated diffraction pattern exactly.
9-5
9-6 Simulator: Reciprocal space viewer
_______________________________________________________________________
9.3.
Working side pane dialog bars.
The Reciprocal space viewer offers 3 pane dialog bars on the right side (default)
of the main view. These bars can be re-attached to any side of the current view or the
main window (left or right sides are preferable due to the vertical nature of the dialog bar
items placement). Any dialog pane can be closed or hidden any time by using the 2
buttons
in the right top corner of the bar.
9.3.1. The Diffraction dialog pane
The Diffraction dialog pane allows the user to
control the current zone axis indices, the
Stereographic projection view, show/hide the hkl
Miller indices for all reflections, show/hide the
annotation text, change some parameters of the
diffraction pattern such as the beam convergence
angle, the voltage (electron diffraction) and the
thickness (electron diffraction).
When you move around over the stereographic
projection, the index at the bottom left gives the
nearest Miller indices. Left-click and the
stereographic projection will be reoriented, with
that zone axis [given at upper left] at its center.
Press
and Simulator will display the
electron diffraction pattern along that zone axis:
The Diffraction dialog pane.
9-6
9-7 Simulator: Reciprocal space viewer
_______________________________________________________________________
does just that:
toggles on/off all
the descriptive text on the screen:
,
etc.
9-7
9-8 Simulator: Reciprocal space viewer
_______________________________________________________________________
9.3.2. The Kikuchi dialog pane
Kikuchi lines are useful for crystals with small unit
cells, i.e. < 8 Å or so.
…
The Kikuchi dialog pane allows the user to control
the disk size (convergence angle), the threshold for
Kikuchi lines and HOLZ lines visualization mode.
Checking the HOLZ lines will show the central disk
(000-spot) enlarged. NOTE: in order to observe the
HOLZ lines in the 000-disk the following three rules
should be satisfied:
1. The Ewald sphere should be switched ON, i.e.
with the frame around it.
2. The calculated diffraction pattern should contain
enough spots (enough resolution) so that the
Ewald sphere can reach the upper reciprocal
layers;
Above: Kikuchi dialog pane.
3. The value in the Max HOLZ index should be
greater than or equal to 0 (default is 0).
Below: Central beam (highly
Checking/unchecking the HOLZ shift will switch
ON/OFF the dynamical correction in the calculations
of the HOLZ lines positions within the 000-disk which
leads to the so-called HOLZ lines shift.
magnified using
9-8
9-9 Simulator: Reciprocal space viewer
_______________________________________________________________________
9.3.3. The Precession dialog pane
The Precession dialog pane allows the user to control
the precession angle in Precession and Precession
animation modes. The min and max values of the
precession angles can be changed by the user. Here 0
and 3 degrees are used.
allows you to follow how an
electron precession pattern is built up, namely by the
successive summation of a large number of different
electron diffraction patterns. In order to see the same
thing in the electron microscope, the precession must be
slowed down to about 1 Hz.
For more information about the precession technique,
see the home pages of NanoMEGAS at
http://www.nanomegas.com/
The Precession dialog pane.
9-9
9-10 Simulator: Reciprocal space viewer
_______________________________________________________________________
1. At 0° precession (right),
the electron diffraction
pattern is just the normal
selected area electron
diffraction (SAED) pattern:
The pink circle is centered on
a small red cross, at the
distance corresponding to the
respective tilt in degrees. It is
shown only when the Spot
visualization mode is set to
2. As the precession angle
is increased (middle), the
momentary
electron
diffraction pattern looks
more
and
more
misaligned. Notice also
that the highest resolution
reflections are further out
with Precession ON.
the right:
3. When the precession
angle is even larger (left),
the FOLZ reflections
(marked red here) start to
appear at high resolution.
9-10
9-11 Simulator: Reciprocal space viewer
_______________________________________________________________________
9.4.
Simulating Precession Patterns
When simulating electron precession patterns, the most
clear patterns are obtained when choosing Data type
Fhkl:
and Rendering Greyscale:
For the mineral mayenite along the [011] zone axis, the
precession pattern at 0° precession is:
Increasing the precession angle will lead to an expansion of the central ZOLZ and even
more marked broadening of the FOLZ circle. Already at 0.2° precession angle the ZOLZ
and FOLZ start to merge:
9-11
9-12 Simulator: Reciprocal space viewer
_______________________________________________________________________
9.5.
Symmetry determination from precession patterns
The combined information from ZOLZ and FOLZ is very useful for symmetry
determination. Notice in the case of mayenite above (space group I-43d, a = 11.98 Å)
that there are twice as many diffraction spots per unit area in the FOLZ ring than in the
central ZOLZ are. Notice also that the diffraction spots in the FOLZ are shifted relative
those of the ZOLZ. This information can be used to determine the space group, as
described in detail by [7]. Experimentally, the symmetry can be determined from such
precession patterns by the program Space Group Determinator from Calidris,
Sollentuna, Sweden. An example is shown below:
9.6.
Precession electron diffraction pattern of Mayenite along [111]:
Here the symmetry is 6mm in the ZOLZ but only 3m1 in the FOLZ. This excludes
tetragonal and hexagonal space groups, but allows trigonal and cubic space groups.
The systematic absences (analysed in the bottom window) are only compatible
with rhomohedral (in hexagonal setting) [001] and I-centered cubic, along [1 1 1].
9-12
10-1 References
_______________________________________________________________________
10. References
1. Z.L. Wang. Elastic and Inelastic Scattering in Electron Diffraction and
Imaging. Springer. 1995, 476 pp.
2. E.J. Kirkland. Advanced Computing in Electron Microscopy. Springer. 1998,
250 pp.
3. Roger Vincent and Paul Midgley, Double conical beam-rocking system for
measurement of integrated electron diffraction intensities Ultramicroscopy 55
(1994) 271-282.
4. Peter Oleynikov, Sven Hovmöller and Xiaodong Zou, Precession electron
diffraction: observed and calculated intensities. Ultramicroscopy 107 (2007), 523533. A PDF file may be downloaded from the home page of Sven Hovmöller
http://www.fos.su.se/~svenh/index.html
5. Peter Oleynikov, Exploring reciprocal space – Electron diffraction, texture and
precession, Ph.D. thesis at Stockholm University, Department of Structural
Chemistry, 2006. ( 90 pages + 7 papers. Free copies may be obtained from the
author or via Calidris.)
6. Jean Paul Morniroli, A. Redjaïmia and Stavros Nicolopoulos Contribution of
electron precession to the identification of the space group from microdiffraction
patterns. Ultramicroscopy, 107 (2007) 514-522.
7. Jean Paul Morniroli and John W. Steeds, Microdiffraction as a tool for crystal
structure identification and determination Ultramicroscopy 45 (1992) 219-239.
8. The whole of Ultramicroscopy Vol. 107 (2007) issues 6-7, is devoted to the
electron precession technique.
9. A large number of references on electron precession can be found at the
NanoMEGAS home page http://www.nanomegas.com/bibliography2.php
10-1