1
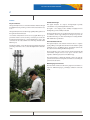
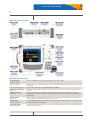
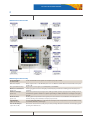
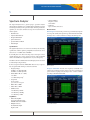
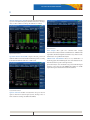
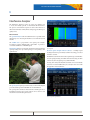
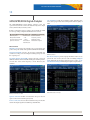
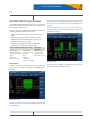
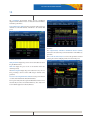
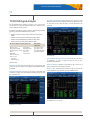
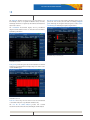
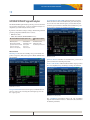
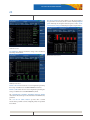
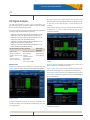
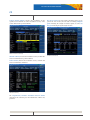
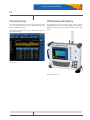
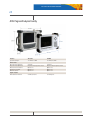
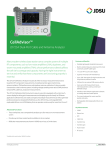
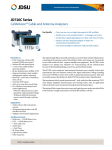
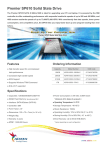
COMMUNICATIONS TEST & MEASUREMENT SOLUTIONS
JD748A
Signal Analyzer
Introduction
The Signal Analyzers, JD7108B and JD748A, are the optimal test tool for installation and maintenance of cell sites.
The Signal Analyzers contain all the features and capabilities required to perform field testing of cell sites of all wireless technologies, from 2G to
4G.
The Signal Analyzers are equipped with onebutton standard based measurements for wireless signals and offers the full scope of BTS
conformance test.
The Signal Analyzers have integrated all the necessary functions to effectively test BTS. Its combined functionality includes spectrum analysis,
cable and antenna analysis, power meter, interference analysis, channel scanner, E1/T1 analysis, and signal analysis.
Its new platform extends its spectrum analysis frequency range while increasing sensitivity, dynamic range, and improving measurement speed.
The standard features of the Signal Analyzers include the following:
• Spectrum Analyzer
• Power Meter
The Signal Analyzers were designed with a flexible platform that can support any of the following functions.
• Interference Analysis
• Channel Scanner
• GPS Receiver
• Built‐In Bias Tee
• Signal Analysis of cdmaOne/CDMA2000, EV‐DO, GSM/ GPRS/ EDGE, WCDMA/HSDPA, TD‐SCDMA, Mobile WiMAX, and LTE
The Signal Analyzers are the ideal field testing solution that combines portability, due to its lightweight design and battery extended operation,
and performance, with its multifunction capability.
The Signal Analyzers have a strong enclosure design for harsh environments and its backlight key panel makes nocturnal main‐tenance tasks
possible.
JD7108B – Signal Analyzer
JD7108B
JD748A
Spectrum Analyzer: 100 kHz to 7.2 GHz
100 kHz to 4 GHz
Power Meter: 10 MHz to 7.2 GHz
10 MHz to 4 GHz
JD7108B – Backlight Panel
WEBSITE: www.jdsu.com/test
JD7108B and JD748A SIGNAL ANALYZER
2
Features
Easy User Interface
The Signal Analyzers have a consistent and intuitive interface through
its multiple functions providing a common menu structure that is easy
to use.
The Signal Analyzers have a built‐in help capability which guides users
through each measurement task.
A screenshot of any functions can be saved as a graphic file for report
generation and traces can be saved for post‐analysis process into the
instrument’s internal memory or external USB memory device. The
stored data can be easily transferred to a PC using the USB 10/100
Ethernet ports.
For file name editing, a rotary knob is integrated with an enter button
providing convenience to choose and select alphanumeric characters
easily.
Field Useable Design
The Signal Analyzers are compact and lightweight especially
convenient for users performing field measurements.
Its bright 8” color display provides visibility in daylight. And its
backlight keys provide visibility on the dark.
The Signal Analyzers have an operating temperature range from ‐10
to 55 Celsius; and its rugged bumper was designed to protect the
instrument from drops or other external impacts exceeding the MIL‐
PRF‐28800F class 2 specification.
Automatic Measurements
The Signal Analyzers Auto Measure function allows a complete
signal profiling covering RF characterization and modulation quality
parameters of up to 10 different carriers, particularly useful on the
base stations are transmitting in different frequencies.
The Auto Measure can be easily executed and the instrument will
automatically configure and test every aspect of all the carriers
regardless of their frequency band or modulation type.
The Signal Analyzers configurable channel scanner can track the
power level of 20 carriers in a single measurement screen, tracking the
power level of each carrier.
Multi language user interface
The instrument’s architecture allows the graphical user interface to
adapt into different languages, permitting localization around the
world.
JD7108B and JD748A SIGNAL ANALYZER
3
JD7108B Integrated Functionality
JD708B Integrated Functionality
Spectrum Analyzer
100 kHz to 7.2 GHz
Built in Pre-amplifier
Locates and identifies various signals over a frequency range up to 7.2 GHz.
Channel Scanner
(option 012)
Detects signal as low as ‐160 dBm with phase noise ‐100 dBc/Hz at 30 kHz offset and measurement accuracy better than 1dB.
Triggers pulse or burst signal such as WiMAX, GSM, and TD-SCDMA.
Provides geographical location and highly accurate frequency and time base enabling precise frequency measurements.
Provides the parameters of spectrogram and a multi‐signal RSSI required to properly monitor, identify, and
located interference signals. In addition it is capable of generating an audible variable tone accordingly to the
signal strength.
Intuitive graphical representation of the signal’s power for each of the 20 user‐definable carriers (frequencies or
channels) allowing a fast identification of improper power levels.
Signal Analyzer
(option 020 to 028)
Provides 3GPP/3GPP2/IEEE802.16 conformance for testing for power and spectrum, as well as modulation analysis from 2G to 4G wireless technologies.
Over The Air Analyzer
(option 040 to 048)
Characterizes the transmission quality at any location providing reflective measurements and identifying signals
providing from different sites.
Zero Span with Gate Sweep
GPS Receiver and Antenna
(option 010)
Interference Analyzer
(option 011)
JD7108B and JD748A SIGNAL ANALYZER
4
JD748A Integrated Functionality
JD748A Integrated Functionality
Spectrum Analyzer
100 kHz to 4 GHz
Built in Pre-amplifier
Locates and identifies various signals over a frequency range up to 4 GHz.
Channel Scanner
(option 012)
Detects signal as low as –155 dBm with phase noise –90 dBc/Hz at 30 kHz offset and measurement accuracy better than 1 dB.
Triggers pulse or burst signal such as WiMAX, GSM, and TDSCDMA.
Provides geographical location and highly accurate frequency and time base enabling precise frequency measurements.
Provides the parameters of spectrogram and a multi‐signal RSSI required to properly monitor, identify, and located interference signals. In addition it is capable of generating an audible variable tone accordingly to the signal
strength.
Intuitive graphical representation of the signal’s power for each of the 20 user‐definable carriers (frequencies or
channels) allowing a fast identification of improper power levels.
Signal Analyzer
(option 020 to 028)
Provides 3GPP/3GPP2/IEEE802.16 conformance for testing for power and spectrum, as well as modulation analysis from 2G to 4G wireless technologies.
Over The Air Analyzer
(option 040 to 048)
Characterizes the transmission quality at any location providing reflective measurements and identifying signals
providing from different sites.
Zero Span with Gate Sweep
GPS Receiver and Antenna
(option 010)
Interference Analyzer
(option 011)
JD7108B and JD748A SIGNAL ANALYZER
5
Spectrum Analyzer
The Signal Analyzers have a general purpose spectrum analyzer
which is the most flexible test tool for RF analysis including spectrum
monitoring and analysis. The spectrum analysis function provides the
capability of one‐button standards based power measurements for
wireless signals.
• Channel Power
• Adjacent Channel Power
• Advanced Marker
Frequency counter
Noise marker
• Limit Line
Up to 6 markers and 6 traces
Measurements
Channel power measures the power level, spectral density and peak
to average ratio (PAR) of the signal in a specified channel bandwidth,
showing a “Pass” or “Fail” condition according to the defined power.
• Occupied Bandwidth
• Spurious Emissions
• Spectrum Emission Mask
• Field Strength
Specifications
The Signal Analyzers have one of the best sensitivity and selectivity
specifications. With its built‐in preamplifier, measurements can be
done as low as –160 dBm1 with a 1 Hz RBW.
Its low SSB phase noise allows detecting very low level spurs or noise
signals which are close to the carrier. Its narrow (1 Hz) bandwidth
ensures the identification of signals that are very close in frequency.
In addition, the narrow RBW means that the displayed noise level can
be reduced improving sensitivity.
Its Auto Sweep time and Auto RBW/VBW allows an easy set up for a
fast sweep time while ensuring accurate measurement.
• Frequency Range:
100 kHz to 7.2 GHz (JD7108B)
100 KHz to 4.0 GHz (JD748A)
• DANL (RBW 1 Hz, fc < 1 GHz)
–145 dBm1
–160 dBm with preamp1
Channel Power
Occupied bandwidth measures the frequency bandwidth that
contains the specified percentage of the power, the total integrated
power and the occupied power, showing a “Pass” or “Fail” condition
according to the defined bandwidth.
• Sweep Time
10 ms to 1000 s
6 μs to 200 s in zero span
• RBW: 1 Hz to 3 MHz
• VBW: 1 Hz to 3 MHz
• SSB Phase Noise
–100 dBc/Hz @ 30 kHz1
–102 dBc/Hz @ 100 kHz1
–115 dBc/Hz @ 1 MHz1
Capabilities
• Built‐in Preamplifier
Zero Span with Gated Sweep
AM/FM Audio Demodulation
• Multiple Detectors;
Normal, RMS, Sample
Negative, Peak
Occupied Bandwidth
JD7108B and JD748A SIGNAL ANALYZER
6
Adjacent channel power (ACP) measures the amount of interference,
or power, in an adjacent frequency channels and its ratios, showing a
“Pass” or “Fail” condition according to the defined test condition.
Spurious Emssions
Adjacent Channel Power
Spectrum emission mask (SEM) compares the total power level
within the defined carrier bandwidth and offset frequencies according
to the defined mask limits with “Pass” or "Fail" result.
Field strength offers quick and convenient field strength
measurement and analysis with the userdefinable user-definable multi
segment line. The field strength measurement is easy to make once the
antenna factors are specified in the analyzer.
AM/FM audio demodulation allows an easy identification of
interfering signals. The AM/FM signal can be demodulated into the
instrument’s built-in speaker or through a headset.
Spectrum Analyzer can be simultaneously operated with CW Signal
Generator (option 003). It is easily fulfilling the guideline of >100 dB
required for repeater and antenna isolation measurement.
Spectrum Emission Mask
Spurious emissions identifies and determines the power level of
spurious emissions in certain frequency bands, showing a "Pass" or
"Fail" condition according to the defined mask limits.
JD7108B and JD748A SIGNAL ANALYZER
7
Power Meter
The Signal Analyzers perform two different methods of power
measurement; the first is an internal power measurement for standard
power testing without the assistance of external power sensors and the
second is interfacing with an external power sensor for high accuracy
power measurements.
Internal power
measurement
Frequency range
• 10 MHz to 7.2 GHz1
Dynamic range
• –120 to +30 dBm1
Measurement type
• RMS
• Peak
External power measurement
Terminating
power sensor
JD732A
• Average power
JD734A
• Peak power
JD736A
• Average and
peak power
Directional (through line)
power sensor
JD731A/JD733A
• Forward average power
• Forward peak power
• Reverse average power
• VSWR
Internal Power Measurement
The Power Meter function also provides a Pass/Fail condition with
user‐definable limits. The test results are displayed in dBm and Watts.
The power measurement can be set as an absolute measurement
displayed in dBm or as a relative measurement displayed in dB.
The JD7108B and JD748A display the power level in two formats, as
a real‐time power level value in an analog meter, and as a power level
trend through time in a histogram chart.
For high‐precision power measurements the JD7108B and JD748A
interface with external power sensors through a USB connection.
There are two types of power sensors:
• Termination power: Power sensor JD732A, JD734A, or JD736B.
For out-of-service testing.
• Directional power or through line: Power sensors JD731A or
JD733A. Having the advantage to perform in-service power testing.
External Power Measurement
JD7108B and JD748A SIGNAL ANALYZER
8
Interference Analyzer
The Interference Analyzer (option 11) is the most effective way
to locate and identify periodic or intermittent RF interferences.
The presence of interference signals are derived from licensed or
unlicensed transmitters of many kinds causing dropped calls and poor
quality service.
Measurements
The spectrum analyzer with an audible indicator is especially useful
during the process of locating the interferer source with a directional
antenna.
The audible tone is proportional to the signal power strength.
In addition a built-in AM/FM audio demodulator it provides a
convenient identification of AM/FM signals.
Interference ID allows an automatic classification of the interfering
signal providing a list of possible signal types corresponding to the
signal selected.
Spectrogram
Received signal strength indicator (RSSI) is a multiple signal
tracking metric that is particularly useful for measuring power level
variations over time.
The RSSI measurement also allows the assignment of power limit lines
for each signal generating an audible alarm and increasing an alarm
counter every time any signal goes beyond the limit line.
For long-term analysis the RSSI measurement can be automatically
saved into an external USB memory. Post-analysis can be done with
the application software JDViewer.
The spectrogram captures spectrum activity over time indicating the
power levels of the spectrum with different color identification.
The spectrogram is an effective measurement to identify periodic or
intermittent signals. Postprocessing analysis can be done for each
measurement over time using a time cursor.
Received Signal Strength Indicator
JD7108B and JD748A SIGNAL ANALYZER
9
Signal Analyzer
The modulation analysis can be performed in any of the following
wireless technologies:
The signal analyzer performs 3GPP/3GPP2/IEEE802.16 standard
compliance testing for power and spectrum, as well as modulation
analysis; making RF parametric analysis as well as modulation quality
performance of modern wireless communication systems. It performs
standard‐based measurements with a single‐button action, indicating
a Pass/Fail condition according to the standard‐based or userdefined
limits.
• cdmaOne/CDMA2000 (option 020)
The Auto Measure capability in Signal Analyzer creates easily set
up testing scenarios, including the programming of measurement
schedules such as starting time, duration, intervals and measurement
parameters. Based on the user defined conditions, the JD7108B and
JD748A perform the tests of up to 10 carriers and automatically store
the results.
The Over The Air (OTA) Analyzer function provides over the air
measurements for quick performance characterization of the base
station. This measurement capability is especially useful in testing cell
sites which are not easily accessible or the cell site proactively without
interrupting service.
The Signal Analyzer provides following measurement capabilities:
• Spectrum analysis
• RF analysis
• Modulation analysis
• Auto measure
• EV‐DO (option 021)
• GSM/GPRS/EDGE (option 022)
• WCDMA/HSDPA (option 023 and 024)
• TD‐SCDMA (option 025)
• Mobile WiMAX (option 026)
• LTE (option 028)
Available Over The Air (OTA) analysis are:
• cdmaOne/CDMA2000 (option 040)
• EV‐DO (option 041)
• GSM/GPRS/EDGE (option 042)
• WCDMA/HSDPA (option 043)
• TD‐SCDMA (option 045)
• Mobile WiMAX (option 046)
• LTE (option 048)
JD7108B and JD748A SIGNAL ANALYZER
10
GSM/GPRS/EDGE Signal Analyzer
The GSM/GPRS/EDGE Signal Analyzer performs power and
spectrum measurements as well as modulation analysis in a simple
and easy manner with just a few key strokes.
I‐Q constellation verifies the modulation quality including phase
errors and I‐Q origin offsets characterizing the modulation quality of
GSM.
It makes conformance testing according to the specifications (3GPP
TS 51.021) providing a simple Pass/Fail indication on each test.
RF and modulation analysis (option 22)
Power vs time
Channel power
• Slot
Occupied bandwidth
Spectrum emission mask • Frame
Spurious emissions
Constellation
Auto Measure
OTA analysis (option 42)
Channel scanner
Frequency scanner
Multipath profile
Modulation analyzer
Measurements
Channel power measures the total RF power, spectral density and
peak to average ratio (PAR) of the signal in a GSM channel bandwidth.
Occupied bandwidth measures the frequency bandwidth that
contains 99% of the power, measuring the total integrated power and
the occupied power.
Spectrum emission mask (SEM) compares the total power level
within the defined carrier bandwidth and the given offset frequencies
on both sides of the carrier frequency to levels allowed by the
standards.
GSM Constellation
Over the air analyzer provides signal performance metrics at any
point in the area served by the base station, including multipath
profile indicating the strength of reflected signals; as well as carrier
over interference histogram indicating the signal strength variation.
GSM OTA Modulation Analyzer
GSM Spectrum Emission Mask
Spurious emissions identifies and determines the power level of
spurious emissions in certain frequency bands.
Power vs. time (slot) measures the modulation envelope in the time
domain showing the signal rise and fall shape of GSM format.
JD7108B and JD748A SIGNAL ANALYZER
11
WCDMA/HSDPA Signal Analyzer
The WCDMA/HSDPA Signal Analyzer perform power and spectrum
measurements, as well as modulation analysis in a simple and easy
manner with just a few key strokes.
It performs conformance testing according to the following standards
providing a simple Pass/Fail indication on each test.
Spectrum emission mask (SEM) compares the total power level
within the defined carrier bandwidth and the given offset frequencies
on both sides of the carrier frequency to levels allowed by the
standards
Adjacent channel leakage power ratio (ACLR) measures the
amount of interference, or power, in adjacent frequencies and its ratios
specified by the standards.
• 3GPP TS 25.104. Base Station radio transmission and reception
(FDD)
• 3GPP TS 25.141. Base Station (BS) conformance test (FDD)
• 3GPP TS 25.211. Physical channel and mapping of transport
channels onto physical channels (FDD)
• 3GPP TS 25.212. Multiplexing and channel coding (FDD)
• 3GPP TS 25.213. Spreading and modulation (FDD)
RF and modulation analysis (option 23, 24)
Channel power
Occupied bandwidth
Spectrum emission mask
ACLR
Multi‐ACLR
Spurious emissions
Constellation
Code domain power
Codogram
RCSI
CDP table
Auto measure
Power statistics CCDF
OTA analysis
(option 43)
Channel scanner
Scramble scanner
Multipath profile
Code domain power
WCDMA Multi‐ACLR
Measurements
Channel power measures the total RF power, spectral density and
peak to average ratio (PAR) of the signal in a WCDMA channel
bandwidth.
WCDMA Channel Power
Occupied bandwidth measures the frequency bandwidth that
contains 99% of the power, measuring the total integrated power and
the occupied power.
Spurious emissions identifies and determines the power level of
spurious emissions in certain frequency bands.
JD7108B and JD748A SIGNAL ANALYZER
12
WCDMA/HSDPA Signal Analyzer
The constellation measurement displays the I‐Q constellation
diagram with modulation metrics to characterize the transmitter’s
modulation performance.
WCDMA Codogram
Received code strength indicator (RCSI) shows the power variation
over time of WCDMA control channels: CPICH, P‐CCPCH, S‐
CCPCH, PICH, P‐SCH, and S‐SCH.
WCDMA Constellation
Code domain power (CDP) measures power levels of the spread
code channels across WCDMA RF channel, normalized to the total
WCDMA power.
CDP shows the physical channels of the WCDMA signal, and
identifies the various spread factors by different color types, making it
easy to differentiate traffic types carried in the WCDMA signal.
For long‐term analysis the codogram and RCSI measurements can be
automatically saved into an external USB memory. Post‐analysis can
be done with the application software JDViewer.
The complementary cumulative distribution function (CCDF)
characterizes the statistical power level distribution of WCDMA at
any given time.
The over the air (OTA) analyzer covers four key parameters: channel
scanner, scramble scanner, multipath profile, and code domain power.
The code domain power in OTA analyzer shows not only modulation
performance metrics but also amplifier capacity and code utilization
metrics.
WCDMA Code Domain Power
The codogram displays the power variation for every code over time,
presenting a clear view of the traffic load per channels at any given
time.
WCDMA OTA Code Domain Power
JD7108B and JD748A SIGNAL ANALYZER
13
CDMAONE/CDMA2000 Signal
Analyzer
Spectrum emission mask (SEM) compares the total power level
within the defined carrier bandwidth and the given offset frequencies
on both sides of the carrier frequency to levels allowed by the
standards.
The cdmaOne/CDMA2000 Signal Analyzer performs power and
spectrum measurements, as well as modulation analysis in a simple
and easy manner with just a few key strokes.
It performs conformance testing according to the following standards
providing a simple Pass/Fail indication on each test.
• 3GPP2 C.S0002. Physical Layer Standard for CDMA2000 Spread
Spectrum Systems
• 3GPP2 C.S0010. Recommended Minimum Performance Standards
for CDMA2000 Spread Spectrum Base Station
RF and modulation analysis (option 20)
Channel power
Occupied bandwidth
Spectrum emission mask
ACPR
Multi‐ACPR
Spurious emissions
Constellation
Code domain power
Codogram
RCSI
CDP table
Auto measure
Power statistics CCDF
OTA analysis
(option 40)
Channel scanner
Scramble scanner
Multipath profile
Code domain power
Measurements
Channel power measures the total RF power, spectral density and
peak to average ratio (PAR) of the signal in a cdmaOne or CDMA2000
channel bandwidth.
Occupied bandwidth measures the frequency bandwidth that
contains 99% of the power, measuring the total integrated power and
the occupied power.
CDMA Spectrum Emission Mask
Adjacent channel power ratio (ACPR) measures the amount of
interference, or power, in adjacent frequencies and its ratios specified
by the standards.
Spurious emissions identifies and determines the power level of
spurious emissions in certain frequency bands. The Constellation
measurement displays the I‐Q constellation diagram with modulation
metrics to characterize the transmitter’s modulation performance.
The constellation measurement displays the I‐Q constellation
diagram with modulation metrics to characterize the transmitter’s
modulation performance.
CDMA Occupied Bandwidth
CDMA Constellation
JD7108B and JD748A SIGNAL ANALYZER
14
Code domain power (CDP) measures power levels of the spread
code channels across cdmaOne or CDMA2000 RF channel,
normalized to the total CDMA power.
The complementary cumulative distribution function (CCDF)
characterizes the statistical power level distribution of cdmaOne or
CDMA2000 at any given time.
CDP shows the physical channels of the cdmaOne or CDMA2000 and
identifies the various spread factors by different color types, making it
easy to differentiate traffic types carried in the CDMA signal.
The over the air (OTA) analyzer covers four key parameters: channel
scanner, PN scanner, multipath profile, and code domain power.
The codogram displays the power variation for every code over time,
presenting a clear view of the traffic load per channels at any given
time.
The code domain power in OTA analyzer shows not only modulation
performance metrics but also amplifier capacity and code utilization
metrics.
CDMA OTA Channel Scanner
CDMA Codogram
Received code strength indicator (RCSI) shows the power variation
over time of cdmaOne or CDMA2000 control channels: Pilot, Page,
Sync, and Quick Page.
For long‐term analysis the codogram and RCSI measurements can be
automatically saved into an external USB memory. Post‐analysis can
be done with the application software JDViewer.
CDMA RCSI
JD7108B and JD748A SIGNAL ANALYZER
15
EV‐DO Signal Analyzer
The EV‐DO Signal Analyzer performs power and spectrum
measurements, as well as modulation analysis in a simple and easy
manner with just a few key strokes.
It performs conformance testing according to the following standards
providing a simple Pass/Fail indication on each test.
• 3GPP2 C.S0024‐B. CDMA2000 High Rate Packet Data Air Interface
Specification
• 3GPP2 C.S0032‐B. Recommended Minimum Performance
Standards for CDMA2000 High Rate Packet Data Access Network
RF and modulation analysis (option 21)
Channel power
Occupied bandwidth
Spectrum emission mask
ACPR
Multi‐ACPR
Spurious emissions
Power vs Time
• Idle Slot
• Active Slot
Constellation
Composite 64,
Composite 128
Pilot, MAC 64, MAC
128, Data
Code domain power
Pilot, MAC 64, MAC
128, Data
MAC Codogram
RCSI
MAC CDP table
Auto measure
Power statistics CCDF
Occupied bandwidth measures the frequency bandwidth that
contains 99% of the power, measuring the total integrated power and
the occupied power.
Spectrum emission mask (SEM) compares the total power level
within the defined carrier bandwidth and the given offset frequencies
on both sides of the carrier frequency to levels allowed by the
standards.
Adjacent channel power ratio (ACPR) measures the amount of
interference, or power, in adjacent frequencies and its ratios specified
by the standard.
OTA analysis
(option 41)
Channel scanner
Scramble scanner
Multipath profile
Code domain power
Measurements
Channel power measures the total RF power, spectral density
and peak to average ratio (PAR) of the signal in an EV‐DO channel
bandwidth.
EV‐DO ACPR
Spurious emissions identifies and determines the power level of
spurious emissions in certain frequency bands.
Power vs. time measures the modulation envelope in the time domain
showing the signal rise and fall shape of EV‐DO format.
EV‐DO Channel Power
EV‐DO Power vs. Time (Idle Slot)
JD7108B and JD748A SIGNAL ANALYZER
16
The constellation measurement displays the I‐Q constellation
diagram with modulation metrics to characterize the transmitter’s
modulation performance.
Code domain power (CDP) measures power levels of the spread code
channels across EV‐DO channels, normalized to the total EV‐DO
power.
EV‐DO RCSI
The complementary cumulative distribution function (CCDF)
characterizes the statistical power level distribution of EV‐DO at any
given time.
EV‐DO Data Code Domain
The over the air (OTA) analyzer covers four key parameters: channel
scanner, pilot scanner, multipath profile, and code domain power.
CDP pilot/MAC displays the power of various demodulated codes in
the pilot/MAC channel.
CDP data displays the power of the 16 sub‐channels of the data
channel separately.
The MAC codogram displays the power variation for every code over
time, presenting a clear view of the traffic load per channels at any
given time.
Received code strength indicator (RCSI) shows the power variation
over time of EV‐DO channels: Pilot, MAC and Data.
For long‐term analysis the Codogram and RCSI measurements can be
automatically saved into an external USB memory. Post‐analysis can
be done with the application software JDViewer.
EV‐DO OTA PN Scanner
JD7108B and JD748A SIGNAL ANALYZER
17
TD‐SCDMA Signal Analyzer
The TD‐SCDMA Signal Analyzer performs power and spectrum
measurements, as well as modulation analysis in a simple and easy
manner with just a few key strokes.
Spectrum emission mask (SEM) compares the total power level
within the defined carrier bandwidth and the given offset frequencies
on both sides of the carrier frequency to levels allowed by the
standards.
It performs conformance testing according to the following standards
providing a simple Pass/Fail indication on each test.
• 3GPP TS 25.105. Base Station radio transmission and reception
(TDD)
• 3GPP TS 25.142. Base Station conformance testing (TDD)
• 3GPP TS 25.222. Multiplexing and channel coding (TDD)
• 3GPP TS 25.223. Spreading and modulation (TDD)
RF and modulation analysis (option 25)
Channel power
Occupied bandwidth
Spectrum emission mask
ACLR
Multi‐ACLR
Spurious emissions
Power vs time
• Slot, frame
• Mask, timogram
Constellation
Midamble power
Code power
Code error
Auto measure
OTA analysis
(option 45)
Sync‐DL ID scanner
Sync‐DL ID vs Tau
Sync‐DL ID Multipath
Sync‐DL ID analyzerr
Measurements
Channel power measures the total RF power, spectral density and
peak to average ratio (PAR) of the signal in a TD‐SCDMA channel
bandwidth.
Occupied bandwidth measures the frequency bandwidth that
contains 99% of the power, measuring the total integrated power and
the occupied power.
TD‐SCDMA SEM
Adjacent channel leakage power ratio (ACLR) measures the amount
of interference, or power, in adjacent frequencies and its ratios
specified by the standards.
Spurious emissions identifies and determines the power level of
spurious emissions in certain frequency bands.
Power vs. time verifies that the transmitter output power has the
correct amplitude, shape, and timing for TD‐SCDMA format.
TD‐SCDMA Power vs. Time (Frame)
TD‐SCDMA Occupied BW
JD7108B and JD748A SIGNAL ANALYZER
18
The timogram displays and shows how power level changes over
time making it easier to see UpPTS and DwPTS activity over time,
identifying interference on UpPTS by the DwPTS transmitted from
adjacent base stations.
Over the air analyzer provides signal performance metrics at any
point in the area served by the base station, including multipath
profile indicating the strength of reflected signals; as well as carrier
over ID histogram indicating the signal strength variation.
The constellation measurement displays the I‐Q constellation
diagram with modulation metrics to characterize the transmitter’s
modulation performance.
TD‐SCDMA OTA Sync‐DL ID Analyzer
TD‐SCDMA Constellation
Code power provides the power data for an individual code channel
and layer for a specified time slot. It displays the power of the 16 codes
of a TD‐SCDMA signal.
TD‐SCDMA Code Power
Code error shows the power data and error data for an individual
code channel and layer for a specified time simultaneously.
The over the air (OTA) analyzer provides four essential
measurements: ID scanner, ID vs Tau, ID multipath, and ID analyzer.
JD7108B and JD748A SIGNAL ANALYZER
19
MOBILE WIMAX SignalAnalyzer
The Mobile WiMAX Signal Analyzer performs power measurements
and spectrum measurements, as well as modulation analysis in a
simple and easy manner with just a few key strokes.
Spectrum emission mask (SEM) compares the total power level
within the defined carrier bandwidth and the given offset frequencies on both sides of the carrier frequency to levels allowed by the
standards. Spurious Emissions identifies and determines the power
level of spurious emissions in certain frequency bands.
It performs conformance testing according to the following standards
providing a simple Pass/Fail indication on each test.
• IEEE 802.16e‐2005
• WiBro (Korean Mobile WiMAX OFDMA Service)
RF and modulation analysis (option 26)
Channel power
Occupied bandwidth
Spectrum emission mask
Spurious emissions
Power vs time (frame)
Constellation
Midamble power
Code power
Code error
Auto measure
OTA analysis (option
46)
Preamble scanner
Multipath profile
Preamble power Trend
Measurements
Channel power measures the total RF power, spectral density and
peak to average ratio (PAR) of the signal in a Mobile WiMAX channel bandwidth.
WiMAX Spectrum
Spurious emissions identifies and determines the power level of
spurious emissions in certain frequency bands.
Power vs. time (frame) verifies that the transmitter output power has
the correct amplitude, shape, and timing according to the standards.
WiMAX Channel Power
Occupied bandwidth measures the frequency bandwidth that contains 99% of the power, measuring the total integrated power and
the occupied power.
WiMAX Power vs. Time (Frame)
The constellation measurement displays the I‐Q constellation
diagram with modulation metrics to characterize the transmitter’s
modulation performance.
JD7108B and JD748A SIGNAL ANALYZER
20
Over the air analyzer provides cell ID, sector ID and preamble at
any point in the area served by the base station, including multipath
profile indicating the strength of reflected signals; as well as carrier
over interference histogram indicating the signal strength variation.
WiMAX Constellation
Spectral flatness measures the flatness energy of the constellation
according to the Standards.
WiMAX OTA Preamble Scanner
WiMAX Spectral Flatness
EVM vs. subcarrier shows the error vector magnitude representing
the average constellation error of WIMAX OFDMA subcarriers.
EVM vs. symbol shows the error vector magnitude representing the
average constellation error of WiMAX OFDMA symbols.
The complementary cumulative distribution function (CCDF)
characterizes the statistical power level distribution of WiMAX at any
given time.
The over the air (OTA) analyzer provides three essential
measurements: preamble scanner, multipath profile, and preamble
Power Trend.
JD7108B and JD748A SIGNAL ANALYZER
21
LTE Signal Analyzer
The LTE Signal Analyzer performs power measurements and
spectrum measurements, as well as modulation analysis in a simple
and easy manner with just a few key strokes.
It performs conformance testing according to the following standards
providing a simple Pass/Fail indication on each test.
Spectrum emission mask (SEM) compares the total power level
within the defined carrier bandwidth and the given offset frequencies
on both sides of the carrier frequency to levels allowed by the
standards.
Adjacent channel leakage power ratio (ACLR) measures the amount
of interference, or power, in adjacent frequencies and its ratios
specified the standards.
• 3GPP TS 36.104. Evolved Universal Terrestrial Radio Access (E‐
UTRA); Base Station (BS) Radio Transmission and Reception
• 3GPP TS 36.141. Evolved Universal Terrestrial Radio Access (E‐
UTRA); Base Station (BS) Conformance Testing
• 3GPP TS 36.211. Evolved Universal Terrestrial Radio Access (E‐
UTRA); Physical Channels and Modulation
• 3GPP TS 36.212. Evolved Universal Terrestrial Radio Access (E‐
UTRA); Multiplexing and Channel Coding
RF and modulation analysis (option 28)
Channel power
Occupied bandwidth
Spectrum emission mask
ACLR
Spurious emissions
Power vs time (frame)
Data Channel Summary
Control Channel
Summary
Subframe Summary
Frame Summary
Auto Measure
Power Statistics CCDF
OTA analysis
(option 48)
ID Scanner
Multipath Profile
Control Channel
Measurements
Channel power measures the total RF power, spectral density, and
peak to average ratio (PAR) of the signal in a LTE channel bandwidth.
LTE ACLR
Spurious emissions identifies and determines the power level of
spurious emissions in certain frequency bands.
Power vs. time (frame) measures the modulation envelope in the
time domain, showing the power of each time slot in an LTE signal.
Data channel summary measures the constellation for the specified
resource block as well as the modulation accuracy of each PDSCH’s at
the specified subframe.
LTE Channel Power
Occupied bandwidth measures the frequency bandwidth that
contains 99% of the power, measuring the total integrated power and
the occupied power.
LTE Data Channel Summary
JD7108B and JD748A SIGNAL ANALYZER
22
Control channel summary measures the constellation for the
specified control channels as well as modulation accuracy of the
control channels at the specified subframe.
Over the air analyzer provides signal performance metrics at any
point in the area served by the base station, including multipath
profile indicating the strength of reflected signals; as well as RS
histogram indicating the signal strength variation.
LTE Control Channel Summary
Subframe summary measures the modulation accuracy of all the data
and control channels at the specified subframe.
Frame summary measures the modulation accuracy of all the data
and control channels at of the frame.
LTE Frame Summary
The complementary cumulative distribution function (CCDF)
characterizes the statistical power level distribution of LTE at any
given time.
LTE OTA Control Channel
JD7108B and JD748A SIGNAL ANALYZER
23
Channel Scanner
GPS Receiver and Antenna
The Channel Scanner function (option 12) is capable of measuring
up to 20 independent channels, of any cellular technology, at any
frequency channel or frequency.
The GPS Receiver (option 11) provides position location (latitude,
longitude and altitude), as well as timing for highly accurate frequency
measurement, allowing an independent verification of base station
timing.
The channel scanner function provides a simple view of the power
level of each signal type.
Channel Scanner
JD7108B with GPS Antenna
JD7108B and JD748A SIGNAL ANALYZER
24
Application Software
The JD7108B and JD748A communicate with the PC application
software JDViewer to retrieve measurements and perform post‐
processing analysis and reporting.
Features
• Communicates with the JD7108B and JD748A via LAN or USB.
• Retrieves measured or saved measurements.
• Exports measurement results.
• Generates and prints configurable reports.
• Edits measurement charts.
• Creates a composite file of multiple spectrogram traces.
• Analyzes measurement results allowing the assignment of multiple
markers and limit lines.
• Creates user defined settings for channel power, occupied
BW, spectrum emission mask, and adjacent channel power
measurements.
• Creates or edits multi‐segment lines for insertion gain and loss
measurements.
JDViewer Spectrum, Demodulation
• Creates Auto Measure scenarios for multi‐carrier signal analysis.
JDViewer Spectrogram, RSSI
JDViewer Spectrum, Spectrogram and RSSI
JD7108B and JD748A SIGNAL ANALYZER
25
JDSU Signal Analyzer Family
Features
Spectrum analyzer
Power meter
RF power meter (Internal)
RF power meter (External)
GPS receiver and antenna
Interference analyzer
Channel scanner
Signal analyzer
Demodulation hardware
JD7108B
100 kHz to 7.2 GHz
JD748A
100 kHz to 4.0 GHz
Standard
Required external power sensors
Option 010
Option 011
Option 012
Standard
Required external power sensors
Option 010
Option 011
Option 012
20 MHz, standard
10 MHz option
JD7108B and JD748A SIGNAL ANALYZER
26
Ordering information
JD7108B
Spectrum Analyzer
Power Meter
100 kHz to 7.2 GHz
10 MHz to 7.2 GHz
Internal mode
Options
NOTE: Upgrade options for the JD7108B use the designation JD7108BU before the respective last two
digit option number.
JD7108B010
GPS Receiver and Antenna
JD7108B011
Interference Analyzer1, 2
JD7108B012
Channel Scanner
JD7108B020
cdmaOne/CDMA2000 Signal Analyzer
JD7108B021
EV‐DO Signal Analyzer
(Requires option 20)
JD7108B022
GSM/GPRS/EDGE Signal Analyzer
JD7108B023
WCDMA Signal Analyzer
JD7108B024
HSDPA Signal Analyzer
(Requires option 23)
JD7108B025
TD‐SCDMA Signal Analyzer
JD7108B026
Mobile WiMAX Signal Analyzer
JD7108B028
LTE Signal Analyzer
(Requires options 10 and 20)
JD7108B040
cdmaOne/CDMA2000 OTA Analyzer2
(Requires options 10 and 21)
JD7108B041
EV‐DO OTA Analyzer2
(Requires options 10 and 22)
JD7108B042
GSM/GPRS/EDGE OTA Analyzer2
(Requires options 10 and 23/24)
JD7108B043
WCDMA/HSDPA OTA Analyzer2
(Requires options 10 and 25)
JD7108B045
TD‐SCDMA OTA Analyzer2
(Requires options 10 and 26)
JD7108B046
Mobile WiMAX OTA Analyzer2
(Requires options 10 and 028)
JD7108B048
LTE OTA Analyzer2
Highly recommends adding JD7108B010
Highly recommends adding G70005035x and/or G70005036x
1
2
Standard Accessories
JD71050341
G710550322
G710550335
GC73050515
GC72450518
G710550325
G710550323
JD7108B361
Soft Carrying Case3
AC/DC Power Adapter3
Cross LAN Cable (1.5 m)3
USB A to B Cable (1.8 m)3
> 1 G Byte USB Memory3
Rechargeable Lithium Ion Battery3
Automotive Cigarette Lighter 12 VCD Adapter3
D7108B User’s Manual and Application Software – CD
Standard accessories can be purchased separately.
3
JD7108B and JD748A SIGNAL ANALYZER
27
Ordering information
JD748A
Spectrum Analyzer
Power Meter Internal mode
100 kHz to 4 GHz
10 MHz to 4 GHz
Options
NOTE: Upgrade options for the JD748A use the designation JD748AU before the respective last three digit option
number.
JD748A009
10 MHz Demodulation Hardware
JD748A010
GPS Receiver and Antenna
JD748A011
Interference Analyzer 1,2
JD748A012
Channel Scanner
JD748A020
cdmaOne/CDMA2000 Signal Analyzer
(Requires option 9)
JD748A021
EV‐DO Signal Analyzer
(Requires option 9 and 20)
JD748A022
GSM/GPRS/EDGE Signal Analyzer
(Requires option 9)
JD748A023
WCDMA Signal Analyzer
(Requires option 9)
JD748A024
HSDPA Signal Analyzer
(Requires option 9 and 23)
JD748A025
TD‐SCDMA Signal Analyzer
(Requires option9)
JD748A026
Mobile WiMAX Signal Analyzer
(Requires option 9)
JD748A028
LTE Signal Analyzer
(Requires option 9)
(Requires options 10 and 20)
JD748A040
cdmaOne/CDMA2000 OTA Analyzer2
(Requires options 10 and 21)
JD748A041
EV‐DO OTA Analyzer2
(Requires options 10 and 22)
JD748A042
GSM/GPRS/EDGE OTA Analyzer2
(Requires options 10 and 23/24)
JD748A043
WCDMA/HSDPA OTA Analyzer2
(Requires options 10 and 25)
JD748A045
TD‐SCDMA OTA Analyzer2
(Requires options 10 and 26)
JD748A046
Mobile WiMAX OTA Analyzer2
(Requires options 10 and 028)
JD748A048
LTE OTA Analyzer2
Highly recommends adding JD748A010
Highly recommends adding G70005035x and/or G70005036x
1
2
Standard Accessories
G710550322
G710550335
GC73050515
GC72450518
G710550325
G710550323
JD748A361
AC/DC Power Adapter3
Cross LAN Cable (1.5 m)3
USB A to B Cable (1.8 m)3
> 1 G Byte USB Memory3
Rechargeable Lithium Ion Battery3
Automotive Cigarette Lighter 12 VCD Adapter3
JD748A User’s Manual and Application Software – CD
Standard accessories can be purchased separately.
3
JD7108B and JD748A SIGNAL ANALYZER
28
Ordering information
Optional Power Sensors
JD731A
JD733A
JD732A
JD734A
JD736A
Directional Power Sensor (peak and average power)
Frequency: 300 MHz to 3.8 GHz
Power: Average 0.15 to 150 W, Peak 4 to 400 W
Directional Power Sensor (peak and average power)
Frequency: 150 MHz to 3.5 GHz
Power: Average/Peak 0.25 to 20 W
Terminating Power Sensor (average power)
Frequency: 20 MHz to 3.8 GHz
Power: ‐30 to 20 dBm
Terminating Power Sensor (peak power)
Frequency: 20 MHz to 3.8 GHz
Power: ‐30 to 20 dBm
Terminating Power Sensor (peak and average power)
Frequency: 20 MHz to 3.8 GHz
Power: ‐30 to 20 dBm
Optional RF Cables
G710050531
G710050532
1.5 m (4.92 ft) Precision RF Cable, DC to 18 GHz, N(m)‐N(f ), 50 Ω
3.0 m (9.84 ft) Precision RF Cable, DC to 18 GHz, N(m)‐N(f ), 50 Ω
Optional Omni Antennas
G700050351
G700050352
G700050353
G700050354
G700050355
RF Omni Antenna 400 MHz to 450 MHz
RF Omni Antenna 450 MHz to 500 MHz
RF Omni Antenna 806 MHz to 896 MHz
RF Omni Antenna 870 MHz to 960 MHz
RF Omni Antenna 1710 MHz to 2170 MHz
Optional Yaggi Antennas
G700050364
G700050365
G700050363
RF Yaggi Antenna 806 MHz to 896 MHz
RF Yaggi Antenna 866 MHz to 960 MHz
RF Yaggi Antenna 1750 MHz to 2390 MHz
Optional Adapters
G710050571
G710050572
G710050573
G710050574
G710050575
G710050576
G710050577
G710050578
G710050579
Adapter N(m) to DIN(f ), DC to 4 GHz, 50 Ω
Adapter DIN(m) to DIN(m), DC to 4 GHz, 50 Ω
Adapter N(m) to SMA(f ), DC to 18 GHz, 50 Ω
Adapter N(m) to BNC(f ), DC to 1.5 GHz, 50 Ω
Adapter N(f ) to N(f ), DC to 4 GHz, 50 Ω
Adapter N(m) to DIN(m), DC to 4 GHz, 50 Ω
Adapter N(f ) to DIN(f ), DC to 4 GHz, 50 Ω
Adapter N(f ) to DIN(m), DC to 4 GHz, 50 Ω
Adapter DIN(f ) to DIN(f ), DC to 4 GHz, 50 Ω
JD7108B and JD748A SIGNAL ANALYZER
Ordering information
Miscellaneous
G710050581
JD74050341
JD71050342
JD71050343
G710550324
JD7108B362
JD748A362
Attenuator 40 dB, 100 W, DC to 4 GHz (Unidirectional)
JD740 Soft Carrying Case
Hard Carrying Case
Backpack Carrying Case
External Battery Charger
JD7108B User’s Manual – Printed Version
JD748A User’s Manual – Printed Version
Test & Measurement Regional Sales
NORTH AMERICA
LATIN AMERICA
ASIA PACIFIC
TEL: +1 866 228 3762
FAX: +1 301 353 9216
TEL: +1 954 688-5660
FAX: +1 954 3454668
TEL: +852 2892 0990
FAX: +852 2892 0770
EMEA
TEL: +49 7121 86 2222
FAX: +49 7121 86 1222
www.jdsu.com/test
Product specifications and descriptions in this document subject to change without notice. © 2011 JDS Uniphase Corporation 30168328 000 0111 JD748ASA.BR.CPO.TM.AE