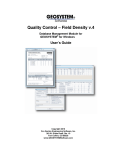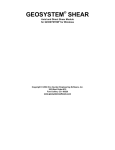
1
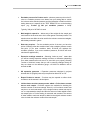
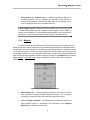
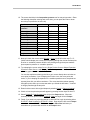
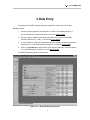
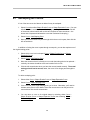
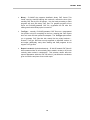
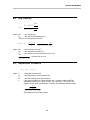
®
GEOSYSTEM R-VALUE
Resistance R-value Module
for GEOSYSTEM® for Windows
R-VALUE TEST REPORT
RESISTANCE R-VALUE TESTING RESULTS
(AASHTO T 190)
Tested by:
Checked by:
Remarks:
Test specimen number
Compaction pressure (psi):
Prepared weight (grams):
Water added (ml.):
% Moisture:
Exudation load (lbs.):
Exudation pressure (psi):
Total weight (lbs.):
Mold weight (lbs.):
Sample weight (lbs.):
Initial expansion (in.):
Final expansion (in.):
Expansion pressure (psi):
Ph at 2000 lbs.:
D turns:
R:
Height (in.):
Dry density (pcf):
Corrected R:
1
5
100.0
0.0
5.0
1884
150
3.830
2.430
1.400
0.0025
0.0042
0.68
158
3.00
1.0
2.30
79.7
0.9
2
10
1000.0
47.6
10.0
4398
350
4.270
2.200
2.070
0.0010
0.0044
1.36
67
3.50
49.8
2.35
110.1
45.8
Wet weight:
100.0
Dry weight:
98.0
Tare weight:
58.0
Initial moisture = 5.0
R-Value at 400 psi exudation pressure = 56.6
Expansion pressure at 400 psi = 1.60
80
4
60
3
40
2
20
1
3
15
60.0
5.7
15.0
7539
600
2.610
0.000
2.610
0.0000
0.0069
2.76
2
2.70
98.7
2.40
130.0
98.6
0
100
200
300
400
500
600
0
800
700
Exudation Pressure - psi
Resistance R-Value and Expansion Pressure - AASHTO T 190
Compact.
No.
Pressure
psi
Density
Moist.
pcf
%
Expansion
Horizontal
Sample
Exud.
Pressure
Press. psi
Height
Pressure
psi
@ 160 psi
in.
psi
R
R
Value
Value
Corr.
1
5
79.7
5
0.68
158
2.30
150
1
0.9
2
10
110.1
10.0
1.36
67
2.35
350
49.8
45.8
3
15
130.0
15.0
2.76
2
2.40
600
98.7
98.6
TEST RESULTS
R-value at 400 psi exudation pressure =56.6
MATERIAL DESCRIPTION
Exp. pressure at 400 psi exudation pressure =1.60 psi
Material Description
Line 2
Line 3
Project No.: Project #
Tested by: ERK
Project: Project 1
Project 2
Location: STA 132+005
Checked by:ALV
Date: 8.31.01
R-VALUE TEST REPORT
DEMONSTRATION USE ONLY
Expansion Pressure (psi)
Location:
Sample Number:
Material Description:
10/3/01
Project #
Project 1
Project 2
STA 132+005
SAMPLE 1
Material Description
Line 2
Line 3
ERK
ALV
Received on: 27.Aug.01
Tested on: 29.Aug.01
5
R-value
Date:
Project No.:
Project No.:
100
DEMONSTRATION USE ONLY
Copyright © 2001 Von Gunten Engineering Software, Inc.
363 West Drake #10
Fort Collins, CO 80526
www.geosystemsoftware.com
Remarks:
Received
on:
27.Aug.01
Tested
on:
29.Aug.01
Plate No F23
Information in this document is subject to change without notice and does
not represent a commitment on the part of Von Gunten Engineering Software,
Inc. The software described in this document is furnished under a license
agreement, and the software may be used or copied only in accordance with the
terms of that agreement. The licensee may make copies of the software for
backup purposes only. No part of this manual may be reproduced in any form
for purposes other than the licensee’s personal use without the written consent
of Von Gunten Engineering Software, Inc.
Copyright © Von Gunten Engineering Software, Inc. 2001. All rights reserved.
Published in the United States of America.
GEOSYSTEM® is a registered trademark of VES, Inc.
Windows® is a registered trademark of Microsoft Corporation
Terms of License Agreement
1. The Licensee agrees not to sell or otherwise distribute the program or
the program documentation. Each copy of the program is licensed only
for use at a single address.
2. The Licensee agrees not to hold Von Gunten Engineering Software,
Inc. (VES, Inc.) liable for any harm, damages claims, losses or
expenses arising out of any act or occurance related in any way to the
use of the program.
3. The program is warranted to fully perform the tasks described in the
program documentation. All results of the operation of the program are
subject to the further engineering judgment , prudence, and study of
the user.
4. If the program does not perform as described, VES, Inc. will replace
the program or refund the fee paid in the licensing agreement, at its
option. In no event will VES, Inc. be liable for any amount greater than
the total of the license fee or fees paid by the licensee.
5. One year of free consultation and updates is included with the
program. In subsequent years, updates will be available, for a fee, at
the user’s option.
1.
1.1
INTRODUCTION, INSTALLATION AND SETUP................................... 1
INSTALLATION........................................................................................ 1
1.2 CONFIGURING R-VALUE ....................................................................... 2
1.2.1 Margins ........................................................................................... 4
2.
WALKTHROUGH .................................................................................. 5
3.
DATA ENTRY........................................................................................ 7
3.1
4.
4.1
5.
DELETING R-VALUE DATA .................................................................. 10
CURVE VIEWING AND SHAPING ...................................................... 11
RESHAPING THE CURVES ..................................................................... 12
PRINTING REPORTS.......................................................................... 13
5.1
EXPORTING CHARTS OR SUMMARIES TO AUTOCAD FILES ....................... 14
5.2
EXPORTING CHARTS OR SUMMARIES TO .WMF FILES ............................. 17
5.3
LISTING RESULTS FROM MULTIPLE R-VALUE TESTS................................. 18
6.
TECHNICAL SPECIFICATIONS.......................................................... 19
6.1
MOISTURE CONTENT ........................................................................... 19
6.2
DRY DENSITY ...................................................................................... 20
6.3
EXPANSION PRESSURE ........................................................................ 20
6.4
R-VALUE ............................................................................................. 21
6.5
CORRECTED R-VALUE .......................................................................... 21
6.6
METRIC CONVERSION FACTORS ............................................................ 21
6.7
VALUES AVAILABLE FOR DATA SUMMARIES ............................................ 22
=
=
=
oJs^irb=rëÉêÛë=dìáÇÉ=
1.Introduction, Installation and Setup
The GEOSYSTEM Resistance R-value module (R-VALUE) is designed to reduce
laboratory data from a resistance R-value and/or expansion pressure test. Following is a list of
supported features:
⇒
⇒
⇒
⇒
⇒
⇒
⇒
ASTM D 2844, AASHTO T190 and California Test 301 test standards.
Both English and SI (metric) units.
Utilizes the GEOSYSTEM Data Manager program (GDM) for file handling:
project information such as the project name and number is entered only
once per project. GDM can be used to created printed lists of all of the RVALUE tests performed for a given project.
Entry of either exudation load or exudation pressure.
Interactive modification of the R-value vs. expansion pressure and exudation
vs. expansion pressure curves.
Printed summary lists all testing data and results.
Report export to .WMF (word-processor picture) and .DXF (CAD) files.
Since R-VALUE utilizes the GEOSYTEM Data Manager program (GDM) or LD4 package
for all file handling, the user should review the GDM or LD4 manuals before proceeding.
1.1 Installation
By itself, R-VALUE is not a complete system; the program must be installed into a hard
disk or network subdirectory that already contains a copy of the Data Manager or LD4 (Drilling
Log) packages. (To enter a new R-VALUE test, you must first use the Data Manager or LD4
package to open or create a project file.)
⇒
If you haven’t licensed the Drilling Log package (LD4), R-VALUE requires the
GEOSYSTEM for Windows Data Manager (GDM) software, version 2 or
later. GDM version 2 is supplied on two 3.5 inch discs, where version 1.x
was supplied on a single disc. If you have a version 1.x disc (version 1.x
disks were labeled “Data Manager”, but did not list a version number), please
dispose of it and install the new set of GDM disks that were sent with your RVALUE order.
N=
fåíêçÇìÅíáçåI=fåëí~ää~íáçå=~åÇ=pÉíìé=
If your R-VALUE disk wasn’t installed when you installed your Data Manager package,
use the following steps to install the software:
1. Insert your R-VALUE disk into drive A:
2. Click on your Windows “Start” button then select Run
3. At the following dialog, type A:SETUP then press Enter
4. The installation program should say that an existing GEOSYSTEM for Windows
package has been found: make sure that you install into the directory that the
program suggests. (If the installer doesn’t find an existing package, make sure that
you’ve installed the Data Manager or LD4 packages before continuing, then make
sure to install R-VALUE into the same subdirectory.)
1.2 Configuring R-VALUE
R-VALUE includes support for a few different testing procedures – before typing in your
first test set you should make sure that the package is correctly configured. To do this, start up
your GEOSYSTEM for Windows package (refer to either the GDM or LD4 manuals for
instructions) then select Options > R-VALUE Setup, which displays the following dialog:
Figure 1.2.1 -- R-VALUE Configuration Dialog
⇒
=
Test procedure - selects the type of test performed. This has no effect on RVALUE's calculations; it merely changes how the test is labeled on hardcopy
reports and, for the Cal. Test 301 method, changes the direction of the
exudation pressure scale on the R-value vs. pressure chart to be from high
pressures on the left side to low pressures on the right side.
O
oJs^irb=rëÉêÛë=dìáÇÉ=
⇒
Exudation pressure for R-value result -- selects a pressure point on the Rvalue vs. exudation pressure curve drawn from your testing data: a vertical
line is drawn at the selected pressure and the intersection of that line with the
testing data curve is reported in the "TEST RESULTS" box on the hardcopy
report (e.g., R-value @ 300 psi exudation pressure = 21.0).
Typically, 300 psi or 2070 kPa is used.
⇒
⇒
⇒
⇒
⇒
⇒
Mold weight is entered in -- allows entry of the weights for the sample and
mold used for the R-value test to be in either grams or decimal pounds. This
selection does not affect the units used for the moisture content test weights,
which always entered in grams.
Data entry requires -- For the exudation portion of the test, you have the
option of entering either the exudation load or the exudation pressure at each
test point. (If you enter exudation loads, R-VALUE will calculate the
exudation pressure; if you enter exudation pressures, R-VALUE will backcalculate the applied load.)
Expansion readings entered as – Selecting “inches or mms.” means that
you will be entering expansion readings as inches or millimeters (depending
upon what measurement units are to be used with your project); selecting
“number of divisions” means that you will be entering readings directly as
they are shown on the deflection gauge: a 0.0100 inch deflection will be
entered as 100.
US expansion pressures -- Expansion pressures calculated in projects
entered with US (English) units may be reported as either PSF or PSI.
Report R-value to nearest -- R-values may be reported as either whole
numbers or to the nearest 1 decimal place.
Initial moisture test then measure water added or Full moisture content
test on each sample - R-VALUE supports two methods for obtaining the
moisture content of each test sample: either A) a full moisture content test
may be run on each test sample, or B) a single moisture content test may be
run on a representative sample and then the amount of water added to each
test sample prior to R-value testing is measured and recorded. The amount
of water added to each test sample is added to the original moisture content
value to obtain the moisture content of the test sample.
P=
fåíêçÇìÅíáçåI=fåëí~ää~íáçå=~åÇ=pÉíìé=
⇒
Plot expansion vs. exudation curve - In addition to plotting the R-value vs.
exudation pressure curve, the package can optionally (if this selection is
checked and expansion pressure data were taken for the sample) plot a
curve of expansion pressure vs. exudation pressure.
A note regarding units: R-VALUE determines whether you are entering metric
or Imperial data based upon the "Dimension Units" setting in LD4 or GDM. To
change the unit selection, use the Data Manager package to open the project in
question then, from the following screen, select Project > Dimension Units.
1.2.1 Margins
R-VALUE features two printed reports: one that summarizes your raw testing data in a
tabular format (the summary report) and a second that reports the program’s calculated results
and includes a chart of the R-value vs. exudation pressure and expansion vs. exudation pressure
curves (the chart report). (Chapter 5 includes samples of both report styles, along with directions
on printing the reports.) You can change both report type’s margins (the whitespace between the
sides of the page and the borders around the report) by clicking on the Margins tab of the Setup
dialog (Options > R-VALUE Setup): doing so displays a window similar to the one shown in
Figure 1.2.2.
Figure 1.2.2 -- Report Margins Selection
⇒
⇒
=
Select margins for – This drop-down box selects for which of the two report
types (summary or chart) the margin changes will apply. Prior to entering
new margins, make sure that this box shows the appropriate report.
Top, Left, Right and Bottom – The measurement units that are used for the
report margins (inches or centimeters) are determined by the Regional
Options in your Windows Control Panel.
Q
oJs^irb=rëÉêÛë=dìáÇÉ=
2.Walkthrough
Before discussing R-VALUE’s capabilities in-depth, we’ll introduce the package by
providing a step-by-step walkthrough of the data entry process.
1. Start the GEOSYSTEM for Windows package: If you have a “GEOSYSTEM” shortcut
on your desktop, double-click on it; you can also click on your “Start” button and
select Programs > GEOSYSTEM for Windows.
2. On the left side of the program’s screen is a directory box: navigate to the directory
where the GEOSYSTEM software is installed. (If you’ve installed the software onto
your own hard disk, this will probably be either C:\GEOSYS or C:\PROGRAM
FILES\GEOSYS.)
3. In the program directory you’ll find a file called DEMO: double-click on it.
4. The software should display the contents of the DEMO project. On the left side of the
screen is a yellow box listing the material sources from which DEMO’s testing
samples were taken: double-click on “Boring B-4”.
5. On the right side of the screen you should see a list of samples taken from B-4: find
the data entry card for sample “S-3” and click on the R-VALUE link for that card.
6. You should see the R-VALUE data entry screen depicted in Figure 1.2.1. Select
Options > R-VALUE Setup. In order for the tutorial to work, there are several
important settings that must match the ones shown below:
Exudation pressure for R-value result: 300
Mold weight is entered in: lbs.
Data entry requires: Exudation Load
US expansion pressures: PSF
7. Make sure that Full moisture content test on each sample and Plot expansion
vs. exudation pressure curve are both checked then click on the OK button.
8. Enter the following information:
Figure number: A-4
Tested by: ALV
Checked by: JWD
Testing remarks: Sample recovered using 6 in. auger
9. From the Testing remarks field, hit Tab twice. (You’re skipping over the Spring
steel bar k-value field, which will be left blank. Check Chapter 2 if you want more
information on the k-value field.)
R=
t~äâíÜêçìÖÜ=
10. The cursor should be in the Compaction pressure row for test point number 1: Enter
the following data (after entering each cell’s data, you can press the Enter or down
arrow keys to proceed to the next cell):
Specimen number
Compaction
pressure
Wet weight
Dry weight
Tare weight
Exudation load
Total weight
Mold weight
Initial expansion
Final expansion
Ph
D turns
Height
1
2
3
700
250
100
699.7
647.1
220.9
4150
7.1
4.6
0.0000
0.0007
109
4.92
2.59
666.7
622.4
223.1
7700
7.0
4.6
0.0000
0.0012
82
4.12
2.37
639.8
590.3
224
3200
6.9
4.6
0.0000
0.0004
124
4.74
2.34
11. Next we’ll check the curves: select Window > Curve or just hit function key F3. RVALUE should display two curves; the one passing through the circular markers plots
R-value vs. exudation pressure while the one passing through the square markers
plots expansion pressure vs. exudation pressure.
12. Try reshaping the curves: select Curve > Shape R-value Curve or Shape Expansion
Curve then select Curve > Add Shaping Point. Move your mouse cursor somewhere
within the graph then click the left mouse button.
You can also replace an existing point: Move your cursor directly above or below an
curve point (remember, if you’re shaping the R-value curve, the curve points are
circles; if you’re shaping the expansion vs. exudation pressure curve, the points are
squares) then click your left mouse button. The curve should be redrawn passing
through the point where your mouse was when you clicked the left button – it should
no longer pass through the test point.
13. Return both curves to their original shapes by selecting Curve > Return to Original.
14. Check on how the printed reports will appear by pressing function keys F4 then F5.
15. Select R-VALUE > Data Summary then click on the Output button. When the
summary has been printed, select R-VALUE> Chart and again click on Output.
16. Finally, if you want to try exporting data to an AutoCAD file, begin by selecting either
R-VALUE > Data Summary or R-VALUE > Chart. Drop down the box next to Output
to and select “AutoCAD .DXF File” then change the Place files in directory to
somewhere on your hard disk and click on the Output button.
=
S
oJs^irb=rëÉêÛë=dìáÇÉ=
3.Data Entry
Data entry for R-VALUE is begun by filling in a data entry card on the LD4 or Data
Manager screen:
1. Create or open a project file (see Sections 2.1 and 2.2 in the GDM manual or, if
you’ve licensed LD4, Sections 2.3 and 2.4 in the LD4 User’s Guide).
2. Create or open a material source folder (see Sections 2.5 and 2.9 in the GDM
manual or Sections 2.7.1 and 2.7.2 in the LD4 User’s Guide).
3. Locate a data entry card for the sample and fill in the sample’s identifying information
(see Section 2.6 in the GDM manual or Section 2.9 in the LD4 User’s Guide).
4. Click on the R-VALUE link at the bottom of the sample’s data entry card (see Section
2.7 in the GDM manual or Section 6.1 in the User’s Guide).
R-VALUE’s data entry screen is shown below:
Figure 1.2.1 -- R-VALUE Data Entry Screen
T=
a~í~=båíêó=
R-VALUE supports three and four point tests. Movement through the data entry prompts
is by the Tab and Shift-Tab keys – within the test data grid (on the right side of Figure 1.2.1), use
the up and down arrow keys. The program’s data entry fields are listed below:
⇒
⇒
Figure number – whatever is typed into this field is printed at the lower-right
corner of the program’s chart report (see Chapter 5). Note that the printout
may not read “Figure No.”: the title may be changed through the GDM’s
Setup dialog (see Section 1.7 in the GDM manual or Section 1.5.1 in the LD4
User’s Guide).
Steel bar spring k-value -- is the pressure required to deflect the expansionpressure apparatus' spring-steel bar 1 inch or 1 mm. For projects using US
units, the value is expressed in psi, and defaults to 303 (dead-center of
ASTM/AASHTO's recommended calibration range) if no value is entered. For
projects using SI units, this value is expressed in kPa and defaults to 82.3
(303 psi/inch converted to kPa per mm).
If you did not perform the recommended calibration, leave this field
blank.
⇒
⇒
⇒
⇒
=
Initial Moisture Content Wet weight (grams), Dry weight, Tare weight -these prompts are only enabled if you've selected Initial moisture test then
measure water added from the program's Setup dialog (Options > Setup).
The prompts provide the program with a baseline moisture content for the
original sample from which every R-value test sample was taken.
Compaction pressure -- this is the pressure at which water was exuded
from the specimen.
Wet weight, Dry weight, Tare weight -- moisture content test weights. The
"Wet" and "Dry" weights should include both the sample and tare weight.
(These prompts are only visible if you've selected Full moisture content
test on each sample from the program's Setup dialog.)
Prepared weight -- is the weight of the R-value test sample, prior to mixing
with water. This prompt is only visible if you've selected Initial moisture test
then measure water added from the program's Setup dialog.
U
oJs^irb=rëÉêÛë=dìáÇÉ=
⇒
⇒
⇒
⇒
⇒
⇒
⇒
⇒
⇒
⇒
Water added -- this is the amount of water added to the initial R-value test
sample prior to running the test. This value is added to the original sample's
moisture content to obtain the moisture content of the test sample.
Exudation load, Exudation pressure -- for the exudation portion of the test,
you have the option of entering either the exudation load or the exudation
pressure at each test point. (If you enter exudation loads, R-VALUE will
calculate the exudation pressure; if you enter exudation pressures, R-VALUE
will back-calculate the applied load.) To swap from entering exudation load to
exudation pressure or vice versa, select Options > Setup.
Total weight -- this is the weight of the R-value exudation test sample, plus
the mold.
Mold weight -- this is the weight of the mold used for the exudation test.
Initial expansion -- this is the reading on the dial indicator at the start of the
expansion test.
Final expansion -- this is the reading on the dial indicator at the end of the
expansion test.
Ph -- is the horizontal pressure at the specified vertical load (2000 lbf or 8900
N).
D turns -- is the number of turns of the stabilometer pump handle required to
raise the horizontal pressure from 5 to 100 psi (34 to 690 kPa).
Height -- is the height of the R-value test sample, which must be between
2.3 and 2.7 inches (58.4 and 68.5 mm).
Corrected R -- is determined from the calculated test point R-value by
making an adjustment for samples that are less than 2.45 inches (62 mm) or
greater than 2.55 inches (65 mm) tall. (Section 6.5 covers R-VALUE’s
correction calculations.)
V=
a~í~=båíêó=
3.1 Deleting R-VALUE Data
To remove all of the data that you’ve entered for a test, refer to Section 2.8 in the GDM
manual or Section 6.2 in the LD4 User’s Guide.
=
NM
oJs^irb=rëÉêÛë=dìáÇÉ=
4.Curve Viewing and Shaping
After completing the entry of testing data, you’ll want to check the R-value vs. exudation
pressure and expansion pressure vs. exudation pressure curves: data entry errors are often
highlighted from a quick glance at these curves. To show the curves, click on the Curve tab on
the bottom of the screen, or select Window > Curve or just press function key F3.
Figure 3.1.1 -- Curve Preview Screen
⇒
The curve with the circular markers plots R-value vs. exudation pressure; the
square marker curve shows expansion pressure vs. exudation pressure.
(The latter curve won’t be displayed unless you’ve selected Plot expansion
vs. exudation curve from the program’s Setup dialog as discussed in
Section 1.2.)
NN=
`ìêîÉ=sáÉïáåÖ=~åÇ=pÜ~éáåÖ=
4.1 Reshaping the Curves
If one of the two curves isn’t drawn as desired it may be reshaped:
1. Select Curve then either Shape R-value Curve or Shape Expansion Curve. (You can
tell which curve is currently selected for shaping by looking at the toolbar on the left
of the screen, where buttons with a circle and a square on them are shown – the
button that is depressed indicates the curve that is selected for shaping.)
2. Select Curve > Add Shaping Point.
3. Move your mouse cursor to a point through which the curve is to pass, then click the
left mouse button.
In addition to forcing the curve to pass through a new point, you can also replace one of
the original testing points:
1. Select which curve is to be shaped (Curve > Shape R-value Curve or Shape
Expansion Curve).
2. Select Curve > Add Shaping Point.
3. Move the mouse so that it is directly over or under the testing point to be replaced –
vertically, the mouse should be at the new location for the curve.
4. Click the left mouse button when you have the mouse located correctly. The actual
testing point will not be moved; rather, the curve will no longer pass through the
point.
To delete a shaping point:
1. Select either Curve > Shape R-value Curve or Shape Expansion Curve.
2. Select Curve > Delete Shaping Point.
3. If the curve had just a single shaping point, you’re done. Otherwise, you’ll need to
indicate which point is to be deleted: move the mouse cursor over the point to be
removed then click the left mouse button
⇒
=
You can return a curve to its original shape by selecting either Curve >
Shape R-value Curve or Shape Expansion Curve then selecting Curve >
Return to Original.
NO
oJs^irb=rëÉêÛë=dìáÇÉ=
5.Printing Reports
R-VALUE plots two varieties of reports, depicted below:
R-VALUE TEST REPORT
RESISTANCE R-VALUE TESTING RESULTS
(AASHTO T 190)
Tested by:
Checked by:
Remarks:
Test specimen number
Compaction pressure (psi):
Prepared weight (grams):
Water added (ml.):
% Moisture:
Exudation load (lbs.):
Exudation pressure (psi):
Total weight (lbs.):
Mold weight (lbs.):
Sample weight (lbs.):
Initial expansion (in.):
Final expansion (in.):
Expansion pressure (psi):
Ph at 2000 lbs.:
D turns:
R:
Height (in.):
Dry density (pcf):
Corrected R:
1
5
100.0
0.0
5.0
1884
150
3.830
2.430
1.400
0.0025
0.0042
0.68
158
3.00
1.0
2.30
79.7
0.9
2
10
1000.0
47.6
10.0
4398
350
4.270
2.200
2.070
0.0010
0.0044
1.36
67
3.50
49.8
2.35
110.1
45.8
Wet weight:
100.0
Dry weight:
98.0
Tare weight:
58.0
Initial moisture = 5.0
R-Value at 400 psi exudation pressure = 56.6
Expansion pressure at 400 psi = 1.60
80
4
60
3
40
2
20
1
Expansion Pressure (psi)
Location:
Sample Number:
Material Description:
10/3/01
Project #
Project 1
Project 2
STA 132+005
SAMPLE 1
Material Description
Line 2
Line 3
ERK
ALV
Received on: 27.Aug.01
Tested on: 29.Aug.01
5
R-value
Date:
Project No.:
Project No.:
100
3
15
60.0
5.7
15.0
7539
600
2.610
0.000
2.610
0.0000
0.0069
2.76
2
2.70
98.7
2.40
130.0
98.6
0
100
200
300
400
500
600
0
800
700
Exudation Pressure - psi
Resistance R-Value and Expansion Pressure - AASHTO T 190
Compact.
No.
Pressure
psi
1
5
2
10
3
15
Expansion
Horizontal
Sample
Exud.
Pressure
Press. psi
Height
Pressure
psi
@ 160 psi
in.
158
2.30
150
1
0.9
1.36
67
2.35
350
49.8
45.8
2.76
2
2.40
600
98.7
98.6
Density
Moist.
pcf
%
79.7
5
0.68
110.1
10.0
130.0
15.0
TEST RESULTS
R-value at 400 psi exudation pressure =56.6
psi
Material Description
Line 2
Line 3
Project No.: Project #
Tested by: ERK
Project: Project 1
Project 2
Location: STA 132+005
Checked by: ALV
R-VALUE TEST REPORT
Corr.
Remarks:
Received
on:
27.Aug.01
Tested
on:
29.Aug.01
DEMONSTRATION USE ONLY
DEMONSTRATION USE ONLY
Value
MATERIAL DESCRIPTION
Exp. pressure at 400 psi exudation pressure =1.60 psi
Date: 8.31.01
R
R
Value
Plate No F23
Figure 4.1.1 -- R-VALUE Testing Data Summary and Chart Reports
These reports may be previewed on-screen, printed to a printer, or exported into a CAD
file (.DXF) or word-processor picture file (.WMF).
⇒
⇒
⇒
To preview the testing data summary you can either: right-click on the
R-VALUE link at the bottom of your sample’s data entry card from the Data
Manager or LD4 screens (see Section 2.7 in the GDM manual or Chapter 6
in the LD4 manual) and select Summary Preview, or you can click on the
Summary tab at the bottom of the R-VALUE data entry screen, or select
Window > Data Summary Preview.
To preview the testing chart report you can either: right-click on the
R-VALUE link at the bottom of your sample’s data entry card from the Data
Manager Screen and select Report Preview, or you can click on the Chart
tab at the bottom of the R-VALUE data entry screen, or select Window >
Data Chart Preview.
To print the data summary or chart report: select either R-VALUE >Data
Summary or R-VALUE > Chart then click on the Output button.
NP=
mêáåíáåÖ=oÉéçêíë=
5.1 Exporting Charts or Summaries to AutoCAD Files
The testing data summary and chart reports depicted in Figure 4.1.1 may be exported to
AutoCAD-compatible .DXF files, which provides a handy, compact means of supplying reports to
clients. To do this, select either R-VALUE >Data Summary or R-VALUE > Chart. Either selection
displays the dialog shown below:
Figure 5.1.1 -- Output Options Dialog
Drop down the Output to: box and select “AutoCAD .DXF File”. You’ll see the following
dialog:
Figure 5.1.2 -- AutoCAD File Export Dialog
When creating .DXF files there are a number of options available:
⇒
=
Base file name -- when R-VALUE creates your .DXF file, the file’s name will
start out with whatever you enter into this field.
NQ
oJs^irb=rëÉêÛë=dìáÇÉ=
⇒
Add sample number/location to file name -- Without this option, RVALUE’s .DXF file names will be whatever you’ve selected as the Base file
name, plus something like “ page 1” at the end. Using Figure 5.1.2 as an
example, if the Add sample number/location to file name option wasn’t
selected, the first chart report exported would be named P92321 page
1.DXF, the second chart report exported would be named P92321 page
2.DXF and on. A client looking at a list of submitted .DXF files would have
no way of telling which .DXF file corresponds to which tested sample.
Checking the Add sample number/location to file name box alters how RVALUE names the .DXF files: the program adds the sample number and/or
sampling location to the Base file name. Using our previous example, with
the box checked, R-VALUE would create, for example, CAD files named
P92321 Sample S-4_Boring B-3.DXF
P92321 Sample S-1_Test Pit TP-2.DXF
etc.
Between Base file name and Add sample number/location to file name,
you can come up with some useful options. For example, you could leave
Add sample number... unchecked and enter the sample number/location as
part of the Base file name – of course, this means that when you export the
next chart, you’d have to change the Base file name to reflect the new
sample
number.
As another example, if you’ve created a hard disk subdirectory just to hold
.DXF files for a given project, you may not need to include the project
number as part of each .DXF file name: instead of being called, for example,
P92321 Sample S-4_Boring B-3.DXF
(P92321 being the project number), by leaving the Base file name field
blank you can get export files with names like
Sample S-4_Boring B-3.DXF
⇒
⇒
Place files in -- gives the directory where R-VALUE will place the exported
.DXF file.
Layer name -- specifies the name of the CAD drawing layer that will be
shared by all of the CAD files generated. Layer names may be any
combination of alphabetic and numeric characters -- however, many CAD
programs don’t like layer names that include spaces. ( MYLAYER is OK, MY
LAYER is not.) Since your chosen layer name will be repeated throughout
the .DXF files that R-VALUE creates, the shorter you make the name the
smaller your .DXF files will be.
NR=
mêáåíáåÖ=oÉéçêíë=
⇒
⇒
⇒
=
Binary -- R-VALUE also supports AutoDesk’s binary .DXF format. This
format, used by AutoCAD starting with version10, reduces the size of the
resulting .DXF files by 25 to 50 percent. Very few word processing or Paint
programs will work with binary .DXF files: If a graphics program will not
import an R-VALUE-generated .DXF file, re-generate the file after first
making sure that the Binary option is turned off.
TrueType -- normally, R-VALUE-generated .DXF files use a monospaced
font (similar to this) for everything on the form, meaning that .DXF reports
don’t look much like their printed counterparts. The TrueType option allows
you to generate .DXF files that look exactly like the printed versions -however, TrueType .DXF files are only supported on AutoCAD versions 14
and newer; additionally, many other drawing and CAD programs do not
support TrueType files.
Report is scaled in (inches/centimeters) -- R-VALUE-created .DXF files will
either measure either 10 units vertically (when scaled in inches) or 25.4 units
vertically (when scaled in centimeters). This selection doesn’t affect the
report’s appearance within the .DXF file; rather, it just affects the coordinates
given to each line and piece of text on the report.
NS
oJs^irb=rëÉêÛë=dìáÇÉ=
5.2 Exporting Charts or Summaries to .WMF Files
R-VALUE charts and data summaries may also be exported to .WMF (Windows
MetaFile) files – these files are easily imported into word processors and drawing programs. To
do this, select either R-VALUE >Data Summary or R-VALUE > Chart. Either selection displays
the dialog shown in Figure 5.1.1. Drop down the Output to: box and select “Windows Metafiles”.
You’ll see a dialog like the one below:
Figure 5.2.1 -- .WMF File Export Dialog
See Section 5.1 for a discussion of the dialog’s prompts.
NT=
mêáåíáåÖ=oÉéçêíë=
5.3 Listing Results from Multiple R-value Tests
R-VALUE includes a sample data export/summary configuration file that may be used
with the Data Summary and Export tool discussed in Chapter 4 of the GDM manual and Appendix
C of the LD4 User’s Guide. The configuration file, called R-VALUE.LFG, can be used by
selection Tools > Data Summary and Export from the GDM or LD4 menu, then selecting File >
Recall Existing Configuration and double-clicking on R-VALUE.LFG.
⇒
=
If you’ve purchased LD4, you can use R-VALUE.LFG to view an on-screen
list of the R-value tests performed for a project: From the LD4 screen, select
Project > Browse and choose R-VALUE.
NU
oJs^irb=rëÉêÛë=dìáÇÉ=
6.Technical Specifications
R-VALUE strictly follows the ASTM D 2844 standard for all of its calculations. AASHTO
T190 and California Test 301 (CT301) employ identical calculations – CT301 calculations being
specified in metric units.
⇒
When dealing with projects entered in metric units, R-VALUE converts all
data internally to English units and processes the results using D 2844’s
recommended calculation methods. A table of conversion factors is
presented at the end of this chapter.
The following sections detail the calculations performed by the software.
6.1 Moisture Content
WC =
where: WC
WW − WD
WD − WT
= the water content, in percent
WW
= the combined tare and moist soil weight (gms.)
WD
= the combined tare and dry soil weight (gms.)
WT
= the tare weight (gms.)
R-VALUE supports two methods for calculating the moisture content of individual test
samples – settings on the program’s Setup dialog (Section 1.2) determine which method is used.
One method requires that a complete moisture content determination be performed on each Rvalue test sample. The second method entails performing an initial moisture content test with a
representative soil sample then measuring the amount of water added to each R-value test
sample. The sample’s moisture content is then determined as follows:
WC =
where: WC
(100 + WCI) * M W
MS
= the R-value test sample water content, in percent
WCI
= the moisture content, in percent, of the original representative sample
MW
= the mass of the R-value test sample (gms.)
MS
= the mass of water added to the sample (gms.)
NV=
qÉÅÜåáÅ~ä=péÉÅáÑáÅ~íáçåë=
6.2 Dry Density
gms.
lb.
DD =
WC
MV * (1 +
)
100
WS * 453.59
where: DD
= dry density (pcf)
Ws
= the weight of the sample (gms.)
*453.59 = converts grams to pounds
MV = Hs *
where: MV
1
DM 2 * π
in3
*
4
12 * 12 * 12 ft3
= the test mold volume (ft3)
HS
= the height of the sample (in.)
DM
= the diameter of the mold (assumed to be 4 in.)
1
= converts from in3 to ft3
12 * 12 * 12
6.3 Expansion Pressure
P = (DF − DI) * k
where: P
= expansion pressure (psi)
DF
= the final reading on the expansion dial
DI
k
= the initial reading on the dial (usually 0)
= the spring constant of the steel deflection bar. Contrary to what the ASTM
specification might say, k is given in psi/in., not in psi/.001in.) R-VALUE uses
a default of 303, which is dead-center of ASTM’s recommended calibration table:
8
0.0021
(D M * D M * π / 4)
(8 psi deflects the bar 0.0021 inches)
=
OM
oJs^irb=rëÉêÛë=dìáÇÉ=
6.4 R-value
100
R = 100 − 25
.
160
*(
− 1) + 1
D
Ph
where: R
D
Ph
= resistance R-value
= the number of turns recorded on the stabilometer
= the horizontal pressure
Due to a continuing misprint in the ASTM standard, you will find that the above equation
does not match the specification. Our version is correct.
6.5 Corrected R-value
Strictly speaking, the R-value equation given in the last section is only valid for a test
sample that is 2.5 inches high. For samples between 2.3 and 2.45, and 2.55 and 2.7, the
program corrects the calculated R-values using a polynomial approximation to the D 2844
correction chart.
6.6 Metric Conversion Factors
The following metric conversion factors are utilized by the software:
centimeters per inch = 2.54
2
kPa per psf = 1000/(98.067*453.59*(2.54*12) )
3
3
kg/m per pcf = 1000/453.59*(.3048)
ON=
qÉÅÜåáÅ~ä=péÉÅáÑáÅ~íáçåë=
6.7 Values Available for Data Summaries
For each entered test, R-VALUE calculates several different values that may be used on
data summaries created by the GDM “Data Summary and Export” tool (see Chapter 4 in the Data
Manager manual or Appendix C in the LD4 User’s Guide). The following table lists the names
and a short description of all the calculated values provided by R-VALUE, plus those used during
data entry.
Item Name
RVALUE
RVEXP
RVTESTED_BY
Description
Resistance R-value at the exudation pressure selected from the
program’s setup dialog (see Section 1.2)
Expansion pressure corresponding to the exudation pressure selected
from the program’s setup dialog
Tester
RVCHECKED_BY
Report inspector
RV_REMARKS
Testing remarks
RV_SPRING
=
Spring steel bar k-value
OO
fåÇÉñ=
.
H
.DXF
.WMF
1, 14–16
1, 17
height
I
A
initial expansion
initial moisture test then...
installation
AASHTO
See test procedure
add sample number/location to file name
15
See test procedure
ASTM
See .DXF
AutoCAD
base file name
binary
keys
for moving around the screen
14
16
layer name
LD4
See test procedure
4, 13
8
See setup
9, 21
margins
metric
moisture content
mold weight
mold weight is entered in
P
Ph9, 21
place files in
plot expansion vs. exudation curve
prepared weight
15
3, 11
8
R
report is scaled in
report R-value to nearest
R-value
See units
3
20
1, 3, 9
3
16
3
21
S
select margins for
setup
SI See units
steel bar spring k-value
summary report
F
8
9, 20
See moisture content
4
2–4, 8, 9, 11
8, 20
4, 13
T
G
tare weight
test procedure
test results
1, 7, 13, 22
=
See setup
options
9, 21
3
See GDM. See GDM
18, 22
10
20
See units
8, 19
E
GDM
4
See units
3, 8, 9, 19
9
3
O
D
figure number
final expansion
full moisture content test...
16
1, 3, 7, 13
M
12
12
11–12
English
expansion curve
expansion pressure
exudation load/pressure
exudation pressure for R-value result
6, 8
L
C
D turns
data entry requires
Data Manager
data summary and export tool
deleting data
density
dimension units
dry weight
9, 20
See moisture content
1–2
K
B
California Test 301
chart report
compaction pressure
configuration
corrected R-value
curve
removing shaping modifications
replacing a point
viewing and adjusting
9
=
8, 19
1, 2, 19
3
fåÇÉñ=
total weight
TrueType
9
16
W
water added
wet weight
Windows metafile
word processor
U
units
US expansion pressures
=
1, 3, 21
3
=
9
8, 19
See .WMF
See .WMF