1
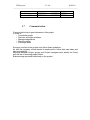
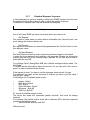
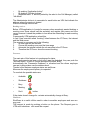
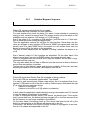
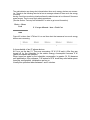
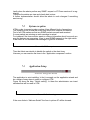
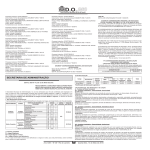
UTM project
– 23 / 98 –
06/06/10
_________________________________________________________________________
4.5
Gant diagram
Picture 4: Gantt diagram
Picture 4 is a bar chart called Gantt diagram. It shows a project schedule, the start
and finish dates of the terminal elements and summary elements of a project.
Terminal elements and summary elements comprise the work breakdown structure
of the project. UTM used Gantt charts to show current schedule status using percent-complete shadings and a vertical "TODAY" line.
UTM Gantt diagram is made up by 7 phases:
•
Project analysis
This phase gave to us an abstract idea about UTM scope and how it basic functionality.
•
Requirement Analysis
Here most the time was spent in research. The aim was to find as much information as we could. At the end of this phases we came out with several requirements
ready to be developed.
•
Design
In this phases we started to define each object and drew class diagram.
Moreover we defined class method and attributes.
•
Implementation
This is the part of the process where we actually program the code.
•
Verification
In this phases we tested the code already done.
Moreover it allow us to ensure that defect was recognized and corrected.
•
Validation