1
DbgPlot User Manual
Contents
1 Overview .................................................................................................................................................... 1
2 Quick Start ................................................................................................................................................. 4
2.1 Tutorial 1 .............................................................................................................................................. 4
2.2 Tutorial 2 ............................................................................................................................................ 10
3 Write a Client Program ............................................................................................................................. 13
3.1 Overview ............................................................................................................................................ 13
3.2 Plot Data ............................................................................................................................................ 13
3.3 Syncronize with DbgPlot Viewer ....................................................................................................... 16
3.4 Using Raw Data Replay Buffer .......................................................................................................... 18
4 DbgPlot Viewer ........................................................................................................................................ 20
4.1 Overview ............................................................................................................................................ 20
4.1.1 Plot Windows .............................................................................................................................. 21
4.1.2 Panels ......................................................................................................................................... 21
4.2 Browsing the Channels...................................................................................................................... 22
4.3 Opening Channels ............................................................................................................................. 22
4.4 Plot Window Layout ........................................................................................................................... 23
4.5 Name the Plot Window ...................................................................................................................... 24
4.6 Inspect the Channel Data in Detail .................................................................................................... 24
4.6.1 Zooming in/out in time ................................................................................................................ 24
4.6.2 Zooming in/out in amplitude ........................................................................................................ 24
4.6.3 Setting Grid ................................................................................................................................. 25
4.6.4 Setting Axis Label ....................................................................................................................... 25
4.6.5 Setting Color ............................................................................................................................... 25
4.6.6 Change coordinate system ......................................................................................................... 25
4.7 Using Display Data Replay Buffer ..................................................................................................... 26
4.8 Export data in Display Data Replay Buffer ........................................................................................ 26
4.9 Using Raw Data Replay Buffer .......................................................................................................... 26
4.10 Save and Load Debug Session ....................................................................................................... 27
5 DbgPlot API Reference ............................................................................................................................ 28
5.1 DebugPlotInit ..................................................................................................................................... 28
5.2 DebugPlotDeinit ................................................................................................................................. 28
5.3 TracebufferWriteData ........................................................................................................................ 29
5.4 TracebufferReadData ........................................................................................................................ 30
5.5 TracebufferClear ................................................................................................................................ 31
5.6 WaitForViewer ................................................................................................................................... 31
5.7 PauseViewer ..................................................................................................................................... 32
5.8 PlotLine .............................................................................................................................................. 32
5.9 PlotSpectrum ..................................................................................................................................... 33
5.10 PlotDots ........................................................................................................................................... 34
5.11 PlotText ........................................................................................................................................... 35
5.12 Log ................................................................................................................................................... 36
1 Overview
DbgPlot is a visualization tool that displays dynamic graphs generated by any program in real-time. The
program generates a graph, e.g., lines or scatter dots, by writing to a DbgPlot channel. Then, a DbgPlot
viewer can read from these channels and display the data on screen. Further, DbgPlot also provides a
replay buffer that allows a program to cache data. The cached data can be later read by the application
under the control of DbgPlot viewer. The replay buffer is useful when debugging, since the user can
reproduce the bug by feeding the exactly same data to the program.
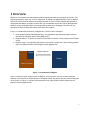
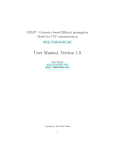
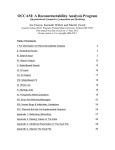
Figure 1.1 illustrates the architecture of DbgPlot tool. There are three main parts:
1. Client program (linked with DbgPlot library) – any application that generates graphic data and
write them to a DbgPlot channel using DbgPlot API.
2. DbgPlot channel – A channel is used for communication between a client program and a DbgPlot
viewer.
3. DbgPlot viewer – an application that reads from channels. It usually has a GUI to display graphic
data. Sora SDK provides a default DbgPlot viewer (dbgplot.exe).
Library
DbgPlot Channel
Viewer
Client Program
Figure 1.1 Architecture of DbgPlot
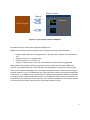
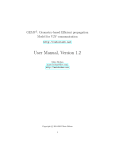
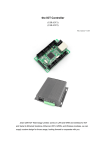
Figure 1.2 shows a typical usage scenario of DbgPlot. A client process can write to three separated
channels: two lines and one scatter dot plot. In a DbgPlot viewer, the graphic data are read and displayed
on the screen. In Figure 1.2, the two lines are plotted in one graph window, and the scatter dots are
plotted in another graph window.
1
DbgPlot Viewer
Channel
Plot Window
Client Program
Figure 1.2 Typical usage scenario of DbgPlot
Sora SDK provides a default viewer application (DbgPlot.exe).
DbgPlot.exe has following features that help users to display and analyze graph data easily.
Display multiple channels in one graph window – allowing user to compare these data side-byside.
Support zoom in/out in a graph window.
Customize the plot – color, scale, etc.
Support a display history. So user can move backward to review the history graph data.
DbgPlot library also supports a generic replay buffer to cache certain amount of data. DbgPlot.exe
provides a user interface that can control how data in the replay buffer are read by the client program.
The function is useful in debugging when a user wants to reproduce a bug, or step-by-step tracking the
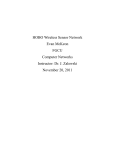
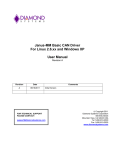
algorithm behavior. Figure 1.3 illustrates the use of the replay buffer. Assume a program that reads from
a data source, e.g., a DMA memory, and processes the data with some algorithm. With the replay buffer,
the program will first cache the data into the buffer, and the algorithm will then read from the buffer. The
read position of the replay buffer can be control by a user interface in dbgplot.exe. For example, the user
can rewind the read position or fast-forward it to any position inside the buffer.
2
Algorithm
Data source
Data
Source
Write (through API)
Writing Position
Data source
Data
Source
Algorithm
Reading Position
Read (through API)
Seek (through GUI)
Raw data
Figure 1.3 Illustration of the replay buffer
3
2 Quick Start
In this section, we provide two tutorial to demonstrate the basic use of DbgPlot tool. The source code of
the tutorial is in %SORA_ROOT%\src\dbgplot-sample.
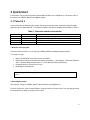
2.1 Tutorial 1
In this tutorial, we will walk through a simple client program that generates a sine wave signal and plot
graph through four data channels. The channels created in this sample program are described in Table 1.
Table 1. Channels created in the tutorial.
Type
Line
Line
Dots
Text
Name
real
imaginary
constellation
sample count
Descriptions
Line graph of real part of the generated sine wave signal.
Line graph of imaginary part of the generated sine wave signal.
Dots graph of the generated sine wave signal.
Text of current index of the data sample.
1. Build the client program
The source files for tutorial 1 are in directory %SORA_ROOT%\src\dbgplot-sample\sample1.
To compile tut1.cpp:
Make sure that WDK of the latest version is installed.
Start build environment command-line prompt: Start Menu -> All Programs -> Microsoft Research
Asia -> Software Radio Academic Kit 1.6 -> Sora Build Environment(Checked).
Change directory to find the source code.
Build with the command bcz.
> cd %SORA_ROOT%\src\dbgplot-sample\sample1
> bcz
>
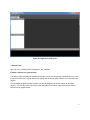
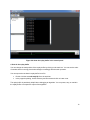
2. Start DbgPlot viewer
Start explorer, and go to %SORA_ROOT%\bin and double click DbgPlot.exe.
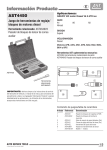
From the View menu, open Channel Explorer, Property Panel and Control Panel. You may drag and dock
these panels as you wish, for example, as in Figure .
4
Figure 2.1 DbgPlot.exe GUI layout
3. Start tut1.exe
Start tut1.exe in %SORA_ROOT%\target\chk_wxp_x86\i386.
4. Show a channel in a graph window
The channel exporer displays all available channels in a tree vew. Simply drag a channel label (e.g. real)
to the plot window area. A graph window will appear and shows the graph, which is now a sine wave line
(Figure ).
You can adjust the graph window’s position and size by dragging the window caption or the edges
(Figure ). You can also zoom in/out of the graph using the mouse wheel, while hovering your mouse
pointer over the graph window.
5
Figure 2.2 Display a channel in a graph window
Figure 2.3 Adjust a graph window
6
5. Using the play controls
Each plot window has some controls which you can use to control the channel data playback. There’s a
track bar for line/spectrum/dots type plot window. The grey bar represents the display history, while the
white rectangle represents the data currently displayed. You may seek to any history data by clicking on
the track bar. You can also press play/pause button to stop/resume the automatic playback. When
viewing history data, you can use the speed control buttons to speedup/slowdown the playback.
6. Create more graph windows
You can drag and drop other channels to create more graph windows, and adjust their layouts to fit the
plot area like in Figure .
Figure 2.4 Create more graph windows
7
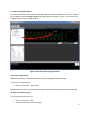
7. Display multiple channels in one graph window
You can drag and drop multiple channels into one graph windows. So you can compare two data series
side-by-side. For example, in Figure , two lines, real and imaginary, are displayed together in one
window. The caption of the graph windows reflects the data channels displayed.
You can choose a different color for each data channel:
Click the channel label (e.g., imaginary) in channel explorer.
Set the color property in the property window.
Figure 2.5 Display multiple channels in one graph windows
8
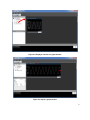
8. Create a sub-graph window
You can drag and drop a text channel into a graph window to create a text label for the plot. For example,
you can drag the channel sample count into the graph window as shown in Figure . You can also move
or adjust the size of the sub-graph window.
Figure 2.6 Create a text sub-graph window.
9. Use Auto Layout Panel
DbgPlot.exe provides an Auto Layout function for quickly arranging all graph windows.
To open the auto layout panel,
Click on menu View → Auto Layout.
Dragging the thumb of the track bar will tile all graph windows and change the window size accordingly.
10. Save and load the layout
You can save the layout into a file:
Click on menu File → Save.
Choose the file name to save the layout.
9
To load a layout from a file:
Click on menu File → Open.
Choose the file that contains a previously saved layout.
2.2 Tutorial 2
This tutorial demonstrates the use of the replay buffer. In this tutorial, we have a simple client program
that calculates the sum of the real and imaginary part separately from the input COMPLEX16 samples.
The results are displayed in a text log channel. The client program contains a data replay buffer. At the
beginning, the program stores samples into the replay buffer. Then, it reads from the replay buffer and
feeds the samples to the sum calculator. The sums are written to a text log channel periodically. The read
position of the replay buffer can be controlled by the DbgPlot viewer.
1. Build the tutorial client program
The source files for tutorial two are in directory %SORA_ROOT%\src\dbgplot-sample\sample2.
To compile tut2.cpp:
Make sure that WDK of the latest version is installed.
Start build environment command-line prompt: Start Menu -> All Programs -> Microsoft
Research Asia -> Software Radio Academic Kit 1.7 -> Sora Build Environment(Checked).
Change directory to find the source code.
Build with the command bcz.
> cd %SORA_ROOT%\src\dbgplot-sample\sample2
> bcz
>
2. Display channels
Start tut2.exe in %SORA_ROOT%\target\chk_wxp_x86\i386. Start DbgPlot.exe and adjust the layout as
Figure . Create a graph window that displays the log channel sum.
10
Figure 2.7 Display the sum in a text-log window.
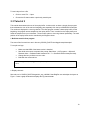
You will notice the track bar in the control panel displays an overview of samples in the replay buffer.
Hover your mouse on the track bar area in the control panel, wheel up to zoom in. (Figure ).
11
Figure 2.8 show the replay buffer in the control panel.
4. Seek in the replay buffer
You can change the read position of the replay buffer by clicking on the track bar. You can see the order
of number shown in the log plot window changes accordingly after the seek operation.
You can export the raw data in replay buffer into a file:
Double click the text tut2.exe(pid) left to the track bar.
In the popped up dialog, choose directory and file name and click on button save.
The replay buffer is particularly helpful when debugging an algorithm. You can pause, step, or rewind in
the replay buffer to compare the output of the algorithm.
12
3 Write a Client Program
3.1 Overview
DbgPlot library provides a series of APIs that client programs can use to accomplish the following tasks:
Output graphic data, e.g., lines, scatter dots or text. These data are read by the DbgPlot Viewer
and displayed on the screen.
Use the raw data replay buffer to cache raw data.
There are 4 categories of APIs:
Library initialization/cleaning up APIs: DebugPlotInit and DebugPlotDeinit. Client Programs call
DebugPlotInit to initialize the library, and calls DebugPlotDeinit to clean up resources allocated by
the library.
Plot data APIs: PlotLine, PlotDots, PlotSpectrum, PlotText and Log. Client Programs use these
APIs to write data to channels. These data are read by the DbgPlot Viewer and displayed on the
screen.
Syncronization APIs: WaitForViewer and PauseViewer. Client programs call WaitForViewer API
to wait for viewer to read the data. Client program call PauseViewer to pause the graphic data
playback in the viewer.
Raw data replay buffer APIs: TracebufferReadData, TracebufferWriteData, TracebufferClear.
Client programs call these APIs to use the raw data replay buffers associated with each client
process.
3.2 Plot Data
There are three types of graphic data that a client program can output: line, dots and text. The client
program and the DbgPlot Viewer communicate through channels. There are five types of channels: line,
dots, spectrum, text and log, each type has a corresponding plot data API.
Table 3.1 shows descriptions for each type of graphic data and the corresponding channels/APIs.
13
Table 3.1 Description of different types of graphic data
Type
Figure Illustration
Line
Dots
text
Description
Line defined by a series
of dots. Each dot is
represented by a 32 bits
integer value.
PlotLine
(line type channel),
A series of dots, each
represented by a
COMPLEX16 data
structure.
PlotDots
(dots type channel),
ASCII text data, each
character represented
by a char (1 byte)
APIs
PlotSpectrum
(spectrum type channel)
PlotText
(text type channel),
Log
(log type channel)
Note that there are two APIs, named PlotLine and PlotSpectrum, which can output line type graphic data.
Line type and spectrum type channels are different. When displayed on the screen, the x-axis of line type
channel represents the time. Data plotted in different function calls are connected to form a line. These
data are considered continuous on time. But for spectrum type channel, the data plotted by each call to
PlotSpectrum will output a frame of data graph. The number of dots outputted in one function call defines
how many data will be shown in one frame.
Note that there are two APIs, named PlotText and Log, which can output text type data. Text type and log
type channels are different. The data in text type channels are managed and stored in replay buffer in the
viewer, the text channel can be displayed in a sub plot window and synchronized with other channels in
the same plot window. While log type channel is for logging, the data is not stored in the replay buffer, but
in a separated list. Log type channel is not synchronized with other channels.
Each channel has a name, which is unique among all channels created by the same client process. The
name is used as the identifier for the channel. The first time a name is used when a plot data API is called,
a new channel is created. The channel can be accessed afterwards by using the same name and API.
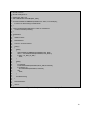
Figure 3.1 shows sample code to use plot data APIs.
Line 26: DebugPlotInit() is called before calling any other DbgPlot API. It does some library initialization
work.
Line 28: PrepareData function writes some data in the data buffer. Both lineDataBuf and dotsDataBuf are
filled with sine wave data.
14
Line 30~34: The five plot data APIs are called. The first parameters for these APIs are names of the
channel, which are used as the channel identifier. The rest of the parameters are different for each API.
You may refer to Chapter 5 for details.
Line 38: DebugPlotDeinit() is called to release all resources acquired by the DbgPlot library. It’s safe to let
your client process exit without calling this function.
1. #include <stdio.h>
2. #include <math.h>
3. #include "DebugPlotU.h"
4.
5. #define BUF_SIZE 128
6. static int lineDataBuf[BUF_SIZE];
7. static COMPLEX16 dotsDataBuf[BUF_SIZE];
8.
9. static void PrepareData()
10. {
11.
const int AMPLITUDE = 127;
12.
const int PERIOD = 32;
13.
const double PI_2 = 3.14;
14.
15.
for (int i = 0; i < BUF_SIZE; i++)
16.
{
17.
double phase
= i * PI_2 / PERIOD;
18.
dotsDataBuf[i].re = (short)(AMPLITUDE * cos(phase));
19.
dotsDataBuf[i].im = (short)(AMPLITUDE * sin(phase));
20.
lineDataBuf[i]
= dotsDataBuf[i].re;
21.
}
22. }
23.
24. int main()
25. {
26.
DebugPlotInit();
27.
28.
PrepareData();
29.
30.
PlotLine("line graph", lineDataBuf, BUF_SIZE);
31.
PlotSpectrum("spectrum graph", lineDataBuf, BUF_SIZE);
32.
PlotDots("circular", dotsDataBuf, BUF_SIZE);
33.
PlotText("text", "some text");
34.
Log("log", "We've done plotting");
35.
36.
getchar();
37.
38.
DebugPlotDeinit();
39.
40.
return 0;
41. }
Figure 3.1 Sample code to use Plot data API
15
3.3 Syncronize with DbgPlot Viewer
There are two APIs for client program/viewer synchronization: WaitForViewer and PauseViewer.
The client program may output graphic data so fast that the viewer doesn’t have enough time to consume
it. Because the internal buffer channel data is limited in size, plotting too fast may cause a data loss. To
prevent the data loss, the client program may choose to block until the Viewer read the data out from the
channel and make the channel data buffer empty. The API provided by DbgPlot library is WaitForViewer.
If the internal buffer channel is not full, the function simply returns. Otherwise, the function blocks until the
viewer read out the data from the data buffer.
Another API provided for Client/Viewer synchronization is PauseViewer. Call to PauseViewer will pause
all plot windows associated the current client program process.
Figure 3.2 shows sample code to use WaitForViewer and PauseViewer API.
The program plots data in a loop. This is similar to the common situation that the client programs plot data
much faster than viewer read the data, which may causes data loss if the client program doesn’t wait for
the viewer to read the data and empty the buffer.
Line 31: To insure that viewer has enough time to read the data and make the internal buffer empty,
WaitForViewer API is called. INFINITE is passed as the first parameter, indicates that the function will
block until viewer read the data. You can also specify a timeout value here instead.
Line 36: After the client program has called PlotLine for 5000 times, PauseViewer is called. After that,
user shall see that the pause button for all plot windows associated with current process is pressed. User
may press the play/pause button in the plot windows to resume the playback.
16
1. #include <stdio.h>
2. #include <math.h>
3. #include "DebugPlotU.h"
4.
5. #define BUF_SIZE 128
6. static int lineDataBuf[BUF_SIZE];
7.
8. static void PrepareData()
9. {
10.
const int AMPLITUDE = 127;
11.
const int PERIOD = 32;
12.
const double PI_2 = 3.14;
13.
14.
for (int i = 0; i < BUF_SIZE; i++)
15.
{
16.
double phase
= i * PI_2 / PERIOD;
17.
lineDataBuf[i]
= (int)(AMPLITUDE * cos(phase));
18.
}
19. }
20.
21. int main()
22. {
23.
DebugPlotInit();
24.
25.
PrepareData();
26.
27.
int numberOfWrites = 0;
28.
29.
while(numberOfWrites < 10000)
30.
{
31.
WaitForViewer(INFINITE);
32.
PlotLine("line graph", lineDataBuf, BUF_SIZE);
33.
numberOfWrites++;
34.
35.
if (numberOfWrites == 5000)
36.
PauseViewer();
37.
}
38.
39.
getchar();
40.
41.
DebugPlotDeinit();
42.
43.
return 0;
44. }
Figure 3.2 Sample code to use Client/Viewer synchronization API
17
3.4 Using Raw Data Replay Buffer
DbgPlot provides a replay buffer that allows a program to cache raw data. The cached data can be later
read by the application under the control of DbgPlot viewer. The replay buffer is useful when debugging,
since the user can reproduce the bug by feeding the exactly same data to the program.
For every client program process, DbgPlot allocates a raw data replay buffer. The buffer is 16 megabytes
in size. Three APIs are provided for accessing the raw data replay buffer: TracebufferWriteData,
TracebufferReadData and TracebufferClear.
TracebufferWriteData API writes data into the raw data replay buffer. The function appends the data at
the end and updates the internal write index. The raw data replay buffer is fixed sized. If buffer is full, the
write operation fails.
TracebufferReadData API reads data from the raw data replay buffer. The function reads data from the
current read index and updates the index. The read index can be controlled by user from the DbgPlot
Viewer UI. When the read index is equal to the write index, there are no more data to read and the
function fails.
TracebufferClear API clears the raw data replay buffer by setting both the read and write index to zero.
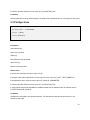
Figure 3.3 shows an example to use general replay buffer. The program defines a function to get raw
data from DMA, named GetSomeDataFromDMABuffer, and a function to process raw data, named
ProcessRawData. Instead of getting the raw data and processing them directly in a loop, the program
uses the raw data replay buffer to cache the raw data.
Line 26 ~ 32: The program gets the raw data and fills in the raw data replay buffer in a loop. The program
uses the full 16 megabytes capacity of the replay buffer and writes raw data to the buffer until it’s full.
Line 34 ~ 42: The program read the raw data out from the buffer and process in a loop. Note that, by
default the read index will automatically increase after each call to TracebufferReadData. But if user
wants to do a rewind and go back in time to process the old data, he can use the replay buffer track bar in
the viewer UI to control the read position.
18
1. #include <stdio.h>
2. #include <math.h>
3. #include "DebugPlotU.h"
4.
5. #define BUF_SIZE 128
6. static COMPLEX16 rawDataBuf[BUF_SIZE];
7.
8. void GetSomeDataFromDMABuffer(COMPLEX16 * buffer, int numSample) {
9.
// code for raw data fetching from DMA buffer
10. }
11.
12. void ProcessRawData(COMPLEX16 * buffer, int numSample) {
13.
// code for raw data processing
14. }
15.
16. int Manual3()
17. {
18.
HRESULT hRes;
19.
20.
DebugPlotInit();
21.
22.
Log("log", "program started");
23.
24.
while(1)
25.
{
26.
while(1)
27.
{
28.
GetSomeDataFromDMABuffer(rawDataBuf, BUF_SIZE);
29.
hRes = ::TracebufferWriteData(rawDataBuf, BUF_SIZE, 0);
30.
if (hRes == E_END_OF_BUF)
31.
break;
32.
}
33.
34.
while(1)
35.
{
36.
int numRead;
37.
TracebufferReadData(rawDataBuf, BUF_SIZE, &numRead);
38.
if (numRead > 0)
39.
ProcessRawData(rawDataBuf, numRead);
40.
else
41.
break;
42.
}
43.
44.
TracebufferClear();
45.
}
46.
47.
DebugPlotDeinit();
48.
49.
return 0;
50. }
Figure 3.3 Sample code to use raw data replay buffer
19
4 DbgPlot Viewer
4.1 Overview
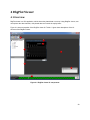
DbgPlot viewer is a GUI application, which shows the plotted data on screen. Using DbgPlot viewer, user
can explorer the data channels, view plotted data and control the replay buffer.
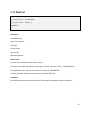
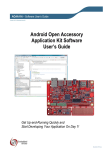
Figure 4.1 shows a snapshot of the DbgPlot viewer UI. Table 4.1 gives short descriptions of the UI
element of the DbgPlot viewer.
8
2
3
4
1
5
7
6
Figure 4.1 DbgPlot viewer UI components
20
Table 4.1 UI components
Index
Name
1
Plot window area
2
Plot window
3
Sub plot window
4
Channel Explorer Panel
5
Property Panel
6
7
8
Control Panel
Auto Layout Panel
Global Play Control Button
Function
Container for plot windows
Display data from replay buffer
Display data from text channel inside a plot window
View all processes/channels, open/close channels
Set properties for channels, plot windows and other
objects.
Control raw data replay buffer.
Quickly set the layout of all plot windows
Play/Pause all plot windows for the same client process
4.1.1 Plot Windows
Plot windows are child windows in the plot window area of the DbgPlot Viewer. Plot windows shows
graph of the channel data.
There’re five types of the plot windows:
Line
Spectrum
Dots
Text
Log
Multiple channels can be shown in a single plot window. But there are restrictions. For example, you
cannot show a line channel in a dots plot window. Refer to section 4.3 for detail of the restrictions.
Plot windows can contain sub plot windows. Sub plot windows are child window of the plot windows. It’s a
rectangle area where text type channel data can be displayed.
4.1.2 Panels
There are four panels: Channel Explorer, Property Panel, Control Panel and Auto Layout Panel.
Channel Explorer shows all the channels and the client processes as a tree view. User could use
channels to open/close a channel.
Property Panel allows users to view and set properties of a target object, e.g. channel, plot window, etc.
Control Panel allows user to access the raw data replay buffer, where user could control the raw data
feed to the algorithm.
Auto Layout Panel allows users to quickly set the layout of all plot windows.
21
4.2 Browsing the Channels
User can view all channels in channel explorer panel.
Check if the channel explorer is opened. If not, click View → Channel Explorer to open it.
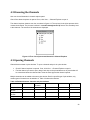
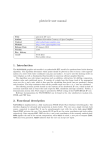
The channel explorer shows a tree view, as shown in figure 4.2. The top level is the client process which
creates the channels. The process is shown in a module name(process id) format. The secondary level
is the channels. The names of the channels are displayed.
Figure 4.2 Tree view of processes/channels in Channel Explorer
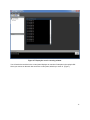
4.3 Opening Channels
Channel data are dawn in plot windows. To open a channel and put it in a plot window:
Check if channel explorer is opened. If not, click View → Channel Explorer to open it.
Find the channel you want to open, drag it and drop on the plot window area. A plot window will
be created and show the channel data. It has the same type as the channel opened.
Multiple channels can be added to the same plot window. But for a specific type of plot window, only
certain types of channels can be added to it. Table 4.2 shows the relations.
Table 4.2 Relation between channels and plot windows
line channel
spectrum
dots channel
channel
line plot window yes
no
no
spectrum plot
no
yes
no
window
dots plot
no
no
yes
window
text plot window no
no
no
Log plot window no
no
no
text channel
Log channel
yes
yes
no
no
yes
no
yes (only one)
no
no
yes (only one)
22
Besides the restriction shown in Table 4.2, another restriction is that channel created by different
processes cannot be shown in the same plot window.
When a text type channel is added to a plot window, a sub plot window is created. The sub plot window
shows the data in the text channel.
To create a sub plot window:
Check if channel explorer is opened. If not, click View → Channel Explorer to open it.
Find the text type channel you want to open, drag it and drop on a plot window. A sub plot
window will be created and show the channel data.
Channels can be closed. Closing a channel remove it from the plot window it is shown. If it is the last
channel in the plot window, the plot window will be closed.
To close a channel:
Check if Channel Explorer is opened. If not, click View → Channel Explorer.
Right click on the channel to be closed in the tree view.
In the context menu popped up, click close.
4.4 Plot Window Layout
Plot windows behave much like normal window in Windows OS. To move and resize a plot window:
Drag the caption area of the plot window to move it.
Drag the edge of the window to resize it.
Click the close button at the top right to close it.
Sub plot windows are shown inside plot windows. To move and resize a sub plot window:
Drag any place of the sub plot window to move it.
Drag the edge of the sub plot window to resize it.
A fast auto layout function is provided. Users use auto layout panel to quickly rearrange all plot windows
into a tile style layout. To do an auto layout:
Check if the Auto Layout Panel is opened. If not, open it by clicking View → Auto Layout Panel.
Drag the track bar in the auto layout panel to set the layout of all plot windows.
23
4.5 Name the Plot Window
Plot window has its default name:
modulename (process id):[name of channel 1][name of channel 2] …
where channel 1, channel 2 and etc. are all channels shown in the plot window.
Plot window gets its default name when it’s created. The default name changes after adding channel to
the plot window or removing channel from the plot window.
User can set a name for plot window to overwrite the default:
Check if Property Panel is opened. If not, click View → Property Panel to open it.
Click the plot window.
Set the name property in the Property Panel.
4.6 Inspect the Channel Data in Detail
4.6.1 Zooming in/out in time
You can zoom in to view details of the data or zoom out to view more data in the plot window.
For line type and dots type plot window, you can zoom in/out by setting the data count property in the
property panel:
Check if the property panel is shown. If not, click View → Property Panel to open it.
Click the plot window.
Set the data count in the property panel.
For line type and dots type plot window, you can zoom in/out with your mouse:
Hover the mouse pointer over the plot window.
Scroll up/down with the middle wheel to zoom in/out.
Text type, log type and spectrum type plot windows do not support zooming in/out in time.
4.6.2 Zooming in/out in amplitude
By detail, plot window use an auto scale algorithm to set the maximum/minimum value of a plot window.
You can disable auto scale and manually set the range.
Check if property panel is shown. If not, click View → Property Panel to open it.
Click the plot window.
Set the Auto Scale property to False in the property panel.
For line type and spectrum type plot window, set the Max Value and Min Value property; for dots
type plot window, set the Max Value property.
24
For spectrum type plot window, you can zoom in/out with your mouse:
Hover the mouse pointer over the plot window.
Scroll up/down to zoom in/out.
Text type and log type plot windows do not support zooming in/out in amplitude.
4.6.3 Setting Grid
For line type, dots type and spectrum type plot windows, you can choose to turn on/off the grid:
Check if the Property Panel is shown. If not, click View → Property Panel to open it.
Click the plot window.
In the property panel, set the value of Show Grid to True/False to turn on/off the grid.
Text type and log type plot windows do not support grid setting.
4.6.4 Setting Axis Label
For line type, dots type and spectrum type plot windows, you can setting label for the x/y-axis separately.
Check if the Property Panel is shown. If not, click View → Property Panel to open it.
Click the plot window.
In the property panel, set the value of X Label and Y Label.
4.6.5 Setting Color
Multiple channels may be shown in one plot window. Set different color for them may make the graph
look clearer.
To set the color of a channel:
Check if the Channel Explorer is shown. If not, click View → Channel Explorer to open it.
Check if the Property Panel is shown. If not, click View → Property Panel to open it.
Click the channel you want to set in the Channel Explorer.
Set the Color property in the property channel.
4.6.6 Change coordinate system
Two types of coordinate system are supported for line type and spectrum type plot window: general and
logarithm.
To change the coordinate system:
Check if the Property Panel is shown. If not, click View → Property Panel to open it.
Click the plot window.
Set the Coordinate property in the property panel.
25
4.7 Using Display Data Replay Buffer
Every channel has an associated display data replay buffer. Every 30ms, new data are read from the
internal channel data buffer channels and written into their associated replay buffers. The data are
appended to the end. If replay buffer is full, it is cleared and new data will be written from the beginning of
the buffer.
Colors in the track bar indicate different part of the replay buffer. The white rectangle represents which
part of the data in the buffer is currently displayed in the plot window.
Click the track bar to seek in the display data replay buffer.
Click the play/pause button to play/pause the data playback.
You can also call PauseViewer() API in the client program to pause the data playing. That is equivalent to
pressing the pause buttons for all the plot windows for the client process.
Play speed can be changed if user seeks in the track bar and views history data. To change the playing
speed:
Click speed up button to increase the speed.
Click speed down button to decrease the speed.
4.8 Export data in Display Data Replay Buffer
Data kept in replay buffer can be exported into plain text format file.
To export data:
Check if the Channel Explorer is shown. If not, click View → Channel Explorer to open it.
Right click the channel you want to export data to bring out a context menu.
For line/spectrum/dots type channel, select export all or export window. The export all menu item
export all data in the replay buffer for the channel, while export window menu item export data
currently displayed in the plot window. For text/log type channels, select export menu item.
Specify the file path in the save file dialog and click save.
4.9 Using Raw Data Replay Buffer
The control panel allows user to view and control raw data replay buffer. For each client process, control
panel displays a raw data track bar, which shows an overview of the raw data stored in the raw data
replay buffer. Average energy is calculated for each raw data sample.
Click View → Control Panel to open the control panel.
Click on the track bar to seek.
Hover the mouse pointer over the track bar and scroll up/down to zoom in/out.
26
Click the play/pause
button to play/pause the raw data read operation. If the raw data read operation is
paused, the next call to TracebufferReadData API will block.
Click the singlestep
button to perform a single step raw data read operation. After that, the next call to
TracebufferReadData will first set the read operation to pause state and then return.
4.10 Save and Load Debug Session
A debug session contains the following information: layout of the plot window, properties of the plot
windows and properties of all opened channels. The debug session can be saved into a file and loaded
later.
To save a debug session:
Click File → Save.
Choose directory and file name in the popped up dialog and click save.
To load a debug session file:
Click File → Open.
Browse to find the file in the popped up dialog and click open.
You may choose to load a debug session file first and then start the client process, or start the client
process first and then load the debug session file. In both cases, the viewer will match the channels with
the plot windows.
27
5 DbgPlot API Reference
5.1 DebugPlotInit
HRESULT DebugPlotInit();
Parameters
None
Return Value
If the function succeeds, the return value is S_OK.
If the function fails, the return value is -1.
Comments
The DebugPlotInit function initializes state of the DbgPlot library. Call this function before using other
APIs of the DbgPlot library.
5.2 DebugPlotDeinit
void DebugPlotDeinit();
Parameters
None
Return Value
None
Comments
The DebugPlotDeinit function clears up resources used by the DbgPlot library. Call this function before
your client program exits. The client process can safely exits without calling this function. The
consequence is that memory resources acquired by the library are not freed before the process exits, but
be cleaned up by the OS.
28
5.3 TracebufferWriteData
HRESULT TracebufferWriteData(
__in COMPLEX16 * pData,
__in int inNum,
__out int * pOutNum,
);
Parameters
pData [in]
Start address of the data to be written.
inNum [in]
Number of data to write.
outNum [out]
If not null, the integer variable that pOutNum points to will be filled with number of data written.
Return Value
If the function succeeds, the return value is S_OK.
If memory allocation failed, the return value is E_ALLOCATION_FAIL.
If the parameters are invalid, the return value is E_INVALID_PARAMETER.
If the buffer is full after data is written, the return value is E_END_OF_BUF.
Comments
TracebufferWriteData write data into the raw data replay buffer associated with the process. The function
will update track bar in the DbgPlot viewer UI.
29
5.4 TracebufferReadData
HRESULT TracebufferReadData(
__out COMPLEX16 * pData,
__in int inNum,
__out int * pOutNum,
);
Parameters
pData [out]
The function fills the data in the memory started at the address pData.
inNum [in]
Number of data to read.
pOutNum [out]
If not null, the integer variable that pOutNum points to will be filled with number of data read.
Return Value
If the function succeeds, the return value is S_OK.
If memory allocation failed, the return value is E_ALLOCATION_FAIL.
If the parameters are invalid, the return value is E_INVALID_PARAMETER.
If the read operation reaches the end of the buffer after the read operation, the return value is
E_END_OF_BUF.
Comments
TracebufferReadData reads data from the raw data replay buffer associated with the process. The
function will update track bar in the DbgPlot viewer UI.
30
5.5 TracebufferClear
void TracebufferClear();
Parameters
None.
Return Value
None.
Comments
TracebufferClear clears the raw data replay buffer, reset the read index and write index to zero. The
function will update track bar in the DbgPlot viewer UI.
5.6 WaitForViewer
DWORD WaitForViewer(
__in DWORD milliseconds
);
Parameters
milliseconds [in]
The timeout interval in milliseconds. If a nonzero value is specified, the function blocks until the internal
channel data buffer are not full or until the time interval elapses. If milliseconds is INFINITE, the function
blocks until the internal channel data buffer are not full.
Return Value
If the function succeeds, it returns WAIT_OBJECT_0.
If timeout happens, it returns WAIT_TIMEOUT.
Comments
The function blocks until the internal channel data buffer are not full or the time-out interval elapses.
31
5.7 PauseViewer
void PauseViewer();
Parameters
None.
Return Values
None.
Comments
Call PauseViewer function to pause the viewer. The play/pause button of the control panel will be set to
pause state. Calling PauseViewer is equivalent to pressing the pause button from or the plot windows for
the client process.
5.8 PlotLine
HRESULT PlotLine(
__in const char * channelName,
__in int * pData,
__in int dataCount
);
Parameters
channelName [in]
Name of the channel.
pData [in]
Start address of the input data.
dataCount [in]
Number of the input data.
Return Value
If the function succeeds, the return value is S_OK.
If the type of the channel specified is not line type, the return value is E_PLOT_TYPE_DISMATCH.
If the parameters are invalid, the return value is E_INVALID_PARAMETER.
32
If memory allocation failed, the return value is E_ALLOCATION_FAIL.
Comments
PlotLine plots data to the specified channel. The data will be interpreted as line, one integer for each point.
5.9 PlotSpectrum
HRESULT PlotSpectrum(
__in const char * channelName,
__in int * pData,
__in int dataCount
);
Parameters
channelName [in]
Name of the channel.
pData [in]
Start address of the input data.
dataCount [in]
Number of the input data.
Return Value
If the function succeeds, the return value is S_OK.
If the type of the channel specified is not line type, the return value is E_PLOT_TYPE_DISMATCH.
If the parameters are invalid, the return value is E_INVALID_PARAMETER.
If memory allocation failed, the return value is E_ALLOCATION_FAIL.
If caller passes the same channelName but different dataCount for different calls, the function returns
E_SPECTRUM_SIZE_INVALID.
Comments
PlotSpectrum plots data to the specified channel. The data will be interpreted as spectrum line, one
integer for each point.
33
5.10 PlotDots
HRESULT PlotDots(
__in const char * channelName,
__in COMPLEX16 * data,
__in int dataCount
);
Parameters
channelName [in]
Name of the channel.
pData [in]
Start address of the input data.
dataCount [in]
Number of the input data.
Return Value
If the function succeeds, the return value is S_OK.
If the type of the channel specified is not dots type, the return value is E_PLOT_TYPE_DISMATCH.
If the parameters are invalid, the return value is E_INVALID_PARAMETER.
If memory allocation failed, the return value is E_ALLOCATION_FAIL.
Comments
PlotDots plots data into the specified channel. The data will be interpreted as dots, one COMPLEX16 for
each point.
34
5.11 PlotText
HRESULT PlotText(
__in const char * channelName,
__in const char * format [,
argument]…
);
Parameters
channelName [in]
Name of the channel.
format [in]
Format control.
argument [in]
Optional arguments.
Return Value
If the function succeeds, the return value is S_OK.
If the type of the channel specified is not text type, the return value is E_PLOT_TYPE_DISMATCH.
If the parameters are invalid, the return value is E_INVALID_PARAMETER.
If memory allocation failed, the return value is E_ALLOCATION_FAIL.
Comments
PlotText plots data into the specified channel. The data will be interpreted as ANCII characters.
35
5.12 Log
HRESULT PlotText(
__in const char * channelName,
__in const char * format [,
argument]…
);
Parameters
channelName [in]
Name of the channel.
format [in]
Format control.
argument [in]
Optional arguments.
Return Value
If the function succeeds, the return value is S_OK.
If the type of the channel specified is not text type, the return value is E_PLOT_TYPE_DISMATCH.
If the parameters are invalid, the return value is E_INVALID_PARAMETER.
If memory allocation failed, the return value is E_ALLOCATION_FAIL.
Comments
The function plots data into the specified channel. The data will be interpreted as ANCII characters.
36