1
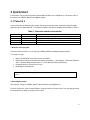
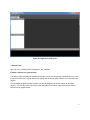
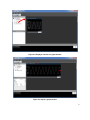
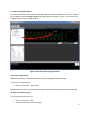
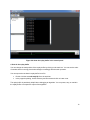
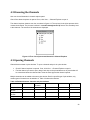
2 Quick Start In this section, we provide two tutorial to demonstrate the basic use of DbgPlot tool. The source code of the tutorial is in %SORA_ROOT%\src\dbgplot-sample. 2.1 Tutorial 1 In this tutorial, we will walk through a simple client program that generates a sine wave signal and plot graph through four data channels. The channels created in this sample program are described in Table 1. Table 1. Channels created in the tutorial. Type Line Line Dots Text Name real imaginary constellation sample count Descriptions Line graph of real part of the generated sine wave signal. Line graph of imaginary part of the generated sine wave signal. Dots graph of the generated sine wave signal. Text of current index of the data sample. 1. Build the client program The source files for tutorial 1 are in directory %SORA_ROOT%\src\dbgplot-sample\sample1. To compile tut1.cpp: Make sure that WDK of the latest version is installed. Start build environment command-line prompt: Start Menu -> All Programs -> Microsoft Research Asia -> Software Radio Academic Kit 1.6 -> Sora Build Environment(Checked). Change directory to find the source code. Build with the command bcz. > cd %SORA_ROOT%\src\dbgplot-sample\sample1 > bcz > 2. Start DbgPlot viewer Start explorer, and go to %SORA_ROOT%\bin and double click DbgPlot.exe. From the View menu, open Channel Explorer, Property Panel and Control Panel. You may drag and dock these panels as you wish, for example, as in Figure . 4