1
Dr. Frank Lee
David Lally
Evan Boucher
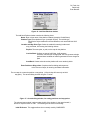
Stop: Ends the simulation preview.
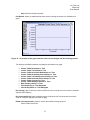
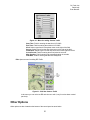
Plot Results: Opens an additional drop-down menu for plotting the results of a simulation on a
graph.
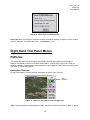
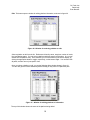
Figure 10 - An example of the graph interface which can be changes with the following options.
The following are different methods of plotting the information on a graph:
•
•
•
•
•
•
•
•
•
•
•
Comms Traffic Requested vs. Time
Comms Traffic Transmitted vs. Time
Comms Traffic Received at Destinations vs. Time
Comms Traffic Requested (Source+Relay) vs. Time
Comms Traffic Transmitted (Source+Relay) vs. Time
Comms Traffic Received (Source+Relay) vs. Time
Comms Traffic Corrupted vs. Time
Comms Traffic Waiting in Queues vs. Time
Mean Routing Latency vs. Time
Vehicles Moving vs. Time Histogram
Vehicle Way-Points vs. Time Histogram
Run a Script: Opens a directory search in which the user can locate and run a script for Composer
(typically .BAT filetypes).
Run from Auto-Script: Opens a direction search in which the user can locate and run an autoscript for Composer (typically in an XML file type).
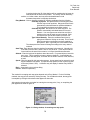
Emitter Coverage Contour: Opens a menu to plot emitter coverage contours.
Select a radio from the list.
9