1
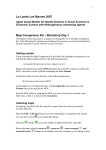
The influence that a certain land use has on another land use (or itself) is described as a function
of the distance between two cells (so-called a spline), which is made up of a series of points that
are connected in a certain manner. An example of such a function is shown in the figure above,
where the points are connected by linear interpolation. In this graph, the distance runs along the
horizontal axis and the vertical axis displays the influence that land use A has on land use B. We
see that, when land use A and B are situated at a distance of 1 (cells), land use B has a positive
effect on land use A of approximately 5.
Overview pane
1
Graph pane
2
4
3
List pane
5
6
7
We will now describe all the functionality of the Neighbourhood influence parameters dialog
window, as indicated in the figure above.
1. Influence table. This displays the influences of each land use on each function land use:
From… To…. Some of the cells in this table show what the spline that describes the
corresponding influence looks like. If a spline is flat (0 influence for all distances), it is
not displayed in the table. Click on a cell in the table to select that influence. The spline
that describes that influence is displayed on the right side of the dialog.
2. Auto save changes. If this is checked, the changes that you make to the spline on the
right side of the dialog will automatically be saved when you select another cell in the
influence table or when you press the exit button. If the Auto save changes is not
selected, a window will pop-up and ask you whether or not to save the change that you
made when you activate another rule.
64