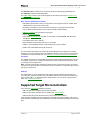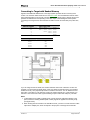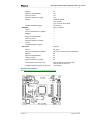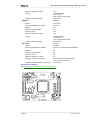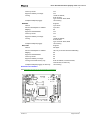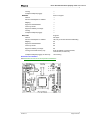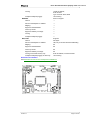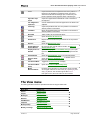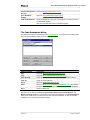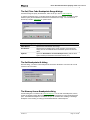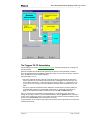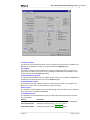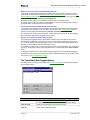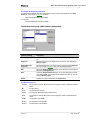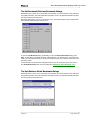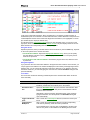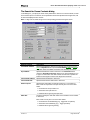
1
PICE-52
User’s Manual
Phyton, Inc.
Error! Unknown document property name.User's Manual
Dear customer,
This document is the hard copy of HLP file for the Phyton PICE-52 in-circuit emulator. We try to
keep this document up to date, however, in some minor parts, it may differ from your software. If
this is the case, you can find the latest version of this document at: www.phyton.com.
To justify the hypertext nature of the help file in the hard copy, we put the chapters in the order they
are given in the table of contents of the help file or mentioned in the text. The exceptions are the
topics about the dialogs of the Edit menu, which are grouped here after the description of the
Source window.
Other differences between this document and the help file include the following:
1. To help you easily navigate in the hard copy, a few artificial topics were added to the initial
help file. In fact, these topics are just cross-references to other places in the document.
2. Most of figures of dialog boxes in this hard copy do not exist in the help file. We added them to
supplement the text.
3. This document does not contain the topics about the script files, use automation and the error
messages. See these topics in the online help file.
4. To make the document more readable and adequate on paper, we arranged the Menus and
Windows groups of topics as separate sections. The help file includes them as branches of
other sections. Also, the Configurations section was moved one level up in the table of contents.
5. Some minor features (mostly, decorations) were changed.
Conventions used in this document
The dialog elements (names of buttons, menus, menu items, commands, dialogs, etc.) are given in
the regular Bold font. The titles of topics of the help file or chapters of this document are referred to
in the Italics font. Hypertext links of the help file are of green color. Jumps has the single underline,
pop-ups has the dotted underline.
Project-52 ™, PICE-52 ™, PDS-52 ™ are trademarks of Phyton, Inc.
Microsoft®, MS-DOS®, and Windows™ are trademarks or registered trademarks of Microsoft Corporation.
© Copyright 2000 Phyton, Inc., Microsystems and Development Tools. All rights reserved.
Version 1.1
Page 2 of 245
Error! Unknown document property name.User's Manual
Table of Contents
Getting Assistance ...........................................................................................................................9
How to Get On-line Help ..............................................................................................................9
Technical Support .........................................................................................................................9
Contact Information ......................................................................................................................9
Introduction...................................................................................................................................10
Terminology and Definitions ......................................................................................................10
Target microcontroller ............................................................................................................10
Emulation microcontroller ......................................................................................................10
Target device...........................................................................................................................11
Real-time mode .......................................................................................................................11
Break mode .............................................................................................................................11
Single-step low-level mode.....................................................................................................11
Single-step high-level mode....................................................................................................11
POD.........................................................................................................................................11
Basic Principles of Emulation.....................................................................................................11
Graphic User Interface ................................................................................................................13
Quick Start ..................................................................................................................................13
Description of PICE ......................................................................................................................15
Overview of Emulator.................................................................................................................15
Supported Target Microcontrollers .............................................................................................16
System Requirements..................................................................................................................20
General View of Emulator ..........................................................................................................20
Emulation of Memory.................................................................................................................21
Code Memory .........................................................................................................................22
Xdata Memory ........................................................................................................................23
EEPROM ................................................................................................................................23
Specifics in Supporting the Xdata Memory ............................................................................23
Data Memory ..........................................................................................................................24
Indirect Data Memory .............................................................................................................24
Stack Memory .........................................................................................................................25
Register Memory.....................................................................................................................25
Working with External Memory .............................................................................................25
Shadow Copies of Memory.....................................................................................................26
Memory Coverage...................................................................................................................26
Memory Banks........................................................................................................................26
Connecting to Target with Banked Memory...........................................................................28
Mapping of Memory ...............................................................................................................29
Breakpoints and Triggers ............................................................................................................30
Code Breakpoints....................................................................................................................30
Data Breakpoints.....................................................................................................................31
Complex Breakpoint Triggers.................................................................................................32
Trace Start/Stop Triggers ........................................................................................................33
Hardware Breakpoint Processor..................................................................................................34
Hardware Tracer .........................................................................................................................34
Tracer Cable............................................................................................................................35
Outputs for Synchronization of External Devices...................................................................36
On-the-fly Access to Microcontroller Resources ........................................................................36
Debug Registers ..........................................................................................................................37
Special Function Registers and Bits............................................................................................37
Real-time Timer and Frequency Measuring System...................................................................38
Managing the Emulation MCU Power........................................................................................38
POD Boards ................................................................................................................................39
Version 1.1
Page 3 of 245
Error! Unknown document property name.User's Manual
PR1-52-ARX/ID2 .......................................................................................................................40
PR1-52-ARX/51U2.....................................................................................................................42
PR1-52-ARX/W78......................................................................................................................44
PR1-52-ARZ ...............................................................................................................................46
PR1-52-ACC01...........................................................................................................................48
PR1-52-ACC03...........................................................................................................................50
PR1-52-A5112 ............................................................................................................................52
PR1-52-A5131 ............................................................................................................................54
PR1-52-W77 ...............................................................................................................................56
PR1-52-PLP/768 .........................................................................................................................58
PR1-52-PLP/769 .........................................................................................................................60
PR1-52-PLP1/932 .......................................................................................................................62
PR1-52-PLP1/935 .......................................................................................................................64
PR1-52-MIC0 .............................................................................................................................66
PR1-52-DS450............................................................................................................................67
PR1-52-DS400............................................................................................................................69
Main Boards................................................................................................................................71
Package Adapters........................................................................................................................72
Additional Package Adapters for PICE-52 .................................................................................72
Using QFP Package Adapters .....................................................................................................73
Restrictions of PICE-52 and Special Considerations ..................................................................74
Special Considerations Common for All POD Boards ...............................................................75
Displaying Contents of Ports ..................................................................................................75
Working with the Target Code and Xdata Memory................................................................75
Target Board Power Supply ....................................................................................................76
Emulation Microcontroller Supply Voltage and Clock Frequency .........................................76
External Clock.........................................................................................................................76
External Reset .........................................................................................................................76
The /EA Output.......................................................................................................................77
Restrictions of PR1-52-Axx and Special Considerations............................................................77
Contents of Ports P1, P3, P4 and P5 .......................................................................................78
The Reduced EMI Mode.........................................................................................................78
The Idle and Power Down Modes...........................................................................................78
Use of Stack ............................................................................................................................79
Emulation of 6-clock and 12-clock Modes .............................................................................79
Freezing the Peripherals (PR1-52-Axx) ..................................................................................79
FLASH Boot Loader and In-Application-Programming.........................................................80
Using the Tracer and Complex Breakpoints (PR1-52-Axx) ...................................................81
Restrictions of Emulation for Atmel AT89C1051, AT89C1051U, AT89C2051,
AT89C2051x2 and AT89C4051 .............................................................................................81
Restrictions of Emulation for Atmel AT87F51RC .................................................................81
Restrictions of Emulation for Atmel AT89C55WD................................................................81
Restrictions of Emulation for OKI MSM80C154 and MSM83C154......................................81
Restrictions of Emulation for Philips P89V51Rx2 and P89LV51Rx2....................................81
Restrictions of Emulation for SST 89C54, 89C58 and 89C59................................................82
Restrictions of Emulation for Winbond W78E51B, W78LE51, W78C51D and W78L51 .....82
Restrictions of Emulation for Winbond W78C52D, W78L52, W78E52B, W78LE52,
W78C54, W78IE54, W78L54, W78LE54 and W78C58 ........................................................83
Restrictions of Emulation for Winbond W78E54 and W78E58 .............................................83
Restrictions of Emulation for Winbond W78LE58, W78E516B and W78LE516..................83
Restrictions of PR1-52-W77 and Special Considerations...........................................................83
Emulation Microcontroller Supply Voltage and Clock Frequency (PR1-52-W77) ................84
Freezing the Peripherals (PR1-52-W77) .................................................................................84
Timed Access Protection (PR1-52-W77)................................................................................84
Processing the Wait Signal......................................................................................................84
Using the Tracer and Complex Breakpoints (PR1-52-W77)...................................................85
Version 1.1
Page 4 of 245
Error! Unknown document property name.User's Manual
Restrictions of PR1-52-PLP/76x and Special Considerations.....................................................85
Emulation Microcontroller Supply Voltage and Clock Frequency (PR1-52-PLP/76x) ..........86
Breaking the Emulation (PR1-52-PLP/76x)............................................................................86
The Idle and Power Down Modes (PR1-52-PLP/76x)............................................................86
Freezing the Peripherals (PR1-52-PLP/76x)...........................................................................87
Using the Tracer and Complex Breakpoints (PR1-52-PLP/76x) ............................................87
Measuring the Clock Frequency .............................................................................................87
Restrictions of PR1-52-PLP1/93x and Special Considerations...................................................87
Breaking the Emulation (PR1-52-PLP1/93x)..........................................................................88
The Idle and Power Down Modes (PR1-52-PLP1/93x)..........................................................88
The MCU RESET Button .......................................................................................................88
Freezing the Peripherals (PR1-52-PLP1/932).........................................................................89
Freezing the Peripherals (PR1-52-PLP1/935).........................................................................89
Using the Tracer and Complex Breakpoints (PR1-52-PLP1/93x) ..........................................89
Resources with Special Access ...............................................................................................89
Brownout Detect .....................................................................................................................89
Restrictions of PR1-52-MIC0 and Special Considerations .........................................................90
Initializing the Idle and Power Down Modes..........................................................................90
The In-System Programming Mode........................................................................................91
Peculiarities of Design ............................................................................................................91
Connecting and Turning On/Off the Emulator........................................................................91
Determining the Idle and Power Down Modes .......................................................................92
Observing the Contents of XDATA Memory in Real Time ...................................................92
Effects of Parameters of XRAM Shadow Copy......................................................................93
Signals WRQ and RDQ ..........................................................................................................93
Diagram of Communication Connector on the Target Device................................................93
Adapter AR1-52-VCT49-D88.................................................................................................94
Restrictions of PR1-52-DS450 and Special Considerations .......................................................95
Using Ports P0 and P2 for GPIO (PR1-52-DS450).................................................................96
Contents of Ports P1 and P3 (PR1-52-DS450)........................................................................96
Breakpoints and Trace Start/Stop Triggers (PR1-52-DS450) .................................................96
Freezing the Peripherals (PR1-52-DS450)..............................................................................97
Timed Access Protection (PR1-52-DS4xx) ............................................................................97
High-level Steps (PR1-52-DS450)..........................................................................................97
Setting the Complex Breakpoint Triggers (PR1-52-DS450)...................................................98
Restrictions of Emulation for Dallas DS89C420, DS89C430 and DS89C450 .......................98
Restrictions of PR1-52-DS400 and Special Considerations .......................................................98
Memory of Emulator (PR1-52-DS400)...................................................................................99
Writing to the Target Board Code Memory (PR1-52-DS400) ..............................................100
Contents of Ports P1, P3 and P4 (PR1-52-DS400)................................................................100
Breakpoints and Trace Start/Stop Triggers (PR1-52-DS400) ...............................................100
Freezing the Peripherals (PR1-52-DS400)............................................................................100
High-level Steps (PR1-52-DS400)........................................................................................100
Communication with PC...........................................................................................................100
Menus........................................................................................................................................101
Menus...........................................................................................................................................102
The File menu ...........................................................................................................................102
The Load Program dialog......................................................................................................102
The Save File from MCU Memory dialog ............................................................................104
The Open File dialog.............................................................................................................105
The Edit menu...........................................................................................................................105
The View menu.........................................................................................................................106
The Run menu...........................................................................................................................107
The Auto-Step / Redraw Setup dialog...................................................................................108
Executing the High-level Language Operators .....................................................................109
Preparing Programs for Source-level Debugging..................................................................109
Version 1.1
Page 5 of 245
Error! Unknown document property name.User's Manual
The Breakpoints menu ..............................................................................................................109
The Code Breakpoints dialog................................................................................................110
The Set/Clear Code Breakpoints Range dialogs ...................................................................111
The Set Breakpoints At dialog ..............................................................................................111
The Memory Access Breakpoints dialog ..............................................................................111
The Break on Data Access dialog .........................................................................................112
The Breakpoint Processor dialog ..........................................................................................113
The Triggers T0..T3 Setup dialog .........................................................................................114
The Breakpoint Processor Control dialog .............................................................................116
The Breakpoint Processor: Simplified dialog .......................................................................116
The Breakpoint Processor: Advanced dialog ........................................................................118
The Tracer Control dialog.....................................................................................................119
The Trace Start/Stop Triggers dialog ....................................................................................120
The Trace Start/Stop Trigger Setup dialog............................................................................121
The Configure menu .................................................................................................................121
The Debug Options dialog ....................................................................................................122
Keeping Duplicate Source Lines...........................................................................................123
The Hardware Configuration dialog .....................................................................................124
The Environment dialog........................................................................................................139
The Quick Watch function ....................................................................................................145
The Editor Options dialog.....................................................................................................145
The Project menu ......................................................................................................................149
The Open Project dialog........................................................................................................149
The Project Repository dialog...............................................................................................150
The Project Options dialog....................................................................................................151
The General Properties group ...............................................................................................151
The Target Microcontroller for the Project group.................................................................153
The Cross-tools group ...........................................................................................................153
The Memory Model group ....................................................................................................159
The Memory Areas group .....................................................................................................163
The Folders group .................................................................................................................167
The Make Options group ......................................................................................................168
The Commands menu ...............................................................................................................169
The Calculator dialog............................................................................................................169
The Inspect dialog.................................................................................................................171
The Script Files dialog ..........................................................................................................172
The Start Programmer dialog ................................................................................................173
The Start Listening for ACI Client dialog.............................................................................175
The Xdata Test dialog ...........................................................................................................175
The Examples dialog.............................................................................................................175
The Scripts menu ......................................................................................................................176
The Window menu....................................................................................................................176
The Help menu..........................................................................................................................177
The Help System Control dialog...........................................................................................177
The Information dialog .........................................................................................................178
Windows ......................................................................................................................................179
The Source window ..................................................................................................................179
Regular Expressions..............................................................................................................181
The Search for Text dialog....................................................................................................181
The Replace Text dialog .......................................................................................................182
The Confirm Replace dialog .................................................................................................184
The Multi-File Search Results dialog....................................................................................184
The Display from Line Number dialog .................................................................................185
The Set Bookmark/Retrieve Bookmark dialogs....................................................................186
The Set/Retrieve Global Bookmark dialogs..........................................................................186
Block Operations...................................................................................................................187
Version 1.1
Page 6 of 245
Error! Unknown document property name.User's Manual
Specific Functions for Writing Programs..............................................................................188
Syntax Highlighting ..............................................................................................................188
Automatic Word Completion ................................................................................................189
Condensed Mode...................................................................................................................189
The Condensed Mode Setup dialog ......................................................................................189
Editor Keys ...........................................................................................................................190
The Editor toolbar .................................................................................................................191
The Check Variable message box .........................................................................................192
The Functions List dialog......................................................................................................192
The Display from Address dialog .........................................................................................192
The Pick Source File dialog ..................................................................................................193
Debugging.............................................................................................................................193
The Project window ..................................................................................................................194
The Add File to Project dialog ..............................................................................................196
Scanning of the Selected Source File Dependencies.............................................................196
Adding Explicit Dependencies to Source File ......................................................................196
The File Options dialog.........................................................................................................196
The Messages window ..............................................................................................................197
The Watches window................................................................................................................198
The Add Watch dialog ..........................................................................................................200
The Modify dialog ................................................................................................................201
The Display Options dialog ..................................................................................................201
The AutoWatches window........................................................................................................202
The Inspector window...............................................................................................................203
The Memory Dump window.....................................................................................................204
The Memory Dump Window Setup dialog ...........................................................................206
The Modify Memory dialog..................................................................................................207
The Operations with Memory Block dialog..........................................................................208
How to Specify Values for Search and Fill...........................................................................209
The Follow Address dialog ...................................................................................................210
The Memory Coverage window................................................................................................211
The Display Setup dialog ......................................................................................................213
The Memory Layout window....................................................................................................214
The Code Browser window.......................................................................................................216
The Display Options dialog ..................................................................................................216
The Disassembler window ........................................................................................................217
The Assembler dialog ...........................................................................................................219
The Execution Time window ....................................................................................................220
The Peripheral Device window.................................................................................................221
The Options dialog................................................................................................................221
The Tracer window ...................................................................................................................222
Trace Buffer Frame ...............................................................................................................223
The Tracer Window Setup dialog .........................................................................................225
The Display from Frame Number dialog ..............................................................................225
The Search for Frame Contents dialog..................................................................................226
The Search for External Input Levels dialog.........................................................................227
The Console window ................................................................................................................228
The User window ......................................................................................................................228
The I/O Stream window............................................................................................................229
The Script Source window ........................................................................................................229
Using the Emulator .....................................................................................................................231
Scenarios of Use .......................................................................................................................231
PICE as External Debugger ......................................................................................................231
The Demonstration Mode .........................................................................................................232
Preparing the Emulator Hardware.............................................................................................232
Working with Projects ..............................................................................................................233
Version 1.1
Page 7 of 245
Error! Unknown document property name.User's Manual
Concept of Project.................................................................................................................234
Project Configuration File.....................................................................................................234
How to Create a New Project................................................................................................234
How to add source text file to the project .............................................................................235
How to delete source file from the project ............................................................................235
How to begin editing the source text file ..............................................................................235
How to save project...............................................................................................................235
How to load an existing project.............................................................................................235
Building Project with Project Manager .................................................................................236
How to interrupt work on the project ....................................................................................236
How to compile the source text file ......................................................................................236
How to change compilation options for one source file........................................................237
How to set up cross-tools ......................................................................................................237
Supporting Projects for Additional Cross-tools ........................................................................237
How to add a cross-tool.........................................................................................................237
How to delete a cross-tool.....................................................................................................238
Developing and Debugging Programs with Memory Banks.....................................................238
Project Repository Tree ............................................................................................................239
Troubleshooting ........................................................................................................................239
Error Messages..........................................................................................................................239
Configurations.............................................................................................................................240
Configuring the Hardware ........................................................................................................240
The Hardware Configuration dialog .........................................................................................240
The PICE-52 Communication dialog........................................................................................240
The Project Options dialog........................................................................................................241
Configuration Files ...................................................................................................................241
Project Configuration File.........................................................................................................241
The Configure menu .................................................................................................................241
Appendix Topics..........................................................................................................................242
Expressions ...............................................................................................................................242
Operations in Expressions.....................................................................................................242
Numbers................................................................................................................................243
Names of Symbols ................................................................................................................244
Contents of Memory Locations.............................................................................................244
Script Files and Emulator Use Automation...............................................................................245
Command-line Switches ...........................................................................................................245
Automatic Name Completion ...................................................................................................245
Version 1.1
Page 8 of 245
Error! Unknown document property name.User's Manual
Getting Assistance
How to Get On-line Help
To access the online help, press the F1 key or use the Help menu. We worked to provide the context–sensitive help for each dialog, message box or menu. For example, to open help for a menu,
pull down the menu and press F1.
The Help menu contains additional menu items for controlling the PICE help system.
Also, use the search function of the help system. In most cases you can find the necessary topic by
keyword. For example, if you type "Breakpoints" in first box of the Find tab, the third box will list the
topics related to breakpoints. Choose an appropriate topic from this list and press Display.
To study PICE step-by-step, click the Contents tab in the Windows Help window and read the topics one by one.
Technical Support
Phyton, Inc provides technical support free of charge. Our specialists are happy to help you to get
over difficulties with the Phyton products.
The product you purchased provides wide opportunities and great functionality. However, it is a
complex product and may contain bugs. We kindly ask you to inform us of all bugs you have found
out for us to correct them and provide you with the product upgrades (free of charge).
If you are just beginning your acquaintance with PICE, please get familiar with this emulator. The
user interface of the PICE program is quite standard and intuitive, however, to learn some specific
functionality of the product, please read this help file.
Before contacting Phyton
Before contacting us, please:
• Make sure that the error you found out can be repeated, that is, you can always repeat the
situation, in which this error occurs.
• See our troubleshooting recommendations and if they concern your problem, try to apply
them.
When contacting us
Please, provide the following info:
• Your name, the name of your company, the telephone/fax number and your e-mail address.
• The name of the product and its serial number.
• The date of purchase.
• The copy of the Information dialog: the version number and the volume of memory in use.
• The parameters of your computer and operating system.
• The list of found errors and their descriptions.
Please send your requests or questions to [email protected] explaining the problems in details. This is the shortest way to get professional and prompt help. Also, see Contact Information.
Contact Information
PHYTON Inc. Microsystems and Development Tools
7206 Bay Parkway, 2nd floor, Brooklyn, New York 11204
Tel:
1-718-259-3191
Fax:
1-718-259-1539
Email:
[email protected], [email protected]
WWW:
www.phyton.com
Version 1.1
Page 9 of 245
Error! Unknown document property name.User's Manual
Introduction
Terminology and Definitions
It is assumed that you are familiar with the operation of MS Windows: you know how to open,
move, resize or close the windows and use the standard menus and dialog boxes.
Hereinafter in this document, to describe working with our emulator, we make use of terms that are
widely accepted in the industry of IT, and we use exactly that sense of terms, which is widely accepted in the industry of IT. That is why, this topic just elaborates on some terms to help you easier
understand this document.
Installation folder of PICE is the directory, where the PICE program is installed and where the
PICE-52.EXE file is located. This directory is used to save some system files and therefore, it shall
not be write-protected. The synonyms for the installation folder are “the system folder of PICE” and
“the root folder of PICE”.
Specialized window is a subordinate window, which the PICE software uses to output various data
about the emulator operation on your PC video monitor. For example, these are the source text
window, the disassembler window, the memory dump window, and so on. Also, most of specialized
windows participate in the process of data input from the keyboard. Every specialized window is located within the window of PICE software.
Active window is the window that currently has the input focus, that is, the keyboard input is addressed to this window. The active window can be distinguished by color of its title bar.
Toolbar is the row of buttons at the top of a window. A single click on a toolbar button executes the
command assigned to this button. In the PICE window, the toolbar buttons feature the colored
icons, and in specialized windows, the toolbar buttons have titles.
Caret is the flashing rectangle similar to the cursor in DOS. It appears in some specialized windows
of PICE software. You can move it with the arrow buttons of the keyboard, or by clicking the mouse
left button. The synonym is “the insertion point”.
Note. To avoid misunderstanding in this document, the program, which is shipped on CD together
with your hardware emulator and which interacts with the hardware emulator, is always called “the
PICE software” or “the PICE program”. And a single word “program”, when it is not explicitly specified by words “the user program” or “the program being debugged”, should be understood as “the
user program being debugged”.
Basic Definitions
Also, this document makes use of the following basic terms with regard to emulation:
Target microcontroller
Target device
Emulation microcontroller
POD
Real-time mode
Break mode
Single-step low-level mode
Single-step high-level mode
Target microcontroller
Target microcontroller is the microcontroller installed on your board (device PCB). For the purposes
of emulation, you replace this chip with the in-circuit emulator.
Emulation microcontroller
Emulation microcontroller is the microcontroller installed on the emulator POD board.
Version 1.1
Page 10 of 245
Error! Unknown document property name.User's Manual
Target device
Target means the user's device with the target microcontroller. In this documentation and in the debugger software, the word target also means all the resources of the user's device.
Real-time mode
In this mode, the emulator executes only the user program (either continuously or step-by-step)
and for the target device, the emulator is fully equivalent to the target microcontroller.
To start the user program for execution, use the Run menu commands.
Break mode
In this mode, the emulator stops running the user program and executes the emulator monitor program. The monitor is transparent for the user and is inaccessible for the target device. The emulation microcontroller is not actually halted: the processor continues operating at the same clock frequency it operated in the real-time mode.
Specific features of the break mode of emulator
• All interrupts are disabled.
• Some peripherals may either be running or be frozen. This depends on the Freeze in Break
Mode flags (for PR1-52-Axx) or the Freeze CCU in Break Mode flag (for PR1-52-PLP1/93x)
in the Hardware Configuration dialog. If the flag is off, the corresponding peripherals will go
on running in the break mode, and vice versa.
• All resources of the emulation microcontroller are accessible.
Single-step low-level mode
In this mode, the emulator executes one MCU instruction and stops.
Single-step high-level mode
In this mode, the emulator executes one high-level language operator in the user's program. This
mode is supported by the emulator hardware and is similar to running the user program in the realtime mode with the breakpoints set up on each operator in the user program (in fact, on the address, from which the program code that corresponds to the operator, begins). This mode is available only if the loaded program is prepared for the source–level debugging (for more info, see Preparing Programs for Source-level Debugging).
Also, see Executing the High-level Language Operators.
POD
POD is the plug-in printed circuit board (PCB) between the PICE main board and the package
adapter. POD contains a specific emulation microcontroller.
Basic Principles of Emulation
The concept of “emulation of microprocessor” includes at least the following essential characteristics:
1. To emulate the target microcontroller Code memory, the emulator RAM memory is used. During
debugging, this enables unlimited amount of reloads of Code memory and unlimited amount of
breakpoints. In fact, the emulator memory artificially substitutes own Code memory of the microcontroller.
2. Capability to stop running the user program (emulation) at any moment of time and at any location, with displaying any resource of the microcontroller on the video monitor.
3. Capability to start running the user program (emulation) from any location in the program.
Version 1.1
Page 11 of 245
Error! Unknown document property name.User's Manual
4. “Transparency” of emulation, which means that the processes of starting and stopping the emulation do not interfere in any resource of the microcontroller or user program. The benefit is that the
user program “does not detect” the facts of stop, and the result of its operation does not depend on
the amount of stops during the emulation.
Unlike emulation of microprocessors, the main problem in emulation of microcontrollers is to emulate the Code memory, which in most cases is an integral part of the microcontroller chip and has
no dedicated (own) data/address bus for accessing it from outside. In PICE-52, to solve the task of
emulating the memory, the special emulation chips are used: the so-called “bondout” and the “enhanced hook”.
Bondout
The manufacturer of regular microcontrollers designs the bondout chips especially for the emulation purposes. Such chip features extra outputs, through which the emulator hardware gains access to the on-chip Code memory and, sometimes, to the on-chip Data memory. In this way, you
can access the internal Code memory, load your program and debug it without employing the standard ports of microcontroller.
The advantage of this method is the most exact emulation, because every standard output is directly connected to the target board and no one standard output does a second job for emulation.
The main disadvantages are possible minor differences between the regular microcontrollers and
the bondouts, which are to be taken into account during emulation. For example, some configuration bits may work incorrectly. The differences appear because of minor mistakes in the development of bondout, and also because the bondouts and regular chips are not always manufactured
simultaneously and the batches of manufacture may be different.
Enhanced Hook
The enhanced hook emulation chip (or just Hook) is the regular microcontroller with a special additional hardware part inside, which provides the emulation. When the regular microcontroller works
with the internal Code memory, ports P0 and P2 perform functions of static input-output ports (general-purpose input/output).
In the emulation chip in the Enhanced Hook mode, these ports become multiplexed: besides the
static input/output, they operate part time as an address/data bus. The timing of this bus is known.
For the emulator, the task is to correctly process and restore the port states so as to hide, as much
as possible, their participation in the emulation from the target device. That is, the ports should behave as if usual general-purpose I/O in a usual regular microcontroller.
Implementation of start/stop
Upon breaking the emulation, the emulator switches to the break mode.
In the break mode, the emulation microcontroller does not actually stop. It continues operating at
the same frequency as when running your program: the emulator hardware switches it to running
the "shadow" monitor. The "shadow" monitor is a program invisible for the target device and inaccessible from it. This monitor interacts with the PICE program and provides access to all resources
of the microcontroller.
When the user program is launched for execution, the emulator hardware switches the microcontroller from the monitor code memory to the emulated code memory. In the real-time mode, the
user program fully controls the emulation microcontroller. At the moment the user program halts,
the reverse process takes place: the user code memory is replaced with the monitor code memory.
Execution of program halts for the following reasons:
• On the code breakpoints.
• On the complex trigger conditions by the hardware breakpoint processor.
• The forced break with the Stop command by the user (the Run menu).
• Upon execution of the low-level step (see Single-step Low-level Mode).
• Upon execution of the high-level step (see Single-step High-level Mode).
Freezing the peripherals during the break
The function of freezing the peripherals is an important characteristic, which provides “transparency” of emulator for the target system.
The concept of freezing is as follows: at the moment the emulator switches from real-time running
the user program to the break mode, the clock signal that comes to the emulation microcontroller
Version 1.1
Page 12 of 245
Error! Unknown document property name.User's Manual
peripheral devices should be switched off synchronously with the moment of halt. When the peripherals are “frozen”, their states do not change from the moment the emulator switched to the
break mode and the moment the emulator resumed further emulation of your program. When the
user program is restarted for further execution, the emulator should provide the reverse process, to
switch on the clock signal of peripheral devices synchronously with the moment the first instruction
of user program is fetched.
The ideal synchronization of these processes is possible only when the freezing function is implemented immediately in the emulation microcontroller. An example of such implementation is the
PR1-52-ARX POD board, which is based on an Enhanced Hook chip with such freezing function.
However, not every emulation chip provides this capability. For example, the emulation chip used in
the PR1-52-W77 POD board does not support the freezing function. That is why in this POD, the
peripheral clock signal is switched off by software of the “shadow” monitor. And that is why, the peripheral clock signal is switched on and off with some time lag from the moments of emulation
start/stop.
This time lag may produce effects as follows: a timer shall change its state by one per machine cycle. However, when executing your program step-by-step, you notice that the timer value changes
by a larger number.
To learn how the freezing function operates in the POD you are using, see description of this POD
in Restrictions of PICE-52 and Special Considerations.
Graphic User Interface
The PICE program features the standard Windows interface with several useful additions:
1. Each specialized window has the local menu (shortcut menu). To open this menu, click the
right mouse button within the window or press the Ctrl+Enter or Ctrl+F10 keys. Each command in the menu has the hot key shortcut assigned to the Ctrl+<letter> keys. Pressing the
"hot key" combination in the active window executes the corresponding command.
2. Each specialized window has own toolbar. The window toolbar buttons give access to most of
the window local menu commands. Specialized window toolbar buttons always operate only
within its specialized window. The PICE window itself has several toolbars, which can be
turned on/off (in the Environment dialog, the Toolbar tab).
3. Each toolbar button has short prompt: when you place the mouse cursor over a toolbar button
for two seconds, the small yellow box appears nearby with short description of the button.
4. To save the screen space, you can switch off the title bar of each window. To do this, use the
Properties command of the local menu. You can identify the specialized windows of the PICE
program by their contents and position on the screen (and, if you wish, by color and font).
When the title bar is off, you can move the window in the same way as if the toolbar were the
title bar: place the cursor on the free space on the toolbar, press the left button and drag the
window to the new position.
5. You can open any number of windows of the same type. For example, you can open several
Memory Dump windows or several Watches windows.
6. Every input text field in dialogs has the history list. The PICE program saves them between
the sessions.
7. The text boxes for input in dialogs feature the automatic name completion.
8. All check boxes and radio buttons in dialogs work in the following way: a double-click on the
check box or radio button is equivalent to the single click on this box and click on the OK button. This is convenient, when you need to change only one option in the dialog and close it.
Quick Start
The preset default parameters and options of our software allow you to begin working without any
additional reconfiguring it.
Version 1.1
Page 13 of 245
Error! Unknown document property name.User's Manual
The Phyton products combine high technology. This presupposes your experience with MS Windows and architecture of the 8051 microcontrollers. If you already have hands-on experience working with an emulator, it will suffice for you to read Preparing the Emulator Hardware and Restrictions of PICE-52 and Special Considerations. If you are not a sophisticated developer yet, then before starting your project, please attentively read PICE-52: Getting Started (supplied on the installation CD) and this help file.
Launching the emulator
We recommend you to insert the emulator in the target device only after you have familiarized
yourself with both the emulator hardware and software.
Carry out the procedure in accordance with the First Start chapter in PICE-52: Getting Started. In
case of problems with starting PICE, see our troubleshooting recommendations and if they concern
your problem, try to apply them.
Using the emulator
Choose the way of using the emulator (see Scenarios of Use) and see links further from this topic
(follow the steps of corresponding typical procedure).
Version 1.1
Page 14 of 245
Error! Unknown document property name.User's Manual
Description of PICE
Overview of Emulator
PICE-52 is a universal advanced emulator with hardware and software component parts. Depending on the stage of your development process, you can use PICE together with your target device,
without it, or even the PICE software alone, without the hardware emulator. For more about using
PICE-52, see Scenarios of Use.
Hardware
The PICE-52 hardware emulates microcontrollers of the 8051 family. It consists of three basic
parts: the main board, the POD board for the specific target microcontroller, and the adapter between the target board and the POD board (the plug-in adapter for a specific type of the target microcontroller package). Other hardware includes the power supply unit, the RS–232C or USB cable
and (optionally) the tracer cable (see General View of Emulator).
The main board controls the whole emulator. It contains:
• Control processor.
• Programmable logic device.
• Emulation Code and Xdata memory.
• Run/halt engine for the emulation microcontroller.
• Hardware tracer.
• Hardware breakpoint processor.
• Programmable clock frequency generator.
• 48-bit real-time timer.
• Memory Coverage monitor.
The programmable logic device implements the frequency measuring system for the emulation
microcontroller and the on-the-fly access (when the user program runs in the real-time mode) to the
microcontroller resources, to the whole code/data memory, breakpoints, breakpoint processor,
trace buffer and real-time timer. (See Real-time Timer and Frequency Measuring System and Onthe-fly Access to Microcontroller Resources.)
The emulation memory features the unit of two-port access, which provides the on-the-fly access
to the memory contents. The memory mapping capability allows using the emulator memory or the
memory on the target board.
The hardware tracer has four tracing start/stop modes. It stores the code address, opcodes, data
address, data, time stamp and levels of 8 external signals. You can filter the traced information for
display purposes.
The hardware breakpoint processor has four complex breakpoint triggers. These triggers implement your custom AND/OR/IF-THEN combinations on the contents of the code address, data address, opcode, data, bus cycle type, pass counter and delay timer. You can use outputs of these
triggers to synchronize external devices.
The POD board contains the emulation microcontroller (emulation chip), which emulates the target
microcontroller of particular type (see POD Boards and Supported Target Microcontrollers). Also, it
contains the programmable DC regulator to supply the emulation MCU with power within the whole
range of admissible voltages.
The adapter (package adapter) is a gadget to connect POD to the target microcontroller socket on
the board of target device being developed. There is a line of adapters for PICE-52 to support all
package types of the corresponding target microcontroller.
Each POD and its adapters form the predetermined pairs. The same is valid for the main board: the
main board supports the predetermined set of PODs.
The standard power supply unit provides the stabilized voltage of 3.3 V under the load of no less
than 0.5 A.
Version 1.1
Page 15 of 245
Error! Unknown document property name.User's Manual
The RS–232C cable includes the 3V–12V drivers and the DC decoupling (optoisolated) unit.
The USB cable includes the RS–USB bridge.
The tracer cable connects up to 8 external signals to the tracer inputs and its 4 outputs for synchronization of external devices.
Basic technical parameters of emulator
• Adjustable output frequency of the clock generator in the range from 2 kHz to 70 MHz with a
statistical error of 0.5% of the current value.
• Emulation at a frequency of up to the maximum frequency of the target microcontroller.
• Up to 2 Mb of program (Code) memory and up to 448 Kb of Xdata memory.
• Mapping of memory with a resolution of 512 bytes.
• Up to 2 M code breakpoints.
• Up to 448 K data breakpoints on Xdata, on-chip Xdata, on-chip EEPROM; 256 direct data
breakpoints.
• Trace buffer size of 16 K ×128 bits.
• Serial interface communication rate of up to 115.2 Kbps.
• USB 1.1 (2.0 compatible) interface communication rate of up to 12 Mbps.
• Plastic case overall dimensions of 98×76×33 mm.
The user board power supply shall comply with the specifications for the target microcontroller.
Sometimes, your project may be subject to additional restrictions, which in fact are the restrictions
for emulation. For info about this topic, see Restrictions of PICE-52 and Special Considerations.
Precaution
The adapter connectors are mechanically fragile parts. Please handle the emulator with care and
do not apply excess force to not destroy the connectors, when connecting the emulator to or disconnecting it from the target board.
Note. The PICE serial interface cable has the electronic unit to decouple the circuits. This means
that you may connect this cable to or disconnect it from the emulator or computer serial port at any
time at your convenience.
Software
The compact disk of your kit contains the PICE software and the software simulator with their
user’s manuals. The PICE software runs on the IBM PC platform and controls the emulator hardware over the USB 1.1 or standard RS–232C serial interface. For more about using these interfaces, see Communication with PC.
Supported Target Microcontrollers
There are three main boards available for PICE-52:
• MR1-52-03 is for the standard memory volume of 64 Kb;
• MR1-52-05 is for the extended memory volume (with memory banks).
• MR1-52-06 is also for the extended memory volume (with memory banks).
A pair of POD and adapter forms the supply kit for particular target microcontroller. PICE-52 supports emulation of the following microcontrollers (for the SOIC and SSOP packages, see note 1 below):
Version 1.1
Page 16 of 245
Manufacturer
Target microcontroller(s)
Supply kit
POD(s)
Package adapter, for the target package:
DIP
PLCC
Atmel
Atmel
Atmel
Atmel
Atmel
Atmel
List A-1
List A-2
List A-3
T89C51IB2, T89C51IC2
AT89C5131
AT89C51CC03
PR1-52-ARX/ID2, PR1-52-ARX/W78
PR1-52-ARX/ID2, PR1-52-ARX/W78
PR1-52-ARX/ID2
PR1-52-ARX/ID2
PR1-52-A5131
PR1-52-ACC03
AR1-52-D40
See note 2 below.
AR1-52-D40
—
AR1-52-A5131-D28
—
Atmel
List A-4
PR1-52-ARZ
AR1-52-D40
Atmel
Atmel
Atmel
Atmel
Atmel
List A-5
T83C5112, T87C5112
T83C5111, T87C5111
T89C51AC2, T89C51CC01
T89C5115, T89C51CC02
PR1-52-ARZ
PR1-52-A5112
PR1-52-A5112
PR1-52-ACC01, PR1-52-ACC03
PR1-52-ACC01, PR1-52-ACC03
Atmel
Dallas
Dallas
Intel
Intel
ISSI
Micronas
OKI
Philips
Philips
Philips
Philips
Philips
Philips
Philips
Philips
Philips
Philips
Philips
Philips
Philips
Philips
Philips
Philips
Philips
Philips
Philips
Philips
SST
Winbond
Winbond
Winbond
List A-6
List DS-1
DS80C400
List I-1
List I-2
IS89C51, IS89C52
List M-1
List O-1
List P-1
List P-2
P87LPC767
P87LPC762, P87LPC764
P87LPC761
P87LPC760
P87LPC768, P87LPC778
P87LPC769, P87LPC779
List P-3
P89LPC904
List P-4
List P-5
P89LPC915
P89LPC916, P89LPC917
List P-6
P89LPC924, P89LPC925
P89LPC930, P89LPC931
P89LPC932
List P-7
P89LPC936
List S-1
List W-1
List W-2
List W-3
PR1-52-ARX/51U2
PR1-52-DS450
PR1-52-DS400
PR1-52-ARX/ID2, PR1-52-ARX/W78
PR1-52-ARX/ID2
PR1-52-ARX/ID2, PR1-52-ARX/W78
PR1-52-MIC0
PR1-52-ARX/ID2, PR1-52-ARX/W78
PR1-52-ARX/ID2, PR1-52-ARX/W78
PR1-52-ARX/ID2
PR1-52-PLP/769, PR1-52-PLP/768
PR1-52-PLP/769, PR1-52-PLP/768
PR1-52-PLP/769, PR1-52-PLP/768
PR1-52-PLP/769, PR1-52-PLP/768
PR1-52-PLP/768
PR1-52-PLP/769
PR1-52-PLP1/932, PR1-52-PLP1/935
PR1-52-PLP1/935
PR1-52-PLP1/932, PR1-52-PLP1/935
PR1-52-PLP1/932, PR1-52-PLP1/935
PR1-52-PLP1/935
PR1-52-PLP1/935
PR1-52-PLP1/932, PR1-52-PLP1/935
PR1-52-PLP1/935
PR1-52-PLP1/932, PR1-52-PLP1/935
PR1-52-PLP1/932, PR1-52-PLP1/935
PR1-52-PLP1/935
PR1-52-PLP1/935
PR1-52-ARX/ID2, PR1-52-ARX/W78
PR1-52-W77
PR1-52-ARX/ID2, PR1-52-ARX/W78
PR1-52-ARX/W78
AR1-52-ARZ-D24
—
AR1-52-A5112-D24
—
AR1-52-ACC01-D28
AR1-52-ACC01-D24
AR1-52-D40
AR1-52-D40
—
AR1-52-D40
AR1-52-D40
AR1-52-D40
See note 4 below.
AR1-52-D40
AR1-52-D40
AR1-52-D40
AR1-52-PLP-D20
AR1-52-PLP-D20
AR1-52-PLP-D16
AR1-52-PLP-D14
AR1-52-PLP-D20
AR1-52-PLP-D20
AR1-52-PLP1-D8/1
AR1-52-PLP1-D8/1
AR1-52-PLP1-D8/2
AR1-52-PLP1-D14
AR1-52-PLP1-D14/1
AR1-52-PLP1-D16
AR1-52-PLP1-D20
AR1-52-PLP1-D20
AR1-52-PLP1-D28
AR1-52-PLP1-D28
AR1-52-PLP1-D28
AR1-52-PLP1-D28
AR1-52-D40
AR1-52-D40
AR1-52-D40
AR1-52-D40
QFP
AR1-52-L44
—
AR1-52-L44
AR1-52-L44
AR1-52-A5131-L52
AR1-52-ACC03-L52
AR1-52-L44
AR1-52-L44
AR1-52-ARZ-L68
—
AR1-52-A5112-L52
—
AR1-52-L44
AR1-52-ACC01-L28
AR1-52-Q44
—
AR1-52-Q44
AR1-52-Q44
AR1-52-A5131-Q64
AR1-52-ACC03-Q64
AR1-52-Q44
AR1-52-Q44
AR1-52-ARZ-Q64
—
—
—
AR1-52-Q44
AR1-52-ACC01-Q32
AR1-52-L44
AR1-52-L44
—
AR1-52-L44
AR1-52-L44
AR1-52-L44
AR1-52-Q44
AR1-52-Q44
AR1-52-DS400-Q100
AR1-52-Q44
AR1-52-Q44
AR1-52-Q44
AR1-52-L44
AR1-52-L44
AR1-52-L44
—
—
—
—
—
—
—
—
—
—
—
—
—
—
—
AR1-52-PLP1-L28
AR1-52-PLP1-L28
—
AR1-52-L44
AR1-52-L44
AR1-52-L44
AR1-52-L44
AR1-52-Q44
AR1-52-Q44
AR1-52-Q44
—
—
—
—
—
—
—
—
—
—
—
—
—
—
—
—
—
—
AR1-52-Q44
AR1-52-Q44
AR1-52-Q44
AR1-52-Q44
Error! Unknown document property name.User's Manual
The best way to get the most up-to-date list of target microcontrollers supported by PICE is as follows. Start the PICE software in the Demo mode. In the very beginning, it opens the PICE-52:
Demonstration Setup dialog. In this dialog, select a POD board and see the corresponding list of
target microcontrollers supported by this POD.
Notes
1. If you target microcontroller package is SOIC or SSOP, your should use the DIP package
adapter of PICE together with the additional DIP-to-SOIC or DIP-to-SSOP package adapter.
For more info, see Additional Package Adapters for PICE-52. To obtain such package
adapter, contact your local distributor or Phyton.
2. For the case of List A-2 and DIP package, use the AR1-52-D40 and ADP-51-2051-D20
adapters together.
3. If your target microcontroller package is of the QFP type, you need to additionally prepare
your device for emulation. For more info, see Using QFP Package Adapters.
4. For the microcontrollers of Micronas, a special external adapter is used in correspondence
with peculiarities of design of POD PR1-52-MIC0.
Atmel, list A-1
AT80F51,
AT80F52,
AT87F51,
AT87F52,
AT89C51,
AT89C52,
AT89LV52, AT89LV55,
AT80LV51,
AT80LV52,
AT87F55,
AT87LV51,
AT87LV52,
AT89C55,
AT89C55WD,
AT89LV51,
TS80C54X2,
TS80C58X2,
TS80C31X2,
TS80C32X2,
TS80C52X2,
TS87C52X2,
TS87C54X2,
TS87C58X2,
TSC80C31,
TSC80C51
Atmel, list A-2
AT89C1051, AT89C1051U,
AT89C2051, AT89C2051x2,
AT89C4051
Atmel, list A-3
AT87F51RC,
AT89C51ED2, AT89C51ID2, AT89C51RD2,
T89C51RB2, T89C51RC2, T89C51RD2,
TS80C51RA2,
TS80C58X2,
TS83C51RB2, TS83C51RC2, TS83C51RD2,
TS87C51RB2, TS87C51RC2, TS87C51RD2
Atmel, list A-4
AT89C51ED2, AT89C51ID2, AT89C51RD2,
T89C51RD2
Atmel, list A-5
T83C5101, T83C5102,
T87C5101
Atmel, list A-6
TS80C51U2,
TS83C51U2,
TS87C51U2
Version 1.1
Page 18 of 245
Error! Unknown document property name.User's Manual
Dallas Semiconductor, list DS-1
DS89C420, DS89C430, DS89C440, and DS89C450
Intel, list I-1
80C31, 80C32,
80C51, 80C51FA, 80C52,
87C51,
87C52
Intel, list I-2
83C51FA, 83C51FB, 83C51FC, 83C51RA, 83C51RB, 83C51RC,
87C51FA, 87C51FB, 87C51FC, 87C51RA, 87C51RB, 87C51RC
Micronas, list M-1
Eco: VCT4x21, VCT4x22, VCT4923, VCT4924, VCT4931, VCT4932, VCT4933, and VCT4934.
Basic: VCT4x41, VCT4x42, VCT4943, VCT4944, VCT4x46, VCT4947, VCT4948, VCT4951,
VCT4952, VCT4953, VCT4954, VCT4956, VCT4957, and VCT4958.
Basic 16/9: VCT4x61, VCT4x62, VCT4963, VCT4964, VCT4x66, VCT4967, VCT4968, VCT4971,
VCT4972, VCT4973, VCT4974, VCT4976, VCT4977, and VCT4978.
Advanced: VCT4980, and VCT4990.
OKI, list O-1
MSM80C154, MSM80C31F, MSM80C51F,
MSM83C154
Philips, list P-1
80C31, 80C31X2, 80C32, 80C32X2,
80C51, 80C51X2, 80C52, 80C52X2,
80C54X2,
80C58X2,
87C51, 87C51X2, 87C52, 87C52X2,
87C54X2,
87C58X2,
89C51, 89C51X2, 89C52, 89C52X2, 89C54,
89C54X2, 89C58, 89C58X2
Philips, list P-2
80C51FA,
80C51RA+,
83C51FA, 83C51FB, 83C51FC,
83C51RA+,
87C51FA, 87C51FB, 87C51FC,
87C51RA+,
87C51RB+,
87C51RC+,
87C51RD+,
89C51RA+,
89C51RB+,
89C51RC+,
89C51RD+,
83C51RB+,
83C51RC+,
83C51RD+,
89C51RA2xx, 89C51RB2xx, 89C51RC2xx, 89C51RD2xx
89LV51RB2, 89LV51RC2, 89LV51RD2,
89V51RB2,
89V51RC2,
89V51RD2
Philips, list P-3
P89LPC901, P89LPC902, P89LPC903
Philips, list P-4
P89LPC906, P89LPC907, P89LPC908
Philips, list P-5
P89LPC912, P89LPC913, P89LPC914
Philips, list P-6
P89LPC920, P89LPC921, P89LPC922
Philips, list P-7
P89LPC933, P89LPC934, P89LPC935
SST, list S-1
89C54, 89C58, 89C59, 89F54, 89F58
Winbond, list W-1
W77C32, W77C58, W77E58, W77L32, W77LE58
Version 1.1
Page 19 of 245
Error! Unknown document property name.User's Manual
Winbond, list W-2
W78C32C, W78C51D, W78L32
Winbond, list W-3
W78C54, W78C58, W78E516B, W78E51B, W78E52B, W78E54, W78E58, W78IE54, W78L51,
W78L52, W78L54, W78LE51, W78LE516, W78LE52, W78LE54, W78LE58
System Requirements
To run PICE-52 smoothly, you need an IBM PC compatible computer with the following components:
• Intel 80386 or better processor;
• Windows 95/98/NT 4.x/2000/XP operating system;
• video adapter with the resolution of 800×600 under 16-color palette or better and the corresponding video monitor;
• at least one USB port (v. 1.1 or 2.0) or one free serial port for communication between the
emulator software and hardware. If you need more than one emulator at the USB interface,
then the system should have one USB port per each emulator.
If you opt for the serial interface, we recommend using COM1 for the mouse and COM2 for PICE.
General View of Emulator
The emulator hardware has the following connectors and indicators:
• Connector for the emulator-to-PC interface cable (both serial and USB).
• Connector for the tracer cable. It connects eight external inputs to the tracer and four outputs
for synchronization of external devices to the target board.
• Power supply connector for the power cord.
• Three LED (light emitting diodes) to indicate its working state:
Power indicates that the emulator is turned on.
Reset
indicates that the emulator is in the Reset state.
Run
indicates that the emulator is executing the user’s program (the program being debugged).
For normal operation, the emulator is enclosed in the plastic case.
PICE-52 in the case
Version 1.1
Page 20 of 245
Error! Unknown document property name.User's Manual
PICE-52 without the case, with the tracer cable
Emulation of Memory
PICE-52 non-intrusively emulates the following types of the target microcontroller memory:
• Code memory;
• Xdata memory;
• EEPROM;
• Data memory;
• Indirect Data memory;
• Stack memory;
• Register memory.
In most cases, PICE uses its own physical memory (the memory installed on the emulator) to emulate memory of the system being developed. In the standard configuration, PICE-52 supports emulation of up to 64 Kb of Code memory and up to 64 Kb of Xdata memory.
Like the target microcontroller itself, the emulator is capable of working with external memory. In
advanced configurations, PICE can emulate a larger volume of memory by means of memory
banks. For more about the standard and advanced configurations, see Main Boards.
Also, the emulator can use physical memory on the target board. This capability contributes to
more realistic emulation of the target system at the final stages of development. When working with
memory on the target, internal Xdata or EEPROM, the emulator can use shadow copies of memory.
Note. Hereinafter, the terms “internal” and “external” describe resources with reference to the target microcontroller. With these terms, we do not refer to the emulator resources. For example, "internal memory" means the target microcontroller on-chip memory; and "external memory" refers to
the memory, which the target microcontroller accesses through its address/data bus. And depending on the current memory map, the external memory may reside either on the emulator or the target.
The emulator provides an advanced feature of Memory Coverage to help you monitor the use of
memory.
To watch the memory contents, use tabs of the Memory Dump window.
Banking of memory
PICE supports concurrent banking of both Code and Xdata memory and banking of only Code or
only Xdata: up to 16 banks for the Code memory and up to 7 banks for the Xdata memory. You just
access any banked memory cell, while PICE takes the pain of correctly and timely switching the
banks.
Version 1.1
Page 21 of 245
Error! Unknown document property name.User's Manual
Every bank is of 64 Kb in volume. This results in up to 1 Mb of external Code memory and up to
448 Kb of external Xdata memory. The maximum volume of memory available for emulation depends on particular main board used in the emulator (see Main Boards).
In PICE, you can specify any parts of banked memory as combined Code & Xdata memory. For
more about combined memory, see Code Memory.
For more about banks and developing the systems, see Memory Banks and Developing and Debugging Programs with Memory Banks. Also, see Connecting to Target with Banked Memory.
Mapping
Mapping means allocating the memory space for the user program on the emulator or on the target
device. For more about mapping, see Mapping of Memory.
Note. Although the emulator allows setting options in the whole memory space, these settings
regulate only the external memory. The internal memory specifically belongs to the microcontroller
and is not subject to the configuring.
Code Memory
The Code memory stores instruction codes for the target microcontroller. You cannot write to it in
the real-time mode.
PICE correctly emulates both internal and external Code memory, including work with memory
banks, and provides the following main features:
• Mapping of external Code memory (see Mapping of Memory).
• On-the-fly access, unlimited when the external Code memory is mapped to the emulator
memory, or through the shadow copies of memory in case the external Code memory is
mapped to the target board.
• Code breakpoints.
• Trace start/stop triggers.
The 8051 microcontrollers can work with up to 64 Kb of memory of this type, whether internal or external. Most microcontrollers have 64 Kb of Code memory on-chip. To work with a larger volume,
you have to use the external memory banks. The maximum volume of memory your program can
use in PICE equals the total volume of Code memory the emulator provides.
For more about the external Code memory, see Working with External Memory.
Combined Code & Xdata
Besides conventional use of the Code and Xdata memory separately from each other, PICE-52
emulates memory with combined features of these two types of memory. The main purpose for this
memory is to provide rewritable area of Code memory. Storing data in such area is not forbidden,
though less expedient.
The combined memory always implements two memory ranges with the same addresses: one in
the Code memory space and the one in the Xdata memory. In fact, they are one (single) common
range of the Code and Xdata memory spaces.
You can specify any part of the external Code or Xdata memory as combined Code & Xdata memory. Moreover, you can specify any number of combined areas with any locations within the available external memory space. Combined areas are impossible only within the internal Code or
Xdata memory range, if any.
To read the combined memory, hardware conjuncts signals PSEN and RD. To write, it uses the
WR signal.
How to control
To specify whether the target microcontroller in your system uses the internal Code memory, use
the Disable On-chip ROM flag in the Emulation MCU Options group of the Hardware Configuration dialog.
To specify a range of the combined memory type, use the Hardware Configuration dialog, the
Memory Map group, the Edit Map Range dialog.
Version 1.1
Page 22 of 245
Error! Unknown document property name.User's Manual
Xdata Memory
The Xdata memory stores data for your program. You can read from and write to Xdata memory. At
the same time, many its features are very similar to those of the Code memory. Modern microcontrollers may have internal Xdata memory (the on-chip Xdata). When the on-chip Xdata memory is
off or absent, then only the external Xdata (the off-chip Xdata) can be used.
PICE correctly emulates Xdata memory, including work with memory banks, and provides:
For the external Xdata memory
• Mapping of Memory.
• On-the-fly access, unlimited when the Xdata memory is mapped to the emulator memory, or
through the shadow copies of memory, when the Xdata memory is mapped to the target
board.
• Data breakpoints (read, write and read/write). The total amount of data breakpoints equals the
total amount of Xdata memory addresses. For example, with the total Xdata memory volume
of 64 Kb, the emulator supports up to 64 K data breakpoints.
For the internal Xdata memory
• On-the-fly watching its contents through the shadow copies (when your POD supports this
feature, see POD Boards).
• Data breakpoints (when your POD supports this feature).
The 8051 microcontrollers can work with up to 64 Kb of memory of this type, whether internal or external. To work with a larger volume, you have to use the external memory banks. For more about
the external Xdata memory, see Specifics in Supporting the Xdata Memory and Working with External Memory.
Also, some area(s) of external Xdata memory may be part of combined Code & Xdata memory. For
more about the combined memory, see Code Memory.
To read from and write to Xdata memory, the microcontroller uses the MOVX instructions.
How to control
Controlling the internal Xdata memory makes sense only if your target microcontroller features it.
You cannot explicitly switch on/off the internal Xdata memory or specify its volume from PICE software dialogs. Your program fully determines which Xdata memory (internal or external) to use. To
turn the internal Xdata on/off, use the control bit in a special function register from your program.
EEPROM
Some chips of the 8051 family have electrically erasable programmable read-only memory
(EEPROM). You access EEPROM using the MOVX commands, that is why EEPROM may be considered as a sort of Xdata memory.
The emulator cannot access the EEPROM memory on-the-fly (neither read, nor write). However, if
your POD board supports shadow copies of memory for EEPROM Xdata, you will be able to watch
its contents.
Specifics in Supporting the Xdata Memory
There are specifics in operation of the 8051 family microcontrollers. Modern makes may have and
work with several kinds of Xdata memory: internal Xdata memory, EEPROM and external Xdata. At
the same time, the microcontroller CPU itself does not distinguish these kinds of Xdata memory: it
uses the same command to access any of them. The special function registers control the kind of
Xdata memory the microcontroller is working with at the moment. And the program being developed controls the registers.
The Memory Dump window has separate tab for each kind of Xdata memory that the selected target microcontroller has or supports: the on-chip Xdata, EEPROM, the off-chip Xdata, and also special tab for the “current” Xdata.
Version 1.1
Page 23 of 245
Error! Unknown document property name.User's Manual
Compilers cannot provide symbol information about the current kind of Xdata memory. This stipulates the following specifics when displaying the Xdata contents in the real time:
• Case 1: The selected target microcontroller has or supports more than one kind of Xdata.
In the real-time mode, PICE itself cannot identify, which kind of Xdata the microcontroller is
accessing, and location of particular variable in the whole Xdata space. As a result, the Xdata
tab displays only ‘?’. In the halt mode, the Xdata tab displays the copy of specific Xdata
memory that has been the latest turned on for CPU (on-chip Xdata, off-chip Xdata or
EEPROM) by the moment of halt.
Each specific Xdata tab always correctly displays its respective kind of Xdata memory. So, to
see the Xdata memory in the run time, you should switch to the tab of interest.
• Case 2: The selected target microcontroller has or supports only one kind of Xdata.
This time the Xdata tab is the only tab for Xdata memory in the Memory Dump window. For
the off-chip Xdata, it always displays the memory contents. For the on-chip Xdata and
EEPROM, it displays in the halt mode. It will display the on-chip Xdata and EEPROM in the
real-time mode, if your POD board supports shadow copies of these kinds of Xdata memory
(see POD Boards).
How to control
To select a target microcontroller, use the Emulator Components group of the Hardware Configuration dialog.
To modify variables located in the EEPROM, use the EEPROM Xdata tab of the Memory Dump
window, which provides special embedded support for writing to EEPROM in the halt mode. You
cannot do this in the run time, because you can only watch EEPROM through its shadow copy.
In the halt mode, the whole Xdata is accessible.
Data Memory
Target microcontrollers have and work with only internal memory of this type. Its total volume is 256
bytes. Its lower 128 bytes are just Data memory for general use, while its upper 128 bytes serve to
store the special function registers (SFR). The registers are not always located in the Data memory
side by side. Depending on type of microcontroller, there may be more or fewer SFRs. And therefore, the upper Data memory may have unused cells between the registers.
The emulator cannot map the Data memory or access it on-the-fly (neither read, nor write). All information is exchanged (any access is performed) only in the halt mode.
There is no Memory Coverage for this type of memory.
Indirect Data Memory
The indirect data (Idata) memory is distinguished by method of access. To access an indirect data
memory cell, you use a register, which stores address of this cell:
mov @Rx, src
mov dest, @Rx
Target microcontrollers have (and work with) only internal memory of this type. Its total volume is
256 bytes. Its lower 128 bytes physically coincide with the lower half of Data memory. The upper
128 bytes of the Data and Idata memories are physically different. You can access the upper Idata
memory only with the commands mentioned above.
The emulator cannot map the Idata memory or access it on-the-fly (neither read, nor write). All information is exchanged (any access is performed) only in the halt mode.
There is no Memory Coverage for this type of memory.
Note. Historically, the Idata memory volume was 128 bytes. Developers used to work with this
memory using access commands for Data memory (direct addressing). Now, if you write to cell 130
with the MOV @Rx command (indirect addressing), and then try to find your data using the direct
addressing, you will not find it. Instead, you will get a cell in the upper Data memory, which is either
empty or inhabited by some SFR.
Version 1.1
Page 24 of 245
Error! Unknown document property name.User's Manual
Stack Memory
There is no separate Stack memory in 8051 microcontrollers. You use just a segment of Idata
memory to arrange the stack. Nonetheless, there is a special register, SP (stack pointer) and we
support the model of stack by working with this pointer. PICE neither uses your stack nor restricts
you in using it.
If the first cell of your stack is in the lower 128 bytes and the stack pointer begins addressing a cell
above 128 bytes (the stack enters the upper half of memory), then the stack grows exactly to Idata.
Generally, it is up to the developer how to arrange the stack in a program for 8051 microcontrollers.
Since the Stack memory is the derivative type of the Idata memory, the emulator cannot map the
Stack memory or access it on-the-fly (neither read, nor write). All information is exchanged (any access is performed) only in the halt mode.
There is no Memory Coverage for this type of memory.
Register Memory
There are 8 registers (r0...r7) in the lowest 32 bytes of Idata memory. They conditionally represent
the Register memory, because they are overlaid on the Data and Idata memory.
The registers are arranged in four banks (4 banks × 8 registers = 32 cells). Cells from 0 to 7 are the
first bank; cells 8...15 are the second bank, and so on. Two bits in the PSW register (Program
Status Word) determine which bank is currently selected. When calling a subroutine, you can keep
the working contexts by switching between the register banks. However, keeping the contexts using this mechanism may not be as simple in each case. So, it is up to the developer whether to use
the register banks or not.
To watch the registers, use the Peripheral Device window (the registers window) or the Watches
window. Anyway, the registers are just the lower cells of the Data/Idata memory, arranged and displayed in one more form.
Since the Register memory is the derivative type of the Data/Idata memory, the emulator cannot
map the Register memory or access it on-the-fly (neither read, nor write). All information is exchanged (any access is performed) only in the halt mode.
There is no Memory Coverage for this type of memory.
Working with External Memory
Some target microcontrollers of the 8051 family have only internal (on-chip) Code memory, some of
them have no internal and can work with external (off-chip) Code memory. Others feature both options. Also, many of them have internal Xdata memory or can work with external Xdata memory.
Also, many of them both have the internal Xdata and can work with the external one.
When the target device has both internal and external Code and/or Xdata memory, the emulator
switches them exactly the same way as the regular microcontroller does. So, for the user program,
the whole Code memory area and the whole Xdata memory area are single units.
Two static ports, P0 and P2, of the regular microcontroller are the main tool for accessing both external Code memory and external Xdata. The hardware mechanism of connecting the external
memory is almost the same for Code and Xdata memory. In both cases, it works over the same two
ports, P0 and P2.
When a regular microcontroller works with the internal Code or Xdata memory, these ports operate
in their usual mode of general-purpose input/output and their 16 pins are available for general
tasks. At the moment the user program addresses the external memory, the regular microcontroller
automatically switches ports P0, P2 and they become the multiplexed data/address bus (this bus
transmits both instruction/data address and instruction/data). PICE absolutely correctly emulates
operation of these ports for each of the supported target microcontrollers.
When you use your target board with PICE, and your POD board is based on a hook or an enhanced hook, you should take into account that electrical characteristics of ports P0 and P2 (the
load characteristic, the allowable load and time delays) may differ from those of the regular microcontroller. For exact values, see description of particular POD board (POD boards).
Version 1.1
Page 25 of 245
Error! Unknown document property name.User's Manual
Shadow Copies of Memory
The emulator provides a perfect shadow copy for every external (Code or Xdata) memory area
mapped to the target device. Also, some POD boards provide shadowing for the on-chip Xdata
memory and EEPROM. The copy is absolutely equivalent to its respective area during the whole
emulation process and you can watch the state of area without halting the emulation.
However, shadow copies are not always allowable. For example, shadowing some peripheral chips
may result in loss of information or in unauthorized switching of the user hardware. That is why, we
recommend to evaluate expedience of shadowing the external memory before enabling it.
You can shadow the whole target memory.
How to control
To turn shadowing on/off, use the Enable External Memory Shadowing flag in the Memory Map
group of the Hardware Configuration dialog. The flag controls shadowing of all corresponding
memory areas. When POD provides shadowing for the on-chip Xdata memory and EEPROM, it is
always turned on.
If you specify a new configuration for the memory areas mapped to the target (in the Memory Map
group), set up this flag and press OK, then before starting the emulation, the emulator will prepare
the shadow copy of the mapped areas. It may take certain time for a large volume of areas mapped
to the target. Later, while running your program, you just see the contents of the mapped memory
areas in the respective window. And if the flag is off, the window will display the question chars
(“?”) instead of actual data in the respective memory cells.
Memory Coverage
This powerful function monitors usage of the Code memory, off-chip Xdata, on-chip Xdata (XRAM)
memory and EEPROM. When the user program accesses a memory cell, this function marks the
cell. Each memory cell, which has been accessed at least once, is marked (colored) in the Memory
Coverage window in accordance with its legend.
For the Code memory, PICE also ticks off the lines in the Source window and the Disassembler
window corresponding to the accessed cells.
This function is useful for identifying unused areas of memory at the final stages of program development. Eliminating such areas will optimize usage of the microcontroller resources, especially
when they are limited.
Memory Coverage cannot monitor both Code and Xdata memories simultaneously. Particular types
of memory accessible for this function depend on the type of POD. Also, there is no Memory Coverage for Data and Idata memory at all (the Stack and Register memory included). For more about
the accessible types, see POD boards.
How to control
To set up the memory coverage parameters, use the Memory Coverage group of the Hardware
Configuration dialog before starting the program under debugging. PICE will perform coverage
only for the specified type of memory.
Memory Banks
Banked memory is an extension of the standard memory model of 8051 microcontroller. Banking
gives you memory with addresses above 64 Kb. All together, N memory banks of the target system
make up the continuous memory area with the total volume of N times 64 Kb. Memory banking
works only with the external memory. For more about the external memory, see Working with External Memory.
To exactly address a banked memory cell, the target system uses the extended linear addressing.
The user program forms an extended linear address by adding the bits of bank number to the standard 16-bit address (see the bank memory ranges in the table below).
Version 1.1
Page 26 of 245
Error! Unknown document property name.User's Manual
Bank
BANK0
BANK1
BANK2
BANK3
BANK4
...
BANK30
BANK31
Address range
00000h- 0FFFFh
10000h- 1FFFFh
20000h- 2FFFFh
30000h- 3FFFFh
40000h- 4FFFFh
...
1E0000h-1EFFFFh
1F0000h-1FFFFFh
In the whole addressable memory space, the banks do not overlap each other. When the target microcontroller switches the memory banks, a special engineering task is to ensure smooth operation
of the target system in the vicinity of the moment of switching. To solve the task, some special
area, called ‘Common area’, is organized in each bank of Code memory. Among all Code memory
banks, the Common areas are equal and contain the same piece of program code (the common
code).
The common code includes the interrupt vectors and other
important pieces of program code, whose relative addresses
within each bank shall be fixed. That is why, in each bank, the
Common area always begins from address 0. The rest of the
bank volume above the Common area is the Banking area
(see figure). It contains the user program code.
Methods of switching the banks
To control the additional address lines of the extended address (to switch the banks), you can use
either the microcontroller port or a cell in the external Xdata memory. PICE supports both methods.
A. With the first method, target systems employ a few bits of some port of the microcontroller. Usually, this is port P1 or P3, however, you may use almost any port except for ports P0 and P2.
You can use other lines of this port (unused for the switching) for standard input/output, because
the emulator and your program does not produce an effect on their state when accessing the
banked memory.
B. With the second method, your program writes the necessary bank address to a chosen Xdata
cell. The external register latches the byte from this cell. The register outputs control the additional
address lines of the extended address bus.
You cannot use unused bits (output lines) of this external register as additional I/O lines because,
the emulator writes '0' to every bit unused in switching the banks.
The target hardware includes the whole circuitry that implements the latch and its address lines.
Therefore, if your program implements this method, you cannot debug it without the target device.
On how to provide the additional bits of the extended address in PICE, see Connecting to Target
with Banked Memory.
How to control
To enable banking and set its parameters, use the Banking group of the Hardware Configuration
dialog. To specify the Banking area start address for the compiler, use the Project Options dialog,
the Memory Model group.
The debugger keeps the current bank number in a special debug register, __CURRENT_BANK.
You can watch or control this register in the Watches window, as well as use it in script files.
Version 1.1
Page 27 of 245
Error! Unknown document property name.User's Manual
Connecting to Target with Banked Memory
Signals in the additional address lines of the target system represent the bits of memory bank
number. The emulator obtains these bits over the tracer cable. The first table below lists the cable
inputs used depending on the amount of memory banks in the target system, while the second one
specifies the address lines corresponding to the cable inputs. The first diagram below explains
connecting to the target board, which switches 16 banks over the microcontroller port (in this case,
P1).
Amount of banks
32
16
8
4
2
Cable input
EXT0
EXT1
EXT2
EXT3
EXT4
Cable inputs used
EXT4, EXT3, ....,
EXT3, EXT2, EXT1,
EXT2, EXT1,
EXT1,
EXT0
EXT0
EXT0
EXT0
EXT0
Address line
A16
A17
A18
A19
A20
If you are using less than 32 banks, the emulator will leave some lines of these five unused. For
example, in a system with two banks (when it has only 128 Kb of external memory), the emulator
makes use of only 1 line (input EXT0) and do not need the rest 4 lines. You can leave these rest
lines open or use them for your tasks (say, tracing the external signals). So, in this example, you
will have 7 lines of the tracer cable (4 plus remaining 3 inputs of the tracer cable) for your tasks.
Notes
1. To absolutely ensure validity of signal levels, connect the tracer cable inputs directly to the
points, where the resulting address (bank number) signals are applied to the memory chips
(see figure below).
2. When working with the emulator in the standalone mode, you have to connect the tracer cable
inputs to the adapter pins, which correspond to the port pins of the target microcontroller
Version 1.1
Page 28 of 245
Error! Unknown document property name.User's Manual
package. Otherwise, the banking will not operate. For more about your adapter, see Package
Adapters. For more about the standalone mode, see Scenarios of Use.
How to control
To specify the EXT lines for the banking, use the Banking group of the Hardware Configuration
dialog.
Mapping of Memory
Memory mapping is a powerful debugging function. Mapping means allocating some block of
memory or the whole memory to the emulator (memory on the emulator) or to your target board. In
the former case, you can debug a program without connecting to the target device (for example,
when the device is not physically implemented). This may help decrease the time of developing the
microprocessor system. In the latter case, you program will work immediately with physical memory
on the target board and will behave more authentically during debugging.
Mapping has no effect on the available memory (banked memory) volume in PICE. It is fully available with each scenario of use and does not require any changes in the target hardware memory
configuration.
PICE can map only the external Code memory or the external Xdata memory. The emulator cannot
map the internal memory of microcontroller, like the Data or Idata memory and their derivative
types of memory (the Stack and Register memories).
To map memory, PICE-52 uses named address ranges, which are multiples of 512 bytes. So, a
range contains an integer number of 512-byte memory blocks. The smallest memory block, which
the emulator can map, is of 512 bytes for both Code and Xdata memory.
For each range, you can give a custom name (define it yourself) or use the default name offered by
PICE. A specific set of address ranges (configuration of allocated memory) is called "memory map
scheme".
Each project and each session (when working without IDE) has a scheme. By default, both memory
spaces (Code and Xdata) are mapped to the emulator. PICE automatically saves the new schemes
or the changes in the schemes. So, each scheme stores the last configuration you specified for it.
Upon starting, PICE restores the last active scheme of the previous session.
PICE keeps the list of all schemes you ever used (both in projects and without them) and have not
deleted. All these schemes are available for you to use in every debugging process.
With the memory volume of 1 Mb, the amount of possible memory map schemes is very large and
you can satisfy almost any your debug requirement for mapping.
The emulator, while mapping memory to its on-board memory, disables the RD, WR and PSEN
signals coming to the target board. The ALE signal and the microcontroller ports are always directly
connected to the package adapter pins. As a result, the target memory is inaccessible and does not
interfere or conflict with the emulator memory.
Mapping and on-the-fly access
PICE cannot directly access physical memory on the target board in real time. The emulator arranges shadow copies of memory areas mapped to the target board. With these copies, you restore capability of on-the-fly watching the mapped areas.
Version 1.1
Page 29 of 245
Error! Unknown document property name.User's Manual
The memory mapped to the emulator is absolutely transparent for the emulation microcontroller
and the microcontroller can access it on-the-fly. For more info, see On-the-fly Access to Microcontroller Resources.
Mapped memory and debugging
Mapping has no effect on operation of breakpoints.
Rules for Mapping
• PICE can map only external memory. PICE cannot map the internal memory (the internal
Code, internal Xdata, EEPROM, Data or Idata memory).
• PICE supports an unlimited number of ranges.
• The Hardware Preset range is the default memory map in PICE. It serves to initialize the
emulator hardware at the moment of start and to inform you about the initial state of emulator
hardware. You cannot edit this range.
• The memory ranges are written in the memory map in the same order, as listed in the Memory Map group. Ranges may overlay each other.
• If more than one memory range sets the same parameter in the same address area, the parameter will take the value from the last range in the list. For example, the following list of
ranges in the memory map:
Hardware Preset
Range1
Range2
Æ 0000H..0FFFFH, Code & Xdata, Emulator, Separate;
Æ 3000H..4FFFH, Code & Xdata, Target;
Æ 4000H..7FFFH, Xdata, Emulator, Separate;
will bring the following result in the memory:
0000H..2FFFH
3000H..3FFFH
4000H..4FFFH
4000H..4FFFH
5000H..FFFFH
Æ Code & Xdata, Emulator, Separate;
Æ Code & Xdata, Target;
Æ Code, Target;
Æ Xdata, Emulator;
Æ Code & Xdata, Emulator, Separate.
• When you need to map one range of combined memory to the target device, which carries a
piece of the combined memory (overlay of Code and Xdata memory), you should specify the
Code & Xdata type of memory in the Edit Map Range dialog.
How to control
To use your target memory during debugging or to set up the mapping parameters, use the Memory Map group of the Hardware Configuration dialog before starting the program under debugging.
For example, to map the combined memory range to the emulator, set Map Range to to Emulator; Code & Xdata Combined. To map the combined memory range to the target board, set memory type to Code & Xdata and set Map Range to to Target.
Breakpoints and Triggers
PICE-52 uses the breakpoints and triggers of several types:
• Code breakpoints.
• Data breakpoints.
• Complex breakpoint triggers.
• Trace start/stop triggers.
Code Breakpoints
Code breakpoints are the breakpoints set at an address in the Code memory. If the program under
debugging is running continuously and reaches the breakpoint address in the program memory, it
will stop.
Version 1.1
Page 30 of 245
Error! Unknown document property name.User's Manual
The maximum amount of code breakpoints that you can set up equals the amount of instructions in
the user program (the maximum program memory volume) supported by the POD employed (see
POD Boards).
Except for the breakpoints, which are set to one program address, you can set and clear the
breakpoints within the address ranges. This is useful for tracing the program "flights" to unavailable
addresses.
The code breakpoint is breakpoint of the "break-before-execution" type. This means that when your
program reaches the breakpoint address, it will stop before executing the instruction located at this
address.
How to control
Use the following ways to set and clear the code breakpoints:
• The toolbar button or the local menu command of the Source window or the Disassembler
window (this way is the simplest and most convenient). The breakpoint is set/cleared at the
address corresponding to the cursor position in the window. Also, use this way in the Memory
Layout window, Code Browser window and Memory Coverage window (in the lower panel
of its Graph tab and in the left panel of the Functions/Data Objects tab).
• The Code Breakpoints command of the Breakpoints menu. Also, this menu has the Clear
All Breakpoints command.
The Source and Disassembler windows display the code breakpoints by highlighted lines with the
user–defined background color.
When the program under debugging is reloaded, all breakpoints are cleared by default, because
usually the program is reloaded after recompilation, which may change the particular code addresses. To turn off this default option, use the Debug Options dialog.
Data Breakpoints
Data breakpoints are the breakpoints set at an address in the data memory. They allow you to stop
running your program, when it performs the specified access to data (Read, Write or Any) at the
specified addresses.
The maximum amount of available data breakpoints corresponds to the data memory volume supported by the employed POD (see POD Boards).
PICE provides breakpoints for the on-chip and off-chip Xdata memory, EEPROM and direct Data
memory (here, a particular list of data memory types depends on the target microcontroller selected). PICE cannot set breakpoints on the Indirect Data memory. Also, see note 3 below.
The data breakpoint is breakpoint of the "break-after-execution" type. This means that when your
program reaches the breakpoint address, it will stop after the instruction is accomplished, which
accesses the data memory.
How to control
Use the following ways to set and clear the data breakpoints at the selected object:
• The toolbar button or the local menu command of the Source window, the Inspector window,
the Watches window, the AutoWatches window and the Memory Dump window.
• The Breakpoints menu, the Data Breakpoints command (the Memory Access Breakpoints dialog).
In the Source, Watches and AutoWatches windows, you set breakpoints on the names of variables. In the Inspector window, you can set breakpoints on a large object (array or structure) and
on a single element of such object. The size of the object (variable) is automatically taken into account. For example, if the selected object is an array or structure, then access to any element of
this array or structure will cause the break.
In the Memory Dump window, you set breakpoints at the memory address. The size of the object
(byte, word or double word) located at this address is taken into account.
Later you can change the data breakpoint parameters using the Memory Access Breakpoints
dialog.
Version 1.1
Page 31 of 245
Error! Unknown document property name.User's Manual
Notes
1. The emulator sets up the breakpoint at the absolute address. If you load the recompiled program module (the addresses of which have changed), the previously set breakpoints may not
work properly.
2. The PICE windows do not show the data breakpoints by highlighting or marking. The only
place to see them is the Memory Access Breakpoints dialog.
3. PICE does not provide breakpoints simultaneously at the Xdata memory (both off-chip and onchip) and EEPROM, or at the off-chip and on-chip Xdata. If you try to set a breakpoint in kind,
PICE will warn you and offer to move the already existing breakpoints to the same memory
type of the breakpoint you are trying to set. For example, if you try to set a breakpoint at the
on-chip Xdata, while other breakpoints are at EEPROM (or the off-chip Xdata), you will get the
following warning:
Complex Breakpoint Triggers
The term of Complex Breakpoint Trigger refers to the hardware 96-bit comparators, which are the
basis of the hardware breakpoint processor. When employed, the complex breakpoint trigger compares the given set of parameters with the preset condition. If the set of parameters meets the condition, the trigger output will switch to logical “1”. Otherwise, the trigger output will immediately
switch back to “0”.
With these breakpoint triggers, you can set conditions for the emulation break (the break conditions), which include up to 96 parameters simultaneously, such as address, data, type of the emulation processor bus cycle, and state of the user external signals. Each bit in the trigger represents
a parameter. You can program any of these bits to be either masked or compared to zero or one.
You can mask both whole groups of parameters and single bits in any group of parameters.
If a bit is masked, the trigger will ignore the corresponding input signal. Otherwise, the trigger
checks the input signal for equality to logical zero or one. The comparison result is TRUE only if all
unmasked comparator inputs meet the specified conditions.
Masking the bits is a remarkable capability of the complex breakpoint trigger. When skillfully used,
this capability makes the breakpoint processor a very effective tool for exploring and catching the
most elusive bugs in a microcontroller system.
PICE has 4 independent complex breakpoint triggers (T0, T1, T2 and T3), which are identical by
their functions and input data.
When does the trigger compare its inputs?
The trigger compares the input values on each machine cycle of the emulation microcontroller at
the moment of reading/writing the signals in the program and data memory buses of the emulation
microcontroller. That is, the trigger repeats comparisons with the machine cycle frequency.
Note that the triggers correctly work only with those external signals, which alternate with the frequency of no higher than the frequency of the emulation MCU.
Every complex breakpoint trigger inputs the following data, which, in fact, is a subset of the trace
buffer frame data:
Version 1.1
Page 32 of 245
Error! Unknown document property name.User's Manual
• Addr: Code/Xdata address (3 bytes).
• Op: instruction opcode or MOVX data (1 byte).
• Code/Xd: Code/Xdata bus cycle type (1 byte).
• C: Code memory status (1 bit).
• DA: internal direct data address (1 byte).
• DD: internal direct data (1 byte).
• T: internal direct data access type (2 bits).
• D: indicator of the currently selected pointer, DPTR0 or DPTR1 (1 bit).
• S: state of the internal RESET signal (1 bit).
• R: state of the external RESET signal (1 bit).
• P: indicator of the Power Down mode (1 bit).
• I: indicator of the Idle mode (1 bit).
How to control
To set up the triggers, use the Triggers T0..T3 Setup dialog. You can reach it from the Breakpoint
Processor dialog.
Trace Start/Stop Triggers
The trace start/stop triggers are the hardware tools for the Dynamic Tracing mode of the hardware
tracer. You can set up the trace start/stop triggers at any address in the Code memory. If a start
trigger is set up and the program reaches the program memory address, on which the start trigger
is set up, the hardware tracer will begin recording the trace buffer frames into its buffer. The tracer
stops recording the frames, when the user program reaches the program memory address, on
which the stop trigger is set up (if any). The tracer writes the frame related to the start trigger address, however, it does NOT write the frame related to the stop trigger address.
PICE does not allow setting the start and stop triggers at the same address. In any case, the stop
trigger has the higher priority than the start trigger.
The maximum amount of triggers that you can set up at any moment of time equals the maximum
amount of instructions in the user program (the maximum program memory size) supported by the
POD employed (see POD Boards).
How to control
To set or clear the trace start/stop triggers, use the following ways:
• The window toolbar buttons of the Source window or the Disassembler window (the most
simple and fast way):
toggles the state of the start trigger (sets its up and clears).
toggles the state of the stop trigger.
The trigger is set/cleared at the address corresponding to the current cursor position within the
window.
• The Breakpoints menu, the Trace Start/Stop Triggers command, the Trace Start/Stop
Triggers dialog (to set or clear triggers) or the Clear All Breakpoints command (to clear all
triggers).
The Trace Start/Stop Triggers dialog is only useful, if you need to scan the list of the set triggers,
to clear the selected triggers and to work with the trigger ranges.
When the program under debugging is reloaded, all triggers will be cleared by default, because
usually the program is reloaded after recompilation, which may have changed the particular code
addresses. To disable this default option, use the Debug Options dialog.
Version 1.1
Page 33 of 245
Error! Unknown document property name.User's Manual
Hardware Breakpoint Processor
Breakpoint processor (BPP) is an advanced hardware logic circuit designed to help debug the user
programs. It processes output signals of the complex breakpoint triggers and the Tracer Overflow
signal. The entire logic circuit configuration is called the resultant Complex Condition (the Complex
Event). The emulator uses this event to break the emulation after a delay and/or to start/stop the
hardware tracer (when it is in the Forward Tracing or Backward Tracing mode). For more about
controlling the tracer, see the Tracer Control dialog.
You can disable breaking the emulation from BPP (with the Enable Break button). The tracer is
always connected to the Complex Event output.
The breakpoint processor contains:
• two event counters to count complex events identified by the complex breakpoint triggers;
• delay counter to perform the specified delay of the BPP operation (halt of the user program);
• four adjustable logic elements to form the resultant Complex Condition;
• control circuit to start/stop the tracer, when it is in the respective modes.
Counters
The event counters and delay counter are just 16-bit counters and differ only in what they count
(what signal arrives to their input). For the delay counter, these are the machine cycles of the emulation microcontroller. For the event counter, these are the events identified by the complex breakpoint trigger.
One event corresponds to the machine cycle of the emulation microcontroller, during which the
conditions specified for the breakpoint trigger remain true. This means that the event duration is always equal to the duration of the machine cycle, during which the event occurred. Note that the
machine cycle frequency may change.
VERY IMPORTANT: If the specified condition remain true, for example, during 5 consecutive machine cycles, the counter will interpret them as 5 separate (consecutive) events.
The counter works in the decrement mode. It receives the input signal, counts down its initial value
until it equals 1 (for the event counter) or 0 (for the delay counter) and let the received signal
through to its output (outputs the TRUE signal to the rest of BPP). For example, if the event counter
initial value is 1, it will immediately send the input signal through. If the event counter is set to 5, it
will pass the signal at the moment the fifth event occurs after the start of your program.
Adjustable logic elements
Three adjustable logic elements have two configurations to perform either logical OR function, or
AND function. You can toggle the element configuration. In addition to these two configurations, the
fourth adjustable element has two more configurations, when one its input is connected to the output and the other input is not.
On-the-fly access to the breakpoint processor
The PICE breakpoint processor provides on-the-fly access to microcontroller resources. You can
set up and change the break conditions in BPP, while running your program in the real-time mode.
How to control
To set up all hardware units, which implement the resultant Complex Condition, use the Breakpoint Processor dialog. You can set up simple and composite conditions to break emulation. Accordingly, there are two versions of the Breakpoint Processor Control dialog.
Hardware Tracer
The emulator provides the tracer functions to help you to observe and record the on-chip processes, and also to facilitate interoperation with external measurement instruments (like an oscilloscope or a spectrum analyzer). The tracer can record all the data related to the instructions fetched
by the emulation processor, when it runs your program.
The tracer provides four modes of data recording. The modes differ by the tracer start and stop
conditions used; some of them use the Complex Event from the hardware breakpoint processor.
Version 1.1
Page 34 of 245
Error! Unknown document property name.User's Manual
Trace buffer
The tracer writes data into its buffer, in a sequence of trace buffer frames, one frame each machine
cycle.
The trace buffer features the ring structure with the capacity of 16 K frames (of 128 bits each). If the
buffer has already filled up, the tracer will write the subsequent frames over the previous (oldest)
ones. So, by the moment of halt, the trace buffer contains up to 16 K last frames recorded before
the moment of break.
Once all 16 K frames are written, the tracer sends the Tracer Overflow signal to indicate that the
trace buffer address counter has overflowed. The tracer resets this signal only in the break mode.
Use this signal to stop the emulation or the tracer, when you need to fill up the trace buffer without
overwriting the already recorded data by the newer frames. For example, to explore a process that
occurs only once.
On-the-fly access to the tracer
The tracer supports the on-the-fly access to its contents. You can view the already recorded information while your program goes on running. To enable this capability, set up the Allow Reading of
Trace Buffer at Run-time flag in the Hardware Configuration dialog. The PICE software can
read the buffer in two ways:
• Automatically, at the user-defined time interval. For this option, enable the Redraw on flag
and specify the delay time (Redraw Delay) in the Auto-Step / Redraw Setup dialog. To access this dialog, use the Run menu.
• At an arbitrary moment of time. To do this way, press the Redraw Screen button on the PICE
toolbar.
To display the trace buffer contents, the PICE software reads it over the PC interface chosen for
work with PICE. Reading the buffer takes some piece of time, because the serial interface is relatively slow. For this time interval, the tracer stops recording the frames to the buffer. After the reading is over, the tracer resumes writing the frames. This means that you consciously lose some data
of your process. The on-the-fly access to the trace buffer may be expedient in the case of process
with relatively rare events, which you might need to explore without breaking the very process.
For more info about the on-the-fly access, see On-the-fly Access to Microcontroller Resources.
Working with tracer
To set the tracer operation mode, use the Tracer Control dialog. Note that the hardware tracer always receives the BPP output signal (the Complex Event). However, it makes use of this signal
only in two modes (Forward Tracing or Backward Tracing).
You can view the trace buffer contents in the Tracer window.
If you need to use the signals from the target board in the debugging process or to synchronize external instruments with your device, use the tracer cable.
Tracer Cable
The tracer cable serves to connect the tracer with a number of points of the target device or external instruments. The main board has special connector for this cable (the 'Tracer' connector) accessible outside the PICE case (see General View of Emulator).
With this cable, you can connect as many as 8 external digital signals (EXT0..EXT7) to the hardware tracer inputs. The Tracer window displays the states of these signals.
Also, this cable contains the outputs of complex breakpoint triggers. You can use these signals to
synchronize external events or devices (for more info, see Outputs for Synchronization of External
Devices). The tracer cable has 14 wires in total, the pin assignment (from right to left) is as follows:
Pin number
1
2
3
4
5
Version 1.1
Signal
EXT0
EXT1
EXT2
EXT3
EXT4
Page 35 of 245
Error! Unknown document property name.User's Manual
6
7
8
9
10
11
12
13
14
EXT5
EXT6
EXT7
T0
T1
T2
T3
GND
GND
Requirements for circuits
The circuits connected to the tracer inputs shall meet the following requirements:
• The output signal voltage shall meet the CMOS or TTL level of hardware, whose Vcc is from
2.4 to 5.5 V.
• The state of these signals, if it changes, shall change over a time period of at least two times
longer than the duration of cycle of the emulation microcontroller.
• The circuits connected to the tracer input shall have common grounding with the emulator. To
ensure common grounding, it is sufficient to insert the emulator with own ground circuit connection into the target board, or to connect the 13 and 14 leads of the trace cable to your
GND circuit.
Outputs for Synchronization of External Devices
The T0..T3 signals of the tracer cable (pins 9 through 12) are the outputs of the complex breakpoint
triggers. The initial level of these signals correspond to logical "0". When a complex breakpoint trigger operate (switches to the active state), its output signal changes level to logical "1".
You can use these signals to synchronize an oscilloscope or logic analyzer, to control operation of
target devices, to start/stop an external process, etc.
DC output specifications
• The maximum high level output voltage (V oh) = 3.3 V at Ioh = 0.1 mA.
• The low level output current (I ol) = 12 mA at V ol = 0.45 V.
• The high level output current (I oh) = -4 mA at V oh = 2.4 V.
On-the-fly Access to Microcontroller Resources
The on-the-fly access means that you can access the corresponding resource not only in the break
mode, but also during execution of your program in the real-time mode without breaking the emulation. This capability facilitates debugging the programs. The emulator provides the on-the-fly access to the following its resources:
• Code memory mapped to the target device (through the shadow RAM) or to the emulator;
• Off-chip Xdata memory mapped to the target device (through the shadow RAM) or to the
emulator;
• On-chip Xdata memory through its own shadow RAM;
• EEPROM through its own shadow RAM;
• code breakpoints and data breakpoints;
• trace start/stop triggers;
• hardware tracer buffer;
• hardware breakpoint processor;
• Memory Coverage window;
Version 1.1
Page 36 of 245
Error! Unknown document property name.User's Manual
• real-time timer (see Real-time Timer and Frequency Measuring System).
How to control
To set up the on-the-fly access mode, use the Auto-Step / Redraw Setup dialog. If the Redraw on
flag is enabled and the program is executed in the real-time mode, the screen will be updated
automatically at the intervals you specified in the Redraw Delay field.
WARNING: The windows with symbol information display the "Inaccessible" message for all
these resources, and the Memory Dump windows display the "??" message.
Debug Registers
The microcontroller resources, which are not explicitly present in any of its address spaces and
therefore, are not directly accessible for you, or which are the derivatives of the ordinary accessible
resources, are referred to as debug registers.
The debug registers are not specified in the target microcontroller architecture. They help to work
with the microcontroller resources, which cannot be accessed in the ordinary way. In addition, you
have a tool for building a model of the external environment and its effective use. For example, the
Program Counter is the debug register.
Program Counter
Program Counter is the 16-bit register named “PC”. It is not present in the microcontroller address
space. It can be emulated by the PICE hardware and is accessible in the break mode only.
Port Latches
Microcontroller ports P0, P1, P2, P3, P4 and P5 include a specific part, called the latch register.
The emulator cannot directly access the latches. To access them, use the corresponding Debug
Registers __P0_LATCH, __P1_LATCH, etc. For more info, see Displaying Contents of Ports.
Working with the debug registers
You can use the debug registers in the following contexts:
• Debug register names can be used in expressions.
• Some debug registers are displayed in the Peripheral Device windows.
• Value of any debug register can be displayed in the Watches window.
All debug registers have symbol names, which usually begin with two underscores. If you have
used a name in your program that matches the built-in name (the name of such register), then your
name in the program will be unavailable, since the "internal" names take precedence over the "external" names. Note that such situation rarely happens, because all debug register names begin
with two underscores (__).
Special Function Registers and Bits
The PICE software contains the whole set of special function registers (SFR) of the target microcontroller together with their symbol names. The specific set of registers depends on the microcontroller type. SFRs can be used wherever the expressions are allowed. The SFR names are always
available, even if no one program is loaded for debugging.
Most SFRs contain bits responsible for functionality of the peripheral devices. PICE-52 provides the
full set of bit names in accordance with the microcontroller documentation. You can view and modify these bits just like SFRs or other symbol objects.
Working with SFRs and bits
You can use SFRs and the bits in the following contexts:
• SFR names can be used in expressions.
• Most SFRs are available in the Peripheral Device windows.
• Any SFR value can be displayed in the Watches window and the Inspector window.
Version 1.1
Page 37 of 245
Error! Unknown document property name.User's Manual
Real-time Timer and Frequency Measuring
System
PICE provides special support for measuring the time parameters of the emulation microcontroller
and execution of your program. It contains the hardware 48-bit real-time timer and the system for
measuring the emulation microcontroller frequency.
Real-time timer
The timer is operating, when the user program is being executed in the real-time mode (it is
started/stopped simultaneously with the start/stop of emulation). The emulation microcontroller
clock signal is applied to the timer input and the timer counts the system clock periods.
The hardware tracer records the lowest four bytes of the timer. This enables measuring and exploring the execution time characteristics of your program. The timer value can be obtained on-the-fly,
without breaking the execution of your program. For more, see On-the-fly Access to Microcontroller
Resources. For more about controlling the timer, see Execution Time window.
Emulation microcontroller frequency measuring system
PICE has the special frequency metering system, which measures the emulation microcontroller
frequency (the system clock period) with an accuracy of 0.1%. The frequency measuring procedure
is carried out at each breakpoint.
The Execution Time window
The Execution Time window displays the measured time parameters. Its local menu commands
control the real-time timer and the frequency of the programmable clock generator of the emulator.
Besides that, the frequency indicator is always displayed in the PICE status bar.
Managing the Emulation MCU Power
The PICE-52 hardware has the on-board precise programmable power regulator. It controls the
emulation microcontroller supply voltages in accordance with its operating mode. It can change
these voltages within the permissible range, which depends on the specific type of emulation microcontroller and POD board. For info about the voltage range, see POD Boards.
PICE supports two modes of the power regulator:
1) Follow Target Board Voltage. This is the default mode for the regulator, when PICE-52 is
powered for the first time.
2) User-Specified Value.
In the first mode, the power regulator monitors the voltage at the target and controls the microcontroller voltage so as to meet the target voltage level. In case the target voltage goes beyond the
permissible voltage range, the power regulator stops at the boundary voltage of this range. In this
way, the regulator protects the emulation microcontroller from damage. If you switch to this mode,
when your emulator is disconnected from the target device, the regulator will keep the lowest permissible voltage.
In the second mode, you directly specify the necessary microcontroller supply voltage (independently from the target, if it is connected) and the regulator will keep this value constant. The accuracy of programming the regulator is of up to 20 mV.
PICE checks the voltage you specified for correctness. The value is considered to be correct, if difference between the emulation microcontroller supply voltage and the target voltage is less than
200 mV. If the package adapter is connected to the emulator and you are going to set a voltage
that differs much from the current measured voltage at the target board, you will get the message
like:
Version 1.1
Page 38 of 245
Error! Unknown document property name.User's Manual
If you are really sure that this
voltage cannot damage the
hardware (for example, you did
not connect the adapter to the
target), you may press the Yes
button. Otherwise, press the
Hardware Configuration button to return to the Hardware
Configuration dialog and correct your settings.
The second mode is useful, when PICE works standalone (without the target device and adapter),
or when your project requires that. Also, you may use this mode to explore the features and AC/DC
specifications of the emulated microcontroller at different voltages to choose the better solution for
your target hardware.
Current measured voltages
The regulator has its own voltage metering system. It measures voltages at the emulation microcontroller and at the target board (at the Vbat pin of the microcontroller socket). The result is displayed in the Current Measured Voltages area in the Emulation MCU Power Management
group (of the Hardware Configuration dialog).
POD Boards
POD is a detachable printed circuit board with a special chip (emulation microcontroller), which
emulates the target microcontroller. The emulation microcontroller and the regular microcontroller
contain the same silicon chip, while the former has additional input/output pins. These pins provide
access to the microcontroller program/data memory in the real-time mode.
The POD boards have no jumpers or switches for you to set up. To configure POD, you use the
PICE software graphic user interface (the Hardware Configuration dialog).
Particular lists of traced parameters (recorded by the hardware tracer), parameters included in
complex breakpoint triggers or available for access on-the-fly depend on POD board. For details,
see description of the specific POD board.
Phyton manufactures the following POD boards:
PR1-52-ARX/ID2
PR1-52-ARX/51U2
PR1-52-ARX/W78
PR1-52-ARZ
PR1-52-ACC01
PR1-52-ACC03
PR1-52-A5112
PR1-52-A5131
PR1-52-W77
PR1-52-PLP/768
PR1-52-PLP/769
PR1-52-PLP1/932
PR1-52-PLP1/935
PR1-52-MIC0
PR1-52-DS450
PR1-52-DS400
Version 1.1
Page 39 of 245
Error! Unknown document property name.User's Manual
PR1-52-ARX/ID2
Method of emulation:
Atmel, Enhanced Hooks
Emulation microcontroller:
Atmel AT89C51ID2
Package adapters:
AR1-52-D40, AR1-52-L44, AR1-52-Q44
Target microcontrollers:
Atmel: List A-1, List A-2, List A-3,
T89C51IB2, T89C51IC2
Intel: List I-1, List I-2
ISSI: IS89C51, IS89C52
OKI: List O-1
Philips: List P-1, List P-2
SST: List S-1
Winbond: List W-2.
Emulation MCU clock frequency:
0 to 60 MHz in the 12-clk mode;
0 to 30 MHz in the 6-clk mode.
Emulation of the Idle and Power Down modes:
Yes
Emulation of the Low EMI (inhibit ALE) mode:
Yes
Supply voltage:
2.4 to 5.5 V
Configuration jumpers:
No
Emulation of memory
Code (Program) memory:
Supports
Emulation of the on-chip Program memory:
Yes
Volume:
64 Kb with the MR1-52-03 main board;
1 Mb banked memory with MR1-52-05.
Amount of breakpoints on address:
64 K / 1 M
Mapping:
Yes
Support for Shadow RAM:
Yes
On-the-fly access:
Yes
Support for Memory Coverage:
Yes
Tracing:
24 bits for address;
8 bits for data.
Type of access: Instruction fetch, Idle fetch,
Operand, MOVC, Interrupt.
Complex breakpoint (trigger):
As for tracing
Support for IAP (In-Application Programming): Yes
External Xdata:
Supports
Volume:
64 Kb with the MR1-52-03 main board;
448 Kb (banked memory) with MR1-52-05.
Amount of breakpoints on address:
64 K / 448 K
Mapping:
Yes
Support for Shadow RAM:
Yes
On-the-fly access:
Yes
Support for Memory Coverage:
Yes
Tracing:
24 bits for address;
8 bits for data.
Type of access: Read, Write
Complex breakpoint (trigger):
On-chip Xdata (XRAM):
Volume:
Version 1.1
As for tracing
Supports
up to 64 Kb
Page 40 of 245
Error! Unknown document property name.User's Manual
Amount of breakpoints on address:
up to 64 K
Mapping:
No
Support for Shadow RAM:
Yes
On-the-fly access:
Yes
Support for Memory Coverage:
Yes
Tracing:
16 bits for address,
8 bits for data.
Type of access: Read, Write
Complex breakpoint (trigger):
As for tracing
EEPROM:
Supports
Volume:
up to 64 Kb
Amount of breakpoints on address:
up to 64 K
Mapping:
No
Support for Shadow RAM:
Yes
On-the-fly access:
Yes
Support for Memory Coverage:
Yes
Tracing:
16 bits for address,
8 bits for data.
Type of access: Read, Write
Complex breakpoint (trigger):
Data, Idata:
Volume:
As for tracing
Supports
256 bytes
Amount of breakpoints on address:
256, only for access with direct addressing
Mapping:
No
Support for Shadow RAM:
No
On-the-fly access:
No
Support for Memory Coverage:
No
Tracing, for the Data memory only:
8 bits for address, for read and write;
8 bits for data, for write only.
Complex breakpoint (trigger), for Data only:
As for tracing
Restrictions for emulation
See Restrictions of PR1-52-Axx and Special Considerations.
Version 1.1
Page 41 of 245
Error! Unknown document property name.User's Manual
PR1-52-ARX/51U2
Method of emulation:
Atmel, Enhanced Hooks
Emulation microcontroller:
Atmel TS80C51U2
Package adapters:
AR1-52-D40, AR1-52-L44, AR1-52-Q44
Target microcontrollers:
Atmel: List A-6
Emulation MCU clock frequency:
0 to 60 MHz in the 12-clk mode;
0 to 30 MHz in the 6-clk mode.
Emulation of the Idle and Power Down modes:
Yes
Emulation of the Low EMI (inhibit ALE) mode:
Yes
Supply voltage:
2.4 to 5.5 V
Configuration jumpers:
No
Emulation of memory
Code (Program) memory:
Supports
Emulation of the on-chip Program memory:
Yes
Volume:
64 Kb with the MR1-52-03 main board;
1 Mb banked memory with MR1-52-05.
Amount of breakpoints on address:
64 K / 1 M
Mapping:
Yes
Support for Shadow RAM:
Yes
On-the-fly access:
Yes
Support for Memory Coverage:
Yes
Tracing:
24 bits for address;
8 bits for data.
Type of access: Instruction fetch, Idle fetch,
Operand, MOVC, Interrupt.
Complex breakpoint (trigger):
As for tracing
Support for IAP (In-Application Programming): —
External Xdata:
Supports
Volume:
64 Kb with the MR1-52-03 main board;
448 Kb (banked memory) with MR1-52-05.
Amount of breakpoints on address:
64 K / 448 K
Mapping:
Yes
Support for Shadow RAM:
Yes
On-the-fly access:
Yes
Support for Memory Coverage:
Yes
Tracing:
24 bits for address;
8 bits for data.
Type of access: Read, Write
Complex breakpoint (trigger):
On-chip Xdata (XRAM):
Volume:
As for tracing
Does not support
—
Amount of breakpoints on address:
—
Mapping:
—
Support for Shadow RAM:
—
On-the-fly access:
—
Support for Memory Coverage:
—
Version 1.1
Page 42 of 245
Error! Unknown document property name.User's Manual
Tracing:
—
Complex breakpoint (trigger):
—
EEPROM:
Does not support
Volume:
—
Amount of breakpoints on address:
—
Mapping:
—
Support for Shadow RAM:
—
On-the-fly access:
—
Support for Memory Coverage:
—
Tracing:
—
Complex breakpoint (trigger):
—
Data, Idata:
Supports
Volume:
256 bytes
Amount of breakpoints on address:
256, only for access with direct addressing
Mapping:
No
Support for Shadow RAM:
No
On-the-fly access:
No
Support for Memory Coverage:
No
Tracing, for the Data memory only:
8 bits for address, for read and write;
8 bits for data, for write only.
Complex breakpoint (trigger), for Data only:
As for tracing
Restrictions for emulation
See Restrictions of PR1-52-Axx and Special Considerations.
Version 1.1
Page 43 of 245
Error! Unknown document property name.User's Manual
PR1-52-ARX/W78
Method of emulation:
Atmel, Enhanced Hooks
Emulation microcontroller:
Atmel T89C51RC2
Package adapters:
AR1-52-D40, AR1-52-L44, AR1-52-Q44
Target microcontrollers:
Atmel: List A-1, List A-2
Intel: List I-1
ISSI: IS89C51, IS89C52
OKI: List O-1
Philips: List P-1
SST: List S-1
Winbond: List W-2, List W-3.
Emulation MCU clock frequency:
0 to 60 MHz in the 12-clk mode;
0 to 30 MHz in the 6-clk mode.
Emulation of the Idle and Power Down modes:
Yes
Emulation of the Low EMI (inhibit ALE) mode:
Yes
Supply voltage:
2.4 to 5.5 V
Configuration jumpers:
No
Emulation of memory
Code (Program) memory:
Supports
Emulation of the on-chip Program memory:
Yes
Volume:
64 Kb with the MR1-52-03 main board;
1 Mb banked memory with MR1-52-05.
Amount of breakpoints on address:
64 K / 1 M
Mapping:
Yes
Support for Shadow RAM:
Yes
On-the-fly access:
Yes
Support for Memory Coverage:
Yes
Tracing:
24 bits for address;
8 bits for data.
Type of access: Instruction fetch, Idle fetch,
Operand, MOVC, Interrupt.
Complex breakpoint (trigger):
As for tracing
Support for IAP (In-Application Programming): —
External Xdata:
Supports
Volume:
64 Kb with the MR1-52-03 main board;
448 Kb (banked memory) with MR1-52-05.
Amount of breakpoints on address:
64 K / 448 K
Mapping:
Yes
Support for Shadow RAM:
Yes
On-the-fly access:
Yes
Support for Memory Coverage:
Yes
Tracing:
24 bits for address;
8 bits for data.
Type of access: Read, Write
Complex breakpoint (trigger):
As for tracing
On-chip Xdata (XRAM):
Supports
Volume:
up to 64 Kb
Amount of breakpoints on address:
up to 64 K
Version 1.1
Page 44 of 245
Error! Unknown document property name.User's Manual
Mapping:
No
Support for Shadow RAM:
Yes
On-the-fly access:
Yes
Support for Memory Coverage:
Yes
Tracing:
16 bits for address,
8 bits for data.
Type of access: Read, Write
Complex breakpoint (trigger):
EEPROM:
As for tracing
Does not support
Volume:
—
Amount of breakpoints on address:
—
Mapping:
—
Support for Shadow RAM:
—
On-the-fly access:
—
Support for Memory Coverage:
—
Tracing:
—
Complex breakpoint (trigger):
—
Data, Idata:
Volume:
Supports
256 bytes
Amount of breakpoints on address:
256, only for access with direct addressing
Mapping:
No
Support for Shadow RAM:
No
On-the-fly access:
No
Support for Memory Coverage:
No
Tracing, for the Data memory only:
8 bits for address, for read and write;
8 bits for data, for write only.
Complex breakpoint (trigger), for Data only:
As for tracing
Restrictions for emulation
See Restrictions of PR1-52-Axx and Special Considerations.
Version 1.1
Page 45 of 245
Error! Unknown document property name.User's Manual
PR1-52-ARZ
Method of emulation:
Atmel, Enhanced Hooks
Emulation microcontroller:
Atmel AT89C51ID2-L68
Package adapters:
AR1-52-D40, AR1-52-L44, AR1-52-Q44,
AR1-52-ARZ-D24, AR1-52-ARZ-L68,
AR1-52-ARZ-Q64.
Target microcontrollers:
Atmel: List A-4, List A-5.
Emulation MCU clock frequency:
0 to 60 MHz in the 12-clk mode;
0 to 30 MHz in the 6-clk mode.
Emulation of the Idle and Power Down modes:
Yes
Emulation of the Low EMI (inhibit ALE) mode:
Yes
Supply voltage:
2.4 to 5.5 V
Configuration jumpers:
No
Emulation of memory
Code (Program) memory:
Supports
Emulation of the on-chip Program memory:
Yes
Volume:
64 Kb with the MR1-52-03 main board;
1 Mb banked memory with MR1-52-05.
Amount of breakpoints on address:
64 K / 1 M
Mapping:
Yes
Support for Shadow RAM:
Yes
On-the-fly access:
Yes
Support for Memory Coverage:
Yes
Tracing:
24 bits for address;
8 bits for data.
Type of access: Instruction fetch, Idle fetch,
Operand, MOVC, Interrupt.
Complex breakpoint (trigger):
As for tracing
Support for IAP (In-Application Programming): —
External Xdata:
Supports
Volume:
64 Kb with the MR1-52-03 main board;
448 Kb (banked memory) with MR1-52-05.
Amount of breakpoints on address:
64 K / 448 K
Mapping:
Yes
Support for Shadow RAM:
Yes
On-the-fly access:
Yes
Support for Memory Coverage:
Yes
Tracing:
24 bits for address;
8 bits for data.
Type of access: Read, Write
Complex breakpoint (trigger):
On-chip Xdata (XRAM):
Volume:
As for tracing
Supports
up to 64 Kb
Amount of breakpoints on address:
up to 64 K
Mapping:
No
Support for Shadow RAM:
Yes
On-the-fly access:
Yes
Version 1.1
Page 46 of 245
Error! Unknown document property name.User's Manual
Support for Memory Coverage:
Yes
Tracing:
16 bits for address,
8 bits for data.
Type of access: Read, Write
Complex breakpoint (trigger):
As for tracing
EEPROM:
Volume:
Supports
up to 64 Kb
Amount of breakpoints on address:
up to 64 K
Mapping:
No
Support for Shadow RAM:
Yes
On-the-fly access:
Yes
Support for Memory Coverage:
Yes
Tracing:
16 bits for address,
8 bits for data.
Type of access: Read, Write
Complex breakpoint (trigger):
As for tracing
Data, Idata:
Supports
Volume:
256 bytes
Amount of breakpoints on address:
256, only for access with direct addressing
Mapping:
No
Support for Shadow RAM:
No
On-the-fly access:
No
Support for Memory Coverage:
No
Tracing, for the Data memory only:
8 bits for address, for read and write;
8 bits for data, for write only.
Complex breakpoint (trigger), for Data only:
As for tracing
Restrictions for emulation
See Restrictions of PR1-52-Axx and Special Considerations.
Version 1.1
Page 47 of 245
Error! Unknown document property name.User's Manual
PR1-52-ACC01
Method of emulation:
Atmel, Enhanced Hooks
Emulation microcontroller:
Atmel T89C51CC01
Package adapters:
AR1-52-L44, AR1-52-Q44
AR1-52-ACC01-D28, AR1-52-ACC01-D24,
AR1-52-ACC01-L28, AR1-52-ACC01-Q32.
Target microcontrollers:
Atmel: T89C51AC2, T89C51CC01,
T89C5115, T89C51CC02.
Emulation MCU clock frequency:
0 to 60 MHz in the 12-clk mode;
0 to 30 MHz in the 6-clk mode.
Emulation of the Idle and Power Down modes:
Yes
Emulation of the Low EMI (inhibit ALE) mode:
Yes
Supply voltage:
2.4 to 5.5 V
Configuration jumpers:
No
Emulation of memory
Code (Program) memory:
Supports
Emulation of the on-chip Program memory:
Yes
Volume:
64 Kb with the MR1-52-03 main board;
1 Mb banked memory with MR1-52-05.
Amount of breakpoints on address:
64 K / 1 M
Mapping:
Yes
Support for Shadow RAM:
Yes
On-the-fly access:
Yes
Support for Memory Coverage:
Yes
Tracing:
24 bits for address;
8 bits for data.
Type of access: Instruction fetch, Idle fetch,
Operand, MOVC, Interrupt.
Complex breakpoint (trigger):
As for tracing
Support for IAP (In-Application Programming): Yes
External Xdata:
Supports
Volume:
64 Kb with the MR1-52-03 main board;
448 Kb (banked memory) with MR1-52-05.
Amount of breakpoints on address:
64 K / 448 K
Mapping:
Yes
Support for Shadow RAM:
Yes
On-the-fly access:
Yes
Support for Memory Coverage:
Yes
Tracing:
24 bits for address;
8 bits for data.
Type of access: Read, Write
Complex breakpoint (trigger):
On-chip Xdata (XRAM):
As for tracing
Supports
Volume:
up to 64 Kb
Amount of breakpoints on address:
up to 64 K
Mapping:
No
Support for Shadow RAM:
Yes
Version 1.1
Page 48 of 245
Error! Unknown document property name.User's Manual
On-the-fly access:
Yes
Support for Memory Coverage:
Yes
Tracing:
16 bits for address,
8 bits for data.
Type of access: Read, Write
Complex breakpoint (trigger):
EEPROM:
As for tracing
Supports
Volume:
up to 64 Kb
Amount of breakpoints on address:
up to 64 K
Mapping:
No
Support for Shadow RAM:
Yes
On-the-fly access:
Yes
Support for Memory Coverage:
Yes
Tracing:
16 bits for address,
8 bits for data.
Type of access: Read, Write
Complex breakpoint (trigger):
As for tracing
Data, Idata:
Volume:
Supports
256 bytes
Amount of breakpoints on address:
256, only for access with direct addressing
Mapping:
No
Support for Shadow RAM:
No
On-the-fly access:
No
Support for Memory Coverage:
No
Tracing, for the Data memory only:
8 bits for address, for read and write;
8 bits for data, for write only.
Complex breakpoint (trigger), for Data only:
As for tracing
Restrictions for emulation
See Restrictions of PR1-52-Axx and Special Considerations.
Version 1.1
Page 49 of 245
Error! Unknown document property name.User's Manual
PR1-52-ACC03
Method of emulation:
Atmel, Enhanced Hooks
Emulation microcontroller:
Atmel AT89C51CC03
Package adapters:
AR1-52-L44, AR1-52-Q44,
AR1-52-ACC01-D28, AR1-52-ACC01-D24,
AR1-52-ACC01-L28, AR1-52-ACC03-L52,
AR1-52-ACC01-Q32, AR1-52-ACC03-Q64.
Target microcontrollers:
Atmel: AT89C51CC03, AT89C51AC3,
T89C51AC2, T89C51CC01, T89C5115,
and T89C51CC02.
Emulation MCU clock frequency:
0 to 60 MHz in the 12-clk mode;
0 to 30 MHz in the 6-clk mode.
Emulation of the Idle and Power Down modes:
Yes
Emulation of the Low EMI (inhibit ALE) mode:
Yes
Supply voltage:
2.4 to 5.5 V
Configuration jumpers:
No
Emulation of memory
Code (Program) memory:
Supports
Emulation of the on-chip Program memory:
Yes
Volume:
64 Kb with the MR1-52-03 main board;
1 Mb banked memory with MR1-52-05.
Amount of breakpoints on address:
64 K / 1 M
Mapping:
Yes
Support for Shadow RAM:
Yes
On-the-fly access:
Yes
Support for Memory Coverage:
Yes
Tracing:
24 bits for address;
8 bits for data.
Type of access: Instruction fetch, Idle fetch,
Operand, MOVC, Interrupt.
Complex breakpoint (trigger):
As for tracing
Support for IAP (In-Application Programming): Yes
External Xdata:
Supports
Volume:
64 Kb with the MR1-52-03 main board;
448 Kb (banked memory) with MR1-52-05.
Amount of breakpoints on address:
64 K / 448 K
Mapping:
Yes
Support for Shadow RAM:
Yes
On-the-fly access:
Yes
Support for Memory Coverage:
Yes
Tracing:
24 bits for address;
8 bits for data.
Type of access: Read, Write
Complex breakpoint (trigger):
On-chip Xdata (XRAM):
As for tracing
Supports
Volume:
up to 64 Kb
Amount of breakpoints on address:
up to 64 K
Mapping:
No
Version 1.1
Page 50 of 245
Error! Unknown document property name.User's Manual
Support for Shadow RAM:
Yes
On-the-fly access:
Yes
Support for Memory Coverage:
Yes
Tracing:
16 bits for address,
8 bits for data.
Type of access: Read, Write
Complex breakpoint (trigger):
As for tracing
EEPROM:
Volume:
Supports
up to 64 Kb
Amount of breakpoints on address:
up to 64 K
Mapping:
No
Support for Shadow RAM:
Yes
On-the-fly access:
Yes
Support for Memory Coverage:
Yes
Tracing:
16 bits for address,
8 bits for data.
Type of access: Read, Write
Complex breakpoint (trigger):
Data, Idata:
As for tracing
Supports
Volume:
256 bytes
Amount of breakpoints on address:
256, only for access with direct addressing
Mapping:
No
Support for Shadow RAM:
No
On-the-fly access:
No
Support for Memory Coverage:
No
Tracing, for the Data memory only:
8 bits for address, for read and write;
8 bits for data, for write only.
Complex breakpoint (trigger), for Data only:
As for tracing
Restrictions for emulation
See Restrictions of PR1-52-Axx and Special Considerations.
Version 1.1
Page 51 of 245
Error! Unknown document property name.User's Manual
PR1-52-A5112
Method of emulation:
Atmel, Enhanced Hooks
Emulation microcontroller:
Atmel T87C5112
Package adapters:
AR1-52-A5112-L52, AR1-52-A5112-D24
Target microcontrollers:
Atmel: T83C5111, T83C5112, T87C5111,
T87C5112.
Emulation MCU clock frequency:
0 to 66 MHz in the 12-clk mode;
0 to 33 MHz in the 6-clk mode.
Emulation of the Idle and Power Down modes:
Yes
Emulation of the Low EMI (inhibit ALE) mode:
Yes
Supply voltage:
2.4 to 5.5 V
Configuration jumpers:
No
Emulation of memory
Code (Program) memory:
Supports
Emulation of the on-chip Program memory:
Yes
Volume:
64 Kb with the MR1-52-03 main board;
1 Mb banked memory with MR1-52-05.
Amount of breakpoints on address:
64 K / 1 M
Mapping:
Yes
Support for Shadow RAM:
Yes
On-the-fly access:
Yes
Support for Memory Coverage:
Yes
Tracing:
24 bits for address;
8 bits for data.
Type of access: Instruction fetch, Idle fetch,
Operand, MOVC, Interrupt.
Complex breakpoint (trigger):
As for tracing
Support for IAP (In-Application Programming): —
External Xdata:
Supports
Volume:
64 Kb with the MR1-52-03 main board;
448 Kb (banked memory) with MR1-52-05.
Amount of breakpoints on address:
64 K / 448 K
Mapping:
Yes
Support for Shadow RAM:
Yes
On-the-fly access:
Yes
Support for Memory Coverage:
Yes
Tracing:
24 bits for address;
8 bits for data.
Type of access: Read, Write
Complex breakpoint (trigger):
As for tracing
On-chip Xdata (XRAM):
Does not support
Volume:
—
Amount of breakpoints on address:
—
Mapping:
—
Support for Shadow RAM:
—
On-the-fly access:
—
Support for Memory Coverage:
—
Version 1.1
Page 52 of 245
Error! Unknown document property name.User's Manual
Tracing:
—
Complex breakpoint (trigger):
—
EEPROM:
Does not support
Volume:
—
Amount of breakpoints on address:
—
Mapping:
—
Support for Shadow RAM:
—
On-the-fly access:
—
Support for Memory Coverage:
—
Tracing:
—
Complex breakpoint (trigger):
—
Data, Idata:
Supports
Volume:
256 bytes
Amount of breakpoints on address:
256, only for access with direct addressing
Mapping:
No
Support for Shadow RAM:
No
On-the-fly access:
No
Support for Memory Coverage:
No
Tracing, for the Data memory only:
8 bits for address, for read and write;
8 bits for data, for write only.
Complex breakpoint (trigger), for Data only:
As for tracing
Restrictions for emulation
See Restrictions of PR1-52-Axx and Special Considerations.
Version 1.1
Page 53 of 245
Error! Unknown document property name.User's Manual
PR1-52-A5131
Method of emulation:
Atmel, Enhanced Hooks
Emulation microcontroller:
Atmel AT89C5131
Package adapters:
AR1-52-A5131-D28, AR1-52-A5131-L52,
AR1-52-A5131-Q64.
Target microcontrollers:
Atmel: AT89C5131
Emulation MCU clock frequency:
0 to 20 MHz in the 12-clk mode;
0 to 16 MHz in the 6-clk mode.
Emulation of the Idle and Power Down modes:
Yes
Emulation of the Low EMI (inhibit ALE) mode:
Yes
Supply voltage:
3.6 to 5.5 V
Configuration jumpers:
No
Emulation of memory
Code (Program) memory:
Supports
Emulation of the on-chip Program memory:
Yes
Volume:
64 Kb with the MR1-52-03 main board;
1 Mb banked memory with MR1-52-05.
Amount of breakpoints on address:
64 K / 1 M
Mapping:
Yes
Support for Shadow RAM:
Yes
On-the-fly access:
Yes
Support for Memory Coverage:
Yes
Tracing:
24 bits for address;
8 bits for data.
Type of access: Instruction fetch, Idle fetch,
Operand, MOVC, Interrupt.
Complex breakpoint (trigger):
As for tracing
Support for IAP (In-Application Programming): Yes
External Xdata:
Supports
Volume:
64 Kb with the MR1-52-03 main board;
448 Kb (banked memory) with MR1-52-05.
Amount of breakpoints on address:
64 K / 448 K
Mapping:
Yes
Support for Shadow RAM:
Yes
On-the-fly access:
Yes
Support for Memory Coverage:
Yes
Tracing:
24 bits for address;
8 bits for data.
Type of access: Read, Write
Complex breakpoint (trigger):
As for tracing
On-chip Xdata (XRAM):
Supports
Volume:
up to 64 Kb
Amount of breakpoints on address:
up to 64 K
Mapping:
No
Support for Shadow RAM:
Yes
On-the-fly access:
Yes
Support for Memory Coverage:
Yes
Version 1.1
Page 54 of 245
Error! Unknown document property name.User's Manual
Tracing:
16 bits for address,
8 bits for data.
Type of access: Read, Write
Complex breakpoint (trigger):
As for tracing
EEPROM:
Supports
Volume:
up to 64 Kb
Amount of breakpoints on address:
up to 64 K
Mapping:
No
Support for Shadow RAM:
Yes
On-the-fly access:
Yes
Support for Memory Coverage:
Yes
Tracing:
16 bits for address,
8 bits for data.
Type of access: Read, Write
Complex breakpoint (trigger):
Data, Idata:
Volume:
As for tracing
Supports
256 bytes
Amount of breakpoints on address:
256, only for access with direct addressing
Mapping:
No
Support for Shadow RAM:
No
On-the-fly access:
No
Support for Memory Coverage:
No
Tracing, for the Data memory only:
8 bits for address, for read and write;
8 bits for data, for write only.
Complex breakpoint (trigger), for Data only:
As for tracing
Restrictions for emulation
See Restrictions of PR1-52-Axx and Special Considerations.
Version 1.1
Page 55 of 245
Error! Unknown document property name.User's Manual
PR1-52-W77
Method of emulation:
Winbond Bondout Chip
Emulation microcontroller:
W77968
Package adapters:
AR1-52-D40, AR1-52-L44, AR1-52-Q44
Target microcontrollers:
Winbond: List W-1
Emulation MCU clock frequency:
0 to 40 MHz
Emulation of the Idle and Power Down modes:
Yes
Emulation of the Low EMI (inhibit ALE) mode:
Yes
Supply voltage:
2.7 to 5.5 V
Configuration jumpers:
No
Emulation of memory
Code (Program) memory:
Supports
Emulation of the on-chip Program memory:
Yes
Volume:
64 Kb with the MR1-52-03 main board;
1 Mb banked memory with MR1-52-05.
Amount of breakpoints on address:
64 K / 1 M
Mapping:
Yes
Support for Shadow RAM:
Yes
On-the-fly access:
Yes
Support for Memory Coverage:
Yes
Tracing:
24 bits for address;
8 bits for data.
Type of access: Instruction fetch, Idle fetch,
Operand, MOVC, Interrupt.
Complex breakpoint (trigger):
As for tracing
Support for IAP (In-Application Programming): No
External Xdata:
Supports
Volume:
64 Kb with the MR1-52-03 main board;
448 Kb (banked memory) with MR1-52-05.
Amount of breakpoints on address:
64 K / 448 K
Mapping:
Yes
Support for Shadow RAM:
Yes
On-the-fly access:
Yes
Support for Memory Coverage:
Yes
Tracing:
24 bits for address;
8 bits for data.
Type of access: Read, Write
Complex breakpoint (trigger):
As for tracing
On-chip Xdata (XRAM):
Supports
Volume:
1 Kb
Amount of breakpoints on address:
1K
Mapping:
No
Support for Shadow RAM:
Yes
On-the-fly access:
Yes
Support for Memory Coverage:
Yes
Version 1.1
Page 56 of 245
Error! Unknown document property name.User's Manual
Tracing:
10 bits for address,
8 bits for data.
Type of access: Read, Write
Complex breakpoint (trigger):
As for tracing
EEPROM:
Does not support
Volume:
—
Amount of breakpoints on address:
—
Mapping:
—
Support for Shadow RAM:
—
On-the-fly access:
—
Support for Memory Coverage:
—
Tracing:
—
Complex breakpoint (trigger):
—
Data, Idata:
Supports
Volume:
256 bytes
Amount of breakpoints on address:
256, only for access with direct addressing
Mapping:
No
Support for Shadow RAM:
No
On-the-fly access:
No
Support for Memory Coverage:
No
Tracing, for the Data memory only:
8 bits for address, for read and write.
Complex breakpoint (trigger), for Data only:
As for tracing
Restrictions for emulation
See Restrictions of PR1-52-W77 and Special Considerations.
Version 1.1
Page 57 of 245
Error! Unknown document property name.User's Manual
PR1-52-PLP/768
Method of emulation:
Philips Bondout Chip
Emulation microcontroller:
P85LPC768
Package adapters:
AR1-52-PLP-D14, AR1-52-PLP-D16 and
AR1-52-PLP-D20
Target microcontrollers:
Philips: P87LPC760, P87LPC761,
P87LPC762, P87LPC764, P87LPC767,
P87LPC768, P87LPC778.
Emulation MCU clock frequency:
0 to 20 MHz
Emulation of the Idle and Power Down modes:
Yes
Emulation of the Low EMI (inhibit ALE) mode:
—
Supply voltage:
2.7 to 5.5 V
Configuration jumpers:
No
Emulation of memory
Code (Program) memory:
Supports
Emulation of the on-chip Program memory:
Yes
Volume:
4 Kb
Amount of breakpoints on address:
4K
Mapping:
No
Support for Shadow RAM:
No
On-the-fly access:
Yes
Support for Memory Coverage:
Yes
Tracing:
24 bits for address;
8 bits for data.
Type of access: Instruction fetch, Idle fetch,
Operand, MOVC, Interrupt.
Complex breakpoint (trigger):
As for tracing
Support for IAP (In-Application Programming): No
External Xdata:
Does not support
Volume:
—
Amount of breakpoints on address:
—
Mapping:
—
Support for Shadow RAM:
—
On-the-fly access:
—
Support for Memory Coverage:
—
Tracing:
—
Complex breakpoint (trigger):
—
On-chip Xdata (XRAM):
Does not support
Volume:
—
Amount of breakpoints on address:
—
Mapping:
—
Support for Shadow RAM:
—
On-the-fly access:
—
Support for Memory Coverage:
—
Tracing:
—
Complex breakpoint (trigger):
—
Version 1.1
Page 58 of 245
Error! Unknown document property name.User's Manual
EEPROM:
Volume:
Does not support
—
Amount of breakpoints on address:
—
Mapping:
—
Support for Shadow RAM:
—
On-the-fly access:
—
Support for Memory Coverage:
—
Tracing:
—
Complex breakpoint (trigger):
—
Data, Idata:
Supports
Volume:
256 bytes
Amount of breakpoints on address:
256, only for access with direct addressing
Mapping:
No
Support for Shadow RAM:
No
On-the-fly access:
No
Support for Memory Coverage:
No
Tracing, for the Data memory only:
8 bits for address, for read and write.
Complex breakpoint (trigger), for Data only:
As for tracing
Restrictions for emulation
See Restrictions of PR1-52-PLP/76x and Special Considerations.
Version 1.1
Page 59 of 245
Error! Unknown document property name.User's Manual
PR1-52-PLP/769
Method of emulation:
Philips Bondout Chip
Emulation microcontroller:
P85LPC769
Package adapters:
AR1-52-PLP-D14, AR1-52-PLP-D16 and
AR1-52-PLP-D20
Target microcontrollers:
Philips: P87LPC760, P87LPC761,
P87LPC762, P87LPC764, P87LPC767,
P87LPC769, P87LPC779.
Emulation MCU clock frequency:
0 to 20 MHz
Emulation of the Idle and Power Down modes:
Yes
Emulation of the Low EMI (inhibit ALE) mode:
—
Supply voltage:
2.7 to 5.5 V
Configuration jumpers:
No
Emulation of memory
Code (Program) memory:
Supports
Emulation of the on-chip Program memory:
Yes
Volume:
4 Kb
Amount of breakpoints on address:
4K
Mapping:
No
Support for Shadow RAM:
No
On-the-fly access:
Yes
Support for Memory Coverage:
Yes
Tracing:
24 bits for address;
8 bits for data.
Type of access: Instruction fetch, Idle fetch,
Operand, MOVC, Interrupt.
Complex breakpoint (trigger):
As for tracing
Support for IAP (In-Application Programming): No
External Xdata:
Does not support
Volume:
—
Amount of breakpoints on address:
—
Mapping:
—
Support for Shadow RAM:
—
On-the-fly access:
—
Support for Memory Coverage:
—
Tracing:
—
Complex breakpoint (trigger):
—
On-chip Xdata (XRAM):
Does not support
Volume:
—
Amount of breakpoints on address:
—
Mapping:
—
Support for Shadow RAM:
—
On-the-fly access:
—
Support for Memory Coverage:
—
Tracing:
—
Complex breakpoint (trigger):
—
Version 1.1
Page 60 of 245
Error! Unknown document property name.User's Manual
EEPROM:
Volume:
Does not support
—
Amount of breakpoints on address:
—
Mapping:
—
Support for Shadow RAM:
—
On-the-fly access:
—
Support for Memory Coverage:
—
Tracing:
—
Complex breakpoint (trigger):
—
Data, Idata:
Supports
Volume:
256 bytes
Amount of breakpoints on address:
256, only for access with direct addressing
Mapping:
No
Support for Shadow RAM:
No
On-the-fly access:
No
Support for Memory Coverage:
No
Tracing, for the Data memory only:
8 bits for address, for read and write.
Complex breakpoint (trigger), for Data only:
As for tracing
Restrictions for emulation
See Restrictions of PR1-52-PLP/76x and Special Considerations.
Version 1.1
Page 61 of 245
Error! Unknown document property name.User's Manual
PR1-52-PLP1/932
Method of emulation:
Philips Bondout Chip
Emulation microcontroller:
P85LPC932
Package adapters:
AR1-52-PLP1-D8/1, AR1-52-PLP1-D8/2,
AR1-52-PLP1-D14, AR1-52-PLP1-D20,
AR1-52-PLP1-D28, AR1-52-PLP1-L28
Target microcontrollers:
Philips: List P-3, List P-4, List P-5, List P-6,
P89LPC930, P89LPC931, P89LPC932.
Emulation MCU clock frequency:
0 to 12 MHz
Emulation of the Idle and Power Down modes:
Yes
Emulation of the Low EMI (inhibit ALE) mode:
—
Supply voltage:
2.4 to 3.6 V
Configuration jumpers:
No
Emulation of memory
Code (Program) memory:
Supports
Emulation of the on-chip Program memory:
Yes
Volume:
8 Kb
Amount of breakpoints on address:
8K
Mapping:
No
Support for Shadow RAM:
No
On-the-fly access:
Yes
Support for Memory Coverage:
Yes
Tracing:
24 bits for address;
8 bits for data.
Type of access: Instruction fetch, Idle fetch,
Operand, MOVC, Interrupt.
Complex breakpoint (trigger):
As for tracing
Support for IAP (In-Application Programming): No
External Xdata:
Does not support
Volume:
—
Amount of breakpoints on address:
—
Mapping:
—
Support for Shadow RAM:
—
On-the-fly access:
—
Support for Memory Coverage:
—
Tracing:
—
Complex breakpoint (trigger):
—
On-chip Xdata (XRAM):
Supports
Volume:
512 bytes
Amount of breakpoints on address:
512
Mapping:
No
Support for Shadow RAM:
Yes
On-the-fly access:
Yes
Support for Memory Coverage:
Yes
Version 1.1
Page 62 of 245
Error! Unknown document property name.User's Manual
Tracing:
15 bits for address,
8 bits for data.
Type of access: Read, Write
Complex breakpoint (trigger):
As for tracing
EEPROM:
Supports
Volume:
512 bytes
Amount of breakpoints on address:
—
Mapping:
No
Support for Shadow RAM:
No
On-the-fly access:
No
Support for Memory Coverage:
No
Tracing:
No
Complex breakpoint (trigger):
No
Data, Idata:
Supports
Volume:
256 bytes
Amount of breakpoints on address:
256, only for access with direct addressing
Mapping:
No
Support for Shadow RAM:
No
On-the-fly access:
No
Support for Memory Coverage:
No
Tracing, for the Data memory only:
8 bits for address, for read and write.
Complex breakpoint (trigger), for Data only:
As for tracing
Restrictions for emulation
See Restrictions of PR1-52-PLP1/93x and Special Considerations.
Version 1.1
Page 63 of 245
Error! Unknown document property name.User's Manual
PR1-52-PLP1/935
Method of emulation:
Philips Bondout Chip
Emulation microcontroller:
P85LPC935
Package adapters:
AR1-52-PLP1-D8/1, AR1-52-PLP1-D8/2,
AR1-52-PLP1-D14, AR1-52-PLP1-D14/1,
AR1-52-PLP1-D16, AR1-52-PLP1-D20,
AR1-52-PLP1-D28 и AR1-52-PLP1-L28.
Target microcontrollers:
Philips: List P-3, P89LPC904, List P-4, List
P-5, P89LPC915, P89LPC916,
P89LPC917, List P-6, P89LPC924,
P89LPC925, P89LPC930, P89LPC931,
P89LPC932, List P-7, and P89LPC936.
Emulation MCU clock frequency:
0 to 12 MHz
Emulation of the Idle and Power Down modes:
Yes
Emulation of the Low EMI (inhibit ALE) mode:
—
Supply voltage:
2.4 to 3.6 V
Configuration jumpers:
No
Emulation of memory
Code (Program) memory:
Supports
Emulation of the on-chip Program memory:
Yes
Volume:
8 Kb
Amount of breakpoints on address:
8K
Mapping:
No
Support for Shadow RAM:
No
On-the-fly access:
Yes
Support for Memory Coverage:
Yes
Tracing:
24 bits for address;
8 bits for data.
Type of access: Instruction fetch, Idle fetch,
Operand, MOVC, Interrupt.
Complex breakpoint (trigger):
As for tracing
Support for IAP (In-Application Programming): No
External Xdata:
Does not support
Volume:
—
Amount of breakpoints on address:
—
Mapping:
—
Support for Shadow RAM:
—
On-the-fly access:
—
Support for Memory Coverage:
—
Tracing:
—
Complex breakpoint (trigger):
—
On-chip Xdata (XRAM):
Volume:
Supports
512 bytes
Amount of breakpoints on address:
512
Mapping:
No
Support for Shadow RAM:
Yes
On-the-fly access:
Yes
Version 1.1
Page 64 of 245
Error! Unknown document property name.User's Manual
Support for Memory Coverage:
Yes
Tracing:
15 bits for address,
8 bits for data.
Type of access: Read, Write
Complex breakpoint (trigger):
As for tracing
EEPROM:
Volume:
Supports
512 bytes
Amount of breakpoints on address:
—
Mapping:
No
Support for Shadow RAM:
No
On-the-fly access:
No
Support for Memory Coverage:
No
Tracing:
No
Complex breakpoint (trigger):
No
Data, Idata:
Supports
Volume:
256 bytes
Amount of breakpoints on address:
256, only for access with direct addressing
Mapping:
No
Support for Shadow RAM:
No
On-the-fly access:
No
Support for Memory Coverage:
No
Tracing, for the Data memory only:
8 bits for address, for read and write.
Complex breakpoint (trigger), for Data only:
As for tracing
Restrictions for emulation
See Restrictions of PR1-52-PLP1/93x and Special Considerations.
Version 1.1
Page 65 of 245
Error! Unknown document property name.User's Manual
PR1-52-MIC0
Method of emulation:
Regular microcontroller of Micronas.
Emulation microcontroller:
Micronas VCT 49XXI
Package adapters:
AR1-52-MIC-C60;
AR1-VCT49-D88-NM, AR1-VCT49-D88MR.
Target microcontrollers:
Micronas: list M-1.
Emulation MCU clock frequency:
20.250 MHz.
Emulation of the Idle and Power Down modes:
Yes
Emulation of the Low EMI (inhibit ALE) mode:
—
Supply voltage:
3.0 to 3.4 V
Configuration jumpers:
No
Emulation of memory
Code (Program) memory:
Supports
Emulation of the on-chip Program memory:
Yes
Volume:
1 Mb banked memory.
Amount of breakpoints on address:
1M
Mapping:
Yes
Support for Shadow RAM:
Yes
On-the-fly access:
Yes
Support for Memory Coverage:
Yes
Tracing:
24 bits for address;
8 bits for data.
Type of access: Instruction fetch, Idle fetch,
Operand, MOVC, Interrupt.
Complex breakpoint (trigger):
As for tracing
Support for IAP (In-Application Programming)
External Xdata:
—
Supports
Volume:
448 Kb banked memory.
Amount of breakpoints on address:
448 K
Mapping:
Yes
Support for Shadow RAM:
Yes
On-the-fly access:
Yes
Support for Memory Coverage:
Yes
Tracing:
24 bits for address;
8 bits for data.
Type of access: Read, Write
Complex breakpoint (trigger):
As for tracing
On-chip Xdata (XRAM):
Supports
Volume:
up to 20 Kb
Amount of breakpoints on address:
up to 20 K
Mapping:
No
Support for Shadow RAM:
Yes (with restrictions)
On-the-fly access:
Yes (with restrictions)
Support for Memory Coverage:
Yes (with restrictions)
Version 1.1
Page 66 of 245
Error! Unknown document property name.User's Manual
Tracing:
16 bits for address,
8 bits for data.
Type of access: Read, Write
Complex breakpoint (trigger):
As for tracing
EEPROM:
Does not support
Volume:
—
Amount of breakpoints on address:
—
Mapping:
—
Support for Shadow RAM:
—
On-the-fly access:
—
Support for Memory Coverage:
—
Tracing:
—
Complex breakpoint (trigger):
—
Data, Idata:
Supports
Volume:
256 bytes
Amount of breakpoints on address:
256, only for access with direct addressing
Mapping:
No
Support for Shadow RAM:
No
On-the-fly access:
No
Support for Memory Coverage:
No
Tracing, for the Data memory only:
8 bits for address, for read and write.
Complex breakpoint (trigger), for Data only:
As for tracing
Restrictions for emulation
See Restrictions of PR1-52-MIC0 and Special Considerations.
PR1-52-DS450
Method of emulation:
Dallas Semiconductor Bondout Chip
Emulation microcontroller:
DS89C450
Package adapters:
AR1-52-D40, AR1-52-L44, AR1-52-Q44
Target microcontrollers:
Dallas Semiconductor: List DS-1
Emulation MCU clock frequency:
0 to 33 MHz
Version 1.1
Page 67 of 245
Error! Unknown document property name.User's Manual
Emulation of the Idle and Power Down modes:
Yes
Emulation of the Low EMI (inhibit ALE) mode:
Yes
Supply voltage:
4.5 to 5.5 V
Configuration jumpers:
No
Emulation of memory
Code (Program) memory:
Supports
Emulation of the on-chip Program memory:
Yes
Volume:
64 Kb with the MR1-52-03 main board;
256 Kb banked memory with MR1-52-05.
Amount of breakpoints on address:
up to 16
Mapping:
Yes
Support for Shadow RAM:
No
On-the-fly access:
No
Support for Memory Coverage:
Yes
Tracing:
18 bits for address; 8 bits for command.
Type of access: instruction fetch, idle fetch,
operand, MOVC, interrupt handler.
Complex breakpoint (trigger):
As for tracing.
Support for IAP (In-Application Programming): No
External Xdata:
Supports
Volume:
64 Kb with the MR1-52-03 main board;
256 Kb (banked memory) with MR1-52-05.
Amount of breakpoints on address:
up to 16
Mapping:
Yes
Support for Shadow RAM:
No
On-the-fly access:
No
Support for Memory Coverage:
Yes
Tracing:
18 bits for address; 8 bits for data.
Type of access: Read, Write
Complex breakpoint (trigger):
On-chip Xdata (XRAM):
As for tracing
Supports
Volume:
1 Kb
Amount of breakpoints on address:
up to 16
Mapping:
No
Support for Shadow RAM:
No
On-the-fly access:
No
Support for Memory Coverage:
Yes
Tracing:
10 bits for address, 8 bits for data.
Type of access: Read, Write
Complex breakpoint (trigger):
As for tracing
EEPROM:
Does not support
Volume:
—
Amount of breakpoints on address:
—
Mapping:
—
Support for Shadow RAM:
—
On-the-fly access:
—
Support for Memory Coverage:
—
Version 1.1
Page 68 of 245
Error! Unknown document property name.User's Manual
Tracing:
—
Complex breakpoint (trigger):
—
Data, Idata:
Supports
Volume:
256 bytes
Amount of breakpoints on address:
256, only for access with direct addressing
Mapping:
No
Support for Shadow RAM:
No
On-the-fly access:
No
Support for Memory Coverage:
No
Tracing, for the Data memory only:
8 bits for address, for read and write;
8 bits for data, only for write.
Complex breakpoint (trigger), for Data only:
As for tracing
Restrictions for emulation
See Restrictions of PR1-52-DS450 and Special Considerations.
PR1-52-DS400
Method of emulation:
Dallas Semiconductor Bondout Chip
Emulation microcontroller:
DS80C400
Package adapters:
AR1-52-DS400-Q100
Target microcontrollers:
Dallas Semiconductor: DS80C400
Emulation MCU clock frequency:
0 to 75 MHz
Emulation of the Idle and Power Down modes:
Yes
Emulation of the Low EMI (inhibit ALE) mode:
Yes
Supply voltage:
3.2 to 3.6 V
Configuration jumpers:
No
Version 1.1
Page 69 of 245
Error! Unknown document property name.User's Manual
Emulation of memory
Code (Program) memory:
Supports
Emulation of the On-chip Program memory:
Yes
Volume of the On-chip Program memory:
64 Kb
Emulation of the external Program memory:
Yes
Volume of the external Program memory:
16 Mb
Amount of breakpoints on address:
up to 16
Mapping:
The whole memory is mapped to the target
device.
Support for Shadow RAM:
No
On-the-fly access:
No
Support for Memory Coverage:
Yes
Tracing:
24 bits for address; 8 bits for command.
Type of access: instruction fetch, idle fetch,
operand, MOVC, interrupt handler.
Complex breakpoint (trigger):
As for tracing.
Support for IAP (In-Application Programming): —
External Xdata:
Supports
Volume:
16 Mb
Amount of breakpoints on address:
up to 16
Mapping:
The whole memory is mapped to the target
device.
Support for Shadow RAM:
No
On-the-fly access:
No
Support for Memory Coverage:
Yes
Tracing:
24 bits for address; 8 bits for data.
Type of access: Read, Write
Complex breakpoint (trigger):
As for tracing
On-chip Xdata (XRAM):
Supports
Volume:
9 Kb
Amount of breakpoints on address:
up to 16
Mapping:
No
Support for Shadow RAM:
No
On-the-fly access:
No
Support for Memory Coverage:
Yes
Tracing:
24 bits for address, 8 bits for data.
Type of access: Read, Write
Complex breakpoint (trigger):
As for tracing
EEPROM:
Does not support
Volume:
—
Amount of breakpoints on address:
—
Mapping:
—
Support for Shadow RAM:
—
On-the-fly access:
—
Support for Memory Coverage:
—
Tracing:
—
Complex breakpoint (trigger):
—
Version 1.1
Page 70 of 245
Error! Unknown document property name.User's Manual
Data, Idata:
Supports
Volume:
256 bytes
Amount of breakpoints on address:
256, only for access with direct addressing
Mapping:
No
Support for Shadow RAM:
No
On-the-fly access:
No
Support for Memory Coverage:
No
Tracing, for the Data memory only:
8 bits for address, for read and write.
Complex breakpoint (trigger), for Data only:
As for tracing
Restrictions for emulation
See Restrictions of PR1-52-DS400 and Special Considerations.
Main Boards
Main board is the central component of our emulator. We offer three main boards for PICE-52:
Parameter
MR1-52-03
MR1-52-05
MR1-52-06
Configuration of PICE
Basic
Extended memory
Extended memory
Amount of banks
—
16
32
Emulated volume, Kb
64
1024
2048
Amount of breakpoints, K
64
1024
2048
Amount of banks
—
7
7
Emulated volume, Kb
64
448
448
Amount of breakpoints, K
64
448
448
Code memory:
Xdata memory:
Version 1.1
Page 71 of 245
Error! Unknown document property name.User's Manual
Notes
1. The table specifies the maximum amount of breakpoints supported by the main board.
2. The interface connector on the main board is a standard mini-USB connector. However, the
emulator cannot communicate with PC over a standard USB cable. You should use the USB
cable shipped with your PICE.
Package Adapters
Currently, text of this topic is being developed. We plan accomplish this topic in near future.
Additional Package Adapters for PICE-52
Use this table to identify the necessary additional package adapter for your PICE kit, when your
target package is SOIC or SSOP. You should use the additional DIP-to-SOIC or DIP-to-SSOP
package adapter together with the DIP package adapter of PICE.
Package adapter (PICE) for
the DIP target package
Additional package adapter:
DIP-to-SOIC
DIP-to-SSOP
PA-DSO-2403
AS-DIP.3-024-ST03-1
AR1-52-A5112-D24
PA-DSO-2403
AS-DIP.3-024-ST03-1
AR1-52-A5131-D28
PA-DSO-2803
—
AR1-52-ACC01-D24
PA-DSO-2403
—
AR1-52-ACC01-D28
PA-DSO-2803
—
AR1-52-PLP-D14
—
AS-DIP.3-014-ST03-1
AR1-52-PLP-D16
—
AS-DIP.3-016-ST03-1
AR1-52-PLP-D20
PA-DSO-2003
AS-DIP.3-020-ST03-1
AR1-52-PLP1-D8/1
PA-DSO-0803
—
AR1-52-ARZ-D24
Version 1.1
Page 72 of 245
Error! Unknown document property name.User's Manual
AR1-52-PLP1-D8/2
PA-DSO-0803
—
AR1-52-PLP1-D14
—
AS-DIP.3-014-ST03-1
AR1-52-PLP1-D14/1
—
AS-DIP.3-014-ST03-1
AR1-52-PLP1-D16
—
AS-DIP.3-016-ST03-1
AR1-52-PLP1-D20
—
AS-DIP.3-020-ST03-1
AR1-52-PLP1-D28
—
AS-DIP.3-028-ST03-1
To obtain such package adapter, contact your local distributor or Phyton (see Contact Information).
Using QFP Package Adapters
Each adapter for any QFP or TQFP package consists of at least two components: (a) the part to be
soldered to the target device; (b) the part to be connected to the POD board of PICE.
Component soldered to the target (QFP base)
This part matches the footprint of the specific package and is to be soldered immediately on the
target board in place of the target microcontroller. So, it becomes the component part of the target
board for the whole time of development process.
Component connected to POD (adapter board)
This part is the adapter board itself. Its socket connector on the side of the target board mates the
component soldered on the target board.
QFP adapter extender
This is the optional intermediate connector to be placed between the QFP base and the adapter
board. You may use it to increase the stacking height of the assembled adapter by 6.4 mm. Initially,
the QFP adapter is 30 mm high. With the QFP adapter extender, it becomes 36.4 mm high.
Version 1.1
Page 73 of 245
Error! Unknown document property name.User's Manual
General view
Restrictions of PICE-52 and Special Considerations
Emulation with PICE-52 is not absolutely free from restrictions. Also, there are some special considerations you have to take into account to ensure correct use of the emulator with microcontrollers of the 8051 family. Many of possible problems may result from specific features of microcontroller of certain type.
To obtain full info, first see Special Considerations Common for All POD Boards and then see specifics for your particular POD board:
Restrictions of PR1-52-Axx and Special Considerations
Restrictions of PR1-52-W77 and Special Considerations
Restrictions of PR1-52-PLP/76x and Special Considerations
Restrictions of PR1-52-PLP1/93x and Special Considerations
Restrictions of PR1-52-MIC0 and Special Considerations
Restrictions of PR1-52-DS450 and Special Considerations
Restrictions of PR1-52-DS400 and Special Considerations
Version 1.1
Page 74 of 245
Error! Unknown document property name.User's Manual
Special Considerations Common for All POD
Boards
The following topics describe the issues common for all POD boards available for PICE-52:
Displaying Contents of Ports
Working with the Target Code and Xdata Memory
Target Board Power Supply
Emulation Microcontroller Supply Voltage and Clock Frequency
External Clock
External Reset
The /EA Output
Displaying Contents of Ports
In the 8051 microcontrollers, ports P0, P1, P2, P3, P4 and P5 consist of the latch registers
(__P1_LATCH, __P3_LATCH, etc.), the port (external) pins and buffers between the latch outputs
and the port pins. When working with the microcontroller ports, you should keep in mind that:
• when your program writes to the port (for example, with the MOV Px, #data command), the
emulation MCU writes to the port latch;
• when your program reads from the port (for example, with the MOV A, Px command), MCU
reads the state of the port pins.
The program always writes to the latch only, while it can read either from the latch outputs or the
pins. When the program writes “1” to a bit of the latch, while the external device sets the signal at
the corresponding pin to “0”, then the data written to the latch bit will differ from the data read from
the pin.
Your program cannot directly access contents of the latch. That is why, the PICE software runs a
series of the JBC bit, rel instructions, one instruction for each bit of the port, to artificially restore
the contents. A specific feature of this instruction is that it accesses the latch contents and not the
port outputs (pins). Also, if a latch bit is set to "1", then executing this instruction for such bit delivers the "0" pulse at the corresponding port pin. The pulse duration equals the execution time of the
JBC instruction (for example, it is 2 microseconds under the clock frequency of 12 MHz).
PICE will read the latch only if you explicitly specify displaying this latch in the Watches window.
When reading the latch, zero pulses may appear at the port pins. If this is not allowable (if your
hardware is sensitive to zero pulses at the port pins), never specify displaying contents of the
corresponding latch on the screen.
Also, the emulator reads a latch when the right part of an expression contains the latch name (for
example, R1=__P2_LATCH).
The POD boards based on Atmel Enhanced Hook have individual features (see Contents of Ports
P1, P3, P4 and P5).
Also, the PR1-52-DS450 POD board has individual features (see Contents of Ports P1 and P3
(PR1-52-DS450)).
Working with the Target Code and Xdata Memory
PICE-52 carries SRAM chips intended to emulate up to 1 Mb of Code and up to 448 Kb of Xdata
memory. By default, the emulation microcontroller works with this memory. However, the microcontroller can work with memory (Code and/or Xdata) of the target board. PICE provides this capability
by means of mapping mechanism. The mapping of memory does not include any handling of the
target hardware (for example, removing the chips from the target device).
Version 1.1
Page 75 of 245
Error! Unknown document property name.User's Manual
Target Board Power Supply
The emulator employs voltage at the target microcontroller power pin (Vcc) to measure the voltage
at the target board. This input of the emulator (the Vcc circuit) has impedance of about 100 kOhm
and does not load the target board power supply unit. Keep in mind that the programmable power
supply unit in the emulator is intended only to supply the emulation microcontroller and that you
may not use it to supply the target board. The target board shall always have its own power supply
unit.
For more about the programmable power regulator, see Managing the Emulation MCU Power.
Emulation Microcontroller Supply Voltage and Clock Frequency
The emulation microcontroller has the built-in voltage regulator and the programmable clock frequency generator. With these units, you can easily control the supply voltage and clock frequency
of the target microcontroller (for more info, see Managing the Emulation MCU Power and the External Clock Generator group).
However, not every pair of voltage and frequency is allowable for reliable operation of the emulation microcontroller. For example, for the AT89C51ID2 microcontroller in the 12-clock mode, the
maximum clock frequency is 40 MHz under the supply voltage of 5 V and only 30 MHz under 2.7 V.
Setting the clock frequency to 40 MHz under the supply voltage of 2.7 V may result in malfunction
of the emulator.
The emulator does not check whether these parameters form an allowable pair. You yourself
should keep an eye on setting correct values.
External Clock
You can choose the external source of clock signal for the emulation microcontroller. Here, the external source is either the generator connected to the XTAL1 pin of the microcontroller, or crystal
connected to the XTAL1 and XTAL2 pins of the microcontroller.
The options for the external source are own programmable generator of the emulator or a generator (crystal) on the target board. To choose the source, use the External Clock Generator group
(the Hardware Configuration dialog).
Note. The XTAL2 output of the emulation MCU is always available on the emulator adapter, whichever generator you use (internal or external). So, if some elements of your system use the XTAL2
signal for synchronization, they will work perfectly getting clocks from the PICE-52 generator.
Below is an example, when you use the target board crystal as the clock source.
In this configuration, characteristics of the XTAL1 electric circuit of the target board fully determine
the clock pulse parameters.
You should take into account that electrically, the emulator connected to the target board is not absolutely equivalent to the target microcontroller connected to the target board. In the former case,
the package adapter take part in the XTAL1 and XTAL2 signal circuits and therefore, the circuits
are longer and their resistance and impedance are greater than in the latter case. Sometimes, this
may attenuate the clock signal or introduce interference in the XTAL1 and XTAL2 circuits and result
in the not reliable operation of the emulator.
To ensure reliable operation of the emulator, the crystal shall be located in the closest proximity to
the target microcontroller. The crystal itself shall be designed for operation at the first harmonic.
If this is impossible, we recommend switching the emulator to the internal clock generator. To
switch, use the External Clock Generator group of the Hardware Configuration dialog: set the
radio button to Emulator Internal and specify the clock frequency equal to that of your external
source.
External Reset
The circuit connecting the RESET pin of the package adapter to the RESET pin of the emulation
microcontroller goes through the PICE main board, so that the PICE hardware could control operation of this circuit. By default, the circuit is absolutely disconnected from the emulation microcontroller.
Version 1.1
Page 76 of 245
Error! Unknown document property name.User's Manual
To use the RESET circuit from your target, set the Enable RESET from the Target Board flag (in
the Emulation MCU Options group, the Hardware Configuration dialog). Please keep in mind
that:
1. The RESET circuit has a 10 kOhm pull-up (for /RESET) or pull-down (for RESET) resistor on
the POD board to mitigate noise.
2. The RESET circuit controls the RESET state of the emulation microcontroller only in the realtime mode. In the break mode, the circuit does not control the RESET state regardless of the
Enable RESET from the Target Board flag.
The /EA Output
The emulator does not receive the /EA signal from the target board and does not use it. That is
why, the state of this signal does not produce an effect on the Code memory configuration of the
emulation microcontroller.
To specify whether your emulated system uses the internal and external Code memory, use the
Hardware Configuration dialog, the Emulation MCU Options group, the Disable On-chip ROM
flag. The Disable On-chip ROM flag being set up corresponds to the state of /EA=0 in the target
microcontroller and vice versa.
Restrictions of PR1-52-Axx and Special
Considerations
If the POD board in your PICE is based on Atmel Enhanced Hook, keep in mind the following restrictions of emulation.
Deviation of time responses
In the emulator, some signals corresponding to the target microcontroller pins differ from those of
the target microcontroller by their time responses. They feature additional delays, in nanoseconds,
as follows:
ALE
7
/PSEN
10
RESET 15
P3.6
10 (see note below)
P3.7
10 (see note below)
P0[7..0] 10
P2[7..0] 10
Note. The P3.6 bit features the additional time delay only when it transmits the Write signal (performs its alternative function). The P3.7 bit features the additional time delay only when it transmits
the Read signal (performs its alternative function). Both P3.6 and P3.7 bits do not couple a delay
when you use them as the general–purpose inputs/outputs.
You specify the mode of these bits (if the target microcontroller supports them) in the Emulation
MCU Options group (PR1-52-Axx), the Hardware Configuration dialog.
Deviation of electrical parameters
In the emulator, the following signals corresponding to the target microcontroller pins differ from
those of the target microcontroller by their electrical parameters:
The maximum output voltage of ports P0[7..0] and P2[7..0] is 3.8 V.
Restrictions of emulation for particular target microcontrollers
Atmel AT89C1051, AT89C1051U, AT89C2051 and AT89C4051
Atmel AT87F51RC
Atmel AT89C55WD
OKI MSM80C154 and MSM83C154
Philips P89V51RB2/RC2/RD2 and P89LV51RB2/RC2/RD2
Version 1.1
Page 77 of 245
Error! Unknown document property name.User's Manual
SST 89C54, 89C58 and 89C59
Winbond W78E51B, W78LE51, W78C51D and W78L51
Winbond W78C52D, W78L52, W78E52B, W78LE52, W78C54, W78IE54, W78L54,
W78LE54 and W78C58
Winbond W78E54 and W78E58
Winbond W78LE58, W78E516B and W78LE516
Special considerations
The following topics describe special considerations for POD boards with Atmel Enhanced Hooks:
Contents of Ports P1, P3, P4 and P5
The Reduced EMI Mode
The Idle and Power Down Modes
Use of Stack
Emulation of 6-clock and 12-clock Modes
Freezing the Peripherals (PR1-52-Axx)
FLASH Boot Loader and In-Application-Programming
Using the Tracer and Complex Breakpoints (PR1-52-Axx)
Contents of Ports P1, P3, P4 and P5
With the POD board based on the Atmel emulation microcontroller, PICE specifically displays contents of ports P1, P3, P4 and P5. For explanation of these specifics, see Displaying Contents of
Ports.
PICE displays contents of ports P0 and P2 without the above mentioned specifics.
The Reduced EMI Mode
The POD boards of this group support the Reduced EMI mode, which is implemented by turning off
the ALE signal when working with the internal Code and Xdata memory. As compared with earlier
models of emulator, you do not need to specially prepare your program for debugging in the case,
when the Reduced EMI mode is to be used.
The Idle and Power Down Modes
These POD boards emulate all power saving modes without restrictions. The emulator hardware
recognizes the Idle and Power Down states of the chip and displays on the PICE toolbar:
or
The emulation microcontroller exits from the Idle mode upon:
• Any interrupt.
• Reset.
The emulation microcontroller awakens from the Power Down mode upon:
• External interrupt INT0 or INT1.
• Reset.
However, a particular case takes place, when you try to stop emulation by pressing the Stop button
(F9) when the microcontroller is in a power saving mode. PICE will invoke the message box:
Version 1.1
Page 78 of 245
Error! Unknown document property name.User's Manual
This message informs you that PICE
can satisfy your request to quit the
power saving mode only by resetting
the emulation microcontroller. Upon
resetting, the current context of the
microcontroller (states of SFRs, PC,
etc.) will be lost.
If you press No (deny halting the
emulation), the emulator will go on
running the program. If you press
Yes, PICE will reset the emulation
microcontroller and stop emulation.
If after resetting the microcontroller you need to explore state of the emulation microcontroller it had
immediately before switching to the power saving mode, use the hardware tracer.
Use of Stack
The POD boards of this group absolutely do not use the stack of your program and therefore, impose no restrictions on using the stack by your program.
Emulation of 6-clock and 12-clock Modes
The POD boards provide emulation of 6-clock and 12-clock modes without restrictions. However,
you should remember that the maximum allowable clock frequency of the emulation microcontroller
in the 6-clock mode is less than that in the 12-clock mode. This means that if your program works
in the 12-clock mode at a clock frequency of 40 MHz and tries to switch the emulation microcontroller to the 6-clock mode without correspondingly reducing the clock frequency, it may cause malfunction of the emulator.
The emulator does not check these parameters for correctness. You yourself should keep an eye
on setting correct values.
Freezing the Peripherals (PR1-52-Axx)
The POD boards based on the Atmel Enhanced Hooks have the following features in the break
mode:
1. All interrupts are disabled, while contents of the Interrupt Enable registers remain not
changed. If you try to enable an interrupt by setting up the corresponding bit in the Interrupt
Enable register, this setting will become effective only after you resume emulation of your program.
2. Timers T0, T1 and T2 are stopped.
3. The UART, I2C, SPI and CAN serial interfaces go on operating in the break mode, if their
baud rate generators do not use timers T0, T1 and T2 as sources of clock signal. However, if
an interrupt condition occurs during operation of serial interfaces in the break mode, then the
interrupt itself will not take place until your program is launched for execution.
4. The Programmable Counter Array is stopped.
5. The Watchdog timer (WDT) is stopped.
6. ADC completes the current conversion (at the moment of breaking the emulation) of the analog signal and stops until the next start of emulation.
7. The DMA channel completes the current elementary operation of data transfer and stops until
the next start of emulation.
For basic info about freezing the peripherals, see the corresponding paragraph in Basic Principles
of Emulation.
Version 1.1
Page 79 of 245
Error! Unknown document property name.User's Manual
FLASH Boot Loader and In-Application-Programming
The only way for your program to perform the In-Application Programming (IAP) is to use the boot
loader program or its API functions. The vendor provides the boot loaders as a piece of code preprogrammed into a special area of the Code memory called “boot ROM”. You can find copies of
these boot loaders in the form of HEX files at the Web-sites of the microcontroller manufacturers.
Upon turning the power supply on, the boot ROM in PICE is filled with zeroes (it does not contain
the boot loader). That is why, you have to load the boot loader into the emulator Code memory
yourself before debugging your program.
The POD boards provide programming the Code FLASH memory (when the target microcontroller
has it) from your program, however, with the following specific details:
1. PICE does not contain the boot loader program in its boot ROM area.
2. You have to get the boot loader program from the microcontroller manufacturer Web-site and
load it into the emulator. If you try to call the API functions while the boot loader program is not
loaded, IAP will not work (see description of this procedure below).
3. When your target microcontroller supports a non-zero start address, you may choose its value
from an interval. While PICE provides selecting the start address out of only two options, 0
and a fixed non-zero address that depends on the emulation microcontroller. The POD board
supports only fixed non-zero address. However, it is not a difficult restriction (see the paragraph below).
Debugging a program with IAP
1. Before loading your program executable file for debugging, load the boot loader into the emulator. To do this, use the Load Program for Debugging command of the File menu. You
should do this under any scenario of use.
2. Specify the start address in the Reset Address field of the Emulation MCU Options group
(the Hardware Configuration dialog). Also, see note 1 below.
You may do these two steps in any order.
Notes
1. In most microcontrollers with the FLASH Code memory, you can set any start address by
means of the Boot Vector and Boot Status configuration bytes. PICE does not emulate them.
Instead, it provides only two options for the start address: 0x0000 or some address in the boot
ROM area, which depends on the type of emulation microcontroller. For example, in
AT89C51ID2, it is 0xF800.
PICE identifies the POD board and provides the non-zero start address supported by its emulation microcontroller (in the Reset Address field).
2. During debugging, when you make changes in the source file(s) and reload your executable
file, you do not need to reload the boot ROM each time, if your program does not overwrite its
contents. The boot loader remains at its location until you switch off the power supply.
3. Usually, the boot loader file is a HEX file without symbol information.
Using non-zero start addresses
Generally, it is supposed that the actual start address of your boot loader coincides with the nonzero address you specified in the Reset Address field (the Emulation MCU Options group).
However, the former may be greater or less than the latter.
If address of your boot loader is greater than the non-zero address specified in the Reset Address
field, then nothing additional is needed. At start, PICE zeroes the memory. Code 0x00 corresponds
to the NOP instruction. As a result, the area between the address from the Reset Address field
and actual start address of your boot loader is filled with a series of NOP.
If address of your boot loader is less than the non-zero address in the Reset Address field, you will
have to solve the task yourself, because we do not support such cases. However, solutions are
easy. For example, you can place a jump (at the zero address) to the actual start address of boot
loader and return from the boot ROM to your program, which is located at some non-zero address.
Version 1.1
Page 80 of 245
Error! Unknown document property name.User's Manual
Using the Tracer and Complex Breakpoints (PR1-52-Axx)
The POD boards with Atmel Enhanced Hooks do not provide data for the internal RESET (the internal signal that indicates the MCU reset state). The corresponding field of the tracer frame contains “?”.
Generally, this signal should be processed by the Complex Breakpoint Trigger and be displayed in
the tracer window. However in this case, it is absent because POD boards with Atmel Enhanced
Hooks do not have this signal.
Restrictions of Emulation for Atmel AT89C1051, AT89C1051U,
AT89C2051, AT89C2051x2 and AT89C4051
PICE-52 supports Atmel low pincount microcontrollers (AT89C1051, AT89C1051U, AT89C2051,
AT89C2051x2 and AT89C4051). When emulating these chips, you should keep in mind that your
POD uses other emulation microcontroller (a 44-pin chip). Such emulation microcontroller differs
from the corresponding regular target microcontroller by the maximum output current per pin for
ports P1 and P3.
For the Atmel low pincount microcontrollers, the maximum current per pin I ol may reach 20 mA,
and the maximum total current I ol for all pins may reach 80 mA. At the port P1 and P3 outputs, the
low level of output voltage V ol=0.5 V corresponds to the output current of 20 mA.
For AT89C51ID2 under steady (non-transient) conditions, I ol shall be externally limited as follows:
the maximum I ol current per port pin shall be 15 mA and the maximum total I ol for all outputs shall
be 71 mA. At the port P1 and P3 outputs, the low level of output voltage V ol=0.4 V corresponds to
the output current of 1.6 mA.
Therefore, the maximum load capacity of ports P1 and P3 of the emulation microcontroller is substantially less than that of the Atmel low pincount microcontrollers. That is why, PICE does not support features related with large output current, for example, the direct LED drive outputs feature of
the Atmel chips.
Restrictions of Emulation for Atmel AT87F51RC
PICE-52 emulates Atmel AT87F51RC microcontrollers with the only restriction, that it does not
support the AUXR.3 and AUXR.4 bits and their related features.
Restrictions of Emulation for Atmel AT89C55WD
PICE-52 does not provide direct access to the DP1L and DP1H registers. To get round this difficulty, do not use instructions with direct access to DP1L or DP1H, but use only the MOV DPTR,
#data16 instructions instead.
Restrictions of Emulation for OKI MSM80C154 and MSM83C154
PICE-52 emulates microcontrollers OKI MSM80C154 and MSM83154 with the following restrictions:
1. It does not support the PCON.5 and PCON.6 bits and their related features.
2. It does not support the IOCON special function register and all its related features.
Restrictions of Emulation for Philips P89V51Rx2 and
P89LV51Rx2
This topic refers to the Philips microcontrollers: P89V51RB2, P89V51RC2, P89V51RD2,
P89LV51RB2, P89LV51RC2 and P89LV51RD2.
Emulation chip Atmel AT89C51ID2 of the PR1-52-ARX/ID2 POD board can emulate the mentioned
microcontrollers, however, they differ by addresses and formats of some special function registers.
Therefore, you can use this POD for debugging systems with microcontrollers P89V/LV51Rx2, but
have to take into account the following restrictions.
Version 1.1
Page 81 of 245
Error! Unknown document property name.User's Manual
Emulation of Brown-out Detection Reset
Microcontroller AT89C51ID2 does not support the brown-out detection and therefore, POD does
not emulate it. POD does not support the brown-out interrupt and its corresponding bits in the IEN1,
IP1 and IP1H special function registers. When debugging, accessing the addresses of these registers produce no effect on the emulation microcontroller.
Emulation of SPI
In the emulation microcontroller, the SPI registers are located at the following addresses:
SPCTL –
SPCFG –
SPDAT –
0xC3;
0xC4;
0xC5.
These addresses differ from those in the Philips microcontrollers.
Emulation of WDT
The AT89C51ID2 microcontroller controls WDT differently. To program or reload the WDT, you
have to use the special function registers of AT89C51ID2: WDTRST (with the address of 0xA6) and
WDTPRG (with the address of 0xA7). To reset the WDT, you should write 01EH and 0E1H to
WDTRST. WDTRST is a write-only register.
To have a more powerful WDT, a 7-bit counter has been added, which extends the Time-out capability to the range from 16ms to 2s @ FOSCA = 12MHz. For more info, see description of the
WDTPRG register in the AT89C51ID2 datasheet.
Emulation of FLASH IAP
The AT89C51ID2 microcontroller implements the FLASH IAP function differently from that in
P89V/LV51Rx2. Therefore, POD does not emulate/support this function and the FST, FCF registers related to it.
Switching between the 6-clock (X2) and 12-clock (X1) modes
When turned on, the emulation microcontroller always starts in the 12-clock mode. To switch it to
the 6-clock mode, the user program should set bit 0 of SFR at the address of 8Fh to 1. This requires to modify the user program, because perform this task, the Philips microcontrollers use bit 3
of SFR at the address of B6h.
Restrictions of Emulation for SST 89C54, 89C58 and 89C59
PICE-52 emulates microcontrollers SST 89C54, 89C58 and 89C59 with the following restrictions:
1. The emulator hardware does not support Concurrent Programming Operation of the microcontrollers and does not emulate the dedicated mailbox registers SFCM, SFCF, SFAL, SFAH and
SFDT. The emulator can access the on-chip program memory only for fetching the instructions and MOVC operands. The emulation microcontroller does not support the ERASE,
WRITE and VERIFY concurrent programming commands.
2. It does not support operation of the Watchdog timer.
Restrictions of Emulation for Winbond W78E51B, W78LE51,
W78C51D and W78L51
PICE-52 emulates these microcontrollers with the following restrictions:
1. The emulation microcontroller does not have the Watchdog timer the Winbond chip has.
Therefore, PICE does not support the WDTC special function register.
2. The lines of port P4 operate as the general purpose I/O lines only. The emulation microcontroller does not support external interrupts INT2 and INT3 and the XICON special function register.
Version 1.1
Page 82 of 245
Error! Unknown document property name.User's Manual
Restrictions of Emulation for Winbond W78C52D, W78L52,
W78E52B, W78LE52, W78C54, W78IE54, W78L54, W78LE54 and
W78C58
PICE-52 emulates these microcontrollers with the following restrictions:
1. The emulation microcontroller does not have the Watchdog timer the Winbond chip has.
Therefore, PICE does not support the WDTC special function register.
2. The lines of port P4 operate as the general purpose I/O lines only. The emulation microcontroller does not support external interrupts INT2 and INT3 and the XICON special function register.
Restrictions of Emulation for Winbond W78E54 and W78E58
When PICE-52 emulates these microcontrollers, the lines of port P4 operate as the general purpose I/O lines only. The emulation microcontroller does not support external interrupts INT2 and
INT3 and the XICON special function register.
Restrictions of Emulation for Winbond W78LE58, W78E516B and
W78LE516
PICE-52 emulates these microcontrollers with the following restrictions:
1. The lines of port P4 operate as the general purpose I/O lines only. The emulation microcontroller does not support external interrupts INT2 and INT3 and the XICON, P40AL, P40AH,
P41AL, P41AH, P42AL, P42AH, P43AL, P43AH, P4CONA, P4CONB and P2ECON special
function registers.
2. The emulation MCU does not have the SFRAL, SFRAH, SFRFD, SFRCN, CHPCON and
CHPENR special function registers. Therefore, PICE does not support the In-System Programming (ISP) mode.
3. Since the emulation MCU does not have the CHPCON special function register (see clause
2), you cannot use it to turn on/off the on-chip Xdata memory (AUXRAM). To turn on this
memory, clear the first bit at address 0x8E (it is the EXTRAM bit of the AUXR SFR of the
emulation microcontroller). To turn AUXRAM off, set the mentioned bit to 1.
Restrictions of PR1-52-W77 and Special
Considerations
If you use the PR1-52-W77 POD board, keep in mind the following restriction of emulation.
Deviation of time responses
In the emulator, some signals corresponding to the target microcontroller pins differ from those of
the target microcontroller by their time responses. They feature additional delays, in nanoseconds,
as follows:
ALE
7
/PSEN
10
RESET 15
P3.6
10 (see note below)
P3.7
10 (see note below)
Note. The P3.6 bit features the additional time delay only when it transmits the Write signal (performs its alternative function). The P3.7 bit features the additional time delay only when it transmits
the Read signal (performs its alternative function). Both P3.6 and P3.7 bits do not couple a delay
when you use them as the general–purpose inputs/outputs.
To specify the mode of these bits (if the target microcontroller supports them), use the Emulation
MCU Options group (PR1-52-W77), the Hardware Configuration dialog.
Version 1.1
Page 83 of 245
Error! Unknown document property name.User's Manual
Special considerations
The following topics describe special considerations for the PR1-52-W77 POD board:
Emulation Microcontroller Supply Voltage and Clock Frequency (PR1-52-W77)
The Reduced EMI Mode
The Idle and Power Down Modes
Use of Stack
Freezing the Peripherals (PR1-52-W77)
Timed Access Protection (PR1-52-W77)
Processing the Wait Signal
Using the Tracer and Complex Breakpoints (PR1-52-W77)
Emulation Microcontroller Supply Voltage and Clock Frequency
(PR1-52-W77)
Under the supply voltage of 2.7 V, the maximum clock frequency of emulation microcontroller is 25
MHz. For explanation, see Emulation Microcontroller Supply Voltage and Clock Frequency.
Freezing the Peripherals (PR1-52-W77)
The PR1-52-W77 POD board has the following features in the break mode:
1. All interrupts are disabled, while contents of the Interrupt Enable registers remain not
changed. If you try to enable an interrupt by setting up the corresponding bit in the Interrupt
Enable register, this setting will become effective only after you resume emulation of your program.
2. The emulator stops timers T0 and T1 with an error. When the timers are programmed to work
from the system clock divided by 4, this introduced error will be (in clock cycles):
when switching to the break mode: 19;
when quitting from the break mode:
7.
3. The UART, I2C, SPI and CAN serial interfaces go on operating in the break mode, if their
baud rate generators do not use timers T0, T1 and T2 as sources of clock signal. However, if
an interrupt condition occurs during operation of serial interfaces in the break mode, then the
interrupt itself will not take place until your program is launched for execution.
4. PICE periodically resets the Watchdog timer (WDT) to zero.
For basic info about freezing the peripherals, see the corresponding paragraph in Basic Principles
of Emulation.
Timed Access Protection (PR1-52-W77)
Target microcontrollers emulated by the PR1-52-W77 POD board contain registers, writing to which
during the break mode is protected by the Timed Access Protection function (TA). If you try to write
new values to these registers during the break mode, PICE will write without using TA.
To correctly write new values to the WS, WDCON, POR, WDIF and EWT registers, you should use
debug registers __WS_BIT, __WDCON, __POR_BIT, __WDIF_BIT and __EWT_BIT, respectively.
Processing the Wait Signal
The emulation microcontroller blocks the WAIT signal (P4.0) at the moment of break. This makes it
possible to stop the user program in cases, when the WAIT signal is active and the external Xdata
is being accessed. The state of the WAIT signal in the target device produces no effect on operation of the emulation microcontroller.
Version 1.1
Page 84 of 245
Error! Unknown document property name.User's Manual
Using the Tracer and Complex Breakpoints (PR1-52-W77)
This POD board does not provide data for the following fields of the tracer frame (the corresponding fields contain “?”):
1. DD (Internal Direct Data).
2. D (DPTR Select Status).
3. Op (Instruction opcode/ MOVX data), when the machine cycle type is “Reading internal Xdata”
(the Code/Xd field contains “Rd/XRAM”).
Restrictions of PR1-52-PLP/76x and Special Considerations
If you use the PR1-52-PLP/768 or PR1-52-PLP/769 POD board, keep in mind the following restrictions of emulation.
Use of stack
Since PICE with these POD boards always breaks emulation by means of interrupt, it takes two
bytes in the stack to write the return address. This interrupt is not from your program, but the feature of the PR1-52-PLP/768 and PR1-52-PLP/769 POD boards. In the process of breaking, the
monitor program corrects the stack pointer (subtracts 2 from its value) and zeroes these two used
cells.
When resuming emulation of your program, the monitor program puts the program counter value of
your program to the stack and executes RETI.
Breaking within an interrupt subroutine
If emulation stops (for any normal reason), while the emulator is handling an interrupt and has not
accomplished it with the RETI command, the emulator will break the emulation. In this case, resuming the emulation will result in the emulator malfunction.
The emulator resumes emulating your program (exits from the monitor program) on the RETI
command of the monitor program, which is the same RETI command used in the user programs.
Therefore, in this case it automatically enables interrupts before execution of RETI of the interrupt
handler. However, during the interrupt, only the interrupt handler is to issue RETI and enable the interrupts it disabled earlier.
There will be no such problem, if no one interrupt is being handled when the emulation stops.
Configuration bytes (Fuses)
These POD boards do not support writing to the UCFG2 configuration register. It always contains
OFFh.
Brownout Detect
The minimum voltage that the power regulator applies to the emulation microcontroller is 2.7 V. If
you set Enable Brownout at to 2.5 Volts (in the Fuses group (PR1-52-PLP/76x) of the Hardware
Configuration dialog), the Brownout Detect function will almost never operate (as if it were disabled).
Another point is that the emulator does not disable the Brownout Detect function in the break mode.
If you break emulation while the Enable Brownout at radio button is set to 3.8 Volts, you should
keep the emulation microcontroller supply voltage above 3.8 V. Otherwise, if the emulation microcontroller supply voltage goes down below 3.8 V, this function will operate and reset the emulation
microcontroller. This is not allowable, because in the break mode, only reset from pressing the
Stop button is allowed. All other reset conditions shall be disabled, because they break operation
of the emulator itself.
If unallowable reset occurs, PICE will inform you about the error and you should disable the
Brownout condition. To do this, you should either set Enable Brownout at to 2.5 Volts or increase
the emulation microcontroller supply voltage in one of the following ways, depending on position of
the radio button in the Emulation MCU Power Management group (of the Hardware Configuration dialog):
Version 1.1
Page 85 of 245
Error! Unknown document property name.User's Manual
• If the radio button is set to User-specified, you should specify another voltage in the Userspecified field equal to or greater than 3.8 V.
• If the radio button is set to Follow Target Board Voltage and your emulator works in the
stand-alone mode (is NOT inserted in the target board), you should set the radio button to
User-specified and specify a voltage in this field equal to or greater than 3.8 V.
• If the radio button is set to Follow Target Board Voltage and your emulator is inserted in the
target board, you should increase the supply voltage on the target board (at the target microcontroller supply pin), or do in accordance with the previous clause.
Special considerations
The following topics describe special considerations for the PR1-52-PLP/768 and PR1-52-PLP/769
POD boards:
Emulation Microcontroller Supply Voltage and Clock Frequency (PR1-52-PLP/76x)
Breaking the Emulation (PR1-52-PLP/76x)
The Idle and Power Down Modes (PR1-52-PLP/76x)
Freezing the Peripherals (PR1-52-PLP/76x)
Using the Tracer and Complex Breakpoints (PR1-52-PLP/76x)
Measuring the Clock Frequency
Emulation Microcontroller Supply Voltage and Clock Frequency
(PR1-52-PLP/76x)
Under the supply voltage of 3 V, the maximum clock frequency of the emulation microcontroller is
10 MHz. For explanation, see Emulation Microcontroller Supply Voltage and Clock Frequency.
Breaking the Emulation (PR1-52-PLP/76x)
PICE stops emulating your program on the following events:
1. PICE activates the NMI signal at the emulation microcontroller pin.
2. Fetching the command with the code of 0A5h, which is the break emulation command in the
emulation microcontroller (it is absent in the set of commands of the regular microcontroller).
3. An opcode is fetched from an address above 3FFFh.
Every event of those listed above causes the non-masked interrupt with the top priority.
The Idle and Power Down Modes (PR1-52-PLP/76x)
As compared with many other POD boards, these ones provide correct breaking of emulation,
when the emulation microcontroller is in the Idle or Power Down mode, and resuming of emulation.
In the following example, the user program turns on the Power Down mode (this example is valid
for the Idle mode as well):
Sleep:
ORL PCON,#002
Next:
NOP
Under normal execution, the ORL command starts activating the Power Down mode, which takes
certain time to accomplish. From the moment ORL is executed and to the moment the Power Down
mode is activated, an instruction with label Next is being fetched (this is the idle fetch). By the moment the Power Down mode is activated, PC remains not incremented (it points yet to the instruction with label Next).
In this example, if you press the Stop button while the emulation microcontroller is in the Power
Down mode, the emulator will break emulating your program, the emulation microcontroller will
awake from the Power Down mode and PC will be pointing to label Next.
This is an absolutely correct break. You can resume emulating from the place where you stopped.
Also, you can specify another value for PC and resume emulating. For example, you can point to
Version 1.1
Page 86 of 245
Error! Unknown document property name.User's Manual
the command that activated the Power Down mode the previous time. In this case, the microcontroller will fall asleep again upon resuming the emulation (it awoke when you broke the emulation).
Lets consider a related example, when you set a breakpoint at label Next. Now, PICE will cancel
the Power Down mode before it has activated this mode, because executing a breakpoint is a
higher priority and activation of the mode will wait.
Freezing the Peripherals (PR1-52-PLP/76x)
The PR1-52-PLP/768 and PR1-52-PLP/769 POD boards have the following features in the break
mode:
1. All interrupts are disabled, while contents of the Interrupt Enable registers remain not
changed. If you try to enable an interrupt by setting up the corresponding bit in the Interrupt
Enable register, this setting will become effective only after you resume emulation of your program.
2. Timers T0 and T1 are stopped.
3. The UART and I2C serial interfaces are stopped.
4. The Watchdog timer (WDT) is stopped.
For basic info about freezing the peripherals, see the corresponding paragraph in Basic Principles
of Emulation.
Using the Tracer and Complex Breakpoints (PR1-52-PLP/76x)
These POD boards do not provide data for the following fields of the tracer frame (the corresponding fields contain “?”):
1. DD (Internal Direct Data).
2. D (DPTR Select Status).
3. Op (Instruction opcode/ MOVX data), when the machine cycle type is “Reading internal Xdata”
(the Code/Xd field contains “Rd/XRAM”).
The value in the Addr field (Code/Xdata Address) equals the actual value only in the case, when
the latter is in the range from 0 to 07FFFh.
Measuring the Clock Frequency
The frequency meter uses the clock signal of the emulation microcontroller core. In the break
mode, the emulation microcontroller always operates from its internal generator. The clock frequency in the break mode differs from that of emulation, the frequency meter is on only during execution of your program. The frequency displayed in the break mode was measured before switching to the break mode.
In the Power Down mode, the microcontroller core clock frequency is 0, the emulator does not
measure the frequency and the meter outputs the last measured value.
Restrictions of PR1-52-PLP1/93x and Special Considerations
If you use the PR1-52-PLP1/932 or PR1-52-PLP1/935 POD board, keep in mind the following restrictions of emulation.
Use of stack
Since PICE with this POD board always breaks emulation by means of interrupt, it takes two bytes
in the stack to write the return address. This interrupt is not from your program, but the feature of
the PR1-52-PLP1/93x POD board. In the process of breaking, the monitor program corrects the
stack pointer (subtracts 2 from its value) and zeroes these two used cells.
When resuming emulation of your program, the monitor program puts the program counter value of
your program to the stack and executes RETI.
Version 1.1
Page 87 of 245
Error! Unknown document property name.User's Manual
Breaking within an interrupt subroutine
If emulation stops (for any normal reason), while the emulator is handling an interrupt and has not
accomplished it with the RETI command, the emulator will break the emulation. In this case, resuming the emulation will result in the emulator malfunction.
The emulator resumes emulating your program (exits from the monitor program) on the RETI
command of the monitor program, which is the same RETI command used in the user programs.
Therefore, in this case it automatically enables interrupts before execution of RETI of the interrupt
handler. However, during the interrupt, only the interrupt handler is to issue RETI and enable the interrupts it disabled earlier.
There will be no such problem, if no one interrupt is being handled when the emulation stops.
The IAP и ISP modes
Not supported.
Configuration bytes (Fuses)
This POD board does not support configuration registers SEC0 through SEC7.
Special considerations
The following topics describe special considerations for the PR1-52-PLP1/93x POD boards:
Breaking the Emulation (PR1-52-PLP1/93x)
The Idle and Power Down Modes (PR1-52-PLP1/93x)
The MCU RESET Button
Freezing the Peripherals (PR1-52-PLP1/932)
Freezing the Peripherals (PR1-52-PLP1/935)
Using the Tracer and Complex Breakpoints (PR1-52-PLP1/93x)
Measuring the Clock Frequency
Resources with Special Access
Brownout Detect
Breaking the Emulation (PR1-52-PLP1/93x)
PICE stops emulating your program on the following events:
1. PICE activates the NMI signal at the emulation microcontroller pin.
2. Fetching the command with the code of 0A5h, which is the break emulation command in the
emulation microcontroller (it is absent in the set of commands of the regular microcontroller).
Every event of those listed above causes the non-masked interrupt with the top priority.
The Idle and Power Down Modes (PR1-52-PLP1/93x)
This special consideration is the same as for the PR1-52-PLP/768 and PR1-52-PLP/769 POD
boards. See The Idle and Power Down Modes (PR1-52-PLP/76x).
The MCU RESET Button
The emulation microcontroller of this POD board distinguishes usual reset and power-on-reset and
protects some special registers from usual reset. When you press the MCU Reset button, PICE
imitates power-on-reset for the following registers by correcting their contents:
WDCON = 0FDh;
RTCCON = 60h.
It would be expedient for the PR1-52-PLP1/93x POD board, if the MCU Reset button performs not
usual reset, but power-on-reset. And in this way, we extend function of the button to power-onreset.
For more about the MCU Reset button, see the Run menu.
Version 1.1
Page 88 of 245
Error! Unknown document property name.User's Manual
Freezing the Peripherals (PR1-52-PLP1/932)
The PR1-52-PLP1/932 POD board has the following features in the break mode:
1. All interrupts are disabled, while contents of the Interrupt Enable registers remain not
changed. If you try to enable an interrupt by setting up the corresponding bit in the Interrupt
Enable register, this setting will become effective only after you resume emulation of your program.
2. The emulator stops timers T0 and T1 with an error. When the timers are clocked with the
PCLK frequency, this introduced error will be (in clock cycles):
when switching to the break mode: 18;
when quitting from the break mode:
2.
3. You can turn on/off freezing of CCU (Capture/Compare Unit) from the Emulation MCU Options group (PR1-52-PLP1/93x) (the Hardware Configuration dialog).
4. The Real-time Clock/System Timer and Watchdog timer (WDT) are stopped.
For basic info about freezing the peripherals, see the corresponding paragraph in Basic Principles
of Emulation.
Freezing the Peripherals (PR1-52-PLP1/935)
The PR1-52-PLP1/935 POD board has the following features in the break mode:
1. All interrupts are disabled, while contents of the Interrupt Enable registers remain not
changed. If you try to enable an interrupt by setting up the corresponding bit in the Interrupt
Enable register, this setting will become effective only after you resume emulation of your program.
2. You can turn on/off freezing of CCU (Capture/Compare Unit), timers T0 and T1 and RTC
(Real-time Clock/System) from the Emulation MCU Options group (PR1-52-PLP1/93x) (the
Hardware Configuration dialog).
3. The Watchdog timer (WDT) is stopped.
For basic info about freezing the peripherals, see the corresponding paragraph in Basic Principles
of Emulation.
Using the Tracer and Complex Breakpoints (PR1-52-PLP1/93x)
This special consideration is the same as for the PR1-52-PLP/768 and PR1-52-PLP/769 POD
boards. See Using the Tracer and Complex Breakpoints (PR1-52-PLP/76x).
Resources with Special Access
1. The emulator correctly writes to the WDCON and WDL registers using the “Feed Sequence”
algorithm.
2. The emulator correctly displays the ICRAH register in any window of IDE. PICE first reads
ICRAL (this initiates refreshing ICRAH), and then reads ICRAH. During the break mode, if
freezing of CCU is off, the displayed (read) values of ICRAL and ICRAH will not correspond to
the same moment of time!
3. The same situation for registers ICRBH and ICRBL, as in clause 2.
For more about freezing of CCU, see Break Mode and the Emulation MCU Options group (PR152-PLP1/93x) (the Hardware Configuration dialog).
Brownout Detect
In the break mode, the emulator does not disable the Brownout Detect function. If you break emulation while the Brownout Detect function is on (see the Fuses group (PR1-52-PLP1/93x) of the
Hardware Configuration dialog), you should keep the emulation microcontroller supply voltage
above 2.7 V. Otherwise, if the emulation microcontroller supply voltage goes down below 2.7 V, this
function will operate and reset the emulation microcontroller. This is not allowable, because in the
Version 1.1
Page 89 of 245
Error! Unknown document property name.User's Manual
break mode, only reset from pressing the Stop button is allowed. All other reset conditions shall be
disabled, because they break operation of the emulator itself.
If unallowable reset occurs, PICE will inform you about an error and you should disable the Brownout condition. To do this, you should increase the emulation microcontroller supply voltage in one of
the following ways, depending on position of the radio button in the Emulation MCU Power Management group (of the Hardware Configuration dialog):
• If the radio button is set to User-specified, you should specify another voltage in the Userspecified field equal to or greater than 2.7 V.
• If the radio button is set to Follow Target Board Voltage and your emulator works in the
stand-alone mode (is NOT inserted in the target board), you should set the radio button to
User-specified and specify a voltage in this field equal to or greater than 2.7 V.
• If the radio button is set to Follow Target Board Voltage and your emulator is inserted in the
target board, you should increase the supply voltage on the target board (at the target microcontroller supply pin), or do in accordance with the previous clause.
Note. In the given situation, if you disable the Brownout Detect function from the Fuses group
(PR1-52-PLP1/93x) and do not increase the supply voltage, the Brownout Detect function will remain enabled. Disabling this function is possible only after you remove the reset condition. Reset
remains on until the voltage is below 2.7 V.
Restrictions of PR1-52-MIC0 and Special
Considerations
If you use the PR1-52-MIC0 POD board, keep in mind the following restrictions of emulation.
Initializing the Idle and Power Down Modes
The In-System Programming Mode
Special considerations
The following topics describe special considerations for the PR1-52-MIC0 POD board:
Peculiarities of Design
Connecting and Turning On/Off the Emulator
Determining the Idle and Power Down Modes
Observing the Contents of XDATA Memory in Real Time
Effects of Parameters of XRAM Shadow Copy
Signals WRQ and RDQ
Also, see:
Diagram of Communication Connector on the Target Device
Adapter AR1-52-VCT49-D88
Initializing the Idle and Power Down Modes
In accordance with the specifications of Micronas, to switch to the Idle or Power Down mode, the
microcontroller shall execute two instructions together. These instructions set certain bits of the
PCON register to 1. The first instruction enables the mode (sets up the IDLE bit for the Idle mode,
or the PDE bit for the Power Down mode). The second instruction starts the mode (sets up the
IDLS bit for the Idle mode, or the PDS bit for the Power Down mode).
Note. Because of additional feature of the Micronas chips, to initialize the Idle mode, there shall be
the LCALL instruction after the second instruction in your program. That is, the third instruction running.
Version 1.1
Page 90 of 245
Error! Unknown document property name.User's Manual
Breaking during initialization of modes
If during fetching the second instruction, that is after the mode initialization procedure has began,
your program is stopped, then the emulation microcontroller will begin executing the monitor program commands and the mentioned above specification of Micronas will not be carried out. As a
result, after you return back to executing your program, the microcontroller will not “fall asleep” after
executing this second instruction.
Besides that, when initializing the Idle mode, it is physically possible to stop your program at the
LCALL instruction. But if this happens, then the emulator will replace the LCALL instruction with the
LJMP instruction. The result will be the fault of program stack and SP register and, most probably,
complete failure of your program.
The In-System Programming Mode
The emulator cannot work, when the ISP bit of the MEMCON register is set to 1.
When the emulator is in the halt mode, you cannot set the ISP bit to 1 using the PICE program.
However, your program can do this. If it does this, the emulator will run into a major fault. That is
why, you should pay attention when developing your program.
Peculiarities of Design
This POD does not have own emulation microcontroller: the microcontroller is placed either on the
target device, or on the special adapter AR1-52-VCT49-D88, and a flat cable provides electrical
connections between the microcontroller and emulator.
On one side, the cable is to be connected to the POD board through the AR1-52-MIC-C60 adapter;
on the other side, to the 60-pin connector of communication with the emulator (hereinafter referred
as communication connector). That is, if the emulation microcontroller is placed on the target device, then the target device shall have the communication connector, which meets the diagram of
communication connector on the target device (this is the recommendation of Micronas).
That is why, if the emulator is not connected to the emulation microcontroller, or if the emulation microcontroller power supply is turned off, then the emulation is impossible!
Note. The AR1-52-MIC-C60 adapter and flat cable are included in the basic supply kit of emulator;
the AR1-52-VCT49-D88 adapter is optional.
There are three ways of using the emulator with this POD:
1) Connect it immediately to the 60-pin connector on the target device.
2) Connect it to AR1-52-VCT49-D88, and insert the latter in the socket on the target device.
3) Connect it to AR1-52-VCT49-D88, and do not insert the latter elsewhere. This option corresponds to the standalone mode of emulator operation. For more about the standalone mode,
see Scenarios of Use.
In the first two cases, the emulation microcontroller gets power supply from the target device. In the
third case, you should apply power immediately to the power supply pin of adapter AR1-52-VCT49D88.
Before you begin working with the emulator, please learn the procedures of preparing the emulator
hardware.
Connecting and Turning On/Off the Emulator
This topic circumstantiates the procedures of preparing the emulator hardware with regard to the
PR1-52-MIC0 POD board.
Connecting parts of emulator
Do the following steps in any sequence:
1) Connect the flat cable to the AR1-52-MIC-C60 adapter.
2) Connect the AR1-52-MIC-C60 adapter to the PR1-52-MIC0 POD board.
Version 1.1
Page 91 of 245
Error! Unknown document property name.User's Manual
3) Set the jumpers on the target board in accordance with the diagram of communication connector on the target device, or on adapter AR1-52-VCT49-D88, depending on where the emulation microcontroller is placed.
4) Connect the other end of the flat cable to the communication connector on the target device or
on AR1-52-VCT49-D88.
5) If necessary, insert AR1-52-VCT49-D88 in the socket on the target board.
Turning the emulator on
Turn on the emulator in the following sequence: apply power to the emulator, apply power to the
emulation microcontroller, and load the PICE program.
Turning the emulator off
The order of turning off is: close the PICE program, turn off power of the emulation microcontroller,
and turn off power of the emulator.
Determining the Idle and Power Down Modes
The PR1-52-MIC0 POD board cannot distinguish between the Idle and Power Down modes of the
microcontroller. That is why, after switching to any of these modes, the emulator informs that both
modes are present.
Observing the Contents of XDATA Memory in Real Time
In this topic, a general case is considered, when the on-chip data memory (XRAM) and the external
data memory (off-chip XDATA) work together within common memory space, XDATA.
Observing the contents of XDATA memory in real time presupposes observing both mentioned
parts of XDATA. When the off-chip XDATA is mapped to the emulator, it is absolutely observable.
To observe the off-chip XDATA, when it is mapped to the target device, you should turn on the
shadow copy of memory. To observe the contents of XRAM, you need to build its shadow copy,
and this is possible only in a particular case.
Features of XRAM
At any one moment of time, the TWENTY, BOTTOM and NOMAP bits of the MEMCON register determine exact location of XRAM within the XDATA memory space. Your program controls these
bits.
For more about the bit values and location of XRAM, see the XRAM Shadowing group.
XRAM shadow copy
In the real-time mode, the emulator does not have access to the contents of MEMCON register.
Besides that, the emulator does not distinguish between access to the external XDATA and on-chip
memory. That is why in general case, when your program changes values in the mentioned bits
during operation, the emulator cannot build the shadow copy of XRAM and the only correct way will
be to turn off the XRAM shadow copy (it is turned off by default).
If your program changes these bits only at the initialization step (before the first MOVX instruction is
executed after the reset), or does not change them at all, then in this particular case, the emulator
will be able to build the shadow copy of XRAM. However, the emulator will need your help: you
have to explicitly inform the PICE program about the location of XRAM in the XDATA memory
space, which your program sets up.
How to control
To turn on the XRAM shadow copy and specify the location of XRAM in the XDATA memory space,
use the Hardware Configuration dialog, the XRAM Shadowing group.
When the XRAM shadow copy is turned on, you should ensure that the bit values specified in the
PICE program are exactly the same as those used by your program.
Note. The Enable External Memory Shadowing flag in the Memory Map group and the Enable
XRAM Shadowing flag in the XRAM Shadowing group do not intercross and do not interfere each
other.
Version 1.1
Page 92 of 245
Error! Unknown document property name.User's Manual
Effects of Parameters of XRAM Shadow Copy
The mentioned below parameters of XRAM shadow copy produce an effect on operation of some
parts of emulator. All these parameters are collected in the Hardware Configuration dialog, the
XRAM Shadowing group.
Tracer behavior
Turning on/off the shadow copy of XRAM effects the value, which the hardware tracer writes in the
Code/Xd field (the bus cycle type) of tracer frame when accessing XDATA:
• When the shadow copy is off, then the field always gets either “Rd/XDATA”, or “Wr/XDATA”.
• When the shadow copy is on, then “Rd/XDATA” or “Wr/XDATA” will be written when accessing the off-chip memory; and “Rd/XRAM” or “Wr/XRAM” will be written when accessing the
on-chip memory.
If you specify wrong parameters of XRAM shadow copy, this will lead to errors in determining the
memory type (XDATA or XRAM), and therefore, erroneous values in the Code/Xd field.
Breakpoints on access to XDATA
When the shadow copy is on and the XRAM Mapped to Upper Banks flag in the XRAM Shadowing group is set up, then the emulator changes behavior when processing the breakpoints on access to XDATA.
• The breakpoints, which are set up in bank 0 in the XRAM area, will also operate when accessing the addresses in other banks, which correspond to the addresses with breakpoints in
bank 0.
• The breakpoints, which are set up in banks 1 through 15 in areas of mapped XRAM, will not
be processed.
If you specify wrong parameters of XRAM shadow copy, this will result in wrong operation or not
operation of data breakpoints.
Memory coverage
When the shadow copy is on and the XRAM Mapped to Upper Banks flag in the XRAM Shadowing group is set up, then the Memory Coverage monitor works differently: when an XRAM cell is
accessed from any bank, the monitor will mark only the corresponding address in bank 0.
Signals WRQ and RDQ
When writing to XRAM, the Micronas microcontrollers output the WRQ signal and therefore, writing
to the off-chip XDATA also takes place. Similarly, when reading from XRAM, the RDQ signal is
output. This causes two features in operation of microcontroller.
Working with dumps of XRAM and off-chip XDATA
When you write to an XRAM cell through the Xdata tab (“current Xdata”) of the Memory Dump
window, the PICE program will write to both XRAM and off-chip XDATA memory.
When you write to XDATA cells through other tabs of the Memory Dump window, the PICE program will write a bit differently: when writing through the XRAM tab, it will write to XRAM only; and
when writing through the Off-chip XDATA tab, it will write only to the off-chip XDATA memory.
Operation of tracer
Even when accessing XRAM, the emulator cannot distinguish, whether this access is to the off-chip
memory or the on-chip one. That is why, to fill in the Addr field of buffer frame, the hardware tracer
uses the off-chip XDATA memory address (20 bits), which was accessed when executing the instruction.
Diagram of Communication Connector on the Target Device
If in the target device, you are going to use a microcontroller of the VCT49 family and PMQFP144-2
package, then in accordance with the recommendation of Micronas, the emulator shall use the microcontroller of target device as the emulation microcontroller. And to provide emulation, you
should carry out the following conditions (see diagram below):
Version 1.1
Page 93 of 245
Error! Unknown document property name.User's Manual
• Add the connector and jumpers to the target device. This connector will serve for communication with the emulator. The jumpers will provide correct reconfiguring of target device, depending on whether the emulator is connected.
• The communication connector (XP1) should be any connector manufactured by Tyco Electronics, with the part number of: 104549-8, 104068-6 or 104069-7.
• Connect the ALE, ADB[19..0] and DB[7..0] outputs of microcontroller VCT49 to, correspondingly, outputs ALE, A[19..0] and D[7..0] of connector XP1, and if necessary, to other units of
target device.
• Connect the PSENQ output of microcontroller VCT49 to only the /PSEN-P circuit (see diagram) and to nothing else except it; and if necessary, use the /PSEN-T circuit as a source of
the PSEN signal for other units of target device.
• Similar to the previous clause, connect the RDQ, WRQ and RESETQ outputs of microcontroller VCT49 to the /RD-P, /WR-P and /RST-P circuits, correspondingly; and use the /RD-T,
/WR-T, /RST-T circuits to control other units of target device.
• Open jumpers JP1 through JP4.
• Using jumpers JP5 through JP8, apply the logical 0 to the EXTIFQ, XROMQ, ENEQ and
TEST outputs (connect to ground).
• Connect a 20.250 MHz crystal to the XTAL1 and XTAL2 outputs of microcontroller VCT49,
together with all its supplement elements necessary for its operation within the target device.
• Apply power, in accordance with the specification of your chip, to the VSUP3.3IO and
VSUP1.8DIG outputs (these two voltages will suffice for operation of the emulator).
Adapter AR1-52-VCT49-D88
At the moment this topic is under development, not finished yet.
Version 1.1
Page 94 of 245
Error! Unknown document property name.User's Manual
Restrictions of PR1-52-DS450 and Special
Considerations
If you use the PR1-52-DS450 POD board, keep in mind the following restrictions of emulation.
Deviation of time responses
In the emulator, some signals corresponding to the target microcontroller pins differ from those of
the target microcontroller by their time responses. They feature additional delays, in nanoseconds,
as follows:
ALE
12
/PSEN
12
RESET 15
P3.6
12 (see note below)
P3.7
12 (see note below)
P0[7..0] 10
P2[7..0] 10
Note. The P3.6 bit features the additional time delay only when it transmits the Write signal (performs its alternative function). The P3.7 bit features the additional time delay only when it transmits
the Read signal (performs its alternative function). Both P3.6 and P3.7 bits do not couple a delay
when you use them as the general–purpose inputs/outputs.
To specify the mode of these bits (if the target microcontroller supports them), use the Emulation
MCU Options group (PR1-52-DS450), the Hardware Configuration dialog.
Using an external crystal
The emulator does not support an external crystal oscillator as the source of clock signal. Use either the programmable clock generator of the emulator, or the generator on the target board, if any.
Access to the external Xdata memory
The emulator does not support access to the external XDATA memory, when the following conditions take place simultaneously:
1. CKCON[2..0] = 0 (you selected the shortest duration of the MOVX cycle).
2. The emulation microcontroller clock frequency is more than 25 MHz.
3. The instruction, which follows a MOVX, is fetched from the internal Code memory.
Such case is a heavy load for the microcontroller and as a result, the instruction, which follows a
MOVX, will be processed incorrectly. The emulator cannot identify this situation and does not send
an error message.
Modifying the ROMSIZE register
The RMS[2..0] field of the ROMSIZE register sets the used volume of the internal Code memory.
When modifying value of RMS[2..0], you should carry out the following procedure recommended in
your target microcontroller datasheet:
1) Jump to a location in program memory that is unaffected by the change.
2) Disable interrupts by clearing the EA bit (IE.7).
3) Write AAh to the Timed Access register (TA;C7h).
4) Write 55h to the Timed Access register (TA;C7h).
5) Modify the ROM size select bits (RMS2-RMS0).
6) Delay 2 machine cycles (2 NOP instructions).
7) Enable interrupts by setting the EA bit (IE.7).
If you do not satisfy these conditions, the emulator may run into fault.
Modifying the ACON register
The ACON register controls the operation mode of buses P0 and P2, when accessing the external
Code or external Xdata memory.
The emulator will support modifying the ACON value only if this register is being accessed from the
user program located in the internal Code memory (On-chip ROM). Otherwise, the emulator faults.
Version 1.1
Page 95 of 245
Error! Unknown document property name.User's Manual
This restriction does not apply to the break mode: the emulator correctly carries out your changing
the ACON register value through the PICE program.
Restrictions of emulation for particular target microcontrollers
Dallas DS89C420, DS89C430 and DS89C450
Special considerations
The following topics describe special considerations for the PR1-52-DS450 POD board:
Using Ports P0 and P2 for GPIO (PR1-52-DS450)
Contents of Ports P1 and P3 (PR1-52-DS450)
Breakpoints and Trace Start/Stop Triggers (PR1-52-DS450)
The Reduced EMI Mode
The Idle and Power Down Modes
Use of Stack
Freezing the Peripherals (PR1-52-DS450)
Timed Access Protection (PR1-52-DS4xx)
High-level Steps (PR1-52-DS450)
Setting the Complex Breakpoint Triggers (PR1-52-DS450)
Using Ports P0 and P2 for GPIO (PR1-52-DS450)
When you use ports P0 and P2 for general-purpose input/output (GPIO), sometimes during the
break mode, the state of these ports may unwantedly change.
For example, during reset the emulation microcontroller automatically disables the internal Xdata
memory and this memory will remain disabled until the user program enables it. If during this time
interval, a PICE window displays variables located in Xdata or the Xdata memory contents, then
the emulator will try to access the external Xdata. During each attempt, it changes state of ports P0
and P2. After each attempt, the ports return to the GPIO and restore their previous state. Nonetheless, such temporary changes of state are not wanted, because they may erroneously control other
parts of the system being developed.
To avoid changes of state of ports P0 and P2 in the like situations, use the Hardware Configuration dialog, the Emulation MCU Options group (PR1-52-DS450), the Disable Access to Off-chip
Xdata in Break Mode flag. If the flag is on, then with the disabled internal Xdata memory the emulator will ignore attempts to read/write from/to external Xdata. The PICE program will display symbols "??" (data not available for reading).
Contents of Ports P1 and P3 (PR1-52-DS450)
PICE specifically displays contents of ports P1 and P3. For explanation of these specifics, see Displaying Contents of Ports.
PICE displays contents of ports P0 and P2 without the above mentioned specifics.
Breakpoints and Trace Start/Stop Triggers (PR1-52-DS450)
The total amount of the code breakpoints, breakpoints on access to XDATA, and the trace
start/stop triggers is of no more than 16.
The emulator cannot support the code breakpoints in the address range from 0400h to 07FFh,
when you enable using the XRAM memory as the Code memory.
Version 1.1
Page 96 of 245
Error! Unknown document property name.User's Manual
Freezing the Peripherals (PR1-52-DS450)
The PR1-52-DS450 POD board has the following features in the break mode:
1. All interrupts are disabled, while contents of the Interrupt Enable registers remain not
changed. If you try to enable an interrupt by setting up the corresponding bit in the Interrupt
Enable register, this setting will become effective only after you resume emulation of your program.
2. The emulator stops timers T0, T1 and T2.
3. The UART serial interface goes on operating in the break mode, if its baud rate generator
does not use timer T0, T1 or T2 as a source of clock signal. However, if an interrupt condition
occurs during operation of serial interface in the break mode, then the interrupt itself will not
take place until your program is launched for execution.
4. PICE periodically resets the Watchdog timer (WDT) to zero.
For basic info about freezing the peripherals, see the corresponding paragraph in Basic Principles
of Emulation.
Timed Access Protection (PR1-52-DS4xx)
In the break mode, the emulator automatically disables the Timed Access Protection and therefore,
you have unrestricted access the SFRs from the PICE program.
If switching to the break mode begins when executing the instructions that make access to registers protected with Timed Access, then the emulator begins break only after it accomplishes the
access.
Accessing a register protected with Times Access requires using the following template instructions, where Data8 is the values of 055h and 0AAh:
MOV
TA,#Data8
When the emulator executes such template instruction, it will disable breaking the emulation at the
next instruction.
For example, it will never break the emulation before the second or third instruction in the following
piece of program, which gives access to the Timed Access protected registers:
MOV
TA,#0AAh
MOV
TA,#055h
<Any instruction>
This feature brings the following behavior of emulator:
1. During the step-by-step debugging, the emulator executes the above piece of program as one
step.
2. A breakpoint set up at the second or third instruction will operate only if the previous instruction in this piece of program is not executed immediately before it.
3. If you place the cursor at the second or third instruction and start emulation by the Run to
Cursor command, then upon reaching the cursor position, the emulator will not break the
emulation, that is, the user program will go on running continuously.
High-level Steps (PR1-52-DS450)
The emulator carries out a high-level step of the user program as a sequence of low-level steps
with obligatory stops in between them. If in the Emulation MCU Options group (PR1-52-DS450)
(the Hardware Configuration dialog), the Disable Interrupts During High-level Step flag is on,
then before starting a high-level step, the monitor program of emulator zeroes the EA bit to disable
interrupts, and after the emulator has accomplished the high-level step, the monitor will not automatically restore the actual state of the EA bit it would have during the continuous execution.
Note. Carrying out a high-level step of the user program may take a substantially longer time as
compared with that during the continuous execution, because of stops in between the low-level
steps.
Version 1.1
Page 97 of 245
Error! Unknown document property name.User's Manual
Setting the Complex Breakpoint Triggers (PR1-52-DS450)
You should set the upper byte of the Code/Xdata address of the complex breakpoint trigger as follows:
• When you do not use memory banking, then set all bits of this field (from 23 to 16) to Any.
Otherwise, the trigger will never operate.
• When you use memory banking, you may set one or two lower bits of this field (depending on
the banking model) to a state other than Any.
Restrictions of Emulation for Dallas DS89C420, DS89C430 and
DS89C450
After resetting, the microcontrollers of this family initialize the RMS[2..0] field of the ROMSIZE register with an individual constant, specific for each microcontroller type:
101b, for DS89C420;
101b, for DS89C430;
110b, for DS89C440;
111b, for DS89C450.
The emulation microcontroller installed on the PR1-52-DS450 POD board initializes this field with
110b, which corresponds to DS89C440. If your target microcontroller is other than DS89C440, then
this initial value of the ROMSIZE register field will be wrong. Generally, when loading the user program, this may cause incorrect loading.
If reset takes place when the user program is in the break mode, then the emulator overwrites this
value (corrects it) in accordance with the target microcontroller type you have selected.
If reset takes place in the run-time, then the emulator cannot carry out the correction and after resetting, the register will specify incorrect on-chip ROM size. If you have permitted using the internal
Code memory, then among the commands executed immediately after reset, you should write the
value corresponding to your target microcontroller to RMS[2..0].
The internal Code memory is enabled by the Enable On-chip ROM flag (in the Hardware Configuration dialog, the Emulation MCU Options group (PR1-52-DS450)).
Restrictions of PR1-52-DS400 and Special
Considerations
If you use the PR1-52-DS400 POD board, keep in mind the following restrictions of emulation.
Deviation of time responses
In the emulator, some signals corresponding to the target microcontroller pins differ from those of
the target microcontroller by their time responses. They feature additional delays, in nanoseconds,
as follows:
ALE
5
/PSEN
5
RESET 15
P3.6
5 (see note 1 below)
P3.7
5 (see note 1 below)
P0[7..0] 5 (see note 2 below)
P2[7..0] 5
P7[7..0] 5 (see note 3 below)
Notes
1. The P3.6 bit features the additional time delay only when it transmits the Write signal (performs its alternative function). The P3.7 bit features the additional time delay only when it
transmits the Read signal (performs its alternative function). Both P3.6 and P3.7 bits do not
Version 1.1
Page 98 of 245
Error! Unknown document property name.User's Manual
couple a delay when you use them as the general–purpose inputs/outputs.
To specify the mode of these bits, use the Emulation MCU Options group (PR1-52-DS400),
the Hardware Configuration dialog.
2. The POD board couples the specified delay of port P0, when the port outputs the lower byte of
address, and when it reads data. As a result, over the complete cycle of accessing the target
memory, the total delay is twice as long.
3. Port P7 gets the additional time delay only when you use it to output the lower byte of address
(to perform its alternative function). The POD board does not couple a delay to the port P7
pins, when you use them as the general–purpose inputs/outputs.
Using an external crystal
The emulator does not support an external crystal oscillator as the source of clock signal. Use either the programmable clock generator of the emulator, or the generator on the target board, if any.
Using the On-chip ROM
1. When emulating, the DS80C400 microcontroller does not provide access to its On-chip ROM.
That is why, PICE-52 emulates this memory by means of external RAM of 64 Kb. One can view it in
the Code memory space beginning from address 0FF0000h. To turn on/off this RAM, use the Enable On-chip ROM flag in the Emulation MCU Options group (PR1-52-DS400) of the Hardware
Configuration dialog.
If the emulator resets the emulation microcontroller and the On-chip ROM is on, then after the reset
is over, the emulator will write new values to the following registers:
0С1h
to ACON;
0FFh
to AP;
0FF0000h to PC.
When the emulator resumes emulation, these new values provide for launching the Boot Loader,
which is located in the external RAM.
2. Sometimes, the emulator cannot creditably determine the upper byte of address, which the emulation microcontroller uses to access data. This is related with possible absence of one of signals
CEi. In such case, the emulator considers that the access is to the On-chip ROM.
Using the BROM bit (ACON.3)
After the user program is stopped, the emulator automatically zeroes the BROM bit to prevent unwanted reset of the emulation microcontroller.
Special considerations
The following topics describe special considerations for the PR1-52-DS400 POD board:
Memory of Emulator (PR1-52-DS400)
Writing to the Target Board Code Memory (PR1-52-DS400)
Contents of Ports P1, P3 and P4 (PR1-52-DS400)
Breakpoints and Trace Start/Stop Triggers (PR1-52-DS400)
The Reduced EMI Mode
The Idle and Power Down Modes
Use of Stack
Freezing the Peripherals (PR1-52-DS400)
Timed Access Protection (PR1-52-DS4xx)
High-level Steps (PR1-52-DS400)
Memory of Emulator (PR1-52-DS400)
The emulator provides neither the Code memory, nor the off-chip Xdata memory. You can debug
your program only when the emulator is connected to the target board, which carries memory of the
specified types.
Version 1.1
Page 99 of 245
Error! Unknown document property name.User's Manual
Writing to the Target Board Code Memory (PR1-52-DS400)
The emulator supports writing to the target board Code memory, which is build using the static
RAM memory modules. This means writing by means of the emulator itself. While debugging, this
may be useful to go round the routine loading procedure, for example, when in your project it is to
be carried out over the serial communication interface and takes a longer time.
The emulator performs such write operation at the current clock frequency, with the longest possible write cycle duration and only during the break mode.
To enable writing to the target board Code memory, do the following in the Hardware Configuration dialog:
1. Set up the IDE Can Program Target Code Memory flag in the Target Code Memory group
(PR1-52-DS400).
2. In the Extended Address Generation group (PR1-52-DS400), specify the subset of pins of
port 4 and 6 used in the target board to output the upper digits of extended address.
3. In the Chip-Enable Generation group (PR1-52-DS400), specify the subset of pins of port 4
and 6 used in the target board to output signals CEi.
Contents of Ports P1, P3 and P4 (PR1-52-DS400)
PICE specifically displays contents of ports P1, P3 and P4. For explanation of these specifics, see
Displaying Contents of Ports.
PICE displays contents of port P2 without the above mentioned specifics.
Breakpoints and Trace Start/Stop Triggers (PR1-52-DS400)
The total amount of the code breakpoints, breakpoints on access to XDATA, and the trace
start/stop triggers is of no more than 16.
Freezing the Peripherals (PR1-52-DS400)
In the break mode, timers T0, T1 and T2 are stopped. When entering the break mode, the microcontroller automatically stops these timers, and when resuming the emulation, it starts them afresh.
Stopping and starting these timers does not introduce any error to the values in registers TL0, TH0,
TL1, TH1, TL2 and TH2.
High-level Steps (PR1-52-DS400)
The emulator carries out a high-level step of the user program as a sequence of low-level steps.
Before starting a high-level step, the monitor program of emulator zeroes the EA bit to disable interrupts, and after the emulator has accomplished the high-level step, the monitor will not automatically restore the actual state of the EA bit it would have during the continuous execution.
Note. Carrying out a high-level step of the user program may take a substantially longer time as
compared with that during the continuous execution.
Communication with PC
The emulator software and hardware communicate with each other over the serial or USB interface. In both cases, special cable is used (though, cable for USB differs from that for the serial
channel).
To set up the communication interface parameters, use the PICE-52 Communication dialog.
USB
The interface cable includes the RS–USB bridge and features an individual serial manufacturing
number. Connecting one emulator over USB takes one interface cable and one USB port in your
computer. To connect several emulators, you need several cables and several USB ports.
Version 1.1
Page 100 of 245
Error! Unknown document property name.User's Manual
RS-232C
The RS-232C serial interface cable of PICE has a DC isolating unit.
The emulator supports communication rates of up to 115.2 kBaud and we recommend using the
top rate. If for some reason the communication is not established at 115.2 kBaud, turn off the emulator for a few seconds, turn it on and try again with a lower baud rate. When communication errors
occur during the emulator operation, it is also advisable to reduce the baud rate.
The computer COM port supplies the DC isolating unit with current through its DTR and RTS pins.
To ensure reliable communication at a rate of 115 200 Baud, the DTR and RTS pins shall be able
to supply current of 1.5 mA. Most computers meet this requirement. Notebooks have less powerful
ports and the rate shall be reduced to 57 600 Baud. If communication is stable only at lower rates,
this may indicate a fault in the computer or in the DC isolating unit of the PICE serial cable. Nevertheless, you can choose a baud rate in the range from 14 400 to 115 200 Baud.
When using a 25-pin to 9-pin adapter, make sure that the adapter connects the following signals
(circuits):
DIN-25
DIN-9
Circuit
3
2
RxD
2
3
TxD
20
4
DTR
7
5
GND
4
7
RTS
Menus
To fully control the development process and its stages or separate activities, the PICE software
has the menu bar at the top of its window with the following menus:
• The File menu
• The Edit menu
• The View menu
• The Run menu
• The Breakpoints menu
• The Configure menu
• The Project menu
• The Commands menu
• The Scripts menu
• The Window menu
• The Help menu
To access these menus, use mouse or press Alt+letter, where "letter" is the underlined character
in the name of the menu item.
Version 1.1
Page 101 of 245
Error! Unknown document property name.User's Manual
Menus
The File menu
The File menu commands control the file operations in your project. For those commands that
have the toolbar button, the button is shown in the first column of the table below. If there is a
shortcut key for a command, the shortcut key is shown at the right of the command in the menu.
You can load and save not only program code, but also data to/from the Data address space.
Button
Command
Description
Load Program for
Debugging
Opens the Load Program dialog.
Reload Program
Reloads the most recently loaded program.
When you are working with projects, this command performs
much alike the Make command of the Project menu. If no
source files are changed, then nothing will happen. Otherwise,
the project will be recompiled and the program will be reloaded.
Save File from
MCU Memory
Opens the Save File from MCU Memory dialog to save the
disassembled code from the target microcontroller memory to
a file.
New
Opens the Source window with no file loaded.
Open
Invokes the Open File dialog. The file you choose appears in
the Source window.
Save
Saves the file in the currently active Source window to a disk.
Save As
Inquires the new name for the file in the currently active
Source window and saves the file to a disk.
Print
Opens the standard Print dialog for the default printer. You
can print the whole file or a selected block of text.
Configuration
Files
Gives access to operations with configuration files.
AutoSave Session
on Exit
When you exit the program with this option enabled, the PICE
software automatically saves all configuration files. The option
is enabled by default.
Exit
Closes PICE-52. Alternatively, use the standard ways to close
a Windows application (the Alt+F4 or Alt+X keys combination).
The Load Program dialog
This dialog serves for loading a file into the specified address space of the target microcontroller.
Version 1.1
Page 102 of 245
Error! Unknown document property name.User's Manual
Element of dialog
Description
File Name
The text field for the name of the file to be loaded. Type in the file name,
select it from the drop-down list box with names of the most recently
loaded program files, or press the Browse button to locate the file.
Browse
Opens the Load File for Debugging dialog.
Compiler Vendor
Specifies the debug format of the file to be loaded (by the vendor’s
name of your compiler, and the file extension).
For the binary image files, you should specify the first address of memory area, into which the file will be loaded (load address). Files in all
other formats provide the load address themselves.
Address Space
Sets the type of target microcontroller address space, into which to load
the file.
When other files necessary for debugging a program, such as symbol information and source files,
are located in the same directory together with the program file, the PICE debugger automatically
loads them. In some special cases, when a source file cannot be found in its usual place, you shall
specify path to it in the Additional Path for Source Files field of the Debug Options dialog.
If you are going to use PICE for debugging of already compiled programs, then these programs
should contain the debugging information necessary for the source-level and symbol debugging.
On how to include this info, see your compiler manuals. For more about PICE IDE, see Working
with Projects.
Normally, compilers of each type work with their own file format. Therefore, you shall specify the file
format of the compiler, which created the file. PICE-52 understands the following formats:
Hi-Tech Software,
Avocet Systems
With this option, you should specify the name of file with symbol information (its extension is .SYM).
IAR Systems UBROF
The IAR Systems C compiler package generates files of this format.
The loadable file extension is .D03. PICE supports UBROF of up to version 8. We recommend using PICE IDE for development of programs
with the IAR tools.
Keil Software v. 4.x,
Raisonance
Usually, the loadable files created by these packages have no extension (just the file name) or have the extension of .ABS or .OMF. We
recommend using PICE IDE for development of programs with the Keil
tools.
Version 1.1
Page 103 of 245
Error! Unknown document property name.User's Manual
Keil Software v. 5.x,
6.x, 7.x
Usually, the loadable file has no extension (just the file name) or has
the extension of .ABS or .OMF. We recommend using PICE IDE for development of programs with the Keil tools.
Tasking symbol
format
The extension of files in the Tasking symbol format is .OUT.
Phyton/MicroCOSM
MCE
The MCA-51 assembler of the Project-52 package generates files of
this format. The default extension is .MCE. We recommend using PICE
IDE for development of programs with MCA-51.
Crossware Extended OMF-51
These files are created by the Crossware Embedded Development
Software package. Their extension is .OMF.
SDCC CDB
This format is generated by the SDCC C compiler/assembler package.
The file extension is .CDB.
Standard/Extended
Intel HEX
This is the most widely used format. The HEX-file contains the load addresses together with the program code in ASCII format. HEX files do
not contain symbol information.
Intel Absolute
(AOMF-51)
This is the absolute object format generated by the Intel MCS-51
MACRO ASSEMBLER. Usually, the loadable file has no extension (just
the file name) or has the extension of .ABS.
Binary Image
This is binary image of memory area. Usually, files of this type are created by EEPROM-burner (programmer), when it reads the contents of
ROM.
When loading a binary file, specify the start load address (the end address is determined automatically from the file size).
The Save File from MCU Memory dialog
This dialog box serves for saving the specified memory contents to a disk file. The text of disassembled program can also be saved.
Element of dialog
Description
File Name
The name of the file to be saved. Use the Browse button to navigate to
the destination directory for the file.
Browse
Opens the Save File from MCU Memory dialog.
Start Address
Sets the start address of the area, from which to save.
Version 1.1
Page 104 of 245
Error! Unknown document property name.User's Manual
End Address
Sets the end address of the area, from which to save. Contents of the
area between the start address and the end address inclusively will be
saved.
Address Space
The type of address space of target microcontroller, from which to save
the data or program.
File Format
Sets the format for the file to be saved.
The following file formats are supported:
Standard Intel HEX
Contains the load addresses together with the program code in ASCII
format.
Extended Intel HEX
This is the Standard Intel HEX format with 32-bit load addresses.
Binary Image
The memory image as binary (executable) file.
Disassembly
The text of disassembled program. Wherever possible, the disassembler replaces absolute values with symbols.
ASCII Dump
The binary image of memory area written as ASCII text (see example
below).
Example of ASCII dump:
C:0000 02 00 03 75 81 30 78 30 76 00 D8 FC 90 00 01 AE ...u.0x0v.+....
C:0010 83 AF 82 90 00 01 12 00 41 60 05 E4 F0 A3 80 F6 ........A`.. .А
C:0020 90
.
The Open File dialog
Use this dialog to open a source file in the Source window.
Element of dialog
Description
File Name
Specifies name of the file to open.
Browse
Opens the Open File dialog for locating the file to open.
File Open History
Lists the previously opened files.
Hide Nonexistent File
Names
Turns off displaying the file names, which do not exist on the disk already, in the File Open History list.
The Edit menu
Commands of this menu refer to the currently active Source window.
Button
Version 1.1
Command
Description
Undo
Undoes the last editing action with text executed in this window. For example, if the last action is deleting a line, then the
deleted line will be restored back. The number of steps provided by the Undo function is set on the General tab of the
Editor Options dialog.
Copy
Copies the marked block to the clipboard. The text format in
the clipboard is standard and the copied block is accessible to
other programs.
Cut
Removes the marked block to the clipboard.
Page 105 of 245
Error! Unknown document property name.User's Manual
Paste
Copies the block from the clipboard in the cursor position. If
the block in the clipboard is copied from PICE, then the inserted block will retain its initial type (line, vertical flow). The
blocks copied from other programs will be of the flow type.
Append to Clipboard
Copies and appends the marked block of text to the block in
the clipboard.
Cut & Append to
Clipboard
Cuts the marked block of text and appends it to the block in the
clipboard.
Fast Copy
Copies the persistent block from one position in the window to
another position in this window.
Fast Move
Moves the persistent block from one position in the window to
another position in this window.
Block Off
Takes marking off the marked text block.
Search
Opens the Search for Text dialog.
Next Search
Repeats search with the same parameters as for the previous
search.
Replace
Opens the Replace Text dialog.
Display Multi-file
Search Results
Re-opens the last multi–file search results in the Multi-File
Search Results dialog.
Display from Line
Number
Opens the Display from Line Number dialog for you to specify the line number. The source text will be displayed from this
line.
Set Bookmark
Opens the Set Bookmark dialog to set a local bookmark.
Retrieve Bookmark
Opens the Retrieve Bookmark dialog to retrieve a local
bookmark.
Condensed Mode
Toggles the Condensed mode of display.
Condensed Mode
Setup
Opens the Condensed Mode Setup dialog.
Match
Brace/Comment
Finds the pair for the brace or comment the cursor is located
at. The types of braces are: the round ( or ), square [ or ] and
curly { or } braces. The comment sign is either /* or */.
If the pair is found, the cursor will move to its location.
The View menu
This menu gives direct access to specialized windows of all types within PICE:
Menu Item
Controls the
Source
Source window.
Project
Project window.
Messages
Messages window.
Watches
Watches window.
AutoWatches
AutoWatches window.
Inspector
Inspector window.
Memory Dump
Memory Dump window.
Memory Coverage
Memory Coverage window.
Version 1.1
Page 106 of 245
Error! Unknown document property name.User's Manual
Memory Layout
Memory Layout window.
Code Browser
Code Browser window.
Disassembler
Disassembler window.
Execution Time
Execution Time window.
Peripherals
submenu with the Peripheral Device windows.
Tracer
Tracer window.
Console
Console window.
If you select a window in this menu and there is no window of this type opened, PICE will open it. If
the window is opened, PICE will put it to the foreground.
Except for the listed above windows, the PICE program provides three more types of windows: the
User window, the I/O Stream window and the Script Source window. These windows are designed for work with scripts. For more info about script files, see Script Files and Emulator Use
Automation.
Local menus
Each window has own local (shortcut) menu. To open the local window menu, either click the right
mouse button within the window or press Ctrl+Enter or Ctrl+F10.
Not every window contains buttons for all its local menu commands (for example, the Source window).
The Run menu
Commands of this menu control execution of program being developed.
Button
Command
Description
Step
Executes one step of the program on the "high level", that is,
one source text line. If no program is loaded or there is no debug information on the line numbers in the program, then this
command executes one machine instruction in the same way
the Low-level Step command does.
Step Over
Executes one step of the program on the "high level" without
breaking at the functions called from the current operator. If no
program is loaded or there is no debug information on the line
numbers in the program, then this command executes one
machine instruction in the same way the Low-level Step Over
command does.
Low-level Step
Executes one step of the program on the "low level" (one machine instruction).
Low-level Step
Over
Executes one step of the program on the "low level" without
breaking into subroutine, if it is called in the current machine
instruction. PICE sets the breakpoint at the instruction following the current one and the program is run continuously. In this
way, you can execute cycles as well as a subroutine call by the
same command.
If the current instruction is a jump instruction, then only this instruction will be executed.
Run/Stop
Version 1.1
Starts continuous execution of the program or stops the program being run.
Page 107 of 245
Error! Unknown document property name.User's Manual
Run w/no Breakpoints
Starts continuous execution of the program. Disables all
breakpoints of all types. However, the disabled breakpoints are
not deleted and their state will be restored, when the program
is stopped.
Run to Address
Opens the Run to Address dialog for you to specify the address, up to which the program will be executed. After the address is entered, the program starts. The program stops, when
it reaches the specified address.
Auto-Step
Enables the Automatic Step mode. In this mode, PICE automatically runs the loaded program by steps with the pause after each step. The screen is fully updated after each step.
To stop the program and quit this mode, use the Run/Stop
command.
Auto-Step / Redraw Setup
Opens the Auto-Step / Redraw Setup dialog with the step
mode parameters.
Redraw
Updates the screen (all windows in PICE), when running the
program continuously.
MCU Reset
Resets the target microcontroller.
The target microcontroller is reset automatically upon loading a
program for debugging. To switch off this option, use the Configure menu, the Debug Options dialog.
Time Counter Reset
Resets the time counter (real-time timer) used to evaluate the
execution time of a program. For more information about the
timer, see the Execution Time window.
For more info about running your program by steps, see Executing the High-level Language Operators and Preparing Programs for Source-level Debugging.
To execute the program up to the line, double-click this line in the Source window or the Disassembler window.
When the program being developed is run continuously, many commands of PICE and some local
window commands are disabled. For example, you cannot load another program. At the same time,
you still can freely move or resize windows on the screen, view and change any data and so on.
Also, you can use the Redraw command or turn on the automatic update of the screen contents at
the specified time intervals (using the Auto-Step / Redraw Setup dialog).
For more info about accessing the emulation microcontroller resources during emulation in the realtime mode, see On-the-fly Access to Microcontroller Resources.
The Auto-Step / Redraw Setup dialog
This dialog box sets up parameters of the
Automatic Step mode and of the automatic
screen update during continuous execution of
program.
Version 1.1
Page 108 of 245
Error! Unknown document property name.User's Manual
Element of dialog
Description
High-level Step/ Lowlevel Step
Specifies the step level for the automatic step mode: the high-level
steps (the high-level language operators) or the machine instructions.
Delay Between Steps
in Seconds
Duration of the pause between the steps for the automatic step mode,
in seconds. The zero value is allowable, it gives the pause of 0.1 second.
Redraw on
When this flag is on, during the continuous execution of program PICE
automatically updates the screen (all windows) at the time interval
specified in the Redraw Delay field.
Redraw Delay (Real
Time Seconds)
The time interval, at which to update the screen automatically during the
continuous execution of program. When the Redraw on flag is off, this
value is ignored.
Executing the High-level Language Operators
If the program under debugging was written in a high-level language and compiled with the debug
information, then PICE builds the internal table of line numbers. This table contains the set of records that describes the correspondence between the program addresses and lines and the source
files. When you debug a program step-by-step on the "high level", PICE sets "invisible" breakpoints
to all the addresses of the high-level language operators and runs the program. The program runs
up to the next breakpoint. So, the high-level step is actually performed by starting the program in
continuous mode with the breakpoints.
Note that some assemblers also provide information about the line numbers. PICE handles it the
same way as it does for the high-level languages, though in most cases, the assembly language
operators are translated into a single machine instruction.
Implementation of the Step Over command
This command executes the "current line of source text" up to the next line, i.e. without tracing the
subroutines that may be called from the current line. PICE simply places a code breakpoint at the
next line address (known from the symbol information) and starts the continuous emulation. If the
current line contains code that does not end at the next source line (for example, a 'return'
or 'goto' operator), then the program may never reach the next line. PICE cannot identify
this, so you are on your own in this situation.
Preparing Programs for Source-level Debugging
PICE can work as a standalone debugger for source-level and symbol debugging of executable
files. However, to enable the source-level debugging, the files shall contain necessary symbol information. Generally, not every file that came from external project contains this information. To
add this information to the files, you will need to properly compile and link them. Refer to the tool
vendor documentation to learn about the compiler and linker options. For more about the standalone debugging, see PICE as External Debugger.
Alternatively, you can let PICE care of your files. This way will streamline your development process. For more info, see Working with Projects.
The Breakpoints menu
This menu contains the commands to control breakpoints and triggers and the hardware breakpoint
processor.
Command
Description
Code Breakpoints
Opens the Code Breakpoints dialog.
Data Breakpoints
Opens the Memory Access Breakpoints dialog.
Version 1.1
Page 109 of 245
Error! Unknown document property name.User's Manual
Complex Breakpoints
& Tracer
Opens the Breakpoint Processor dialog.
Trace Start/Stop
Triggers
Opens the Trace Start/Stop Triggers dialog.
Clear All Breakpoints
Clears all breakpoints of all types. The breakpoints on memory write are
not cleared but disabled.
Also, this command clears the trace start/stop triggers.
The Code Breakpoints dialog
This dialog is for setting up and managing the code breakpoints. The dialog lists the existing breakpoints and the breakpoint ranges. It has the following buttons:
Element of dialog
Description
Add
Opens the Set Code Breakpoints Range dialog.
Clear
Opens the Clear Code Breakpoints Range dialog.
Clear Selected
Clears the breakpoints within the address range selected in the list.
Clear All
Clears all code breakpoints.
Set At
Opens the Set Breakpoints At dialog.
Show
Opens the Source window and the Disassembler window and displays
the source text corresponding to the address of the selected breakpoint.
Done
Closes the dialog box.
Note that you can also use the Source, Disassembler, Memory Layout, Code Browser and
Memory Coverage windows to quickly set and clear the code breakpoints. The Code Breakpoints
dialog is only useful, when you need to scan the list of the set breakpoints, to clear the selected
breakpoints or to work with the breakpoint ranges.
Version 1.1
Page 110 of 245
Error! Unknown document property name.User's Manual
The Set/Clear Code Breakpoints Range dialogs
Use these dialogs to specify the addresses, where to set up or clear a code breakpoint.
To specify an address range, you should specify the start and end addresses. To specify a single
address, specify the start address and leave the end address box empty. You can set the addresses by numbers, expressions or symbol names.
Element of dialog
Description
Start Address
Specifies the start address of the range.
End Address
Specifies the end address of the range (inclusive). If this field is left
empty, then the end address will be considered equal to the start address.
Symbols
Opens the Start Address for Code Breakpoint dialog with the list of
symbol names (the subroutine and function names, etc.).
The Set Breakpoints At dialog
With this dialog, you set the code breakpoints at all functions declared in one source file or at all
functions in all source files.
The Memory Access Breakpoints dialog
Use this dialog box to control the list of data breakpoints. You can add new breakpoints, remove,
enable and disable existing data breakpoints. The enabled breakpoint is a fully operational breakpoint. The disabled breakpoint is not cleared and you can enable it later. Enabling or disabling a
breakpoint means clearing or setting up the Disabled attribute of this breakpoint.
Version 1.1
Page 111 of 245
Error! Unknown document property name.User's Manual
Element of dialog
Description
Add
Opens the Break on Data Access dialog for you to set up the new
breakpoint.
Edit
Opens the Break on Data Access dialog for you to change parameters
of the selected breakpoint. Alternatively, double–click the breakpoint in
the list.
Done
Applies the changes and closes this dialog.
Enable
Enables the selected breakpoint.
Enable All
Enables all breakpoints in the list.
Disable
Disables the selected breakpoint.
Disable All
Disables all breakpoints in the list: sets the "Disabled" attribute for each
breakpoint.
Remove
Removes the selected breakpoint from the list.
Remove All
Removes all breakpoints from the list.
Note that CodeMaster disables (but not clears) all breakpoints after you restart the emulator or load
the configuration file. For more info, see Configuration Files.
The Break on Data Access dialog
This dialog is for setting up the data
breakpoints.
Version 1.1
Page 112 of 245
Error! Unknown document property name.User's Manual
Element of dialog
Description
Breakpoint Enabled
This flag switches checking of the breakpoint on/off without clearing it.
When you restart the emulator, the memory access breakpoints are not
cleared, but disabled.
Address Space for
Breakpoint
Specifies the data memory type for the breakpoint. The list depends on
the target microcontroller selected in the Hardware Configuration dialog.
Address
The start address, from which to trace access to the memory. The end
address is the sum of the start address and the number of bytes to
trace.
Symbols
Opens the Address dialog for you to specify the address in the form of
expression.
Number of Bytes to
Trace
The number of bytes to trace, beginning from the start address.
Access Type
Two flags (Read and Write) specify the type of memory access for this
data breakpoint. You can set up any one type or both at a time.
The Breakpoint Processor dialog
This dialog gives access to three related dialog boxes of the hardware breakpoint processor:
• Triggers T0..T3 Setup dialog. It configures the complex breakpoint trigger conditions, which
are used in the other two dialogs of these three. If you are setting the breakpoints for the first
time, you should begin with this dialog.
• Breakpoint Processor Control dialog. Use this dialog to setup the resultant complex breakpoint.
• Tracer Control dialog. Use this dialog to change the hardware tracer mode of data recording.
To get detailed information about an element of the Breakpoint Processor dialog box, click this
element in the figure below with the left mouse button.
Version 1.1
Page 113 of 245
Error! Unknown document property name.User's Manual
The Triggers T0..T3 Setup dialog
Use this dialog to set up the complex breakpoint triggers. Each tab corresponds to one trigger. All
tabs are identical.
Each tab has fields with individual boxes (bit boxes) for each bit of each parameter (condition).
There are duplicate fields (called Hex) for parameters, which are more than one bit long. Each text
box in the Hex field is for one nibble (half-byte).
With these fields, you can:
• Set up the parameter bit-wise. Click the necessary bit boxes in the field with the left mouse
button. Each box will successively switch between 0, 1 and Any (the box becomes gray, the
bit is masked). Number 0 or 1 means the bit will be compared with 0 or 1, respectively. If you
do not need to check a signal, set its bit to Any and this signal will be excluded from the condition.
• Set up the parameter hexadecimal value nibble-wise. Double-click the necessary nibble box
in the Hex field and enter the hexadecimal number (0..F) or character X, which stands for
Any. To move between the adjacent nibble boxes, use the Tab and Shift+Tab keys.
Also, you can enter the code address and data address as a symbol name, and the opcode
through its assembly mnemonic. For the code/data address, click the Symbols button and enter a
number or the symbol name used in your program (select from the list of names available). For the
opcode, click the Instruction button and enter the mnemonic.
To get description for an element in this dialog, click the element in the figure below. The tabs have
the following elements:
Version 1.1
Page 114 of 245
Error! Unknown document property name.User's Manual
Code/Xdata Address
The field for the 24-bit address bus value. Set up a condition by bits in the bit row, by nibbles in the
Hex field or immediately as a number or symbol name (with the Symbols button).
Opcode/Data
The field for the 8-bit value in the data bus (an opcode or operand, depending on the bus cycle
type). Set up a condition by bits in the bit row, by nibbles in the Hex field or immediately as an assembly mnemonic (with the Instruction button).
Internal Data Memory Address
The field for the 8-bit address. Set up a condition by bits in the bit row, by nibbles in the Hex field or
immediately as an assembly mnemonic (with the Symbols button).
Internal Data Memory Data
The field for the 8-bit direct data value. Set up a condition by bits in the bit row, by nibbles in the
Hex field. The tracer does not collect addresses and values of Idata.
External Inputs
The field for the external signals, which are obtained through the tracer cable. Set up a condition by
bits in the bit row or by nibbles in the Hex field.
Code/Xdata Bus Cycle
The radio button for the Code/Xdata bus cycle type. Any means that this parameter is excluded
from the condition.
Position
Description
Instruction fetch
The first cycle of the instruction, when a new opcode is being fetched.
Code Operand Fetch
Fetching an operand from the Code memory space.
Xdata Operand Read
Fetching an operand from the Xdata memory space.
Version 1.1
Page 115 of 245
Error! Unknown document property name.User's Manual
Xdata Operand Write
Writing data to the Xdata memory space.
MOVC Operand Fetch
Fetching the MOVC operand.
Interrupt Request
Interrupt request cycle.
Idle
Idle cycle.
Xdata R/W Cycle
The radio button to specify, which type of Xdata is accessed (read from or written to). Any means
that this parameter is excluded from the condition. Other options include XDATA, XRAM,
EEPROM, FLASH and XROW.
Internal Data Bus Cycle
The radio button to specify the cycle of the internal Data bus. Any excludes this parameter from the
condition.
DPTR Select
The radio button to specify the DPTR Select state. Any excludes this parameter from the condition.
State Bits
These flags specify the state and modes of the emulation microcontroller to be caught:
External Program Memory
The current instruction or MOVC operand is being fetched from the
external Code memory.
Idle Mode
The emulation MCU is in the Idle mode.
Power Down Mode
The emulation MCU is in the Power Down mode.
Reset Mode
The external RESET output is in the active state.
Internal Reset Mode
The internal MCU reset signal is in the active state. Not every POD
board features this signal.
Set Defaults
This button resets all conditions for this complex breakpoint trigger to Any. Use it before setting up
new conditions.
Legend
This area informs about which symbols designate 0, 1 and the Any state of the trigger bits.
The Breakpoint Processor Control dialog
There are two versions of this dialog box to provide easy and quick setup of the breakpoint processor.
• Breakpoint Processor: Simplified dialog. Use this dialog box, when a simple condition performed by any of the T0, T1, T2 and T3 breakpoint triggers suffice (see the Triggers T0..T3
Setup dialog).
Note that this dialog gives only restricted access to the breakpoint processor features and you
cannot set up a Complex Event condition and use it to control the tracer.
• Breakpoint Processor: Advanced dialog gives full access to the breakpoint processor functionality, including interaction between the T0, T1, T2 and T3 breakpoint triggers and the
Complex Event condition.
The Breakpoint Processor: Simplified dialog
This is the basic version of the Breakpoint Processor Control dialog. In this case, the breakpoint
processor sums outputs of all four breakpoint triggers (T0, T1, T2 and T3) with the 4-input OR logical unit, whose output is connected to the delay counter. So, each trigger, if enabled, contributes to
the resultant Complex Condition independently from other triggers. For general description, see
Hardware Breakpoint Processor.
To see description for an element of this dialog box, click the element in the figure below. This dialog has the following elements:
Version 1.1
Page 116 of 245
Error! Unknown document property name.User's Manual
Counters
To set up a counter, enter its initial value in the text box. The initial values may range from 1 to
65535 (for the event counter) and from 0 to 65535 (for the delay counter).
If the breakpoint processor stops emulation, every counter will automatically reset its initial value. If
emulation stops for any other reason, every counter will keep its current value and display it in its
Curr field.
Complex breakpoint trigger
The complex breakpoint trigger sends its output signal to the breakpoint processor. To set up the
complex triggers, use the Triggers T0..T3 Setup dialog.
Enable button
The Enable button connects the trigger output to (disconnects it from) the rest of the breakpoint
processor. To toggle, click it.
Event counter
The event counter counts the complex events identified by the complex breakpoint trigger.
Delay counter
The delay counter counts the delay of the BPP operation specified in the machine cycles.
Enable Break button
This Enable button (Enable Break) is the general switch for the breakpoint processor: when
closed, it enables BPP operation; when opened, it disables BPP. To toggle the button, click it.
Switching the breakpoint processor off does not cancel its other configuration settings. All of them
are saved in the configuration file (the project configuration file, if you are working with projects, or
in the *.opt file otherwise) and are reloaded for the next session. So, if you are going to use the current condition, which is set in the breakpoint processor, the next time you should only switch it on
with this button. All settings you specified earlier will be automatically reloaded.
Note. This switch controls only breaking the emulation and does not control the Complex Event,
which is used in the tracer operation modes.
Stop signal
The emulation stop signal as a result of the breakpoint processor operation.
Advanced button
The Advanced button switches the dialog to the Breakpoint Processor: Advanced dialog.
Version 1.1
Page 117 of 245
Error! Unknown document property name.User's Manual
The Breakpoint Processor: Advanced dialog
This is the full version of the Breakpoint Processor Control dialog. For general description, see
Hardware Breakpoint Processor.
To see description for an element of this dialog box, click the element in the figure below. This dialog has the following elements:
In this dialog, the Enable buttons for triggers T1..T3 differ from that for trigger T0. With the advanced Enable buttons, you can set the 4-level combined condition maximum. To do this, enable
trigger T0 and switch the buttons for the T1, T2 and T3 triggers to the AND configuration. Also, set
the respective adjustable logic elements to AND.
Use the Tracer Overflow signal, when you need to fill the trace buffer without overflow and to analyze the its contents later.
Enable T0 button
The Enable T0 button is a conventional Enable button. It connects the T0 trigger output to (disconnects it from) the rest of the breakpoint processor. To toggle, click it.
Enable T1..T3 button
The Enable T1..T3 button is an advanced Enable button. In addition to the two states of conventional Enable button, it has the third state as the logical AND element. This element performs conjunction of the complex breakpoint trigger output and the previous condition (performed by the elements pictured above in the dialog). In this case, you can create combined breakpoint conditions.
For example, if such configuration is set up for T2, then its output will be enabled, if the condition
for T1 is true.
To toggle, click the button.
Adjustable logic element
This adjustable logic element performs either logical OR function, or AND function. To toggle it between these two options, click the element with the left mouse button.
Complex Event
The adjustable logic element called Complex Event combines all configurations of the T0..T3 triggers and forms the resultant condition (the Complex Event). The element performs either logical
OR function, or AND function. To toggle, click it.
Version 1.1
Page 118 of 245
Error! Unknown document property name.User's Manual
Final logic element
The last adjustable logic element (the Final logic element) in the breakpoint processor logic circuit.
It combines the Complex Event output and the Tracer Overflow signal. This element output has
four configurations:
• transit of the Complex Event signal;
• transit of the Tracer Overflow signal;
• logical OR function: Complex Event OR Tracer Overflow;
• logical AND function: Complex Event AND Tracer Overflow.
To toggle between the configurations, click the element.
Tracer Overflow
The Tracer Overflow signal indicates that trace buffer address counter has overflowed. For more
info about this signal, see Hardware Tracer.
Simplified button
The Simplified button switches the dialog to the Breakpoint Processor: Simplified dialog.
The Tracer Control dialog
Use this dialog box to choose the mode for the hardware tracer to record the tracer frames. There
are four modes available, which differ by their start and stop conditions:
• Synchronous (Program Start/Program Stop);
• Backward (Program Start/Complex Event);
• Forward (Complex Event/Tracer Overflow);
• Dynamic (Trace Start/Stop Triggers).
To get description for the mode related with an element of this dialog, click the element in the figure
below.
To set up the Dynamic mode, in most cases you will set and clear the trace start/stop triggers immediately from the Source window or the Disassembler window. You can set up the Dynamic
mode using this dialog as well. However most likely, the radio button positions for the trace
start/stop triggers will be useful just to indicate the current mode of the tracer.
Starting or stopping the tracer does not break running the program.
Synchronous mode (Program Start/Program Stop)
This is the default mode. In this mode, the tracer starts simultaneously with the start of your program and stops simultaneously with its stop.
Version 1.1
Page 119 of 245
Error! Unknown document property name.User's Manual
Backward Tracing mode (Program Start/Complex Event)
In this mode, the tracer starts simultaneously with the user program starts. Later, if the complex
event conditions specified in the Breakpoint Processor: Advanced dialog become true, the hardware breakpoint processor will tell the tracer to stop writing the frames. In this case, the trace buffer
keeps data collected before a particular event happened.
Otherwise, the tracer will go on recording the frames until the user program stops.
This mode may be useful, for example, for investigation of continuous processes, which shall not
be stopped at the moment the event of interest occurs.
Forward Tracing mode (Complex Event/Tracer Overflow)
In the Forward Tracing mode, the tracer starts on the moment the breakpoint processor identifies
the complex event, and stops on the trace buffer overflow (when the Tracer Overflow signal appears). The trace buffer keeps data collected just after a particular event happened.
For example, it may be useful for investigation of continuous processes that do not allow stopping
the user program right after the particular event occurred.
Dynamic Tracing mode (Trace Start/Stop Triggers)
The Dynamic Tracing mode helps to select data to be written in the trace buffer and to use the
trace buffer more effectively. The tracing is on from the moment the program reaches the instruction, on whose address the trace start trigger is set up, to the moment the program reaches the instruction, on whose address the trace stop trigger is set up.
To enable the Dynamic mode, set up at least one trace start or trace stop trigger. Once the triggers
are set up, the Dynamic mode is enabled regardless of the current settings in the Tracer Control
dialog.
To disable the Dynamic mode, clear all trace start/stop triggers. Once you disable the last trigger,
the hardware tracer restores its control mode settings it had before switching to the Dynamic mode.
For more info, see Trace Start/Stop Triggers.
The Trace Start/Stop Triggers dialog
This dialog serves for setting up and clearing the trace start/stop triggers and lists the set triggers
and the trigger ranges.
Element of dialog
Description
Add
Opens the Trace Start/Stop Trigger Setup dialog, where you specify
the address and parameters for the selected trace start/stop trigger.
Clear Selected
Clears the chosen trigger (removes it from the list).
Clear All
Clears all trace start/stop triggers.
Version 1.1
Page 120 of 245
Error! Unknown document property name.User's Manual
Show
Displays the source text and disassembler for the selected trigger.
Done
Closes the dialog box.
Note that you can also use the Source window and the Disassembler window to quickly set up or
clear the trace start/stop triggers. The Trace Start/Stop Triggers dialog box is only useful, if you
need to scan the list of set triggers, to clear the selected triggers, and to work with the trigger
ranges.
The Trace Start/Stop Trigger Setup dialog
This dialog is for setting up parameters of selected trace start/stop trigger.
Element of dialog
Description
Trace Trigger Address
Specifies the code address for the trace trigger. You can type an absolute value, name of C function, an assembly label name or an expression or take a recent value from the drop-down list.
Symbols
Opens the Trace Trigger Address dialog for you to choose the trigger
address from the list of symbols.
Trace Trigger Action
Specifies the type of trigger: Start Trace is for the trace start trigger;
Stop Trace is for the stop trigger.
The Configure menu
This menu gives access to all configuration dialogs and all configuration parameters in the application.
Button
Version 1.1
Command
Description
Debug Options
Opens the Debug Options dialog.
Hardware Configuration
Opens the Hardware Configuration dialog.
Environment
Opens the Environment dialog with five tabs: the Fonts tab,
the Colors tab, the Key Mappings tab, the Toolbar tab and
the Misc tab.
Editor Options
Opens the Editor Options dialog (the General tab and the
Keymap tab).
Page 121 of 245
Error! Unknown document property name.User's Manual
The Debug Options dialog
This dialog sets up the options for debugging.
Element of dialog
Description
Execute C Startup
Code
When on, specifies that the startup code will be executed after a C program is loaded. In fact, it is not interesting to debug the startup code
and usually the startup module has no debug information. When this
option is enabled, the program stops at the first high–level language
operator that has the symbol information (see Preparing Programs for
Source-level Debugging).
Reset MCU
When on, specifies to reset the emulation microcontroller over the RST
pin after loading the program.
Reset Time Counter
When on, specifies to reset the Execution Time counter (the real-time
timer) after the program is loaded. For more about the timer, see Realtime Timer and Frequency Measuring System and Execution Time
window.
Clear All Breakpoints
Specifies to clear all breakpoints of all types upon loading the program.
Run Script
Enables executing a script file specified in the text box. Use the Browse
button to locate the script file.
Case Sensitive
Symbols
When on, specifies to not distinguish between the uppercase and lowercase letters in the names of variables used in the Watches window,
the AutoWatches window, the Inspector window and other windows.
Note that some assemblers are case-insensitive on their own and when
debugging programs built with these assemblers, PICE always consider
uppercase and lowercase letters being the same (ignores this flag).
Keep Duplicate
Source Lines
Regulates the tracking of source text. For more about this option, see
Keeping Duplicate Source Lines.
Do not Reset Symbol Debug Information When Loading
File to Non–Code
Specifies to not reset the symbol debug information when loading a
data file into memory spaces other than the Code space.
Version 1.1
Page 122 of 245
Error! Unknown document property name.User's Manual
Memory
Load Last Program
at Start-up
Specifies to load the last program file you debugged using PICE as a
debugger for an external development kit.
Numbers are Zero–
padded
Specifies to keep the leading zeroes, when displaying values in the
Watches, AutoWatches or Inspector windows.
Assembly–Style Hex
Numbers
Specifies to display the hexadecimal numbers in the Watches,
AutoWatches or Inspector windows using the assembly language
style (with 'h' in the end). When this flag is off, the hexadecimal numbers are displayed in the C language format (with the '0x' prefix).
Display Char Arrays
as Strings
Specifies to display 'char' and 'unsigned char' arrays in the Watches,
AutoWatches or Inspector windows as strings in the C language format, ignoring the format that is set for the window. Turn this option on, if
your program intensively operates with the ASCII strings.
Stop Display on
Terminating Zero
When on, specifies to not display the rest of the text string after the zero
character, if any.
Short Types Display
Specifies to display variable types in the Watches window, the
AutoWatches window or the Inspector window in the brief format.
Usually, the types are displayed with two words, for example, 'unsigned
int' or 'signed char'. In the short format, it will be 'uint' and 'char', respectively.
Do not Display
Types
When on, the types of objects are not displayed in the Watches,
AutoWatches or Inspector windows. Only names and values of objects are displayed.
Additional Path for
Source Files
Sets the additional list of directories, where to search for source files to
be opened in the Source window. You can specify multiple directories
separated by semicolons or comma.
The directories from this list are searched only if some source file is not
found in the directory, where it is supposed to be, or if the source file
name does not contain the path.
Note. The newly specified directories will be searched next time the
program is loaded.
Keeping Duplicate Source Lines
Compilers of almost all types generate symbol information that establishes correspondence between the code addresses and source line numbers. Some compilers generate multiple records for
the same code address, but with different line numbers. This often occurs, when the compiler handles the function entry as in the following example:
void main()
{
char a = 0;
//
//
//
//
If no code is generated for the function prolog,
then all these lines will have the same address
and some compilers will generate multiple records
for that address.
...
Now suppose that the program stopped at this address. When displaying the source text in the
Source window, the debugger should highlight the line that corresponds to the current Program
Counter value. Now it finds out that there are three such lines and highlights them all. Sometimes,
this does not look good and nevertheless, contains useful information (no code generated for the
prolog).
When the Keep Duplicate Source Lines flag is off (in the Debug Options dialog), PICE will leave
only one record for each address of code (the line with the largest ordinal number). In the example
above, this will be the line with text "char a = 0;".
Version 1.1
Page 123 of 245
Error! Unknown document property name.User's Manual
The Hardware Configuration dialog
Use this dialog box to set up the emulator hardware configuration. The left panel displays the configuration groups. Click a group and the right panel will display parameters of this group.
Emulator Components group
Emulation MCU Power Management group
External Clock Generator group
Fuses group
Emulation MCU Options group
XRAM Shadowing group
Memory Map group
Target Code Memory group (PR1-52-DS400)
Memory Coverage group
Banking group
The Emulator Components group
The emulator hardware automatically identifies the type of POD, emulation microcontroller and
adapter after the power is turned on. The POD, Emulation MCU and Adapter fields are for information only: for you to make sure that the PICE hardware configuration corresponds to your target
hardware. The Target Chip box lists the names of microcontrollers available for emulation with the
connected pair of POD and adapter. Use this box to choose the microcontroller type you need.
The target MCU chip is supported with restrictions. For more info, see Restrictions of PICE-52 and
Special Considerations.
To access the full list of microcontrollers supported by PICE, you need the standalone mode. For
more about the standalone mode, see Scenarios of Use.
Version 1.1
Page 124 of 245
Error! Unknown document property name.User's Manual
The Emulation MCU Power Management group
In this group, the radio button switches two operating modes of the built-in power regulator:
1) Follow Target Board Voltage. This is the default mode for the regulator, when PICE is powered for the first time.
2) User-Specified Value. In this mode, you directly specify the microcontroller supply voltage in
the text box on the right.
The Current Measured Voltages area displays the latest values measured by own voltmeter of
the voltage regulator. Use this information to inspect accuracy of the hardware configuration of your
target and the emulator.
For more about the regulator and its modes, see Managing the Emulation MCU Power.
The External Clock Generator group
This dialog is the only place, where to switch between the two sources of external clock signal:
• Emulator Internal selects own programmable generator of the emulator. You can set up its
frequency stepwise, with a step of 1 kHz. To do this, specify the clock frequency in kHz in the
Frequency box.
• From the Target Board selects the generator installed on the target board. With this option,
PICE connects the XTAL1 pin of the emulation microcontroller directly to the same pin of the
adapter. For more about related special considerations, see External Clock.
The Current Measured Frequency panel displays the current measured frequency applied to the
XTAL1 pin of the emulation microcontroller. The accuracy of measurement is 0.1%.
This group produces no effect on the emulation microcontroller internal generator, if any.
The Fuses group
The contents of this group depend on the selected target microcontroller. PICE-52 provides two
dialogs for this group:
The Fuses group (PR1-52-PLP/76x)
The Fuses group (PR1-52-PLP1/93x)
Version 1.1
Page 125 of 245
Error! Unknown document property name.User's Manual
The Fuses group (PR1-52-PLP/76x)
This group controls the so-called fuses (configuration bits) of the emulation microcontroller. These
bits are equivalents of the same fuses of the target microcontroller. If the selected target microcontroller does not support some of these parameters, they appear unavailable in the dialog.
Element of dialog
Description
Watchdog Timer Enabled
When on, corresponds to ‘1’ in the WDTE bit (UCFG1.7).
Otherwise, WDTE = ‘0’.
Reset Pin Function
Enabled
When on, corresponds to ‘0’ in the RPD bit (UCFG1.6).
Otherwise, RPD = ‘1’.
Ports Level After Reset
Sets the default level of signals at the port pins after reset.
High corresponds to ‘1’ in the PRHI bit (UCFG1.5).
Low corresponds to ‘0’ in PRHI.
Enable Brownout at
Sets the voltage threshold for the Brownout Detect function (note 1 below).
2.5 V corresponds to ‘1’ in the BO2.5 bit (UCFG1.4).
3.8 V corresponds to ‘0’ in BO2.5.
Clock Type
Clocks per Machine
Cycle
Selects the type of clock. Also, see note 2 below.
Sets amount of clocks per cycle:
6 clocks corresponds to ‘1’ in the CLKR bit (UCFG1.3).
12 clocks corresponds to ‘0’ in CLKR.
Notes
1. For more about the Brownout Detect function, see Restrictions of PR1-52-PLP/76x and Special Considerations.
2. Positions of the Clock Type radio button correspond to the following values in FOSC[2..0]
(UCFG1.[2..0]):
External
Internal RC
Low Frequency Crystal
Med Frequency Crystal
High Frequency Crystal
— 111b;
— 011b;
— 010b;
— 001b;
— 000b.
The Fuses group (PR1-52-PLP1/93x)
This group controls the so-called fuses (configuration bits) of the emulation microcontroller. These
bits are equivalents of the same fuses of the target microcontroller. If the selected target microcontroller does not support some of these parameters, they appear unavailable in the dialog.
Version 1.1
Page 126 of 245
Error! Unknown document property name.User's Manual
Element of dialog
Description
Watchdog Timer Enabled
When on, corresponds to ‘1’ in the WDTE bit (UCFG1.7).
Otherwise, WDTE = ‘0’.
Watchdog Safety Enable Bit
When on, corresponds to ‘1’ in the WDSE bit (UCFG1.4).
Otherwise, WDSE = ‘0’.
Reset Pin Function
Enabled
When on, corresponds to ‘0’ in the RPD bit (UCFG1.6).
Otherwise, RPD = ‘1’.
Brownout Detect Enable
When on, corresponds to ‘1’ in the BOE (UCFG1.5).
Otherwise, BOE = ‘0’ (the Brownout Detect function is off; see note 1
below).
Clock Type
Selects the type of clock. Also, see note 2 below.
Boot Status
Toggles between two options for the start address:
Start From Zero Address corresponds to ‘0’ in BSB (BOOTSTAT.0).
Use Boot Vector corresponds to BSB = ‘1’.
Boot Vector
Specifies the new value for BOOTVEC. The allowable interval of values
depends on the target microcontroller selected.
Notes
1. For more about the Brownout Detect function, see Brownout Detect.
2. Positions of the Clock Type radio button correspond to the following values in FOSC[2..0]
(UCFG1.[2..0]):
External
Internal RC
Low Frequency Crystal
Med Frequency Crystal
High Frequency Crystal
— 111b;
— 011b;
— 010b;
— 001b;
— 000b.
The Emulation MCU Options group
The contents of this group depend on the selected target microcontroller. PICE-52 provides six dialogs for this group:
The Emulation MCU Options group (PR1-52-Axx)
The Emulation MCU Options group (PR1-52-W77)
The Emulation MCU Options group (PR1-52-PLP/76x)
The Emulation MCU Options group (PR1-52-PLP1/93x)
Version 1.1
Page 127 of 245
Error! Unknown document property name.User's Manual
The Emulation MCU Options group (PR1-52-DS450)
The Emulation MCU Options group (PR1-52-DS400)
The Emulation MCU Options group (PR1-52-MIC0)
The Emulation MCU Options group (PR1-52-Axx)
This group contains miscellaneous configuration options. For example, for POD PR1-52-ARX/ID2
and target microcontroller as Intel 80C51, this group looks as follows (the parameters not supported by the target microcontroller appear not available):
Element of dialog
Description
Reset Address
Specifies the start address, when the target microcontroller supports
this feature. For more about non-zero reset addresses, see FLASH
Boot Loader and In-Application-Programming.
Use P3.6, P3.7 Pins
as
Sets the operating mode of pins P3.6 and P3.7. Also, see note 1 below.
Disable On-chip ROM
Switches off/on the internal Code memory of the emulation microcontroller.
Freeze in Break Mode
Flags of this area turn on/off freezing their corresponding peripheral devices (Timer 0, Timer 1, etc.) in the break mode. For more info, see
Freezing the Peripherals (PR1-52-Axx).
Enable RESET from
the Target
When this flag is on, the hardware reset (RESET) signal passes from
the target board to the emulation microcontroller input.
Use this option only in case of necessity: possible electrical interference
in the RESET circuit negatively reflects on stability of system behavior.
In case the RESET signal is used, take measures to prevent noise in
this circuit.
Allow Reading of
Trace Buffer at Runtime
When this flag is on, the PICE software can read the trace buffer contents and update information in the Tracer window in the real-time
mode without breaking the emulation. Also, see note 2 below.
Notes
1. For more about operation of P3.6, P3.7 pins, see the paragraph on deviation of time responses in Restrictions of PR1-52-Axx and Special Considerations.
2. When reading the trace buffer contents, the writing of new information into the tracer is disabled in order to ensure continuity of the information being read from the tracer. Usually it can
be ignored, because the time interval between the last readout from the buffer and the halt is
sufficient for full update of the Trace buffer. However, if the Tracer is controlled by the hardware breakpoint processor, then some frames may be missed. In this case, you can disable
reading the trace buffer during emulation.
The Allow Reading of Trace Buffer at Run-time flag is equivalent to the same flag in the
Tracer Window Setup dialog. For more about reading the trace buffer, see Hardware Tracer.
Version 1.1
Page 128 of 245
Error! Unknown document property name.User's Manual
The Emulation MCU Options group (PR1-52-W77)
This group contains miscellaneous configuration options of the emulator.
Element of dialog
Description
Use P3.6, P3.7 Pins
as
Sets the operating mode of pins P3.6 and P3.7. Also, see note 1 below.
Enable On-chip
ROM
When on, enables the on-chip Code ROM. If your target microcontroller
does not have this type of memory, the flag will be not available.
Enable RESET from
the Target
When this flag is on, the hardware reset (RESET) signal passes from
the target board to the emulation microcontroller input.
Use this option only in case of necessity: possible electrical interference
in the RESET circuit negatively reflects on stability of system behavior.
In case the RESET signal is used, take measures to prevent noise in
this circuit.
Allow Reading of
Trace Buffer at Runtime
When this flag is on, the PICE software can read the trace buffer contents and update information in the Tracer window in the real-time
mode without breaking the emulation. Also, see note 2 below.
Notes
1. For more about operation of P3.6, P3.7 pins, see the paragraph on deviation of time responses in Restrictions of PR1-52-W77 and Special Considerations.
2. When reading the trace buffer contents, the writing of new information into the tracer is disabled in order to ensure continuity of the information being read from the tracer. Usually it can
be ignored, because the time interval between the last readout from the buffer and the halt is
sufficient for full update of the Trace buffer. However, if the Tracer is controlled by the hardware breakpoint processor, then some frames may be missed. In this case, you can disable
reading the trace buffer during emulation.
The Allow Reading of Trace Buffer at Run-time flag is equivalent to the same flag in the
Tracer Window Setup dialog. For more about reading the trace buffer, see Hardware Tracer.
The Emulation MCU Options group (PR1-52-PLP/76x)
This group contains miscellaneous configuration options of the emulator.
Element of dialog
Description
Enable RESET from
the Target Board
When this flag is on, the hardware reset (RESET) signal passes from
the target board to the emulation microcontroller input.
Version 1.1
Page 129 of 245
Error! Unknown document property name.User's Manual
Use this option only in case of necessity: possible electrical interference
in the RESET circuit negatively reflects on stability of system behavior.
In case the RESET signal is used, take measures to prevent noise in
this circuit.
Allow Reading of
Trace Buffer at Runtime
When this flag is on, the PICE software can read the trace buffer contents and update information in the Tracer window in the real-time
mode without breaking the emulation. Also, see note below.
Note. When reading the trace buffer contents, the writing of new information into the tracer is disabled in order to ensure continuity of the information being read from the tracer. Usually it can be
ignored, because the time interval between the last readout from the buffer and the halt is sufficient
for full update of the Trace buffer. However, if the Tracer is controlled by the hardware breakpoint
processor, then some frames may be missed. In this case, you can disable reading the trace buffer
during emulation.
The Allow Reading of Trace Buffer at Run-time flag is equivalent to the same flag in the Tracer
Window Setup dialog. For more about reading the trace buffer, see Hardware Tracer.
The Emulation MCU Options group (PR1-52-PLP1/93x)
This group contains miscellaneous configuration options of the emulator.
Element of dialog
Description
Enable RESET from
the Target Board
When this flag is on, the hardware reset (RESET) signal passes from
the target board to the emulation microcontroller input.
Use this option only in case of necessity: possible electrical interference
in the RESET circuit negatively reflects on stability of system behavior.
In case the RESET signal is used, take measures to prevent noise in
this circuit.
Allow Reading of
Trace Buffer at Runtime
When this flag is on, the PICE software can read the trace buffer contents and update information in the Tracer window in the real-time
mode without breaking the emulation. Also, see note below.
Freeze CCU in Break
Mode
Turns on/off freezing the Capture/Compare Unit in the break mode.
Freeze in Break Mode
The flags turn on/off freezing the corresponding devices in the break
mode.
Note. When reading the trace buffer contents, the writing of new information into the tracer is disabled in order to ensure continuity of the information being read from the tracer. Usually it can be
ignored, because the time interval between the last readout from the buffer and the halt is sufficient
for full update of the Trace buffer. However, if the Tracer is controlled by the hardware breakpoint
processor, then some frames may be missed. In this case, you can disable reading the trace buffer
during emulation.
The Allow Reading of Trace Buffer at Run-time flag is equivalent to the same flag in the Tracer
Window Setup dialog. For more about reading the trace buffer, see Hardware Tracer.
Version 1.1
Page 130 of 245
Error! Unknown document property name.User's Manual
The Emulation MCU Options group (PR1-52-DS450)
This group contains miscellaneous configuration options of the emulator.
Element of dialog
Description
Use P3.6, P3.7 Pins
as
Sets the operating mode of pins P3.6 and P3.7. Also, see note 1 below.
Enable On-chip
ROM
When on, enables the on-chip Code ROM. If your target microcontroller
does not have this type of memory, the flag will be not available.
Enable RESET from
the Target
When this flag is on, the hardware reset (RESET) signal passes from
the target board to the emulation microcontroller input.
Use this option only in case of necessity: possible electrical interference
in the RESET circuit negatively reflects on stability of system behavior.
In case the RESET signal is used, take measures to prevent noise in
this circuit.
Allow Reading of
Trace Buffer at Runtime
When this flag is on, the PICE software can read the trace buffer contents and update information in the Tracer window in the real-time
mode without breaking the emulation. Also, see note 2 below.
Disable Interrupts
During High-level
Step
When on, specifies to clear the EA bit before executing every low-level
instruction during the high-level step.
Disable Access to
Off-chip Xdata in
Break Mode
When on, prohibits the emulator in the break mode from accessing the
external Xdata memory. For more info, see Using Ports P0 and P2 for
GPIO (PR1-52-DS450).
Notes
1. For more about operation of P3.6, P3.7 pins, see the paragraph on deviation of time responses in Restrictions of PR1-52-DS450 and Special Considerations.
2. When reading the trace buffer contents, the writing of new information into the tracer is disabled in order to ensure continuity of the information being read from the tracer. Usually it can
be ignored, because the time interval between the last readout from the buffer and the halt is
sufficient for full update of the Trace buffer. However, if the Tracer is controlled by the hardware breakpoint processor, then some frames may be missed. In this case, you can disable
reading the trace buffer during emulation.
The Allow Reading of Trace Buffer at Run-time flag is equivalent to the same flag in the
Tracer Window Setup dialog. For more about reading the trace buffer, see Hardware Tracer.
The Emulation MCU Options group (PR1-52-DS400)
This group contains miscellaneous configuration options of the emulator.
Version 1.1
Page 131 of 245
Error! Unknown document property name.User's Manual
Element of dialog
Description
Use P3.6, P3.7 Pins
as
Sets the operating mode of pins P3.6 and P3.7. Also, see note 1 below.
Enable Multiplexed
Mode
When this flag is on, the emulator applies the imitated MUX signal at
the emulation microcontroller (enables the multiplexed mode of the
bus). Is set up by default.
Enable On-chip
ROM
When on, enables the on-chip Code ROM. If your target microcontroller
does not have this type of memory, the flag will be not available.
The emulator does not use the real MUX signal from the target board.
Enable RESET from
the Target
When this flag is on, the hardware reset (RESET) signal passes from
the target board to the emulation microcontroller input.
Use this option only in case of necessity: possible electrical interference
in the RESET circuit negatively reflects on stability of system behavior.
In case the RESET signal is used, take measures to prevent noise in
this circuit.
Allow Reading of
Trace Buffer at Runtime
When this flag is on, the PICE software can read the trace buffer contents and update information in the Tracer window in the real-time
mode without breaking the emulation. Also, see note 2 below.
Notes
1. For more about operation of P3.6, P3.7 pins, see the paragraph on deviation of time responses in Restrictions of PR1-52-DS400 and Special Considerations.
2. When reading the trace buffer contents, the writing of new information into the tracer is disabled in order to ensure continuity of the information being read from the tracer. Usually it can
be ignored, because the time interval between the last readout from the buffer and the halt is
sufficient for full update of the Trace buffer. However, if the Tracer is controlled by the hardware breakpoint processor, then some frames may be missed. In this case, you can disable
reading the trace buffer during emulation.
The Allow Reading of Trace Buffer at Run-time flag is equivalent to the same flag in the
Tracer Window Setup dialog. For more about reading the trace buffer, see Hardware Tracer.
The Emulation MCU Options group (PR1-52-MIC0)
This group contains miscellaneous configuration options of the emulator.
Version 1.1
Page 132 of 245
Error! Unknown document property name.User's Manual
Element of dialog
On-chip ROM
Enable RESET from
the Target
Description
Selects an option for emulating the Code memory: 256 Kb or 128 Kb of
on-chip Code memory or up to 1 Mb of external memory (if Disabled).
Also, see note 1 below.
When this flag is on, the hardware reset (RESET) signal passes from
the target board to the emulation microcontroller input.
Use this option only in case of necessity: possible electrical interference
in the RESET circuit negatively reflects on stability of system behavior.
In case the RESET signal is used, take measures to prevent noise in
this circuit.
Allow Reading of
Trace Buffer at Runtime
When this flag is on, the PICE software can read the trace buffer contents and update information in the Tracer window in the real-time
mode without breaking the emulation. Also, see note 2 below.
Notes
1. When On-chip ROM is set to 256 K or 128 K, the emulator considers the whole memory is internal (both the Code memory and Xdata memory). When there is such situation in the regular
microcontroller, the microcontroller does not output external signals PSENQ, RDQ and WRQ.
That is why, in this case, the emulator does not pass signals PSENQ, RDQ and WRQ, which
the microcontroller outputs, through to the target device and ignores the settings of the Memory Map group of this dialog.
2. When reading the trace buffer contents, the writing of new information into the tracer is disabled in order to ensure continuity of the information being read from the tracer. Usually it can
be ignored, because the time interval between the last readout from the buffer and the halt is
sufficient for full update of the Trace buffer. However, if the Tracer is controlled by the hardware breakpoint processor, then some frames may be missed. In this case, you can disable
reading the trace buffer during emulation.
The Allow Reading of Trace Buffer at Run-time flag is equivalent to the same flag in the
Tracer Window Setup dialog. For more about reading the trace buffer, see Hardware Tracer.
The XRAM Shadowing group
Elements of this group tell the emulator the parameters of XRAM of the Micronas microcontroller,
which the user program supposedly uses. This group is present in the dialog only when the emulator works together with the PR1-52-MIC0 POD board.
Element of dialog
Description
Enable XRAM Shadowing
Turns on the shadow copy of XRAM. Is cleared by default.
When on, other two parameters of this group are available.
XRAM Location
Specifies the used area of mapped XRAM within bank 0 of the Xdata
memory space.
XRAM Mapped to
Upper Banks
Turns on mapping the shadow copy to upper banks (beginning from the
first one) of the emulator memory.
Version 1.1
Page 133 of 245
Error! Unknown document property name.User's Manual
You should not set up the Enable XRAM Shadowing flag, if during operation, your program
changes the parameters of XRAM location. For more about specifics of using the elements of this
group, see Observing the Contents of XDATA Memory in Real Time.
If you decide to set up the Enable XRAM Shadowing flag, then by the moment the first MOVX instruction of your program is executed, the values in the XRAM Location list and the XRAM
Mapped to Upper Banks flag shall be exactly equal to those of the TWENTY, NOMAP and BOTTOM bits of register MEMCON, as given in two tables below:
TWENTY
BOTTOM
0
0
0xC000..0xFFFF (16 K)
0
1
0x4000..0x7FFF (16 K)
1
0
0xB000..0xFFFF (20 K)
1
1
0x3000..0x7FFF (20 K)
NOMAP
XRAM Location
XRAM Mapped to Upper Banks
0
The flag is set up
1
The flag is cleared
The Memory Map group
This group of the Hardware Configuration dialog gives you total control over all memory map
schemes and their parameters. The dialog displays this group only when the selected target microcontroller can work with external memory.
The Memory Map Scheme area allows you to save and load any scheme of the memory map
schemes known to the emulator. Each scheme contains all settings of this dialog. When you select
a specific memory map scheme in the drop-down list, the dialog loads the selected map and lists its
memory ranges in the Existing Ranges list box.
PICE will not carry out the map ranges for the Code memory, which correspond to the internal
Code memory interval, when the microcontroller internal memory is enabled (the Disable On-Chip
ROM flag is off). However, if you disable it next time, these map ranges will take effect automatically.
To select a range, click its name with the mouse left button. The information panel on the right displays parameters of the selected range.
Version 1.1
Page 134 of 245
Error! Unknown document property name.User's Manual
Element of dialog
Description
Add
In the Memory Map Scheme area: opens the Create New Memory
Map Scheme dialog with the history list of schemes.
In the Existing Ranges area: opens the Edit Map Range dialog for you
to create a new address range for the selected scheme.
Copy
Opens the Copy Memory Map Scheme dialog for copying the selected
scheme to the new one (with different name) in the list of schemes. This
feature is useful, when you need to create new scheme similar to the
selected one.
Rename
Opens the Rename Memory Map Scheme dialog for renaming the selected scheme.
Delete
In the Memory Map Scheme area: deletes the selected scheme from
the list of schemes.
Note. At least one memory map scheme must always exist. If only one
scheme is there in the list, you cannot delete it.
In the Existing Ranges area: deletes the selected address range from
the scheme.
Edit
Opens the Edit Map Range dialog for the selected address range.
Note. When the emulator starts, it uses the Preset range to initialize the
default memory map. That is why, you cannot edit this range.
Enable External
Memory Shadowing
Enables the shadow copies of memory for all memory ranges mapped
to the target device.
The ranges mapped to the emulator do not need the shadow copies
and the emulator hardware ignores this flag for such ranges.
The Edit Map Range dialog
This dialog allows you to create a new range or edit the selected address range options.
Element of dialog
Specifies
Range Name
The address range name in the map. Enter the name here or use the
default name offered by PICE.
Address Range
The start and end addresses of the range.
The start address must be a multiple of 512. For example: 0, 200h,
4000h, 8400h, etc.
Version 1.1
Page 135 of 245
Error! Unknown document property name.User's Manual
The end address must be a multiple of 512 minus 1. For example:
1FFh, 1FFFh, 201FFH, etc.
Memory Type
Specifies the memory type for the range. You can select only one type
or both types together (to set up the combined memory range). Also,
see note below.
Map Range to
Specifies where to map the range. Also, see the paragraph below.
Note
Contains messages or warnings related with this range, if any.
Note. The Code & Xdata option of the Memory Type radio button specifies one address range,
which is equivalent to two ranges with the same addresses, where one of them is in the Code
memory and the other one is in the Xdata memory.
This option is convenient for the cases, when the whole Code and Xdata memory reside in the
emulator or in the target device.
Another purpose of this option is to specify a memory range on the target device as being of the
combined type.
The “Map Range to” options
• Emulator, Code & Xdata separate
Maps this address range to the emulator. If you set the memory type to Code & Xdata, the
Code memory range will be separated from (does not overlay) the Xdata memory range.
• Emulator, Code & Xdata combined
Maps two address ranges (Code and Xdata) to one range of the combined type in the emulator. Within this range, the Code memory overlays the Xdata memory.
ATTENTION: This option automatically applies to both Code and Xdata memory and discards
the Memory Type settings other than Code & Xdata.
• Target
Allocates the address range to the target board. In this case, the emulator will access the
memory installed on the target board. Keep in mind that PICE cannot configure the target device memory or identify its type.
That is why, when you need to map one range of combined memory to the target device, which
carries a piece of the combined memory, you should set the type of memory for this range to Code
& Xdata. Otherwise, the emulator will map only the memory range with the specified type and will
map the corresponding memory range of the second type in this pair in accordance with the previous ranges of the memory map.
For example, if your target board carries memory of the combined type within the interval from
30000h to 3FFFFh and when mapping the range to it you set the memory type to Code, the emulator will map the range within only the Code memory space. The corresponding Xdata memory
range will remain mapped in accordance with the previous ranges in the map.
For more about the combined memory, see Code Memory.
The Target Code Memory group (PR1-52-DS400)
The IDE Can Program Target Code Memory flag, when on, permits the emulator to write to the
target board Code memory, which is built using the static RAM memory modules. Disabled by default.
Subgroups of this group specify options of the target board memory schematics:
The Extended Address Generation group (PR1-52-DS400)
The Chip-Enable Generation group (PR1-52-DS400)
The Extended Address Generation group (PR1-52-DS400)
This group specifies the memory volume of the memory chips used in the target board, for the
emulator to correctly control the target memory. Also, displays reference info about the memory
chip maximum volume available when using single (any) signal CEi.
Version 1.1
Page 136 of 245
Error! Unknown document property name.User's Manual
The emulator uses this parameter only when the user program is stopped and only when writing to
the target board Code memory.
The Chip-Enable Generation group (PR1-52-DS400)
This group specifies which set of signals CEi corresponds to the memory schematic of the target
board, for the emulator to correctly control the target memory.
The emulator uses this parameter only when the user program is stopped and only when writing to
the target board Code memory.
The Memory Coverage group
This group of the Hardware Configuration dialog controls the mode of operation of the Memory
Coverage window.
Version 1.1
Page 137 of 245
Error! Unknown document property name.User's Manual
Element of dialog
Description
Memory Coverage
Operation Mode
Switches the modes of Memory Coverage. With the Memory Access
Coverage option, you can specify type of access for each type of
memory available for this function.
For more info, see Memory Coverage.
The Banking group
This group of the Hardware Configuration dialog controls the whole set of memory banking parameters. It is present only when the main board in your emulator supports the extended memory.
PICE-52 with the standard memory volume does not support banking.
Element of dialog
Description
Enable Banking
Turns memory banking on/off.
With this option disabled, the emulator uses only 64 Kb of memory and
blocks access to memory above 64 Kb (even if this memory physically
exists).
Banked Memory
Specifies the type of address space. You can select only one type or
both types together. Also, see note below.
Bank Switching
Method
Specifies system resources that your program uses to switch the banks.
Also, see below for more about the method.
Bit Mask
Bits of this mask specify which digits of the selected resource (the port
or Xdata memory cell) to use to extend the address. Also, see rules below.
The PICE software blocks attempts to set a wrong mask and issues
warning messages.
Inverted Bits
Sets inverting the mask bits when forming the extended memory address.
Inverting is necessary, when electronic gates in the target system invert
the signals coming from the MCU port or the external (Xdata) register to
the address lines of the memory chips.
Version 1.1
Page 138 of 245
Error! Unknown document property name.User's Manual
The information area below the dialog prompts you about the tracer cable inputs to be connected to
the target system. For more about them, see Connecting to Target with Banked Memory.
When the Enable Banking flag is on, the total volume of the Code and Data address space may
increase to 2 Mb depending on other options controlled from this dialog.
Notes
1. When the on-chip Code memory is enabled (with the corresponding flag in the Emulation
MCU Options group), the banking is carried out only for the off-chip Code memory.
2. If the selected target microcontroller has only internal Code memory (has no external bus at
all), the Hardware Configuration dialog will not display this group.
Method of switching
You should set up the bank switching method very carefully, as the PICE software cannot check
your settings for correctness and prevent malfunctioning. The only exception is the case, when you
use the Keil C compiler and have specifically set it up to prepare files for symbol debugging. The
PICE software automatically identifies the input files created by the Keil compiler and checks parameters of this dialog for correspondence to the bank switching parameters in the input files.
Rules for the bit mask
1. Only adjacent bits are allowed (for example, you can use bits 3 and 4, but not 3 and 5).
2. The bit with a higher address should correspond to a higher physical memory address.
The Environment dialog
The Fonts tab
This tab is part of the Environment dialog and is used for setting up the fonts in the PICE windows.
Only monospaced (non-proportional) fonts are used to display information in the windows of PICE
(Fixedsys by default). To improve appearance of the windows, you can set up another font either
for all windows altogether, or individual fonts for each window.
The Windows area lists the types of windows. Select a type to set up its options. The set options
are valid for all windows of the selected type, the already opened windows included.
Version 1.1
Page 139 of 245
Error! Unknown document property name.User's Manual
Element of dialog
Window Title Bar
Description
Toggles the title bar for windows of the selected type. When the flag is
off, the windows are smaller in size (they have no title bar). Also, see
notes below.
Window Toolbar Location
Sets the toolbar location for the windows of the given type.
Grid
Turns on/off displaying the vertical and horizontal grids in the window
and permits adjusting the column width (when the vertical grid is allowed).
Additional Line Spacing
Sets up the line spacing, which will be added to the standard line spacing. Either type in the new value or choose from the list of most recently
used values.
Define Font
Opens the Font dialog. The selected font is valid for all windows of the
selected type.
Use This Font for All
Windows
Applies the font of the given window type to all windows in PICE.
Notes
1. To move a window without the title bar, place the mouse cursor on its toolbar, where there are
no buttons, and then operate as if the toolbar were the window title bar. Also, you can access
the window control functions through its system menu by pressing the Alt+<grey minus>
keys.
2. Each window has the Properties item in its local menu. The Title and Toolbar items of the
Properties sub-menu toggle the title bar and toolbar on/off for this individual window.
The Colors tab
This tab is part of the Environment dialog. Here, you can set the colors that will be used by the
PICE windows. By default, most colors are inherited from Windows. Because the debugger is a
program, with which you sometimes have to work for long hours, choose colors that do not tire your
eyes. For example, blue and white strain less than black and white.
Version 1.1
Page 140 of 245
Error! Unknown document property name.User's Manual
Element of dialog
Description
Color Scheme
Specifies the color scheme name. Your can type in a name or choose
a recently used one from the list.
The Save button saves the current scheme to the disk. The Remove
button removes the current scheme.
Colors
Lists the names of color groups. Each group consists of several colors.
Inherit Windows
Color
When this flag is on, the selected color is taken from Windows. If later
you change the Windows colors through its Control Panel, this color
will change accordingly.
This flag is available only for the background and text colors.
Use Inverted
Text/Background
Color
When this flag is on, PICE inverts the selected window colors (for text
and background). For example, if the Watches window background
color is white and the text color is black, then the line with the selected
variable will be highlighted with black background and white text.
Edit
Opens the Color dialog, if the Inherit Windows Color and Use Inverted Text/Background Color flags are off for this type of windows.
The Color dialog also opens, if you double-click a color in the Colors
list.
Spread
Sets using the selected color for all PICE windows. This option is useful for the text and background colors. For example, if you choose blue
background and yellow text for the Source window and then click the
Spread button, these colors will be set as the text and background
colors for all windows.
Font
For syntax highlighting in the Source window, you can specify additional font attributes: Bold and Italic.
In some cases, Windows increases the size of characters, when syn-
Version 1.1
Page 141 of 245
Error! Unknown document property name.User's Manual
thesizing bold fonts, thus making the font unusable, because the bold
and regular characters should be of the same size. In these cases, the
Bold attribute is ignored.
Sometimes, this effect occurs with the Fixedsys font. If you need to
use the Bold attribute, choose Courier New.
The Key Mappings tab
In this tab, you can assign hot keys for any command in the PICE program. The Menu Commands
Tree column displays a tree-like expandable diagram of all commands. The Key 1 (Key 2) columns
contain the corresponding hot–key combinations for the commands. The actions apply to the currently selected command.
Element of dialog
Description
Define Key 1
Define Key 2
Opens the Define Key dialog. In the dialog, press the key combination
you want to assign to the selected command, or press Cancel.
Alternatively, double-click the “cell” in the row of this command and the
Key 1 (Key 2) column.
Erase Key 1
Erase Key 2
Removes the assigned key combination from the selected command.
Alternatively, click the “cell” in the row of this command and the Key 1
(Key 2) column with the mouse right button.
The Toolbar tab
This tab is part of the Environment dialog. It controls the presence and contents of toolbars of the
PICE window.
Version 1.1
Page 142 of 245
Error! Unknown document property name.User's Manual
Element of dialog
Description
Toolbar Bands
Lists the toolbars of PICE. To enable/disable a toolbar, click its check
box.
Buttons/Commands
Lists the buttons for the toolbar selected in the Toolbar Bands list. To
enable/disable a button on the toolbar, click its check box.
“Flat” Local Window
Toolbars
Toggles between the “flat” and quasi-3D appearance of the local toolbar buttons for the specialized windows.
The PICE window toolbar buttons are always “flat”.
Toolbar Settings are
the Same for Each
Project/Desktop File
Employs the current settings of this tab for other projects or files
opened later. PICE will ignore their own respective settings from the
project configuration file, though will keep them unchanged.
The Misc tab
This tab is part of the Environment dialog and contains miscellaneous parameters of PICE windows and messages.
Version 1.1
Page 143 of 245
Error! Unknown document property name.User's Manual
Element of dialog
Description
Main Window Status
Line
Controls presence and location of the PICE window status line.
Cockroach
Turns on/off the toolbar pet cockroach.
Quick Watch Enabled
Turns on/off the Quick Watch function.
Highlight Active
Tabs
Turns on/off highlighting the currently active tab (the MS Windowsstyle) in the windows with tabs. For example, in the Watches window,
the Memory Dump window, the Messages window, the Memory
Coverage window, etc.
Double Click on
Check Box or Radio
Button in Dialogs
Sets the mouse double–click function equivalent to a single click on
the corresponding element of dialog and pressing the OK button of
that dialog.
Show Hotkeys in
Pop-up Descriptions
Turns on/off displaying the hotkeys in the short prompts for toolbar
buttons.
Do not Display Box
if Console Window
Opened
Sets displaying all messages in the Console window, if it is opened.
If closed, the message box will display the message.
Always Display
Message Box
Sets displaying all issued messages in the message box.
The Console window also displays these messages.
Automatically Place
Cursor at OK Button
When on and the message box opens, automatically places the cursor
on the OK button of the message box.
You can disable this option, if you prefer to press the Enter key instead of clicking OK by the mouse.
Audible Notification
for Error Messages
Sets beeping along with the error message. The information messages are always displayed without the beep.
Log Messages to
File
Specifies the log file name. All messages will be written to this file. The
write method is controlled by the radio button with the following positions:
Overwrite Log File
After Each Start
Specifies to erase the previous log file, if exists, and create it afresh
for every session.
Version 1.1
Page 144 of 245
Error! Unknown document property name.User's Manual
Append Messages
to Log File
Specifies to append messages to the end of existing log file. In this
case, the log file size will grow endlessly.
Note. Messages from functions printf and _printf are also written to the log file.
The Quick Watch function
The Quick Watch function works as follows: if you rest the mouse pointer over a variable name in
the Source window, the Disassembler window or the Script Source window, a small box containing the value of the variable will be opened. This box disappears upon moving the mouse.
In the Source window, if you place the caret at a variable name in the text and simultaneously
press and hold down both mouse buttons, then the Inspector window will be opened for this variable. To close this window, release the mouse buttons.
The Editor Options dialog
The General tab
The General tab of the Editor Options dialog sets up all common options applicable to every
Source window opened.
Element of dialog
Description
Backspace Unindents
Toggles the Backspace Unindent mode. See below for explanations.
Keep Trailing Spaces
Toggles between two options: either to remove trailing spaces in lines
when copying text to the buffer or saving it to a disk (the flag is off), or
not (the flag is on).
Vertical Blocks
Turns on the Vertical Blocks mode for the block operations.
Persistent Blocks
Turns on the Persistent Blocks mode for the block operations.
Version 1.1
Page 145 of 245
Error! Unknown document property name.User's Manual
Create Backup File
If this option is on, then PICE creates the *.BAK file each time the file in
the window is saved.
Horizontal Cursor
Sets the cursor as a horizontal line alike the DOS command prompt.
CR/LF at End-of-file
Adds empty line to the file end, when saving the file to disk (if there is
no one yet). Some cross-compilers require such line.
Syntax Highlighting
Toggles the syntax highlighting of language constructions.
Highlight Multi-line
Comments
When on, enables highlighting of the multi-line comments. By default,
the window highlights only the single-line comments.
However, this function operates not yet perfectly. If it causes mishighlighting of other parts of the source file, then turn this option off.
Mark Lines with Code
Toggles marking the source lines, for which the compiler generated
code, with the diamond sign in the leftmost position. This makes the
source text more readable.
Auto
Word/AutoWatch
Pane
When this option is on, the new Source window will open with the Auto
Word/AutoWatch pane at its right and the automatic word completion
being on.
Full Path in Window
Title
When the flag is on, the Source window caption bar displays the full
path to the file opened.
Empty Clipboard Before Copying
After copying to the clipboard with this flag being off, previous data of
other format kept in the clipboard remains retrievable.
Convert Keyboard
Input to OEM
When this flag is on, the Source window converts the characters you
input in the window from the MS Windows character set to the OEM
(national) character set corresponding to your national version of the
Windows operating system. Also, see note below.
AutoSave Files Each
Sets the time interval in minutes for the automatic file save operation.
Enter the time interval in the box on the right.
Tab Size
Sets the tabulation size for the text display. The allowable value ranges
from 1 to 32. If the file being opened contains the ASCII tabulation
characters, they will be replaced with the amount of spaces equivalent
to the tabulation size.
Undo Count
Sets the maximum amount of available undo steps (512 by default). If
this does not suffice, you can set a value of up to 10000 steps. However, the larger value requires more memory volume for the editor.
Automatic Word
Completion
The Enable flag turns the automatic word completion function on/off.
The Scan Range drop-down list box sets the number of text lines to be
scanned by the automatic word completion system.
Mixed with Disassembler Mode
Switches between two options for this mode of source text display. For
more about this mode, see special features for debugging.
Indenting
Switches between options of automatic indenting for the new line created, when you press Enter.
Double Click
Sets the action for the mouse double-click.
Note. You should set up the Convert Keyboard Input to OEM flag only if you are going to type
something in the Source window when working with a file coded in the OEM character set. If you
need only displaying such file, specify the Terminal font for the Source window in the Fonts tab of
the Environment dialog: select Editor in the Windows list and press the Define Font button.
The Backspace Unindent mode establishes the editing result from pressing the Backspace key in
the following four cases, when the cursor is positioned at the first non-space character in the line
(there are several spaces between the first column of the window and the first non-space character):
Version 1.1
Page 146 of 245
Error! Unknown document property name.User's Manual
Backspace Unindent enabled
Backspace Unindent disabled
Insert mode
Any preceding blank spaces in the
line are deleted. The rest of the line
shifts left until its first character is in
the first column of the window.
One space on the left from the cursor is deleted. The cursor and the
rest of the line on the right from the
cursor shift one position left.
Overwrite mode
The cursor moves to the first column of the window. The text in the
line remains in its place.
Only the cursor moves one position
left. The text in the line remains in
its place.
The Keymap tab
With the Keymap tab of the Editor Options dialog, you manage the list of available editor commands: add new commands to the editor, delete them or assign (reassign) hot keys for the new
commands and for built-in ones.
The left column of the list contains the command descriptions. The second column indicates the
type of the command (Command means the built-in command; Script ‘XXX’ means the added
(user-defined) command). Two columns on the right specify the equivalent hot key combinations to
invoke the command, if any.
Element of dialog
Description
Add
Opens the Edit Command dialog for you to add the new command to
the list and set up the command parameters.
Delete
Removes the selected user-defined command from the list. The builtin commands cannot be removed.
Edit
Opens the Edit Command dialog for you to change the command parameters. For built-in commands, you can only reassign the hot keys
(the Command Description and Script Name boxes are not available).
Edit Script File
Opens the script source file of this command in the Script Source
window.
Version 1.1
Page 147 of 245
Error! Unknown document property name.User's Manual
Creating new commands
To create a new command, you have to develop a script for it. In fact, you add a script to the editor,
not command. This means your command is able to perform much more complex and multi-step
action than a usual editor command. Moreover, you can tailor this action to your convenience, particular work task or other need. Your scripts may employ the capabilities of the script language itself, its rich set of built-in functions and variables, text editor functions and the already existing
scripts.
A script source file is an ASCII file. To execute your command, the editor compiles the script source
file. Note that before you can switch to using the script you have been editing, you shall first save it
to the disk in order to have PICE recompile the script.
The script source files for the new commands shall reside only in the KEYCMD subdirectory of the
PICE system directory. The PICE package contains several example script files there. For more
info about developing the scripts, see Script Files and Emulator Use Automation.
The Edit Command dialog
This dialog box sets parameters for the new command or amends parameters of the existing ones.
Element of dialog
Description
Command Description
Text of this box is displayed in the list of commands.
Script Name
The name of the script file, which executes this command.
Define Key 1
Define Key 2
Opens the specialized dialog box, which accepts the key combination
you press there and makes this combination the hot key for this command. The buttons refer to the first and second hot key combination,
respectively.
The script source files for commands shall reside only in the KEYCMD subdirectory of the PICE
system directory. Type the file name without its path and extension.
Notes
1. You should not specify the combinations reserved by Windows (like Alt+– or Alt+Tab).
2. It is not recommended to specify the combinations already employed by commands in the editor and PICE, because in this case you have fewer ways to access these commands. For example, those opening the application menus like Alt+F, Shift+F1, Ctrl+F7, or the editor window local menu hot keys.
3. You can use more than one control key in the keystroke combinations. For example, you can
use not only Ctrl+F, but also Ctrl+Shift+F or Ctrl+Alt+Shift+F.
Version 1.1
Page 148 of 245
Error! Unknown document property name.User's Manual
4. For some built-in commands, the hot keys cannot be reassigned (for example, the keys for
moving the cursor).
The Project menu
This menu contains commands for working with projects.
Button
Command
Description
New
Opens the Create New Project dialog. For more about it, see
note below.
Open
Opens the Open Project dialog for loading a project file.
Repository
Opens the Project Repository dialog.
Options
Opens the Project Options dialog for reviewing or changing
the project parameters. Also, see note below.
Save
Saves the currently opened project. Note that when you close
a project, create a new project or just exit PICE, the current
project is saved automatically.
Close
Saves and closes the currently opened project.
Make
Launches the Project Manager for the opened project. Only the
changed files will be re-compiled.
Build all
Recompiles all files of the project and re-links all modules.
Note. The Project Options dialog and the Create New Project dialog are almost equivalent. For
more about these dialogs, see the General Properties group, the Target Microcontroller for the
Project group, the Cross-tools group, the Memory Model group, the Memory Areas group, the
Folders group and the Make Options group.
The Open Project dialog
This dialog box helps you to choose the project to be opened (loaded).
Version 1.1
Page 149 of 245
Error! Unknown document property name.User's Manual
Element of dialog
Description
Project File Name
Specifies the project file name.
Project Open History
Lists the project history. Double-clicking a line in the list loads the project.
Delete From List
Deletes the selected project from the Project Open History list.
The Project Repository dialog
Operations in this dialog apply to the branch or project, which is selected on the tree. For more
about the repository, see Project Repository Tree.
Element of dialog
Description
Add New Branch
Opens the Add New Branch dialog for specifying the name of new
branch. On pressing OK, attaches the new branch to the selected
branch.
Add a Project to
Branch
Opens the Open Project dialog for selecting a project to be added.
On pressing Open, adds the selected project to the selected branch.
Add Current Project
to Branch
Adds the currently opened project to the selected branch.
Remove Project/Branch
Deletes the selected project or branch from the repository. When deleting a branch, all branches that “grow” from this branch and all projects located on it will be deleted.
When deleting a project from the repository, the PICE program deletes
only the record about this project in the repository, and does not delete this project from the disk.
Version 1.1
Page 150 of 245
Error! Unknown document property name.User's Manual
Edit Branch Name
Opens the Edit Branch Name dialog for the selected branch.
Move Up
Moves the selected project or branch up the tree within the same level
of hierarchy. The branch moves together with all branches that “grow”
from it and all its projects.
Move Down
Moves the selected project or branch down the tree within the same
level of hierarchy. The branch moves together with all branches that
“grow” from it and all its projects.
Save Repository
Writes the repository to the disk file.
Browse Project
Folder
Opens the Explorer of MS Windows with the opened folder of the selected project.
Open Project
Writes the repository to the disk file and opens the selected project.
Exit
Closes the dialog. If the repository is changed, will ask whether to
save it.
The Project Properties panel
For the project selected on the tree, this panel displays some its properties taken from the project
file.
Element of dialog
Description
Project File
Displays the project file name with path.
Chip
The microcontroller chosen for the project (specified in the Target Microcontroller for the Project group).
Toolset
The name of cross-tool set chosen for compiling the project.
Last Saved by
The name of user who saved the project for the last time. For the projects saved from the PICE program of previous versions, this info is
not available.
Last Saved on
The date and time when the project was saved.
The Project Options dialog
This dialog has the General Properties group, the Target Microcontroller for the Project group,
the Cross-tools group, the Memory Model group, the Memory Areas group, the Folders group
and the Make Options group.
The General Properties group
General properties are the project top-level parameters.
Version 1.1
Page 151 of 245
Error! Unknown document property name.User's Manual
Element of dialog
Description
Project Name
Specifies the project name (PRJ0000 by default), that is, its configuration file name without path. The extension may be omitted, the default
extension is .IDE. The executable program file will get the same name.
Project Folder
Specifies the project directory.
Browse
Opens the Choose a Directory dialog.
Description
Contains your text to describe the project. This text will appear in the
Project window title bar.
Import Options from
the Current Project
Copies the current project options to the newly created project. This is
convenient, when the new project shall be much like the opened one.
By default, PICE resets the cross-tool settings for the new project to defaults.
Choose Project to
Import Options from
Opens the Choose Project dialog. PICE will copy options from the selected project to this new one.
Notes
1. We recommend creating an individual folder for each new project. Type full path to the new
folder in the Project Folder box and if the specified directory does not exist, PICE will create
it. If you leave the Project Folder box empty, your project will be placed by default in the
PICE installation directory. Two different groups of files (the PICE files and your project files)
will be mixed and this will hinder managing your files.
2. You can specify other microcontroller type for the emulator than that for the compiler. If this is
the case in your project, PICE will display a message. The project configuration file contains a
parameter to tell the external compiler, for which target microcontroller to compile. In a project,
the target microcontroller type for compiler does not depend on the selected compiler, and
vice versa.
3. As compared with the Create New Project dialog, only Description and Choose Project to
Import Options from are available in this group of the Project Options dialog.
Example of comments for a project (here, exflt is the project file name):
Project: Example with floating point [exflt]
Version 1.1
Page 152 of 245
Error! Unknown document property name.User's Manual
The Target Microcontroller for the Project group
This group of the dialog specifies the target microcontroller for your project.
The target microcontrollers are supported with restrictions. For more info, see Restrictions of PICE52 and Special Considerations.
The Import from Hardware Configuration button copies the target microcontroller type selected
in the Hardware Configuration dialog to this group.
Note. As compared with this dialog, the Hardware Configuration dialog sets the target microcontroller for the emulation microcontroller.
The Cross-tools group
This group specifies the cross-tool package for your project from among the packages known to the
PICE program, and also for adding and deleting additional (custom) packages.
Element of dialog
Description
Cross-tools Vendor
The list contains all tool kits known to the PICE program.
The radio button chooses the cross-tool for use with your project.
Add Custom Toolset
Opens the General Tools Options group for adding a cross-tool kit to
the Cross-tools Vendor radio button list.
Delete Custom
Toolset
Deletes the parameters specified in the General Tools Options group
for interoperation with the selected tool kit and the position with its
name from the Cross-tools Vendor list.
Save Selected Custom Toolset Options
as Default
Saves the parameters of package selected in the Cross-tools Vendor
list, for use as the default values in the new created projects.
Set All Settings to
Their Default Values
Restores the default values for all parameters.
Version 1.1
Page 153 of 245
Error! Unknown document property name.User's Manual
Choosing a cross-tool means choosing the whole cross-tool package provided by its vendor: the
compiler and assembler from this package will be called to compile, and the linker or librarian from
this package will be called to build the whole project. Accordingly, the subordinate groups of this
group (the C Compiler group, the Assembler group, the Linker group, etc.) and their parameters
depend on the kit selected.
The Run After Build group
After the linker has linked your project, you can launch any necessary application, for example, an
object converter. To specify such application and its command-line parameters, write the following
string in the text field:
[exe-file] [parameters]
where:
exe-file
is the full name of executable file to be launched;
parameters
are the command-line parameters for this application program.
The Application to Run After Build flag, when off, serves to temporarily disable this feature, without clearing the text field.
Here, to specify the file name and its parameters, you can use macro names available in the (Custom) C Compiler, Assembler, Linker group, and also:
$BINDIR
the path to the BIN subfolder of the compiler (see the Folders group).
Example: Let's assume that upon linking your project, you need to launch a HEX-converter. In such
case, the text field may contain:
$BINDIR\conv.exe $PROJNAME.BIN TO $PROJNAME.HEX
where $PROJNAME.BIN is the output file when linking the project.
The General Tools Options group
This group sets up the basic parameters necessary for operation of the additional package. For
each tool of the package (high-level language compiler, assembler and linker), you have to set up
the flag and specify the name of its executable file in the text field on the right from the flag. If a tool
is absent, the flag should be cleared.
Element of dialog
Description
Tool Set Name
Specifies the custom name of package being added. This obligatory
name will distinguish it from other cross-tools in the list. You can specify any name.
Compiler .EXE-file
Name
The flag specifies the presence/absence of the high-level language
compiler; the text field specifies the name of its executable file, without
path.
If there are no such compiler in the package, the flag shall be cleared.
Version 1.1
Page 154 of 245
Error! Unknown document property name.User's Manual
Assembler .EXE-file
Name
The flag specifies the presence/absence of assembler; the text field
specifies the name of its executable file, without path.
If there are no assembler in the package, the flag shall be cleared.
Linker .EXE-file
Name
The flag specifies the presence/absence of linker; the text field specifies
the name of its executable file, without path.
Assembler INCLUDE Directive
Syntax
Specifies the assembler directive for including a header file in compilation.
If there are no linker in the package, the flag shall be cleared.
Using the text in this field, the PICE program correctly identifies the
name of file to be included (dependency) when launching the Project
Manager.
The default text in this field is “INCLUDE 'file.inc'”. However, if you
program in assembler, this text may need a correction.
Case Sensitive Assembler Directives
When on, the flag specifies that the assembler directive syntax depends on the letter case. By default, the flag is off.
Browse
Opens the Open File dialog to search for the necessary file.
The sub-groups of this group are: the File Extensions group, the (Custom) C Compiler, Assembler, Linker groups, the Messages Format group, the Debug Info File Format group, the Environment Variables group and the Run After Build group.
The File Extensions group
This group specifies the file extensions that refer to the project and are typical for the corresponding groups of the Project window. The Project Manager uses the extensions specified here to find
the output files of the project and decide whether they need to be recompiled.
Element of dialog
Description
Compiler Source
Specifies the file extension typical for the C Sources group. Initially,
the field contains “c”.
Assembler Source
Specifies the file extensions typical for the Asm Sources group. Initially, the field contains “asm;s”. You can specify several extensions
separated with semicolon.
Library
Specifies the library file extension from the Libraries and Object
Files group. Initially, the field contains “lib”.
Object File
Specifies extension of object files from the Libraries and Object files
group, and also, of files obtained by compilation. Initially, the field is
empty.
Executable
Specifies extension of output (executable) files obtained by building
the whole project. Initially, the field contains “hex”.
Version 1.1
Page 155 of 245
Error! Unknown document property name.User's Manual
Listing File
Specifies extension of listing files, which may be generated by the
compiler or assembler. Initially, the field contains “lst”.
Linker Map File
Specifies extension of memory map file, which may be generated by
the linker. Initially, the field contains “map”.
The (Custom) C Compiler, Assembler, Linker groups
These sub-groups of the General Tools Options group specify parameters for launching the
cross-tools of additional package.
If the order of specifying the parameters and file names in the command line of the selected crosstool is important, you should specify it using the File and Options Placement at the Command
Line radio button.
Element of dialog
Description
File(s) First
Specifies that the source file name(s) should be written in the command line before the command-line parameters.
Options First
Specifies that the command-line parameters should be written in the
command line before the source file name(s).
Object Files Separating Character
Specifies the character for separating the multiple names of object
files when launching the linker. Initially, the field contains the space
character, but if the linker uses other separation character, you should
specify it. Also, see the paragraph below.
Command-line Options
In this field, you should write the command-line parameters for launching the cross-tool, in the form ready for use, including, if necessary,
the parameter that specifies the output file name. Also, see the paragraph below.
Available Macros
You can use these macro names in the Command-line Options field,
in the command-line parameters. Also, see the paragraph below.
Object Files Separating Character
Example: when launching the linker, if the object files shall be listed separated with comma
(file1.obj, file2.obj, ... fileN.obj), then this field shall contain “,”.
Version 1.1
Page 156 of 245
Error! Unknown document property name.User's Manual
Command-line Options
You can write several parameters in a text line, and also use the environment variables, for example, %env_var%. If the necessary variable is not defined, you can define it in the Environment
Variables group.
Output File Name
The names of input and output files of the cross-tool (compiler or assembler) should be identical.
Usually, a cross-tool makes the output file name from the input file name and its default extension
of object file. That is, you do not need to specify the output file name in the cross-tool command
line.
If the output file name shall be explicitly specified when launching a cross-tool, then this operation
will be assigned to the PICE program. That is why, you should specify the corresponding command-line parameter in the Command-line Options field of the C Compiler, Assembler or Linker
group (for the compiler, assembler or linker, respectively). And here, using macro names is a convenient practice. For example, $SRC_FILE will substitute the input file name without extension.
For each cross-tool, the output file extensions shall be the same as those specified in the corresponding fields of the File Extensions group.
Examples:
1. The compiler being used requires the output file name explicitly specified with the “-o” command line parameter. By default, the object file extension is “obj”. And the name of source file
to be compiled is “fileA.c”. In this case, you should write the text of “-o fileА.obj” in the Command-line Options field of the C Compiler group. If using macro name $SRC_FILE, then the
text will be “-o $SRC_FILE.obj”.
2. The project name is “projectA”; the output file extension for the package used is “out”. In this
case, the output file name is “projectA.out”. If using macro name $PROJNAME, then you
should write “$PROJNAME.out”.
Available macros
You can use the following macro names in the command-line parameters in the Command-line
Options field:
$INCDIR
$LIBDIR
$PROJDIR
$PROJNAME
$SRC_FILE
$CHIP
— the path to the INCLUDE–files (see the Folders group);
— the path to libraries (see the Folders group);
— the folder of the currently opened project;
— the name of the currently opened project;
— the name of the currently compiled file, without extension;
— the type of microcontroller chosen for the project.
The Messages Format group
This group is not obligatory for use. However, with its parameters correctly specified, the PICE program will help you faster and easier correct the errors found when compiling the project.
If you do not set up parameters of this group, then the Messages window will get the error messages and warnings of compiler, assembler and linker in the form the tools sent them. In this case,
the PICE program does not distinguish between error messages and warnings and does not know,
which source file to open (which file caused the error or warning) and also, it cannot determine the
text line with the error in order to highlight it with color stripe.
Version 1.1
Page 157 of 245
Error! Unknown document property name.User's Manual
Element of dialog
Description
Error Message Format
Specifies the error message format.
Warning Message
Format
Specifies the warning message format.
Messages Output in
a File
When the flag is on, the PICE program copies the error messages to
the Messages window, even when the cross-tool writes them only to
the file. Also, see the paragraph below.
Messages output in a file
When your compiler (assembler or linker) outputs the error messages only to a file, you can also
see the messages in the Messages window, if you set up this flag and specify the error message
and warning formats.
When your compiler outputs the error messages to the console, then the flag should be cleared.
If the flag is on, you should specify the error messages file name in the field on the right. You can
use the following macro names in this file name:
$SRC_FN
$PROJNAME
the name of file being compiled, without extension;
the name of currently opened project, without extension.
Initially, the field contains “$SRC_FN.err”.
How to specify formats
As a rule, every compiler outputs error messages in its common format, which can be easily identified during the first compilation of file with errors, when the fields of this group are not yet set up.
The following characters designate the variable parts of error messages and warnings:
%n
%f
%l
%c
%s
the number of error/warning;
the file name;
the line number;
the column number;
the accompanying text of error message.
Generally, not every compiler gives the column numbers in the error messages, and linkers, as a
rule, never give the file names and line numbers. That is why, when some part is absent in the
messages of compiler (assembler or linker), you should not specify it in the formats in this group.
The format you specified shall be exactly the same as that used by the compiler. For example, if
the compiler leaves three spaces between character “]” and the file name, then the format shall
contain exactly three spaces.
Examples
1. The Messages window displays the following messages:
Version 1.1
Page 158 of 245
Error! Unknown document property name.User's Manual
Error[48]
c:\project\main.c 3 : Expecting a (
Error[76]
c:\project\main.c 6 : Expecting ;
Warning[50]
c:\project\main.c 10 : Condition always false
The corresponding formats of error messages and warnings shall be:
Error[%n]
%f %l : %s
Warning[%n]
%f %l : %s
2. The Messages window displays:
**Error[49] c:\project\main.c(4,6): Bad expression syntax
You should specify in the Error Message Format field:
**Error[%n] %f(%l,%c): %s
3. The Messages window displays:
**Warning[52] c:\project\main.c(7,8): Code has no effect
You should specify in the Warning Message Format field:
**Warning[%n] %f(%l,%c): %s
The Debug Info File Format group
In this group, you should select a debug format, for which the debugger supports the symbol debugging of your program.
The Environment Variables group
This group is to specify the environment variables that will be defined and used when launching the
compiler, assembler or linker. For example, such variables may be necessary for operation of compiler, when it has to locate its supplementary working files. Also, variables are useful for defining
the parameters of your cross-tools.
A record in the text box of this group like:
<Name of variable >=<Value>
is equivalent to defining this environment variable. Each variable in the list (in the text box) shall
take one text line: you should press Enter after each record, though, it is not obligatory after the
last record.
You can use the environment variables, which are specified here, in the (Custom) C Compiler,
Assembler, Linker group, the Run After Build group and the Folders group.
Example
The compiler executable file is located in folder c:\my_tools\bin, and the compiler components are
in folder c:\my_tools\exec_dir. Usually, in such case the compiler needs an environment variable,
EXEC_DIR, which specifies path to the components. If you write in the text box
“EXEC_DIR=c:\my_tools\exec_dir”, then the launched compiler will find other components and will
operate correctly.
The Memory Model group
PICE-52 provides the following dialogs for this group depending on the selected cross-tool:
The Memory Model group (IAR Systems)
The Memory Model group (KEIL Software v.5.x)
The Memory Model group (KEIL Software v.6.x, 7.x)
The Memory Model group (Raisonance S.A.)
The Memory Model group (SDCC)
The Memory Model group (HI-TECH)
Version 1.1
Page 159 of 245
Error! Unknown document property name.User's Manual
The Memory Model group (IAR Systems)
This group is the same for all supported tool kits of IAR Systems (v. 4.x and 5.20+).
Element of dialog
Description
Model
Sets the memory model from the available options for the selected
compiler.
Banking Area Start
Address
Specifies the Banking area start address.
For more about the Banking area, see Memory Banks. For more about using the start address, see
Developing and Debugging Programs with Memory Banks.
The Memory Model group (KEIL Software v.5.x)
Element of dialog
Description
Code Size Limits
Specifies the Code area limits, which stipulate the type of CALL and
JMP instructions for the compiler to use when compiling the program.
Settings of this field are equivalent to using the ROM directive of the
compiler.
Memory Model
Sets the memory model (the default allocation of the automatic and
global variables). Settings of this field are equivalent to using the
SMALL, COMPACT and LARGE directives of the compiler.
Number of Data
Pointers
Specifies how many DPTRs (the data pointer registers) may be used in
the program being compiled:
1:Standard 8051
only one DPTR.
2:AMD & Dallas Semi two registers; this is equivalent to the
MODDP2 directive of the compiler.
For more information, see compiler documentation.
Version 1.1
Page 160 of 245
Error! Unknown document property name.User's Manual
The Memory Model group (KEIL Software v.6.x, 7.x)
Element of dialog
Description
Code Size Limits
Specifies the Code area limits, which stipulate the type of CALL and
JMP instructions for the compiler to use when compiling the program.
Settings of this field are equivalent to using the ROM directive of the
compiler.
Memory Model
Sets the memory model (the default allocation of the automatic and
global variables). Settings of this field are equivalent to using the
SMALL, COMPACT and LARGE directives of the compiler.
Enable ‘Far’ and ‘Far
const’ Memory
The flag permits supporting the variables defined as ‘far’ and ‘far const’.
For more information, see compiler documentation.
The Memory Model group (Raisonance S.A.)
The radio button of this group selects the memory model type. Small is the default option.
The Memory Model group (SDCC)
The radio button of this group selects the memory model type. Small is the default option.
The Memory Model group (HI-TECH)
In this group, you select the memory model.
Version 1.1
Page 161 of 245
Error! Unknown document property name.User's Manual
Element of dialog
Description
Memory Model
Sets the memory model. The default option is Small. For more about
the models, see the paragraph below.
Banking Options
Sets the memory bank parameters of your project. Available only for the
Huge memory model. Also, see the paragraph below.
Memory Models
Small
This is a fully static model of memory. It does not support recursive or re-entrant code. The extern,
static and auto variables, and also function parameters, have static locations in the internal RAM.
The extern and static variables may be located in the external memory using the far qualifier.
Medium
This is also a fully static model, which does not support re-entrant or recursive code. However, the
extern and static variables are allocated in external RAM. The auto variables and function arguments are allocated statically in the internal RAM. The extern and static variables may be allocated in the internal RAM using the near and idata qualifiers.
Large
This memory model is a fully re-entrant code generation model. It uses a downward growing stack
in the external RAM to go round the 8-bit stack pointer limit imposed by the 8051, the top address
of which is calculated from the highest usable address in the external RAM. The extern, static and
auto variables are all allocated in the external RAM; the auto variables and function arguments are
allocated on the external stack. The extern and static variables may be placed in the internal RAM
using the near and idata qualifiers.
Huge
This model is equivalent to the Large model and supports the banked code configuration. When using the Huge model, functions are by default qualified far. This places them into the Banked area in
the ltext psect filling additional banks as required. Function may be placed in the Common area by
using the basenear qualifier.
Banking Options
Specify Banking Configuration
When on, enables other fields in this area.
Starting Address
Specifies the logical address the Banking area begins from, in the
hexadecimal format.
Banked Size
Specifies the Banking area size, in the hexadecimal format.
Starting Bank
Sets the first bank in which to commence placement of the banked
code. It is an ordinary decimal number. In most cases, it is zero.
Number of Banks
Specifies the amount of banks in your project (an ordinary decimal
number).
For more information on the memory models, see the compiler documentation.
Version 1.1
Page 162 of 245
Error! Unknown document property name.User's Manual
The Memory Areas group
This group controls the memory allocation options of the target microcontroller. PICE-52 provides
the following dialogs for this group depending on the selected cross-tool:
The Memory Areas group (Phyton MCA-51)
The Memory Areas group (IAR Systems)
The Memory Areas group (KEIL Software, Raisonance)
The Memory Areas group (HI-TECH)
The Memory Areas group (Phyton MCA-51)
Element of dialog
Description
Memory Types
Lists the memory areas of microcontroller. Here, BDATA is the bit data
area; SFRS is the data for special function registers.
Segments
Specifies the order for the segments of the memory area selected in
Memory Types.
Allow Code Placement in Memory Area
Allows generating of code in the selected memory area. By default,
generating of code is allowed in the predetermined area of ROM and
forbidden in all other ones.
Edit
Opens the Segment Name dialog for you to edit name of the segment
selected in the Segments list.
Add
Opens the Segment Name dialog for you to enter the segment name.
Upon pressing OK, the segment will be added to the memory area selected in Memory Types.
Delete
Deletes the segment selected in the Segments list.
Version 1.1
Page 163 of 245
Error! Unknown document property name.User's Manual
The Memory Areas group (IAR Systems)
Element of dialog
Description
Memory Types
Lists the target microcontroller memory areas. Also, see the paragraph
below.
Segments
Lists the segments, which the linker will place in the memory area selected in Memory Types. By default, these are only the segments,
which the C compiler generates for the selected memory area. If your
program contains segments with other names, add them to the corresponding memory area.
Ranges for Segments
Listed
This field lists the address intervals, where the linker will try to place the
segments of the Segments list. Also, see the paragraph below.
Allocation
Specifies the direction of placing the segments of the Segments list:
Downwards the next segment is placed at higher addresses of
the interval, before the previous segment (adjacent to the interval upper boundary).
Upwards
the next segment is placed at lower addresses of
the interval, after the previous segment.
Start Address
Specifies the address, from which to place segments of the Segments
list, in the format of numbers.
Edit
Opens the Segment Name dialog for you to edit name of the segment
selected in the Segments list.
Add
Opens the Segment Name dialog for you to enter the segment name.
Upon pressing OK, the segment will be added to the memory area selected in Memory Types.
Delete
Deletes the segment selected in the Segments list.
The Memory Types list
CODE
The program code (ROM).
DATA
The program data.
IDATA
The data in the internal RAM.
XDATA
The data in the external RAM.
BIT
The bit data.
UNTYPED Data that do not belong to any segment. We have noticed that they are placed in the
DATA area, however, we do not recommend using this segment type.
Version 1.1
Page 164 of 245
Error! Unknown document property name.User's Manual
The Ranges for Segments Listed field
This field lists the address intervals, where the linker will try to place the segments of the Segments list, in the format of numbers as follows:
addr1-addr2,addr3-addr4,addr5-addr6
For example:
0h-1000h,8000h-8FFFh,97FFh-0A000h
The Memory Areas group (KEIL Software, Raisonance)
Element of dialog
Description
Memory Types
Lists the memory areas of microcontroller. Also, see the paragraph below.
Segments
Specifies the order for the segments of the memory area selected in
Memory Types.
Start Address for
Segments
Specifies the address, from which to place segments of the Segments
list, in the format of numbers. Also, see the paragraph below.
Edit
Opens the Segment Name dialog for you to edit name of the segment
selected in the Segments list.
Add
Opens the Segment Name dialog for you to enter the segment name.
Upon pressing OK, the segment will be added to the memory area selected in Memory Types.
Delete
Deletes the segment selected in the Segments list.
The Memory Types list
Precede
The area in the internal data memory for the segments, which are placed first of all
others.
BIT
The bit memory.
DATA
The internal data memory.
IDATA
The indirectly addressed internal data memory.
Stack
The area in the internal data memory for the segments, which are placed after all
others.
CODE
The program code (ROM).
XDATA
The data in the external RAM.
PDATA
The data in the external RAM.
Version 1.1
Page 165 of 245
Error! Unknown document property name.User's Manual
The Start Address for Segments list
The start address values shall be within the following ranges depending on the selected memory
type:
BIT
0 — 7FH (the bit address is implied here, not the byte one!)
DATA
0 — 7FH
IDATA
0 — 0FFH
CODE
0 — 0FFFFH
XDATA
0 — 0FFFFH
PDATA
0 — 0FFFFH
The Memory Areas group (HI-TECH)
Element of dialog
Description
Enable On-chip
ROM
When on, the default memory ranges as specified in the Chipinfo file
are available for the compiler to use as the program memory. Otherwise, these default memory ranges will not be used, unless specified
in the Add Ranges field of the ROM area.
Enable On-chip
RAM
When on, the default memory ranges as specified in the Chipinfo file
are available for the compiler to use as the data memory. Otherwise,
these default memory ranges will not be used, unless specified in the
Add Ranges field of the RAM area.
Add Ranges
Specifies additional memory ranges that the compiler can use to store
code (for the ROM area) or data (for the RAM area) in.
Exclude Ranges
Specifies memory ranges that the compiler will exclude from storing
code (or data, for the RAM area) in.
Specify Internal
RAM Address
The flag enables the text field to enter the start address of the internal
RAM where the auto variables, function arguments, the idata and
near variables, collectively known as internal storage, will be located.
This value should normally be set to address 20h, starting the user
variables just above any bit variables.
Specify Non-volatile
RAM Address
The flag enables the text field to enter the start address of the nonvolatile RAM area to store the persistent variables. If this feature is
not used, or if all RAM is non-volatile, then this parameter should not
be specified.
Version 1.1
Page 166 of 245
Error! Unknown document property name.User's Manual
The Folders group
Use this group of the dialog to specify folders, where to search for the INCLUDE files, libraries, executable files of the cross-tools, as well as the folder for the output files of your project.
If the specified folder does not exist or you entered it incorrectly, PICE will not use it during compilation and will not display it, when you open this dialog the next time.
Element of dialog
Description
Include-files
Specifies paths to the included files. To specify several paths, separate
the paths with comma or semicolon.
Default Libraries
Specifies the paths to the default libraries, that is, the libraries, which
are not directly included in the project, but can be used when building it.
To specify several paths, separate the paths with comma or semicolon.
Binary (Compiler,
Linker...)
Specifies the path to the executable files of the compiler, assembler,
linker and librarian.
Search for Compiler
Starts search for the compiler executable file on all available drives except for floppies (PICE "knows" the name of this file). If the file is found,
PICE will open the Confirm File Location dialog for you to accept the
found compiler, or continue the search. If the compiler is found and you
confirm using it, PICE will automatically fill in the directory fields.
To stop the search at any moment, use the Cancel button.
Output Directory
Specifies the path to the folder with the project output files (such as
promable files, object files, listing files, map files, etc.). By default, this is
the project directory, and we recommend to leave this field empty.
The Confirm File Location dialog
This dialog asks you to confirm location of the found copy of the compiler.
Version 1.1
Page 167 of 245
Error! Unknown document property name.User's Manual
Button
Function
Accept
Accept this compiler.
Continue Search
Continue the search.
Cancel Search
Cancel the search.
The Make Options group
This group of the dialog specifies parameters of the Project Manager.
Element of dialog
Description
Promable File
Specifies the project objective as a promable (loadable) file.
Library
Specifies the project objective as a library. Later, you can use such library in other projects.
Errors
When on (it is enabled by default), specifies to stop compilation, if errors are identified. For more info, see below.
Warnings
When on, specifies to stop compilation, if warnings appear.
Scan AutoDependencies
When on (it is enabled by default), instructs the Project Manager to
check if the INCLUDE files have been modified since the last time the
source files were compiled.
When this flag is disabled, the check is not carried out and the program
source file will be recompiled only, if it itself (or its explicit dependencies) are changed.
Keep Response Files
& Generate .BAT File
on Build All
When on, specifies to generate the *.bat file and response files, if you
invoke the Build All command.
The *.bat file can start compilation without launching PICE. The response files serve to configure the tools used during the compilation.
Later you can use these files to carry out the compilation.
At the start of the Project Manager, all files or some of them may be recompiled, then the linker or
librarian processes the output object files. When errors are detected, then the compilation stops
and the corresponding messages are displayed in the Messages window.
If only the compiler warnings are issued during the compilation, then the object files still can be
generated. However, you can stop the compilation anyway in order to correct the program to avoid
further warnings. The Stop Make at area specifies whether to stop or not.
In any case, if any messages are issued during the compilation, then PICE will open the Messages
window (if not opened yet) and display the messages.
Version 1.1
Page 168 of 245
Error! Unknown document property name.User's Manual
The Commands menu
This menu contains the commands, which could not be explicitly categorized otherwise. For those
commands that have the tool bar button, the button is shown in the first column of the table below.
Button
Command
Description
Local menu
Opens the local menu of the active window. Alternatively, click
the right mouse button in the active window, or press
Ctrl+Enter or Ctrl+F10.
Add Watch
Operation depends on the current cursor position in the active
Source window. If the cursor is within a variable’s name, then
the command will add this variable to the Watches window.
Otherwise, it will open the Add Watch dialog.
PICE checks whether the Add Watch command is applicable
in the active window. For example, it is in the Source window
and it is not in the Dump window. If it is, PICE will transfer this
command to the active window. Otherwise, it will open the dialog box for you to specify the name of variable or an expression to be placed to the Watches window.
Calculator
Opens the Calculator dialog, which performs the calculator
functions.
Inspect
Opens the Inspect dialog.
Memory Block
Opens the Operations with Memory Block dialog.
Script Files
Opens the Script Files dialog. For more info about script files,
see Script Files and Emulator Use Automation.
Return to last editing context
Activates the very Source window, where you edited a source
file for the last time, and puts the cursor to the position, which
was last edited. If that Source window is closed already, PICE
will open it anew.
When debugging, it is usual that you intensively switch between several files. This command helps you quickly come
back to the last place you edited.
Start Programmer
Opens the Start Programmer dialog.
Listen for ACI Client
Opens the Start Listening for ACI Client dialog.
Xdata Test
Opens the Xdata Test dialog.
Show Examples
List
Opens the Examples dialog.
The Calculator dialog
Use this calculator to evaluate expressions and convert values from one radix to another. You can
copy the calculated value to the clipboard.
Version 1.1
Page 169 of 245
Error! Unknown document property name.User's Manual
Element of dialog
Description
Expression
The text box for you to enter the expression or number.
Copy As
Specifies the format, in which the result will be copied to the clipboard.
Signed Values
The result is interpreted and displayed as the signed value (the decimal
format only).
Display Leading Zeroes
The binary and hexadecimal values retain the leading zeroes.
Copy
Copies the result to the clipboard in the format set by the Copy As radio button.
Clr
Clears the Expression text box.
Bs
Deletes one character (digit) on the left from the insertion point (Backspace).
0x
Inserts “0x”.
>>
Shifts the expression result to the right by the specified number of bits.
<<
Shifts the expression result to the left by the specified number of bits.
Mod
Calculates the remainder of division by the specified number.
While you are typing the expression in the Expression drop-down list box, PICE tries to evaluate
the expression and immediately displays the result in different formats in the Result area. Also, the
radio button and two flags in this area control the result format.
You can assign values to program variables and SFRs by typing an expression that contains the
assignment. For example, you may type SP = 66h and the value of 66h will be assigned to SP.
Examples of expressions:
0x1234
-126
main + 33h
(float)(*ptr + R0)
101100b & 0xF
Version 1.1
Page 170 of 245
Error! Unknown document property name.User's Manual
The Inspect dialog
Use this dialog to enter the symbol name or expression, for which the Inspector window will be
opened.
Note that the Inspector window can be opened in other ways. For more information about that, see
descriptions of the Source window, the Watches window, the AutoWatches window and the Inspector window.
Element of dialog
Description
Name or Expression
to Inspect
Specifies the name or expression to be inspected.
Symbols List
Lists the symbol names defined in or known to the program.
Show Symbol
Classes
Specifies classes of objects to display in the Symbols List box: symbol
names defined in the program loaded for debugging, SFRs or debug
registers.
Show Objects
Specifies types of objects to display. This group of flags operates as a
filter.
Notes
1. The Symbols Defined in Program flag will be disabled, if no program is loaded or the program does not contain any symbol information.
2. The names of SFRs and debug registers are also displayed, regardless of the settings in the
Show Objects area, provided that the display of SFRs and debug registers is enabled in the
Show Symbol Classes area.
Usually, the function or subroutine name from the Symbols List box is used as the new address
(the address, from which the selected function begins, will serve as the new address). However,
you can use any other valid expression to specify the address.
To copy a symbol name to the Name or Expression to Inspect text box, click this name in the
Symbols List. To copy a symbol name to the Name or Expression to Inspect text box and close
this dialog, double-click this name. Alternatively, type in the address from the keyboard.
Version 1.1
Page 171 of 245
Error! Unknown document property name.User's Manual
The Script Files dialog
This dialog is used for controlling the script files (SF). For more about SF, see Script Files and
Emulator Use Automation.
The list of loaded script files (with the current state of each file) is there in the upper part of the dialog.
State of File
Description
Stopped
Execution of the file is temporarily stopped.
Running
The file is being executed.
Waiting
The file is waiting for event. This state is initiated by the call of certain
wait functions (for example, Wait) in the SF text.
Cancelled
The file execution is terminated, but SF is not unloaded from the memory yet.
The selected SF is highlighted. To select a script file, click it. The four buttons on the right from the
list control the selected SF:
Button
Description
Terminate
Unloads the selected SF, when the script file can be unloaded. Otherwise, sets up the Unload Request flag for the selected SF (such files
are in the Cancelled state). Note that not always a script file can be unloaded.
Terminate All
Unloads all script files.
Restart
Restarts the selected script file.
Debug
Switches to the Debugger mode for the selected script file. This command stops execution of SF (or, if SF is in the waiting state, then execution will stop after SF returns from the wait function) and opens the
Script Source window for this SF.
When you use several
script files simultaneously and unload or restart some of them, remember that SFs can
share global data and
functions. If one SF accesses data or functions
of another SF and the
latter is already
unloaded, then the SF
interpreter will issue the
error messages and the
former SF will be also
unloaded.
The buttons and fields in
the lower part of the dialog box control starting
the script files:
Version 1.1
Page 172 of 245
Error! Unknown document property name.User's Manual
Element of dialog
Description
Script File Name
Specifies the script file name.
Browse
Opens the Load/Execute Script File dialog for you to locate the script
file, whose name to put in the Script File Name box.
Defines
Defines the processor text variables for compilation. For more info, see
below.
#include-file Directories
Specifies the directories, where the script file will search for the files
specified in the #include <file_name> directive(s). To specify more
than one directory, separate them by semicolons.
Note that the current directory is scanned as well.
Debug (open Script
Source window)
If this option is set up, then execution of the script file does not start
upon its loading. Instead, PICE switches to the Debugger mode for this
file (that is, it opens the Script Source window for this SF).
Also, see How to Debug a Script File.
Auto-save Script File
Sources
Specifies to automatically save all script file source files opened in the
Script Source windows by the moment you pressed the Start button.
Start
Starts the script file specified in the Script File Name box.
Processor text variables
The Defines text box is equivalent to the #define directive. For example, if you type DEBUG in this
text box, the result will be as if the #define DEBUG directive is placed in the first line of the SF
source text.
You can specify values for variables. For example, DEBUG=3 is equivalent to #define DEBUG 3.
You can enumerate several variables in the line and separate them with semicolons. For example:
DEBUG;Passes=3;Abort=No
Also, see Predefined Symbols at the Script File Compilation.
The Start Programmer dialog
This dialog serves to start the EPROM programmers or other applications and controls the list of
applications to be started via this dialog. It is invoked by the Start Programmer command of the
Commands menu, or by its toolbar button, or with the Alt+F2 keys. It contains the following buttons:
Element of dialog
Description
Start
Launches the selected application.
Add
Opens the Application Setup dialog for you to add a new application to
the list.
Version 1.1
Page 173 of 245
Error! Unknown document property name.User's Manual
Delete
Deletes the selected application from the list (the application remains on
the disk).
Edit
Opens the Application Setup dialog for you to amend parameters of
the selected application.
The Application Setup dialog
In this dialog, you set up the application name and its parameters. Also, see description of the Start
Programmer command of the Commands menu and the Start Programmer dialog.
Element of dialog
Description
Application Description
This text will appear in the list of applications. Example: Phyton MultiProg Universal Programmer.
Executable Name and
Parameters
Contains the application executable file name, its path and command
line parameters. See additional info below.
Working Directory
Specifies the application working directory. If you leave this field empty,
the working directory will be the same as the working directory of PICE.
Shortcut Key
Sets the shortcut to start the application. There are 10 combinations
available, from Alt+1 to Alt+0.
Specifying the application name and parameters
If the command line parameters shall be specified, then place the application file name and path in
the double quotes. Example: "C:\MPROG\MPROG.EXE" /A.
The command line may include the so-called "text macros", which allow you to insert the currently
loaded program name into the command line:
$FILE_NAME
is replaced with the program name with the path and without extension.
$FILE_SPEC
is replaced with the full program name.
Example: suppose that you are debugging the program located in the directory C:\TEST and
named TEST01.D03. Then the line
"C:\UPROG\UPROG.EXE" /L$FILE_NAME.HEX
will be converted into:
"C:\UPROG\UPROG.EXE" /LC:\TEST\TEST01.HEX.
Version 1.1
Page 174 of 245
Error! Unknown document property name.User's Manual
The Start Listening for ACI Client dialog
This dialog switches PICE to waiting for request from an ACI client. ACI client is the application,
which controls the emulator over ACI (Application Control Interface).
To obtain the interface specification, please contact Phyton (see Contact Information).
The Xdata Test dialog
Use this dialog to test the hardware Xdata memory. Specify the first and last address for the memory range and press OK.
Note. The contents of the tested memory cells, if any, will be lost.
If the test went successfully, PICE will inform you. Otherwise, PICE will open the Test Errors dialog with the list of errors found.
The Examples dialog
This dialog lists the example projects included in the PICE-52 package. The examples are divided
into categories. Each example is described with reference to the cross tool package used to compile this example.
Version 1.1
Page 175 of 245
Error! Unknown document property name.User's Manual
To compile the project examples, you will need to have the corresponding cross tool packages installed on your computer.
If you do not want this dialog to appear upon starting PICE, clear the Show This Dialog at Startup flag.
The Scripts menu
This menu contains the user–defined items, which start the script files (SF).
To add new item, place a script file into the current folder or the installation folder of the PICE software. The first non-empty line of the script file shall contain three slashes followed by the text that
will appear in the Scripts menu:
/// Menu item text
When the PICE software builds the Scripts menu, it searches the current folder and its installation
folder for all *.CMD files that contain '///' in the first line (remember that '//' denotes the beginning of
the single-line comment) and inserts the text following '///' into the Scripts menu.
When you select the Scripts menu item, the corresponding script is launched.
Also, see Script Files and Emulator Use Automation and Simple Example of a Script File.
The Window menu
Commands of this menu arrange the opened windows for your convenience. Also, the list of the
currently opened windows in the lower part of this menu is the standard way to switch between the
windows. It is useful for switching to a window, which lays behind other windows.
Command
Description
Tile
Arranges all windows without overlap. Makes the windows approximately equal to each other by size.
Version 1.1
Page 176 of 245
Error! Unknown document property name.User's Manual
Tile Horizontally
Arranges the windows horizontally without overlap. Makes the windows
as equal to each other by size as possible.
Cascade
Cascades the windows.
Arrange Icons
Arranges the icons of the minimized windows.
Close All
Closes all windows.
The Help menu
This menu gives access to the help system. Also, see How to Get On-line Help.
Command
Description
Contents
Opens the contents of the emulator help file.
Search for Help on
Opens the search dialog of the Windows help system.
MCA-51 Macro Assembler Help
Opens help file for MCA-51 macro assembler.
Help System Control
Opens the Help System Control dialog for you to work with additional
help files: attach them to the emulator main help file, detach or view.
For example, the additional help files may be the manuals from the
compiler vendor.
When the main help file is invoked, the help index will contain indexes
from all the attached help files. This is convenient for searching multiple
help files at once.
To get help for some word in the Source window, place the cursor on
this word and press Alt+F1. The search for the word will be performed
in all files of the integrated help system.
About PICE-52
Opens the Information dialog (informs about versions of the emulator
component parts).
The Help System Control dialog
This dialog box controls the PICE-52 help system. The attached help files are listed on the left.
Version 1.1
Page 177 of 245
Error! Unknown document property name.User's Manual
Element of dialog
Description
Add
Opens the Attach Help File(s) dialog for you to choose the help file(s)
to attach. You can select several files at once. The selected file(s) will
be added to the integrated help system.
Detach
Detaches the help file selected in the Attached Help Files list from the
integrated help system.
View
Opens the selected help file.
The Information dialog
This dialog informs about the PICE product:
• version of Project-52 (the whole package of hardware and software products);
• version of PICE-52 (the emulator software);
• type of POD;
• type of emulation MCU;
• type of adapter;
• type of target microcontroller;
• version of boot monitor (the software built in the emulator hardware main board);
• version of loadable monitor (the loadable part of the monitor).
These data are necessary for our technical support, when you ask a question about your emulator
or report a failure or bug.
Version 1.1
Page 178 of 245
Error! Unknown document property name.User's Manual
Windows
The Source window
The Source window plays an important role in the software development process. It's main purpose is to display and edit the program source text, that is why it is named the "source" window. In
fact, it provides full-scale editing for any ASCII text file. From this point of view, it is the editor window. You can open as many Source windows as you need.
The Source window provides a wide range of editing functionality accessible through the Edit
menu:
• Basic (standard) editing functions including: undo, search, search-and-replace, repeat last
search (all functions can use both usual text strings and regular expressions). The window
supports persistent blocks and performs full range of block operations with standard (stream),
vertical (column) and line blocks of text.
• Specific functions for writing programs to make the development process easier and more
suitable.
• Editor keys (hot keys) give access to all common editing functions and some auxiliary editing
functions.
• Extended capabilities in the Editor configuration through assigning the editor hot keys and
creating new commands. You can reassign hot keys for some of the editor own (built-in)
commands at your convenience. The text editor is extendable: you can create your own (userdefined, new) editor commands using the built-in script language to augment your development productivity. For more about this, see the Keymap tab of the Editor Options dialog.
• The Editor toolbar, which is common for all Source windows, and the individual toolbar in
each Source window.
• The Right pane to display auxiliary information for the left pane.
When working with source text, the right pane shows the automatic word completion list. In
the debugging mode, the right pane displays values of the variables located in the corresponding lines of the left (main) pane.
To toggle the right pane, click the Right Pane On/Off button (
) of that window toolbar.
Besides text editing, the Source window is a component of integrated development environment.
When you are working with projects, it interoperates with the Project Manager to perform necessary
procedures. The window can launch compilation of the opened file. The window local menu commands provide for its active use in debugging the compiled source file. Also, see Scenarios of Use.
Version 1.1
Page 179 of 245
Error! Unknown document property name.User's Manual
Local menu
The window local menu contains the following commands (all commands are used for debugging,
most of them have button on the window toolbar):
Command
Description
Run to Cursor
Executes (resumes executing) the program up to the address corresponding to the line, where the caret is positioned. Alternatively, doubleclick the necessary line.
Inspect
Displays the Inspector window for the name at the caret position. If the
caret is not on a name, the command opens the Inspect dialog for you
to enter the name.
Add to Watches window
Opens the Watches window (if not opened yet) and places the name at
the caret position into it. If the caret is not on a name, the command
opens the Add Watch dialog.
Check Variable
Displays value of the variable at the caret position either in the Console
window (if it is opened), or in the Check Variable message box. If the
caret is not on a name, the command opens the Calculator dialog for
you enter the variable name.
View Disassembly
Opens the Disassembler window (if not opened yet) and displays the
disassembled code of the source line at the caret position.
Functions List
Opens the Functions List dialog with the list of functions in the source
file. Select a function and the window will display its source text. If the
source text has not been compiled yet, then first, the compiler starts.
The Code Browser window provides extended navigation features between the program source files and their functions.
Toggle Code Breakpoint
Sets/clears the code breakpoint on the line (at the corresponding address in the program memory).
Toggle Banked Code
Breakpoint
Sets/clears the code breakpoint on the line (at the corresponding address in the program memory):
—if this address is in the Common area, then the breakpoint will be set
at this address in every bank;
— if this address is in the Banking area, then the breakpoint will be set
only at the address in the corresponding bank.
New PC
Sets the PC value to the address of the line, where the caret is positioned.
Display from Address
Opens the Display from Address dialog for you to specify the new address. The source text beginning from this address will be displayed.
Origin
Displays the source text from the address equal to the PC value (PC
points to its address). Note that such displaying is not always possible,
because not every source line results in a single executable command.
Pick Source File
Opens the Pick Source File dialog with the list of source files in your
program. Select a file and the window will display its text.
Compile
Launches compilation of the source file in the active window. You can
use it to quickly test the source file for syntax errors. This command is
available only when working with projects.
Show Next Compiler
Error
Goes to the next line that has error reported by the compiler.
Mixed with Disassembly
When on, enables the namesake display mode. For more about this
mode, see special features for debugging.
Also, the window toolbar has two buttons to set up the data breakpoints on the variable at the caret
position:
BrkRd
Version 1.1
Sets up the breakpoint on reading from this variable.
Page 180 of 245
Error! Unknown document property name.User's Manual
BrkWr
Sets up the breakpoint on writing to this variable.
Regular Expressions
The text editor supports the so-called "regular expressions", which can be used to search for special cases of text strings. The regular expressions contain the control characters in the search argument string:
?
Means any one character in this place. Example: if you specify ?ell as the search
string, then the words like "bell", "tell", "cell", etc. will be found.
%
Means the beginning of line. The characters following '%' must begin from column
1. Example: %Counter - find the word "Counter", which begins from the first column.
$
The end of line. The characters preceding the '$' shall be at the last positions of the
line. Example: Counter$ - find the word "Counter" at the line end.
@
Match the next character literally; '@' lets you specify the control characters as
usual letters. Example: @? - search for the character of question mark.
\xNN
The hexadecimal value of the character. Example: \xA7 - find the character with
the hexadecimal code of A7.
+
Indefinite amount of the previous character. For example, if you specify 1T+2, then
the editor will find the lines containing "1" followed by "2", which are separated with
any amount of letter T.
[c1-c2]
Match any character in the interval from c1 to c2. Example: [A-Z] means any letter
from A to Z.
[~c1-c2]
Match any character NOT from c1 to c2, i.e. from 0 to c1-1 or from c2+1 to 255.
Example: [~A-Z] means any character except for the uppercase letters.
text1|text2
The "|" character is the logical "OR" and the editor will look for either text1 or text2.
Example: LPT|COM|CON means to search for "LPT" or "COM" or "CON".
The Search for Text dialog
The dialog sets the parameters necessary to
search for text in files. The
same parameters of this
dialog and the Replace
Text dialog are equivalent.
To specify file names, you
can use one or several
wildcards. Also, the names
may contain paths. Also,
you can search in more
than one file at once using
parameters of the MultiFile Search area.
Version 1.1
Page 181 of 245
Error! Unknown document property name.User's Manual
Element of dialog
Description
Text to Search for
Specifies the text string to look for (search string).
Case Sensitive
Specifies to match the case of the string. Disabled by default.
Whole Words Only
Search only for whole words: the string will be found only if it is enclosed between punctuation or separation characters (spaces, tabulation symbols, commas, quotation marks, etc.). Disabled by default.
Regular Expressions
Specifies that the search string is a regular expression.
Global
Search the string in the whole file. Enabled by default.
Selected Text
Search the string in the selected block.
From Cursor
Search from the current cursor position.
Entire Scope
Search from the beginning or end of the file (depending on the search
direction). Enabled by default.
Perform Multi-File
Search
Turns on the multi-file search (see notes below). If it is off, then the
search will be performed in the current Source window only.
Search All Source
Files in Project
Search all the source files included in the project.
Include Dependency
Files
Search all the source files included in the project and all files, from
which the source files depend explicitly or implicitly. For C language,
these are the header files (*.h).
Search Wildcard(s)
This field is for one or several wildcards, which specify the files to be
searched. Separate wildcards with semicolons. No quotes are required
to denote Windows-style long names. Example:
*.txt;*.c;c:\prog\*.h.
This option and the Search All Source Files in Project option act independently from each other: you can search in all files of the project
AND in other files, which comply with the specified wildcard(s).
Search Subdirectories
Search in subdirectories of all directories, which are specified by the
Search All Source Files in Project option and by wildcards.
Starting Path
Begin search from the directory specified in this text box. This directory
serves as the common path and is useful, when there are several wildcards like the following ones:
c:\prog\text\source\*.txt;c:\prog\text\source\*.doc
In such case, make use of wildcards (*.txt;*.doc) and common
path
(c:\prog\text\source).
Notes
1. When you specify a file for search, which is opened in the Source window, then the window
buffer will be searched, not the file on disk.
2. Multi-file search is performed in all source files of the project and the dependency files in accordance with the tree built by the Project Manager in the Project window. Upon finishing, the
Multi-File Search Results dialog is opened.
The Replace Text dialog
The dialog sets the parameters for the search-and-replace operation. The same parameters of this
dialog and the Search for Text dialog are equivalent. To specify file names, you can use one or
several wildcards. Also, the names may contain paths. Also, you can perform the procedure in
more than one file at once using parameters of the Multi-File Search area.
Version 1.1
Page 182 of 245
Error! Unknown document property name.User's Manual
Element of dialog
Description
Text to Search for
Specifies the text string to look for (search string).
Replace with
Specifies the text string to replace the found one.
Case Sensitive
Specifies to match the case of the string. Disabled by default.
Whole Words Only
Search only for whole words: the string will be found only if it is enclosed between punctuation or separation characters (spaces, tabulation symbols, commas, quotation marks, etc.). Disabled by default.
Regular Expressions
Specifies that the search string is a regular expression.
Prompt at Replace
Sets opening the Confirm Replace dialog for you to confirm the replace operation for the current found string. Enabled by default.
Global
Search the string in the whole file. Enabled by default.
Selected Text
Search the string in the selected block.
From Cursor
Search from the current cursor position.
Entire Scope
Search from the beginning or end of the file (depending on the search
direction). Enabled by default.
Perform Multi-File
Search
Turns on the multi-file search (see notes below). If it is off, then the
search will be performed in the current Source window only.
Search All Source
Files in Project
Search all the source files included in the project.
Include Dependency
Files
Search all the source files included in the project and all files, from
which the source files depend explicitly or implicitly. For C language,
these are the header files (*.h).
Search Wildcard(s)
This field is for one or several wildcards, which specify the files to be
searched. Separate wildcards with semicolons. No quotes are required
to denote Windows-style long names. Example:
*.txt;*.c;c:\prog\*.h.
This option and the Search All Source Files in Project option act independently from each other: you can search in all files of the project
AND in other files, which comply with the specified wildcard(s).
Search Subdirecto-
Search in subdirectories of all directories, which are specified by the
Version 1.1
Page 183 of 245
Error! Unknown document property name.User's Manual
ries
Search All Source Files in Project option and by wildcards.
Starting Path
Begin search from the directory specified in this text box. This directory
serves as the common path and is useful, when there are several wildcards like the following ones:
c:\prog\text\source\*.txt;c:\prog\text\source\*.doc
In such case, make use of wildcards (*.txt;*.doc) and common
path
(c:\prog\text\source).
Search
Replace the first found occurrence of the search string.
Change All
Replace all the found occurrences of the search string.
Notes
1. When you specify a file for search, which is opened in the Source window, then the window
buffer will be searched, not the file on disk.
2. Multi-file search is performed in all source files of the project and the dependency files in accordance with the tree built by the Project Manager in the Project window. Upon finishing, the
Multi-File Search Results dialog is opened.
The Confirm Replace dialog
This dialog asks you to confirm the replace operation for the current found string. To toggle opening
this dialog, use the Prompt at Replace flag in the Replace Text dialog.
Button
Function
Yes
Replace this found string.
No
Do not replace. If the procedure is started with the Change All button
for all occurrences in the search area, then the search-and-replace process will be continued.
Non-Stop
From this moment, replace all found strings in this file without prompt.
Cancel
Cancel the search-and-replace process.
Skip this File
Stop search in this file and switch to the next one.
Replace in All Files
Replace all occurrences in all other files without confirmation.
Move cursor to the
Yes/No Buttons
When the flag is on, the cursor will be automatically placed on the Yes
button in each inquiry for confirmation. This function is for convenience.
The Multi-File Search Results dialog
This dialog displays the multi-file search results. To learn about the multi-file search, see the
Search for Text dialog.
The List of Matched Files box lists the files, where the search string is found: the file name on the
left and its directory on the right. The line with green text immediately below this box displays information about the file selected in the box. "File in memory" means the file is opened in the
Source window. General info from FAT means the file is on disk, not loaded. The Preview area
shows the source line with the text string found.
The Sort Files by area is the radio button with the file sorting options. When the Consider Directory flag is on, the files are sorted with respect to their directories.
The Edit button opens the selected file in the new Source window and places the cursor to the line
with the found string. The found string is marked with the background color. To check if there are
Version 1.1
Page 184 of 245
Error! Unknown document property name.User's Manual
other occurrences of the sought string in this file, press Ctrl+R or use the Edit menu, the Next
Search command.
The Close button closes the dialog, but the results are not lost. To open this dialog box once more,
use the Display Multi-file Search Results button on the Editor toolbar, the same command of the
Edit menu or keys Shift+F5. In this case, the files in the List of Matched Files box, which are
opened in the Source window, are marked with asterisk on the left.
The Display from Line Number dialog
Use this dialog to display the source file in the active Source window from another line. Enter the
line number or select any previous number from the History list. The number of the first line is 1.
Version 1.1
Page 185 of 245
Error! Unknown document property name.User's Manual
The Set Bookmark/Retrieve Bookmark dialogs
Bookmarks serve to return you to the marked cursor position in a source file later. There exist local
and global bookmarks. The local bookmarks work within one file. The global bookmarks store both
the cursor position and the file name.
With these dialog boxes, you can set and retrieve up to 10 local bookmarks. Every local bookmark
has individual numbered button assigned to it.
To open the Set Bookmark dialog, press Alt+[. To open the Retrieve Bookmark dialog, press
Alt+]. To set/retrieve a bookmark, press its numbered button. The number of line, where the bookmark is set, the bookmark position in the line (in brackets) and the text of this line are shown on the
right of the button.
Local bookmarks are stored in the configuration file and you can retain them in the next session.
The Global Bookmarks button opens the respective Set/Retrieve Global Bookmark dialog.
The Set/Retrieve Global Bookmark dialogs
Bookmarks serve to return you to the marked cursor position in a source file later. There exist local
and global bookmarks. The local bookmarks work within one file. The global bookmarks store both
the cursor position and the file name.
Version 1.1
Page 186 of 245
Error! Unknown document property name.User's Manual
When you retrieve a global bookmark and there is no Source window with the file yet, PICE will
open it and put the cursor in the bookmarked position.
The Delete button deletes the selected bookmark from the list.
Global bookmarks are saved in the configuration file and you can retain them in the next session.
Block Operations
Block operations serve to apply an editing action to more than one character at once. The Source
window supports persistent blocks and performs full range of operations with standard (stream),
vertical (column) and line blocks of text.
Non-persistent blocks In this mode, once a block is marked, you have to immediately carry out
an operation with it (delete, copy, etc.), because any movement of cursor takes the marking off the
block. If you begin typing a text when a block is marked, then the block will be deleted and replaced
with this typed text.
Persistent blocks
In this mode, the block remains marked until the marking is explicitly
taken off (hot keys Shift+F3) or the block is deleted (Ctrl+X). The Paste operation for persistent
blocks has specifics. Two additional block operations are available for persistent blocks: fast copy
and fast move. These operations do not use the clipboard and involve less pressing of keys.
The persistent block mode is controlled by the namesake flag on the General tab of the Editor Options dialog.
Standard blocks The standard (stream) block contains a "text stream", which begins from the initial line and column of the block and ends at the final line and column.
The standard blocks are turned on by default (the Vertical Blocks flag in the Editor Options dialog is off).
Line blocks
The line block contains whole lines of text. To mark a line block, put the
cursor anywhere in the first line and press Alt+Z, then put the cursor anywhere in the last line of the
block and press Alt+Z once more (the latter is not necessary, if the block is to be immediately deleted or copied to the clipboard).
The line blocks are always accessible, regardless of the Vertical Blocks flag.
Vertical blocks
The vertical block contains a rectangular text fragment. Characters
within the block, which goes beyond the end of the line, are considered to be spaces. Vertical
blocks are convenient in cases like the following example of source text:
char
char
char
char
Timer0
Timer1
Int0
Int1
far
far
far
far
;
;
;
;
Let us assume the word "far" is to be moved to the place right after the word "char" in each line.
The stream blocks are of little help here. However the task can be easily done with one vertical
block. Mark the persistent vertical block containing the word "far" in each line, place the cursor on
the first letter of word "Timer0" and press Shift+F2 (fast move the block):
The Vertical Blocks flag toggles the mode between the vertical blocks and the stream blocks (the
Editor Options dialog, the General tab, the Options area).
To mark a block, either move the mouse with its left button being pressed or use the arrow keys of
the keyboard with the Shift key being pressed. To take marking off the block, press Shift+F3.
Copying / moving the blocks
A marked block can be copied or moved within the same Source window in two ways: directly (fast
copying, fast moving) and through the clipboard (the Windows way). Copying and moving the
blocks between the Source windows or to another application requires the clipboard.
Note. The result of copying the stream or vertical non-persistent block depends on the INSERT
mode. If the mode is enabled, then the block is inserted into the text in the cursor position, otherwise the copied block overwrites the text on the area of equivalent size.
Version 1.1
Page 187 of 245
Error! Unknown document property name.User's Manual
Fast copying / moving
Fast copying (moving) the blocks in the same window directly (without the clipboard) is convenient,
because it requires pressing of keys only once per operation. Mark a persistent block, then place
the cursor to the destination position and press Shift+F1 to copy, or Shift+F2 to move.
For additional info about working with blocks, see the respective section in Editor keys.
Specific Functions for Writing Programs
A typical program source file contains many repetitive or similar elements of text and elements,
which often form complete functional units within the program. To streamline the process of writing
a source file and working with it later, the Source window supports two basic and commonly used
modes:
• Indenting of these similar elements and functional units (the Indenting mode).
• Highlighting of language constructions (syntax highlighting).
When the Indenting mode is on and you press Enter, the new line will automatically repeat the indenting of the previous text line (of the previous curly brace) and the cursor will be put into the first
column after the indenting. When the mode is disabled, the new line will have no indenting and the
cursor will be in the first column.
The source text becomes specifically formatted and, as a result, more readable. To control the
Source window modes, use the Editor Options dialog (the General tab and the Keymap tab).
These specific functions are supplemented by:
• The automatic word completion function, which helps conveniently keep your program specific
words at hand.
• The Condensed mode of display, which helps focus on a group of text lines selected in accordance with custom criterion.
Syntax Highlighting
When the Source window displays the source text, it marks different C language constructions with
different colors. This feature increases the text readability. The following constructions are highlighted separately:
• Punctuation and special characters: ( ) [ ] { } . , : ; and so on.
• Comments that begin with // are highlighted. Comments enclosed in the /* */ character pairs
are highlighted, if the opening and closing pairs are placed in the same line.
• Strings enclosed in the double or single quotation marks.
• Keywords of the C language (for, while, and so on).
• Type names of the C language (char, float, and so on).
• Library function names of the C language (printf, strcpy, and so on).
How to control
You can disable syntax highlighting (through the Configure menu, the Editor Options menu item,
the Editor Options dialog, the General tab, the Syntax Highlighting flag), as well as change color
for each construction. To do the latter, use the Configure menu, the Environment menu item and
dialog, the Colors tab, the Colors list, items of the Source/Editor Window group.
Information for advanced users
In PICE, the key words, type and library function names are not strictly defined. You can find their
lists in the text files with the .DIC extension in the PICE installation folder. You can edit these files:
remove keywords or add new ones to be highlighted.
Version 1.1
Page 188 of 245
Error! Unknown document property name.User's Manual
Automatic Word Completion
It is normal for program source texts that the same words (labels, names of variables) are often repeated within certain limited part of file. In such cases, the Source window helps you finish typing
the whole word.
If the cursor is at the end of the line, then upon typing every letter, the editor scans certain amount
of text lines above and below the current line. If only one word beginning with the letters that you
have just typed is found in these lines, then the editor will "complete" this word for you by writing
the remaining part of the word from the current cursor position. If this word suits you, press
Alt+Right (Alt+<right arrow>) and the editor will insert the remaining part of the word into the text
as if you have typed it yourself.
You can press Alt+Right at any time and not only when the editor offers you to complete a word. In
this case, the editor will open the list of words, which begin with the typed letters, for you to choose
one of them for insertion. If there are no one applicable word, then nothing will happen. Also, if the
right pane (the Auto Word/AutoWatch pane) is on, it contains the word completion list.
How to control
To turn off the automatic word completion, use the Automatic Word Completion flag in the Editor
Options dialog, the General tab. When the flag is on, the Scan Range box sets the number of
lines for the editor to scan (the default setting is 24 lines below and 24 lines above the current line).
When this parameter is greater than the total amount of lines in the file (for example, 65535), then
the whole file will be scanned. However, the larger the scanned area, the longer it takes to scan it.
Condensed Mode
In the Condensed mode, only lines that satisfy the specified criterion are displayed in the window.
There are two criteria available:
• the line shall contain the given sub-string;
• the first non-space character in the line shall be at the specified position (column).
Examples: (a) with the sub-string criterion and the sub-string set to "counter", only the lines containing the word "counter" will be displayed; (b) with the second criterion and the position set to four,
only the lines, in which text begins from column 4, will be displayed.
The Condensed mode brings the lines having some common feature "in one place". If you attentively follow the rule to begin the declaration of data at position 2, the procedures at position 3 and
the interrupt handlers at position 4, then the Condensed mode will effectively help you to quickly
find the necessary declaration. If you comment certain lines with the same comments and use the
Condensed mode with sub-string, you will be able to benefit from your writing style. While in the
Condensed mode, you can move the cursor just like in the normal mode.
How to control
The criterion for displaying is set in the Condensed Mode Setup dialog. To toggle the Condensed
mode on/off, use the Edit menu command, or the Condensed Mode button on the Editor toolbar or
the F11 key. To exit the Condensed mode, press Esc. In this case, when you exit this mode, the
cursor returns back to its position, where it was before the mode was turned on. To exit the mode
and remain in the line, to which you have moved the cursor while the mode is on, press Enter or
begin editing this line.
The Condensed Mode Setup dialog
This dialog sets up the parameters for the Condensed mode of the Source window.
Version 1.1
Page 189 of 245
Error! Unknown document property name.User's Manual
The List Lines of Text area contains one radio button to switch between the two available criteria:
Containing String sets displaying the lines with text, which match the sub-string specified in the
text box. Additionally, you can set up matching the case, whole words or specify that the sub-string
is the regular expression.
Where First Non-blank Column Is sets displaying the lines, where text begins from the position
specified in the Column box. The obligatory additional options specify, how to handle this position:
• Equal to
the first non-space character shall be exactly in the specified column. For example, if you specify position number 2, the window will display only the lines, whose text begins from column 2.
• Not Equal to the first non-space character shall be in any column except for the specified
one. For example, if you specify position number 2, the window will display only the lines with
text NOT beginning from column 2.
• Less than
fied one.
display only the lines, where text begins from the position less than the speci-
• Greater than display only the lines, where text begins from the position greater than the
specified one.
Upon pressing OK the Source window switches to the Condensed mode.
Editor Keys
Use the following key combinations to work with the Source window faster.
Moving the cursor
Left, Right, Up, Down
One position left, right, up or down, respectively.
Home
To the beginning of the line. The position, in which the cursor is placed,
depends on the Auto Indent mode. If Auto Indent is turned off, then the
cursor is placed to column 1. If Auto Indent is turned on, then the first
pressing the Home key places the cursor in the first non-empty position
in the line (unless there is no one yet). Pressing the Home key once
more moves the cursor in column 1.
End
To the end of the line.
PgUp, PgDn
One page up or down.
Ctrl+PgUp, Ctrl+Home To the beginning of the file.
Ctrl+PgDn, Ctrl+End
To the end of the file.
Ctrl+Right, Ctrl+Left
One word right or left.
Deleting and inserting
Tab
Inserts spaces from the cursor position to the next tabulation position.
Del
Deletes the character in the cursor position.
Version 1.1
Page 190 of 245
Error! Unknown document property name.User's Manual
BackSpace
Deletes the character on the left from the cursor. If cursor is in one of the
first empty positions of the line, then the number of spaces to be deleted
depends on the Backspace Unindents mode. If this mode is off, all
spaces on the left from the cursor to the first column will be deleted, otherwise only one space will be deleted.
Ctrl+Y
Deletes the current line.
Ctrl+E
Deletes the characters from the cursor position to the end of the line.
Enter
If the Insert mode is on, inserts the new line, otherwise goes to the next
line.
Operations with blocks
Alt+Z
Starts/stops marking the line block.
Shift+Right,
Shift+Left,
Shift+Up,
Shift+Down,
Shift+Home,
Shift+End,
Shift+PgUp,
Shift+PgDn
Moves the boundary of the area, which become the marked block.
Ctrl+C, Ctrl+Ins
Copies block to the clipboard.
Alt+A
Appends block to the clipboard.
Alt+T
Cuts block and appends it to the clipboard.
Del
Deletes block (if the Persistent Blocks mode is off) or the respective
character (if on) without copying it to the clipboard. To delete a persistent block, use Ctrl+X.
Ctrl+X, Ctrl+Del
Deletes block and puts it to the clipboard.
Ctrl+V, Shift+Ins
Inserts block (Paste operation) from the clipboard into the cursor position
(if there is no block marked, or if the Persistent Blocks mode is on). If a
non-persistent block is marked, will overwrite the block with the clipboard
contents.
Ctrl+Alt+Ins,
Shift+F1
Copies block to the cursor position without the clipboard (the Persistent
Blocks mode shall be on).
Ctrl+Shift+Ins,
Shift+F2
Moves the block to the cursor position without the clipboard (the Persistent Blocks mode shall be on).
Shift+F3
Takes marking off the marked block.
For more information, please see block operations.
Other operations
Insert
Toggles the Insert mode and the form of the cursor.
Alt+BackSpace
Undoes the last operation.
Alt+[
Opens the Set Bookmark dialog.
Alt+]
Opens the Retrieve Bookmark dialog.
Alt+Right
Accepts the word offered by the automatic word completion function.
Ctrl+L
Opens the Display from Line Number dialog to go to the line with the
number you specify.
The Editor toolbar
Except for the individual toolbar of each Source window, there are several common toolbars for all
windows of this type (the Editor toolbars). They contain buttons for the basic editing operations
equivalent to the Edit menu commands. Most of these buttons are accessible only when the
Version 1.1
Page 191 of 245
Error! Unknown document property name.User's Manual
Source window is active. The information messages sent by the editor are repeated in the information panel of the editor.
The Editor toolbar is disabled by default. To enable it, use the Environment dialog (through the
Configure menu), the Toolbar tab, the flag for the corresponding toolbar in the Toolbar Bands
list.
The Check Variable message box
This box displays the evaluated result of the expression.
The Functions List dialog
Use this dialog to quickly go to the source text of the selected function. This dialog lists the functions defined in the source file currently opened in the in the Source window.
To select a function, double-click the function name in the list or click the function name and then
click OK.
To obtain the full list of the functions defined in all source files of the program, use the Display
from Address command of this window local menu.
The Display from Address dialog
Use this dialog to specify the new address, from which to display the source text in the Source
window, or the disassembled text in the Disassembler window, or the dump in the Memory Dump
window, or the memory layout in the Memory Layout window.
Element of dialog
Description
New Address
Specifies the new address.
Symbols List
Lists the symbol names defined in or known to the program.
Show Symbol
Classes
Specifies classes of objects to display in the Symbols List box: symbol
names defined in the program loaded for debugging, SFRs or debug
registers.
Show Objects
Specifies types of objects to display. This group of flags operates as a
filter.
Version 1.1
Page 192 of 245
Error! Unknown document property name.User's Manual
Notes
1. The Symbols Defined in Program flag will be disabled, if no program is loaded or the program does not contain any symbol information.
2. If this dialog is opened from the Disassembler window, the debug registers and SFRs will not
be available, because they have no concern with the Code memory.
3. The names of SFRs and debug registers are also displayed, regardless of the settings in the
Show Objects area, provided that the display of SFRs and debug registers is enabled in the
Show Symbol Classes area.
4. When this dialog is opened for the Memory Dump window, the symbol names correspond to
the memory space, which is currently displayed in the Memory Dump window.
5. You cannot set the new address for the Memory Dump window, whose start address is calculated each time, when the window is refreshed (if the address is set by a computable expression).
Usually, the function or subroutine name from the Symbols List box is used as the new address
(the address, from which the selected function begins, will serve as the new address). However,
you can use any other valid expression to specify the address.
To copy a symbol name to the New Address text box, click this name in the Symbols List. To
copy a symbol name to the New Address text box and close this dialog, double-click this name. Alternatively, type in the address from the keyboard.
For the Source window, you can also specify the new address with the Functions List command
of this window local menu.
After you specify the new address and press OK, PICE displays the corresponding line in the window and places the caret in it.
If PICE can determine, which source file and which line of the source text correspond to the address you entered in this dialog, then the Source window will display this file and text line and
place the caret at this line.
The Pick Source File dialog
This dialog lists the source files used when compiling your program and which are compiled with
the symbol information included. Program modules often have individual source files, one source
file per each module.
To select a file, double-click the file name in the list or click the file name and then click OK. The
Source window will display this file.
If you are choosing a file to view certain function or subroutine, use the Display from Address
command of the Source window local menu.
Debugging
Finding the syntax errors
The Compile button on the Source window toolbar and the Compile command in the local menu
tell the Project Manager to start compilation of the source file opened in the window. If the source
file has been changed, the Project Manager saves the file to disk, after that launches the compilation and opens the Compile Status dialog with the compilation process info. This command does
not start the linker or librarian. Other source files of the program, if any, will not be compiled. The
result of compilation is the object file, however, it has no further use and PICE immediately deletes
it.
If the compiler encounters errors during the file compilation, press OK in the Compile Status dialog and the Project Manager will list the errors in the Messages window. If you click a message line
in this window, the Source window will show the source text line, which caused that error, highlighted with green background. The Show Next Compiler Error command (the local menu) shows
such text lines in turn, while the Messages window highlights the corresponding message.
Version 1.1
Page 193 of 245
Error! Unknown document property name.User's Manual
Switching between editing and debugging a program
After you have prepared the program source text, you can immediately begin debugging program
and later, when necessary, return to amending the source text (correcting the errors).
The window local menu contains commands that control debugging a program, such as Run to
Cursor, Add to Watches Window, etc. Also, the window toolbar has buttons for most of these
commands.
If you choose one of these commands, then the Project Manager will save the changed files on the
disk and automatically start building the project. If the building is successful, then PICE will automatically load the program into the microcontroller memory for debugging. After that, the Source
window switches to the Debugger mode and PICE executes the requested command, for example,
runs the program up to the cursor position.
To return to editing the source text, just begin editing the text (perform any action in the Source
window that changes the text) and the window will switch to the Editor mode.
Note. If you have changed your source file after previous compilation and invoke any of the Run
menu commands related to starting a program (for example, Step), then automatically the project
will be built first and after that, the command will be executed.
Special features
• When debugging a program, the Source window highlights the source text lines corresponding to the code breakpoints and the current PC value. The source lines that contain executable code are marked with a little square in the first position of the line.
Note. A source text line in the C language may result in a group of several assembly lines.
When PC points to the first assembly line in such group, the corresponding source line is
marked with the blue stripe. When PC points to other line in such group, the corresponding
source line is marked with the dotted line.
• If you place the caret at a name of variable in the text and simultaneously press and hold
down both mouse buttons, the Inspector window will be opened for this variable. This window
is closed, when you release the mouse buttons.
• The window has the Quick Watch function.
• The window provides the Mixed with Disassembler mode, when the generated code in the
form of disassembled text is displayed for the lines of source text.
There are two options for the Mixed with Disassembler mode:
1. For Each Source Line, when the disassembled text is displayed for all source lines, for which
the code was generated.
2. For Current Line Only, when the disassembled text is displayed for the current line, without
flooding the display with disassembly for other lines. The current line is the line of the source
text in the C language, which corresponds to the Program Counter. The Source window can
perform this option, when you are running your program by steps (debugging it). So, you can
see the disassembly for the line immediately before this line is executed.
Use the General tab of the Editor Options dialog to toggle options for this mode.
The Project window
The Project window displays the contents (source files, libraries, listings, preprocessor files, etc.)
of your project in the form of tree. The files are grouped together within their subdirectory and are
represented as the tree branches. The tree diagram includes the following items for each source
file in the project:
• Icons and names of files.
• Description (if any) in square brackets (see example).
• Status in the latest compilation (the total amount of errors, if any occurred, warnings and remarks).
• Dependency files (if any).
Version 1.1
Page 194 of 245
Error! Unknown document property name.User's Manual
Example: text “Error Handling” is the description for the project component file ERROR.C and the
compiler and linker generated two warnings for it:
error.c [Error Handling] -- 2 Warning(s)
Note. The tree displays dependencies differently:
1. Only Icons and names are displayed for them.
2. The dependency files are connected not to their tree branch, but to the file (they are positioned below the file and shifted to the right), which depends on them.
To specify description for a file in the project and set up other its options, use the File Options dialog (the File Options command of the window local menu).
You can add or delete source files (single file or several files at once) to/from the project. When
added, the files appear on their relative branch of the tree diagram and are saved in their respective subdirectory (if you have set the respective flag, when adding the file).
The dependency scanner identifies the dependencies of project component source files and adds
them to the tree of project in the window. Upon starting, Project Manager automatically launches
the scanning. If you make amendments to your source file involving the dependencies (add,
change or delete lines with the #include directives), use the Update Dependencies command of
the local menu to update picture in the Project window. For additional explanations, see Scanning
of the Selected Source File Dependencies.
However, the scanner may be unable to identify some complicated dependencies itself. If this is the
case after you have added (deleted) or amended a source file, you will have to explicitly add the
dependency (such dependency is called “explicit”) to the project with the Add Explicit Dependency command. To delete an explicit dependency, select the dependency file in the tree and use
the Remove File from Project command.
Local menu
The window local menu contains the following commands (there is the window toolbar button for
each command):
Command
Description
Add File to Project
Opens the Add File to Project dialog corresponding to the selected file
group (the type of files, where you pressed the mouse right button).
Remove File from
Project
Removes the selected file from the project.
Edit File
Opens the Source window for the selected file. Alternatively, doubleclick the file name in the tree diagram.
Compile
Starts compilation of the selected file.
File Options
Opens the File Options dialog for the selected file.
Update Dependencies
Starts scanning the dependencies and refreshes the contents of the
Project window to display the new tree. If you are editing a source file,
Version 1.1
Page 195 of 245
Error! Unknown document property name.User's Manual
it will be automatically saved before the scanning starts.
Add Explicit Dependency
Opens the Add Explicit Dependency dialog. Also, see Adding Explicit
Dependencies to Source File.
Move One Position
Up
Moves the selected source file one level up within the tree branch. The
command is useful, when you have to explicitly specify order of linking.
Move One Position
Down
Moves the selected source file one level down within the tree branch.
Execute
Launches (executes) the file selected in the Abstract group.
The Add File to Project dialog
This dialog is the standard Windows dialog for picking a file with one additional flag:
Copy Files to the Project Directory
Specifies to copy the selected file(s) to the project directory (if not there
yet). This is the preferred way of adding files to project.
Scanning of the Selected Source File Dependencies
File X depends on file Y, if file X contains special construction with file Y in it. Such file Y is called
“dependency for file X”. For example, the following file X:
#include <stdio.h>
#include <string.h>
void main()
{
}
depends on stdio.h and string.h. Here, the special constructions are the #include directives, which
define dependencies for file X.
A file may contain several dependencies.
If a dependency is changed after the moment the dependent file was compiled for the last time, the
dependent file shall be recompiled automatically. With the Scan AutoDependencies flag in the
Make Options group being on, the Project Manager checks for the need to recompile and, if necessary, recompiles the file.
Adding Explicit Dependencies to Source File
The dependency scanner may be unable to identify some complicated dependencies itself. This error may occur, when the file include directive in the source text contains macro-substitutions in the
file names. Other cases are also possible. You can detect error of this type, when the Build All
command does not recompile the source file.
If this is the case, you have to explicitly specify the dependency files that the Project Manager
skipped.
To do this, select the dependent file in the Project window and click the +Dep button in the window
toolbar or use the Add Explicit Dependency command of the local menu. The Add Explicit Dependency dialog will open to perform the task.
The File Options dialog
This dialog specifies the following display parameters of project elements in the Project window:
Version 1.1
Page 196 of 245
Error! Unknown document property name.User's Manual
Element of dialog
Description
File Description
Text in this field will be the description of this project element.
Exclude Debug Info
When on, specifies to not generate the debug information for this element. Disabled by default.
Show Compilation
Results in Project
window
When on, sets displaying the status of this element in the latest compilation (the number of errors and warnings). Enabled by default.
Always compile
When on, specifies to compile the file under each compilation. When
off, the file will be compiled only if its source text is changed.
The Messages window
After the compilation, the Messages window displays error messages sent by the compiler or
linker. Usually, PICE itself opens and closes this window. For example, if the Messages window is
opened, you start compilation and the compilation is completed without errors, then PICE will close
the window. If errors occur during the compilation, PICE will open the window.
The Errors/Warnings tab displays the messages, which you use to correct your source file. Each
message takes one line in the window.
To select a message, use the mouse or the arrow keys. To scroll messages horizontally, use the
left and right arrow keys. Press Home (End) key to go to the beginning (end) of the selected message.
The source text lines in the Source window that caused errors are highlighted in turn, as you select
messages. This is performed for the opened files: if an erroneous file is not opened in the Source
window, it will not be automatically opened. If the opened Source window lays behind other windows, PICE will automatically put it in the foreground and the Messages window will remain active.
If there are several Source windows opened with your program modules, the window, whose module caused this message, will be put in the foreground.
To move the focus to the place in the source, where an error was detected, select the message in
the Messages window that reports this error and click the Edit button (on the Messages window
toolbar) or use the Edit Source command of its local menu, or just double-click the message line.
The Source window will display the corresponding text line and become active. If your compiler
provides info about both the line and column, then the window will put the cursor exactly in the error
place in the line.
Version 1.1
Page 197 of 245
Error! Unknown document property name.User's Manual
The Output tab displays the compiling session: the command lines that started the compiler, and
what the compiler, assembler and linker have output to the console. The window clears text of the
previous session.
Note. The Messages window does not update the error line number it uses, when you add or delete previous lines in the Source window to correct an error. For example, the Messages window
reports an error in the 20th line, you have edited the file and added three lines before the 20th line.
Now, if you select the message about the 20th line (in the Messages window), the Source window
will highlight the 20th line while the reported error is in the 23rd line already.
Local menu
The window local menu contains the following commands (there is the window toolbar button for
each command):
Command
Description
Edit Source
Opens the Source window for the file with the current error (if not
opened yet) and puts the cursor to the line (and column, if provided),
which contain this error.
View Source
Opens the Source window (if not opened yet for this file) and tells the
Source window to display the place in the source file with the error
specified by the selected message. The Messages window remains active.
Clear Window
Deletes all messages from the window.
Don’t Display Warnings
Toggles on/off displaying the warning messages. Warnings are hidden,
not deleted.
Help on Message
Opens help for the message selected in the window. This function
works not for every compiler.
The Watches window
When debugging a program, the Watches window displays values of the explicitly specified variables and expressions. Each of them takes individual line in the window. For each variable, window
displays its name, value, type and address, if any.
Version 1.1
Page 198 of 245
Error! Unknown document property name.User's Manual
The complex objects (such as structures or arrays) are displayed in one line. If an object is complex
and it is necessary to view it in detail, then use the Inspect command for this object.
A newly opened Watches window has only the Main tab. You can add your custom tabs (with the
Display Options command of the local menu) or rename any existing tab. The tabs operate independently from each other; each tab is functionally equivalent to a separate Watches window.
However, if you need, you can open several Watches windows.
When adding a new watch to the window, PICE adds it to the active tab (or, when there are several
Watches windows opened, to the active tab of the Watches window, which was the last active).
Use the following ways to add a variable to the Watches window:
• With the Add Watch command of this window.
• With the Copy to Watches Window command of the AutoWatches window.
• With the Add to Watches Window command of the Source window.
• With the Add to Watches Window command of the Disassembler window.
• With the Add to Watches Window command of the Memory Layout window.
• With the Add Watch command of the Commands menu.
Each of the above windows has the +Watch button of this window toolbar, which adds the selected
object to the Watches window. Also, you can add a peripheral device to this window as a watch by
the Add as Watch command of the Peripheral Device window.
The selected object in the window is highlighted. To select another object, either click it or use the
arrow keys of the keyboard.
Display modes
You can turn on/off the horizontal and/or vertical grid for this window.
In the display mode with the vertical grid, data in the window is organized in columns and each column has the title in the form of button. Pressing the Name button, the Type button and the Address button opens the Display Options dialog for the selected variable. Pressing the Value button opens the Modify dialog for the selected variable.
In the display mode without the vertical grid, a double–click on the line with a watch opens the
Modify dialog for the selected variable.
To turn on/off the vertical grid, use the corresponding flag in the Fonts tab (the Configure menu,
the Environment command).
Local menu
The window local menu contains the following commands (there is the window toolbar button for
each command):
Command
Description
Add Watch
Adds one or more objects to the window. Opens the Add Watch dialog
to choose an object by its name. Also, you can enter an expression as a
name.
Delete Watch
Deletes the selected object from the Watches window.
Delete All Watches
Deletes all watches from the window.
Version 1.1
Page 199 of 245
Error! Unknown document property name.User's Manual
Modify
Opens the Modify dialog to set new value for the selected variable. Alternatively, just begin typing the new value from the keyboard.
Inspect
Opens the Inspector window for the selected object.
Move Watch Up
Moves the selected watch up the list.
Move Watch Down
Moves the selected watch down the list.
Display Options
Opens the Display Options dialog to change the display parameters
for the selected object, and also to add/delete tabs in the window.
Also, the window toolbar has two buttons to set up the data breakpoints at the memory area occupied by the selected variable:
BrkRd
Sets up the breakpoint on reading from this memory area.
BrkWr
Sets up the breakpoint on writing to this memory area.
The Add Watch dialog
Use this dialog box to add symbol names (for example, a variable name or an expression) to the
Watches window. The dialog contains the list the symbol names defined in or known to the program.
Element of dialog
Description
Watch Expression
Specifies the symbol name or expression to be added. You can specify
several names and expressions either manually (separated with semicolons) or by selecting in the list with the Ctrl key pressed.
Show Types
Specifies classes of objects to display in the list box: symbol names defined in the program loaded for debugging, SFRs or debug registers.
Show Objects
Specifies the types of objects to display. This group of flags operates as
a filter.
Display Format
Specifies the display format (binary, hexadecimal, decimal or ASCII).
Add
Adds the specified symbol name(s) to the Watches window.
Done
Closes the dialog.
Version 1.1
Page 200 of 245
Error! Unknown document property name.User's Manual
Note that there are other ways to add a symbol name to the Watches window. For more info, see
description of the Watches window.
The Modify dialog
Use this dialog to specify the new value for the selected:
• variable in the AutoWatches window or in the Watches window;
• object in the Inspector window or in the Peripheral Device window;
• memory cell in the Memory Layout window.
Enter the value (a number or an expression) or select any previous one from the History list.
Note. In the Inspector window, you can set the new value only for the data of simple type. For example, you can not specify the value for an array or structure.
The Display Options dialog
Use this dialog to set the display options for the selected variable or expression in the Watches window.
Version 1.1
Page 201 of 245
Error! Unknown document property name.User's Manual
Element of dialog
Description
Watch Expression
Contains the selected expression. The drop–down list contains the previously used expressions.
Display Format
Specifies the display format for the selected expression (binary, hexadecimal, decimal or ASCII).
Pop-up Description
Controls displaying the pop-up descriptions for SFR.
Display Bit Layout
Controls displaying the pop-up layout descriptions for the SFR bits, if
any.
Display Bit Descriptions
Controls displaying the pop-up descriptions for the SFR bits, if any.
Auto-size Name
Field
When this flag is on and the vertical grid is on (see note below), the
window automatically adjusts the Name column width to fit the longest
record in the column.
Tabs
Lists all the tabs present in the window.
Add Tab
Opens the Add New Tab to Watches Window dialog for you to specify
name of the new tab. The window creates the new tab upon pressing
OK.
Remove Tab
Removes the tab selected in the Tabs list.
Edit Tab Name
Global Debug/ Display Options
Opens the Add New Tab to Watches Window dialog for you to edit
the tab name.
Opens the Debug Options dialog.
Note. To turn on the vertical grid, use the Configure menu, the Environment dialog, the Fonts
tab, the flag in the Grid area.
The AutoWatches window
When debugging a program, this window automatically displays the names and values of the variables that are currently visible in the Source window. If no Source window is opened, then the
symbol names are taken from the Disassembler window. If the Disassembler window is closed as
well, then the AutoWatches window displays nothing. When both Source and Disassembler windows are opened, the former takes precedence.
The AutoWatches window is divided with the red horizontal line into two parts, the upper part and
the under one. At any moment, there is a line in the Source window that corresponds to the current
PC value of the target microcontroller. This line is highlighted with a blue stripe (by default). The
names of variables, which are there in this line, are listed together with their current values in the
upper part of the AutoWatches window. Below the red line, the window lists: (a) parameters and
local variables of the current function; (b) other variables visible in the Source window.
The contents of the AutoWatches window changes automatically as you scroll through the Source
window.
You can perform any command, which is available in this window, on the selected object (it is highlighted with black stripe). To select another object, click it or use the arrow keys of the keyboard.
Version 1.1
Page 202 of 245
Error! Unknown document property name.User's Manual
Local menu
The window local menu contains the following commands (most of them have the window toolbar
button):
Command
Description
Modify
Opens the Modify dialog for the selected variable. This dialog serves to
set new value for this variable. Alternatively, just begin typing the new
value from the keyboard.
Inspect
Opens the Inspector window for the selected variable.
Copy to Watches
Window
Places the selected variable to the Watches window.
Change Display Format
Changes the data display format (hexadecimal, decimal, binary or ASCII). All values in the window are displayed in the same format.
No Functions and
Typeless Objects
When this flag is on, turns off displaying names and addresses of functions and typeless objects. Enabled by default.
Also, the window toolbar has two buttons to set up the data breakpoints at the memory area occupied by the selected variable:
BrkRd
Sets up the breakpoint on reading from this memory area.
BrkWr
Sets up the breakpoint on writing to this memory area.
The Inspector window
The Inspector window conveniently displays complex objects of high-level languages, such as arrays, structures or unions. You can also open the Inspector windows for simple objects, however,
the simple objects are better watched in the Watches window. If you try to inspect the pointer to a
structure or union, then the whole structure or union will be displayed. Each Inspector window displays only one object. However, you can open as many windows as you need.
For objects of all types, the first line of the Inspector window displays the object name, type, and
address. Also, it displays:
• For arrays: the list of elements and the element number, address, and value for every element.
• For structures, unions and pointers to them: the list of members of structure or union. The
element name, address and value are shown for every element.
The selected element in the list is highlighted. To select another element, click it or use the keyboard arrow keys.
To open the Inspector window:
• Use the Inspect command of the Commands menu, or the Inspector Window menu item of
the View menu, or the Inspect button in the PICE toolbar. In this case, PICE checks if the Inspect command is applicable in the active window (for example, it is applicable in the Source
Version 1.1
Page 203 of 245
Error! Unknown document property name.User's Manual
window and it is not for the dump windows). If it is, this command will be transferred to the active window, otherwise, the dialog box will open for you to enter the name of variable or expression to inspect.
• Use the Inspect commands of the Source window, the Watches window, the AutoWatches
window or the Inspector window.
• Press both mouse buttons simultaneously, when the caret points to a name in the Source
window. The Inspector window closes upon releasing the buttons.
When PICE loads the desktop configuration files (the desktop), only the first level Inspector windows will be restored (those, which are not created from another Inspector window). If an Inspector window is created from another Inspector window, then this window will not be restored.
Local menu
The window local menu contains the following commands (some commands have the window toolbar button):
Command
Description
Inspect
Opens the new Inspector window for the selected element of structure
or array.
Descend
Switches to inspecting the selected element of structure or array in the
same Inspector window. This is useful, when you do not want to create
intermediate windows.
Modify
Opens the Modify dialog for you to enter the new value for the selected
object. Alternatively, just begin typing the new value from the keyboard.
Change Display Format
Changes the display format (between hexadecimal, decimal, binary and
ASCII) for all elements in the list.
Edit Inspect Expression
Opens the Edit Inspect Expression dialog for you to edit name of the
inspected object. This command is available only in the first–level Inspector windows.
Extended Range
Permits you to extend an array. By default, only the correct elements
(which are within the range of the array) are displayed. With this flag
enabled, you see the array as if it is of the maximum allowable size.
Also, the window toolbar has two buttons to set up the data breakpoints at the memory area occupied by the inspected object:
BrkRd
Sets up the breakpoint on reading from this memory area.
BrkWr
Sets up the breakpoint on writing to this memory area.
The Memory Dump window
The Memory Dump window displays the target microcontroller memory dump in separate tabs for
each memory space. The dump is in the form of lines. The left column contains the address of the
first byte in the line (the letter of address space and offset value). The memory dump values are
displayed in one of several formats so as to fit the current width of the window. The right part of the
window (when it is on) displays the ASCII representation of content of the memory cells displayed
in the window central part. You can open as many dump windows as you want.
Version 1.1
Page 204 of 245
Error! Unknown document property name.User's Manual
This window provides separate tab for each kind of Xdata memory that the selected target microcontroller has or supports:
• The On-chip Xdata tab for the internal Xdata memory.
• The Off-chip Xdata tab for the external Xdata memory.
• The EEPROM Xdata tab for EEPROM.
• The Xdata tab, which displays the Xdata memory as seen by the microcontroller. This tab
contains the copy of the Xdata memory that has been the latest turned on for CPU (on-chip
Xdata, off-chip Xdata or EEPROM) by the moment of displaying.
If the target microcontroller does not support some of the above Xdata memories, the Memory
Dump window will not include the corresponding tab. When the target microcontroller supports only
one kind of Xdata, the window has only the Xdata tab.
When the window is narrow and its width does not suffice to display every tab, the window bar with
the tab names displays a couple of buttons with arrows in its right corner to help you scroll horizontally.
When the window is active, the caret highlights the nibble, digit or letter, which is currently in focus.
To select another one, click it with the left mouse button or use the cursor keys.
Use Memory Dump Window Setup dialog to adjust display in the window to your needs. Note that
the Display ASCII Codes flag works only, when the object size is set to Byte. Also, since the software understands the target microcontroller memory organization and keeps only the hardware–
supported option in effect for this radio button.
Working with dump
To display data from another address in the current line, double-click the address (if the window
displays addresses) and specify the new value in the Display from Address dialog. Alternatively,
just enter the new value in the current line address area. If the new address is accessible, data
from it will be displayed in the line.
To change value of a memory cell, select the byte and enter the new value from the keyboard. Alternatively, press Enter or double-click the selected byte and specify the new value in the Modify
Memory dialog. In the former case, the value will be entered immediately in the currently valid format of display. In the latter case, you have to specify the new value in accordance with the format
notation. The value will be assigned to the selected object of the size specified in the Object Size
area.
The Follow Address command serves to bring you to the cell with address, which is written in the
cell, in which the window cursor is staying.
Also, use the corresponding commands of the window local menu.
Local menu
The window local menu contains the following commands (there is the window toolbar button for
each command):
Version 1.1
Page 205 of 245
Error! Unknown document property name.User's Manual
Command
Description
Window Setup
Opens the Memory Dump Window Setup dialog.
New Address
Opens the Display from Address dialog. You can enter a number or
an expressions as well.
Modify Data
Opens the Modify Memory dialog.
Operations with
Memory Block
Opens the Operations with Memory Block dialog, which is to perform
operations with memory areas in target microcontroller address spaces:
fill the memory area with a value, search for data, copy, compare two
areas, invert, etc.
Follow Address
Opens the Follow Address dialog.
Address Owner
Determines the name of variable, which is located at the selected address. The command can determine variable name, SFR name, array
element index and structure member name.
Swap Fields
Moves the caret (jumps) to the corresponding location in the other part
of the window: from the cell in the dump to its corresponding ASCII
character and vice versa.
Also, the window toolbar has two buttons to set up the data breakpoints at the memory cell, whose
address corresponds to the caret position in the window:
BrkRd
Sets up the breakpoint on reading from this memory cell.
BrkWr
Sets up the breakpoint on writing to this memory cell.
The Memory Dump Window Setup dialog
This dialog sets up the data display parameters for the Memory Dump window.
Element of dialog
Description
Display Format
Sets the data display format. If the floating-point number format (Float)
is chosen, then the object size will be automatically set to DWord.
Object Size
Sets the object size for display: 1 byte, 2 bytes or 4 bytes (DWord).
Display Addresses
Sets displaying the address for each line of the dump (see example 1
below). If this option is disabled, the dump lines will appear as in example 2.
Version 1.1
Page 206 of 245
Error! Unknown document property name.User's Manual
Display ASCII Codes
Turns on the window right pane, which displays the ASCII codes (see
example 3 below).
Reverse Bytes Order
Sets the reverse byte order for display of words or double words (see
note 1 below).
Signed Values
Sets displaying all values as the signed ones.
Start Address
Specifies the start address for the dump area displayed in the window
(see note 2 below).
Window Title
Specifies the text string to display as the title for this window. It is useful
to distinguish several memory dump windows opened simultaneously.
If this field is left empty, then the window caption bar displays the window start address and the current memory unit address (after the dash).
Notes
1. Use the reverse byte order, if the program being debugged considers that the most significant
byte is located at the lowest address.
2. You can specify a variable start address to be calculated every time, when data is updated in
the dump window. The address can be set by a variable or expression and the window will always display the dump area starting from its current value. In this case, start address is fixed
and you cannot scroll data in the window. If you do not want to use the variable start address,
leave this field empty.
Example 1
C:0000: 01 00 02 03
C:0004: 01 00 02 03
Example 2
01 00 02 03
01 00 02 03
Example 3
C:0000: 61 62 63 64|abcd
C:0004: 00 65 00 00|.e..
The Modify Memory dialog
Use this dialog box to specify the new value for the current memory unit. The Memory Dump window title bar displays address of this unit in brackets. The software takes the size of the new value
in accordance with the setting in the Memory Dump Window Setup dialog. For example, if the object size is word and you type the new value of 2, then the 16-bit number 2 will be written to the
memory.
Except numbers, you can specify expressions as well.
Version 1.1
Page 207 of 245
Error! Unknown document property name.User's Manual
The Operations with Memory Block dialog
Use this dialog to specify an operation with data in the target microcontroller address spaces. The
PICE software allows you to carry out complex operations with memory blocks. For example, you
can take data from one address space, invert it and write into another address space.
The Source Address Space parameters specify the memory area with the initial data for the operation. The operation result will be placed into the area specified by the Destination Address
Space (by default, it is the same as the source buffer). If the operation does not need the destination address space (search and fill), the destination address parameters will be not available.
Element of dialog
Description
Start Address
The start address of memory area.
End Address
The memory area end address, inclusive. The destination area end address is determined from the source area size.
Full Range
Sets up the start and end addresses equal to those of the whole address space of the given type.
Version 1.1
Page 208 of 245
Error! Unknown document property name.User's Manual
The following operations are available through this dialog (see notes below):
Operation (flag)
Description
Fill with Value
Fills the buffer with a value (sequence of values) specified in the text
box on the right. Also, see How to Specify Values for Search and Fill.
Search for Data
Searches the source memory area for a value (sequence of values)
specified in the text box on the right.
Copy
Copies area of memory to another address. The block can be copied
within the same address space or to another one.
Compare
Compares the two specified memory areas. If the areas do not match,
the message box will inform about the mismatch addresses and data.
Confirm whether to continue the comparison operation.
Invert
Inverts the selected area contents bit-wise.
Calculate Checksum
Calculates the checksum for the source area of memory. See note below.
Negate Result
Specifies to subtract the checksum calculation result from zero (this
method is used sometimes).
Write Result to Destination
Specifies to write the 32-bit result to the destination sub-level, to the
address specified in the (Destination) Start Address field. If this flag is
off, the checksum will be displayed as a message.
AND with Value
Performs bit-wise AND operation for the specified memory area with the
operand specified in the text box on the right. See notes below.
OR with Value
Performs bit-wise OR operation for the specified memory area with the
operand specified in the text box on the right.
XOR with Value
Performs bit-wise XOR operation for the specified memory area with the
operand specified in the text box on the right.
Interpret Data as Assembly Instruction
Specifies to consider the entered value to be a machine instruction. If
this option is on, the PICE software will assemble this instruction (convert it into the machine code) and then perform your operation using
this machine instruction as the operand.
Notes
1. The source and destination memory areas may overlap: operations with memory areas are
carried out using the temporary intermediate buffer.
2. The Copy and Compare commands use the areas specified in the Source Address Space
and the Destination Address Space.
3. The checksum is calculated as a 32-bit value by simple addition. If the sub-level has the byte
organization, then the 8-bit values will be added. If it has the word organization (like the code
memory of Microchip PIC microcontrollers), then the 16-bit values will be added.
4. Logical operations (AND, OR, XOR) are performed with the contents of area specified in the
Source Address Space, while the operation result will be written to the area specified in the
Destination Address Space. The software takes the size of the specified operand in accordance with the memory unit size (the target device memory organization).
5. The script files and emulator use automation help to accomplish more sophisticated operations with memory blocks.
How to Specify Values for Search and Fill
Values can be entered in one of the three forms:
1) As a sequence of numbers separated by space, comma or semicolon. Numbers may have
any legal format. Examples:
Version 1.1
Page 209 of 245
Error! Unknown document property name.User's Manual
254
55H
0, 3, 66, 77h, 2
2) As a character string enclosed in double quotes. The string may contain the characters as well
as symbol constants in the C language format:
New line (line feed)
Horizontal tabulation
Vertical tabulation
Backspacing
Carriage return
Form feed
Backslash
Apostrophe
Quotation mark
Zero character (null)
HL (LF)
HT
VT
BS
CR
FF
\
'
"
NUL
'\n'
'\t'
'\v'
'\b'
'\r'
'\f'
'\\'
'\''
'\"'
'\0'
Also, you can specify the symbol by its hexadecimal value preceded by the symbols '\x' and
containing exactly two hexadecimal digits.
Examples:
"Copyright"
"Author:\r\nJohn Smith"
"Version: \x01"
3) As an assembly instruction. To do this, set up the Interpret Data as Assembly Instruction
flag.
The Follow Address dialog
This dialog box specifies parameters for the Follow Address command of the Memory Dump
window.
Specify the size of address value (whether the pointer is an 8-, 16- or 32-bit number), and in which
address space the new address is located. For example, the memory location at the caret position
contains 1234h and you specify to treat it as a 16-bit pointer to the Code memory. In this case, the
Memory Dump window will display the Code memory dump beginning from the address of 1234h.
Element of dialog
Description
Pointer Size
Specifies dimension of the current memory unit (where the caret is positioned): 8 bit, 16 bit (word) or 32 bit (double word).
Reverse Bytes Order
Sets the reverse byte order at the location interpreted as the destination
address: the byte located at the lowest address is considered to be the
most significant.
Version 1.1
Page 210 of 245
Error! Unknown document property name.User's Manual
Destination Address
Space
Specifies the target microcontroller address space, where the destination address is located.
The Memory Coverage window
This window displays coverage of the Code or Xdata memory during execution of your program.
The window has three tabs: the Graph tab, the Ranges tab and the Functions/Data Objects tab.
The Graph tab has the status bar (the gray bar between the toolbar and the working area of this
tab).
The Graph tab displays data in the form of rectangular cells, one cell per memory address. Coloring denotes the state of cell (see legend below).
The source text pane below (when on) displays the source text. It is convenient, because nothing
overlays the window and the cursor does not jump between windows. This pane has own toolbar.
The toolbar buttons, except for Show, correspond to the same buttons of the Source window.
However, you cannot edit the source text immediately in this pane.
To find the first byte of those occupied by the source text line, put the insertion point to the line of
interest in the source pane (click it), and click Show. To see the source text line in the source pane,
click the cell of interest in the upper pane. Also, when you point with mouse to a cell, the status bar
displays the cell address, the function name, the source file name and the number of the line with
the corresponding command, the command itself and the comment.
The Ranges tab lists the memory address intervals that have been accessed and have not. The
next interval begins immediately from the end of previous interval. The whole memory is divided
into intervals, which follow each other. This tab does not have the second pane.
To display the coverage after your program is stopped, you should read the data from the emulator
(press the Read button). The reading takes certain time, that is why PICE does not read coverage
data automatically and you have to explicitly force the reading.
The Functions/Data Objects tab lists all functions and data objects of each source file and draws
linear diagrams for them. For each function, PICE calculates percentage of the executed part of
program by the lines of source text (the green strip) and by the amount of memory in bytes (the red
strip).
Version 1.1
Page 211 of 245
Error! Unknown document property name.User's Manual
PICE cannot simultaneously perform coverage for both Code and Xdata memory. To control the
coverage function, use the Memory Coverage group of the Hardware Configuration dialog. If you
turn it off, PICE will load your program faster, because it will not have to clear the coverage data after the program is loaded. This is the only reason to turn it off.
By default, the Code coverage is on. If the target microcontroller does not have the on-chip Xdata
memory, then the Memory Access Coverage position is not available.
Legend
Generally, a combination of the background color and color of the center of the rectangle denotes
the state of cell in the Graph tab. The background colors are:
Gray
Not accessed yet.
Blue
Already accessed.
Dark gray
Not accessed yet and all addresses above these cells are not accessed yet.
Bright cyan Location of Program Counter.
Green
Address highlight marker for the first byte of the selected address, range or function.
Colors for the center are:
Red
The Function Under Cursor marker: marks all cells of a function, when the mouse
cursor points to any its cell.
Bright cyan The Function marker: marks all cells of a function, within which the Program
Counter is located.
Local menu
The window local menu depends on the currently active tab (the Graph tab has two menus). The
same commands of the window tabs are equivalent. There is the window toolbar button for each
command.
Command
Description
Origin - Display from
PC Location
Marks the cell, to which PC points, with green background color.
Display from Address
Marks the cell at the specified address with green background color.
Clear Coverage Data
Clears data about the accessed and not accessed cells.
Display Legend
Opens the Memory Coverage Legend box.
Memory Coverage
Setup
Opens the Memory Coverage group of the Hardware Configuration
dialog.
Version 1.1
Page 212 of 245
Error! Unknown document property name.User's Manual
Source Text Pane
Toggles the lower (source text) pane of the tab. Also, use the Source
Text Pane On/Off button on the tab toolbar ( ).
Show Address under
Cursor in Graph
Displays for the current text line in the lower pane of the Graph tab (the
line with the focus point):
• the first byte of the bytes that correspond to this line, with green
background.
• other bytes of the function that contains this line, as sequence of
cells with red center.
Mixed with Disassembly
The same command as for the Source window.
Origin
As above.
Toggle Code Breakpoint
As above. As compared with Run to Selected Function, this command
does not start execution.
Functions List
As above.
Edit File
Switches from the cursor position in the text pane of the Graph tab to
the same cursor position in the Source window with this file.
Help on Word under
Cursor
Opens the PICE-52 help file for the key word selected in the source
pane. This command is useful for the script sources.
Read Coverage Data
Reads all data about the accessed and not accessed cells.
Show Range under
Cursor in Graph
Switches to the upper pane of the Graph tab and displays the first byte
of the selected function with green background.
View Source
Attaches the separate Source window and displays the first line of the
selected function source text.
Run to Selected
Function
Sets a breakpoint at the entry point of the selected function and starts
execution.
Show Function under Cursor in Graph
Display Options
Switches to the Graph tab and displays the cells for the selected function: its first byte with green background and its body as sequence of
cells with red center.
Opens the Display Setup dialog. This command is present only for
the rightmost tab.
Expand Whole Tree
Opens the branches.
Collapse Whole
Tree
Closes the branches.
The Display Setup dialog
This dialog controls the display parameters for the Functions/Data Objects tab of the Memory
Coverage window.
Version 1.1
Page 213 of 245
Error! Unknown document property name.User's Manual
Element of dialog
Description
Sort Order
Sets the sorting order for the function and object names in the list: by
address of function/object, alphabetically or by the order of execution.
Display Source File
Names
Toggles displaying the source file names for the list items.
Display Item Icons
Toggles displaying the icons of the functions and objects in the list.
Display Typeless
Labels
Toggles displaying the typeless code labels. This is useful for debugging of assembly programs. With this flag being off, the tab displays
only the C function names.
Strip Path from File
Names
Turns off displaying the full paths for the source file names.
Full Function/Label
Description
Turns on displaying the types of functions and objects and their hex
addresses (in brackets), in addition to their names. For example, with
this flag on:
MyFunc [typeless] ()
Track Program Execution
(C:0027)
When on, specifies to track execution of the program in the window:
the window tracks which function is being executed at the moment and
highlights its name. The highlight moves, as you step through the program.
The typeless labels are highlighted only when PC points to the label
address.
The Memory Layout window
This window lists objects present in the memory (the microcontroller memory map). The objects are
special function registers, program variables, etc. The object occupies some area in the memory.
For each object, the window displays:
• Start address of the occupied area.
• Area size (in bytes), displayed in square brackets.
• Name of object (or names separated with commas, if there are more than one object located
at this address).
• Object value and description as in the Watches window.
Version 1.1
Page 214 of 245
Error! Unknown document property name.User's Manual
The letter in the first column of the window specifies the address space mapped. If no one object is
identified in an area of the address space, this area will be marked as:
*** No Names ***
The selected object is highlighted. To select another object, click it with the left mouse button or
use the arrow keys of the keyboard.
Local menu
The window local menu contains the following commands (there is the window toolbar button for
each command):
Command
Description
Inspect
Opens the Inspector window for the selected object.
Add to Watches Window
Opens the Watches window (if not opened yet) and adds the selected
object into it.
View as Dump
Opens the Memory Dump window (if yet not opened for this memory
area) and shows the selected object in it.
Modify Data
Opens the Modify dialog for you to enter the new value for the object
selected in the window. The new value will be immediately written into
the memory. This command is available only for scalar objects.
Display from Address
Opens the Display from Address dialog for you to enter the new address. The object at the specified address will be selected and displayed in the first line of the window.
View
Source/Disassembly
Displays the first line of text in the Source window and the Disassembler window corresponding to the selected object address. If the source
file for this particular module is not opened in the Source window, the
command will first open the window.
This command is available only when the window displays the Code
memory.
Toggle Code Breakpoint
Sets or clears the code breakpoint at the address of the selected object.
This command is available only when the window displays the Code
memory.
Also, the window toolbar has two buttons to set up the data breakpoints at the memory area occupied by the selected object:
BrkRd
Sets up the breakpoint on reading from this memory area.
BrkWr
Sets up the breakpoint on writing to this memory area.
Version 1.1
Page 215 of 245
Error! Unknown document property name.User's Manual
The Code Browser window
The Code Browser window provides extended navigation features between the program source
files and their functions. It displays the tree–like structure of the program being debugged. The
topmost level of the tree comprises the source text files. The second level displays the C function
names and typeless code labels defined in the corresponding source file.
The program structure is built from the symbol information included in the program executable file.
This window is empty until the program file with symbol information is loaded.
Local menu
The local menu of this window contains the following commands (there is the window toolbar button
for each command):
Command
Description
View Source
For the selected source file, activates the Source window with this file.
For the selected function or label, displays its first text line in the
Source window and the Disassembler window. Opens these windows,
if not opened yet.
Alternatively, double–click the function or label in the window.
Run to Selected
Function
Executes the program to the address of selected label or the start address of the memory area occupied by the selected function. Also, see
note below.
Toggle Code Break
Toggles the code breakpoint at the address of selected label or the start
address in the memory occupied by the selected function. Also, see
note below.
Display Options
Opens the Display Options dialog for this window.
Expand All Tree
Expands the whole tree structure. All branches become visible.
Collapse All Tree
Collapses the whole tree structure. The source files will be the only visible branches.
Note. For the Run to Selected Function and Toggle Code Break commands: if source file of an
opened project is changed, then the project will be re-built and after that, this command will be executed. For more info, see Working with Projects.
The Display Options dialog
In this dialog box, you can set up the display options for the Code Browser window.
Version 1.1
Page 216 of 245
Error! Unknown document property name.User's Manual
Element of dialog
Description
Sort Order
Sets the sorting order for the function/label names: by address of function/label or alphabetically.
Display Typeless Labels
Specifies to display the typeless code labels. This is useful for debugging of assembly programs. When this option is off, only the C function
names are displayed.
Display Item Icons
Display the icons (bitmaps) for source files, functions and labels.
Strip Path from File
Names
Specifies to remove the path from the source file full names (to display
only the file name and extension).
Full Function/Label
Description
Controls displaying the types of functions and their addresses (in
brackets) in addition to their names. For example, with this flag on:
Output
Track Program Execution
void(char) (C:02F5)
When on, specifies to track execution of the program in the window: the
window tracks which function is being executed at the moment and
highlights its name. The highlight moves, as you step through the program.
The typeless labels are highlighted only when PC points to the label
address.
The Disassembler window
This window displays the disassembled text of the program. You use it during debugging to view
the program code and observe execution of your program at the assembler level. If the loaded
code has the symbol information, you will be also able to see the code labels and names of functions; the instruction operands will be replaced with the symbol names, where possible (you can
disable this feature). When the loaded code does not have the symbol information, this window
plays the central role in the debugging.
Version 1.1
Page 217 of 245
Error! Unknown document property name.User's Manual
In the group of low-level instructions, which corresponds to a C operator, the first instruction is
marked with square on the left side. The lines with instructions, whose addresses correspond to the
code breakpoints and the current value of the target microcontroller PC, are highlighted. For example, the latter by blue stripe (the default color).
This window has the Quick Watch function and the on-line assembler. Also, you can turn on the
right pane, which is the same as that of the Source window. This pane displays values of the variables located in the corresponding lines of the left (main) pane.
Using the mouse
Operation performed, when you double-click the left mouse button or press the Enter key, depends
on the cursor position in the window client area:
• The instruction address. Opens the Display from Address dialog, where you can specify
the start address of another memory area for display in this window. You can specify the address as an expression.
• The instruction code and its mnemonic. Executes the program to the line, where the caret
is positioned.
Using the keyboard
If you place the caret at an instruction address in the uppermost source text line in the window, you
can just type the new address. The window will display the Code memory area beginning from this
address. Also, you can change the instruction codes in the same way. If you place the caret into
the field of mnemonic, you can start typing the new mnemonic and the Assembler dialog box will
open automatically.
Local menu
The local menu contains the following commands (there is the window toolbar button for almost
each command):
Command
Description
Run to Cursor
Executes the program up to the line, where the caret is positioned. Alternatively, double-click the necessary line in the window.
Assemble Instruction
Opens the Assembler dialog for you to enter the new instruction. After
that, assembles this instruction and places it at the address of the selected line. See note below.
Alternatively, click the instruction (assembly) field in a line and begin
typing the instruction from the keyboard. The Assembler dialog will
open automatically.
Toggle Code Breakpoint
Sets or clears the code breakpoint at the line, where the caret is positioned.
Toggle Banked
Breakpoint
Sets or clears the code breakpoint at the line (at the corresponding
Code memory address), where the caret is positioned.
For the address in the Common area, the breakpoint is set at this address in every bank. For the address in the Banking area, the break-
Version 1.1
Page 218 of 245
Error! Unknown document property name.User's Manual
point is set at this address only in the corresponding bank.
Set New PC to Cursor Location
Sets the microcontroller Program Counter to the address of the line,
where the caret is positioned.
Display from Address
Opens the Display from Address dialog for you to specify the new address. Alternatively, place the caret into the address field of the window
first line and type the new address.
Origin - Display
from PC Location
Displays the disassembled text from the address that corresponds to
the processor Program Counter.
Add to Watches
Window
Add the name under the caret to the Watches window. If there is no
Watches window opened, PICE will automatically open it.
Fill Memory
Opens the Operations with Memory Block dialog for you to specify
the memory area to be filled and the value, with which to fill. Other parameters specify the length of this value (byte, word, double word,
character sequence of variable length or a machine instruction).
View Source Code
Displays the source text operator (in the Source window), which corresponds to the current line. This operation is not always possible, because the symbol information (the source text included) is often unavailable for all program assembler instructions.
Display Symbols,
Where Possible
Switches to displaying the symbol names instead of numeric values,
where possible.
Display Source
Lines
Turns on displaying the source text lines, which correspond to the addresses.
Horizontal Scroll
Bar
Turns on the horizontal scroll bar.
Right Pane
Turns on the window right pane.
Note. The assembler supports symbol names and expressions. Examples of instructions:
MOVE
CALLS
TSTB
-(i3),i2l
UserFunc1
r2,#7
The Assembler dialog
Use this dialog to enter the new processor instruction and write it to the Code memory at the address of selected line in the Disassembler window. The upper part of the dialog box displays the
instruction in this line (it will be replaced). The assembler supports expressions and symbol names.
Version 1.1
Page 219 of 245
Error! Unknown document property name.User's Manual
Element of dialog
Description
New Instruction
Specifies the new instruction to be assembled.
History
Lists previous entered instructions.
Note that the window may display the instructions in the form not suitable for assembling, because
the displayed hexadecimal numbers do not end with "h" and may not start with a decimal digit.
Examples of instructions:
MOVE
CALLS
TSTB
-(i3),i2l
UserFunc1
r2,#7
Alternatively, you can just begin typing an instruction (just press any key) in the instruction (assembly) field of a line in the Disassembler window. This dialog will open automatically.
The Execution Time window
You may have need to know for how long has your program been running and how much time did it
take to execute the last step. This window displays both time values and the microcontroller clock
frequency. PICE measures the time intervals using the hardware real time timer.
The time calculation starts from the moment the real-time timer is reset (zeroed). After that, the
timer integrates all time intervals, when your program runs continuously or by steps, until it is reset
once more. For more about the timer, see Real-time Timer and Frequency Measuring System.
The execution time is calculated as the multiplication of the timer/counter value by the system clock
period measured. That is why the number of clocks is always the absolutely exact value, while the
indicated execution time may be not accurate, if the system clock frequency has been changing
during execution of your program. You should keep this in mind and use the time data for estimation only.
The Time field displays the total time elapsed from the reset of the timer.
The Last field displays the time your program has been
running since the most recent stop (when you run it by
steps). For example, after a machine instruction is executed, this line displays the execution time of that instruction. After a C operator is executed, it displays the total
execution time of the instructions this operator includes,
and so on.
The Freq field displays the clock signal frequency (the frequency at the microcontroller pin). This is
the current measured frequency, at which the microcontroller operates.
The Clocks field displays the amount of clock signal periods counted from the start of emulation.
Loading a program for debugging automatically resets the real-time timer. To turn off this feature,
use the Debug Options dialog, the Reset Time Counter flag (through the Configure menu). To
zero the timer manually, use:
• The local menu command of this window.
• The Run menu, the Time Counter Reset command.
To set up another frequency, use the local menu command or the Configure menu, the Hardware
Configuration dialog.
Local menu
The window local menu contains the following commands (there are the window toolbar buttons for
the second and third command):
Version 1.1
Page 220 of 245
Error! Unknown document property name.User's Manual
Command
Description
Reset Clocks Counter
Clears the real-time timer.
Reset MCU
Resets the emulation microcontroller.
Modify MCU Clock
Frequency
Opens the Hardware Configuration dialog for you to specify the new
clock generator frequency (in kHz).
The Peripheral Device window
The Peripheral Device window shows the state of peripheral devices of the microcontroller (such
as timers, interrupt system, etc.). Window of this type collects all information about a peripheral device and its mode of operation in one place. Information is organized in the form of fields. The currently active (selected) field has red border around it. To select another field, click it with the left
mouse button.
In some cases, a window for one device may include a field relative to another device, which
closely interoperates with the former.
You can program the corresponding device directly from this window.
Local menu
The window local menu contains the following commands (there is the window toolbar button for
each command):
Command
Description
Modify
Changes the value in the selected object. If the value is numeric, the
command opens the Modify dialog for you to enter the new value. If the
value is one bit, the command inverts its value.
Options
Opens the Options dialog, where you can set the display format for the
selected field (hexadecimal, decimal, binary or ASCII).
Add as Watch
Adds the selected field to the Watches window.
Increment
Increments the value in the selected field by one.
Decrement
Decrements the value in the selected field by one.
Set to Zero
Sets the value in the selected field to zero.
Set to all 1s
Sets every bit of the selected field to 1.
The Options dialog
Use this dialog box to specify the display format for all values in the numeric fields of the Peripheral Device window.
Version 1.1
Page 221 of 245
Error! Unknown document property name.User's Manual
Element of dialog
Description
Display Format
Specifies the data display format (binary, hexadecimal, decimal or ASCII).
Use This Format for
All Numbers
Specifies to apply the selected display format for all numeric fields in
the window.
Note that for some fields, changing the display format is disabled.
The Tracer window
This window displays the contents of the hardware tracer buffer in the form of a data table. Each
line corresponds to one trace buffer frame and contains the buffer frame data displayed in fields of
fixed length. The fields of the same type form columns in the window. The first non-scrolling line of
the window contains the column titles.
Depending on its settings, this window displays the following fields:
Column title
Description
Frame
The frame number.
Time
The frame time information in the specified form.
Ext 7..0
The states of external inputs.
BPP
The states of complex breakpoint triggers.
I
The Idle mode indicator.
P
The Power Down mode indicator.
R
The state of the external RESET signal.
S
The state of the internal RESET signal.
DA
The internal direct data address.
DD
The internal direct data.
T
The internal direct data access type.
D
The indicator of the currently selected pointer (DPTR0 or DPTR1).
C
The Code memory state.
Code/Xd
The Code/Xdata bus cycle type.
Addr
The Code/Xdata address.
Version 1.1
Page 222 of 245
Error! Unknown document property name.User's Manual
Op
The instruction opcode or MOVX data.
Instruction
The instruction mnemonic, which corresponds to the opcode, disassembled from the Code memory.
Source
The source text line corresponding to the instruction, if available.
When you place the cursor over a column title for two seconds, the small yellow box appears with
short description of this column.
The time benchmark frame is marked with the red background. The selected (current) frame is
highlighted with black background. Each frame field may be displayed in its own color. The Colors
tab of the Environment dialog contains all color parameters.
Local menu
The local menu includes the following commands (there is the window toolbar button for each
command):
Command
Description
Window Setup
Opens the Tracer Window Setup dialog.
Clear Trace Buffer
Clears the trace buffer.
Display Source Code
Displays the program text, which corresponds to the selected frame, in
the Disassembler window and, if possible, in the Source window.
Set Time Benchmark
Sets the time benchmark at the selected frame.
Copy Trace Buffer
Contents to a File
Opens the Copy Trace Buffer Contents to File dialog.
Search Trace Buffer
Opens the submenu with the following three options for search:
Display from Frame
Number
Opens the Display From Frame Number dialog.
Search for Frame
Contents
Opens the Search for Frame Contents dialog.
Search for External
Input Levels
Opens the Search for External Input Levels dialog.
Next Search
Repeats the search once more with the parameters and options specified in your previous search.
Source Text Pane
Toggles on/off the text pane of the window. It corresponds to the
. The split
Source Text Pane On/Off button on the window toolbar:
border may be horizontal or vertical (see the Tracer Window Setup
dialog). Also, see note below.
Note. Most commands of text pane local menu correspond to the same commands of the Source
window. The Edit File command opens the Source window with the corresponding source file (if
not open yet), activates this window and puts the cursor in the corresponding text line.
Trace Buffer Frame
The trace buffer frame is a set of data captured at the moment of time, when the frame is recorded.
Frames are numbered in the converse order beginning from 0. The number of the last frame is always 0, and the preceding frames are numbered in the form of "–N", where N is the frame ordinal
number relative to the last frame.
Each frame is 16 bytes large and contains the following data:
Version 1.1
Page 223 of 245
Error! Unknown document property name.User's Manual
Frame field
Description
Time
The time stamp, which is the image of the four lower bytes of the realtime timer/counter. For info about displaying this parameter, see below.
For more info about the timer, see Real-time Timer and Frequency
Measuring System.
(4 bytes)
Ext 7..0 (1 byte)
The states of 8 external input signals (in either binary or hexadecimal
format). The signals are applied to the tracer inputs over the tracer cable.
BPP
The states of the complex breakpoint triggers (T0..T3). Character x
means the corresponding complex breakpoint trigger operated at the
moment of time the frame was recorded.
(4 bits)
For more about breakpoint triggers, see Hardware Breakpoint Processor.
I
(1 bit)
The indicator of the Idle mode.
P
(1 bit)
The indicator of the Power Down mode.
R
(1 bit)
The state of the external RESET signal.
S
(1 bit)
The state of the internal RESET signal.
DA
(1 byte)
The internal direct data address.
DD
(1 byte)
The internal direct data.
T
(2 bits)
The internal direct data access type:
R
read direct data.
W
write direct data.
D
(1 bit)
The indicator of the currently selected pointer:
0
DPTR0 selected.
1
DPTR1 selected.
C
(1 bit)
The Code memory state:
I
internal.
E
external.
Code/Xd (1 byte)
The cycle type of MCU Code/Xdata bus. PICE recognizes the following
bus cycle types of the 8051 microcontrollers:
Inst instruction fetch.
Opnd Code operand fetch.
Rd
Xdata operand read. Rd/XDATA is for the off-chip Xdata;
Rd/XRAM is for the on-chip Xdata; Rd/EEPROM is for
the EEPROM Xdata.
Wr
Xdata operand write.
MOVC MOVC operand fetch.
IRQ interrupt request cycle.
Idle Idle cycle.
Addr
(3 bytes)
The Code/Xdata address, the value in the address bus A[23..0].
Op
(1 byte)
The instruction opcode or MOVX data, the value in the data bus D[7..0].
Displaying the frame time stamp
The frame time stamp can be represented in the following ways:
• As amount of the CPU clock cycles, which does not depend on the clock frequency.
• In microseconds as calculated from the number of cycles and the operational clock frequency.
This value is inversely proportional to the clock generator frequency.
• As absolute value in accordance with the emulator internal cycle counter or relative to the
time benchmark time stamp. In the latter case (the default setting), the fetch duration is shown
as the value relative to the time benchmark.
The time benchmark serves for measuring the time intervals between the frames.
Version 1.1
Page 224 of 245
Error! Unknown document property name.User's Manual
The Tracer Window Setup dialog
Use this dialog box to set up the Tracer window configuration. The flags and radio buttons set up
display of the respective tracer frame parameters for each frame.
Element of dialog
Description
Frame Contents
(fields)
Lists all available frame fields. The window displays the ticked off fields
in the order as they are listed here.
Move Up, Move Down
Moves the selected item in the Frame Contents list one position up
(down).
Frame Time Setup
Sets displaying the information about the frame duration and its format.
Display External Inputs in
Sets the format for values in the corresponding field.
Source Text Pane
Split
Specifies orientation of the window split movable border.
Symbol Names in
Disassembler
Sets inserting the symbol names into the tracer disassembler, wherever
possible.
Allow Reading of
Trace Buffer at Runtime
When on, permits reading the trace buffer at run-time. This flag is
equivalent to the same flag in the Hardware Configuration dialog (the
Emulation MCU Options group).
To split the window (to toggle on/off the text pane), click the Source
Text Pane On/Off button of the window toolbar.
The Display from Frame Number dialog
The Tracer window will display the trace buffer contents beginning from the frame, whose number
you enter in this dialog. The input text box title specifies the allowable range for the frame number.
Note that the lower boundary of the range is of negative sign, because the frames are numbered in
the converse order (beginning from 0).
Version 1.1
Page 225 of 245
Error! Unknown document property name.User's Manual
The Search for Frame Contents dialog
In this dialog box, you specify the tracer frame parameters to search for in the trace buffer, as well
as the search options. The frames, whose parameters match the specified search arguments, will
be found and displayed in the window.
Note. If a flag is left off, PICE will ignore the corresponding parameter during the search.
Element of dialog
Description
Code/Xdata Address
Specifies the address to search for in the form of a number or expression. The Symbols button opens the Code Address dialog with the list
of symbol names of available C functions and assembly subroutines.
Opcode/Data
Specifies the data bus value to search for. The Instruction button
opens the Assemble Instruction dialog (the on-line assembler) for you
to type in an instruction. Note that some of the instruction opcodes are
relative to the Program Counter of the target microcontroller.
Internal Data Address
Specifies the 8-bit address to search for.
Internal Data Data
Specifies the 8-bit direct data value to search for.
External Inputs
Specifies the combination of external inputs (Ext 7..0) to search for.
Each check box represents one input and may be in one of the three
states:
• Unchecked for the input state of 0.
• Checked for the input state of 1.
• Indeterminate for ignoring the input state.
State Bits
The boxes specify the state and modes of the emulation microcontroller
to search for.
Each check box may be in one of the three states:
• Unchecked for the disabled flag (e.g., 'trigger did not operate').
• Checked for the enabled flag (e.g., ' trigger operated').
• Indeterminate for ignoring the flag.
Version 1.1
Page 226 of 245
Error! Unknown document property name.User's Manual
Code/Xdata Bus Cycle
Sets the type of bus cycle to search for. If you select Any, the bus cycle
type will be ignored during the search.
Xdata R/W Cycle
Specifies the type of Xdata memory accessed.
Internal Data Bus Cycle
Specifies the cycle of the internal Data bus to search for.
DPTR Select
Specifies the DPTR Select state to search for.
Search Direction in
the Trace Buffer
Specifies one of 4 possible directions of search:
• Backward from the current frame.
• Backward from the buffer end.
• Forward from the current frame.
• Forward from the buffer beginning.
The Search for External Input Levels dialog
In this dialog box, you specify the combination of levels at the external inputs to search for in the
trace buffer, as well as the search options.
Element of dialog
Description
Combination of Levels
Each button in this group sets the level at the corresponding external
input. Successive clicking the button switches the search argument for
the input between the values:
Any Level
means the state at the input will not be checked.
Rising Edge
means the level change from 0 to 1.
Falling Edge
means the level change from 1 to 0.
Level Change means any change of level.
0
means the level of logical 0.
1
means the level of logical 1.
Search Direction in
the Trace Buffer
Specifies one of 4 possible directions of search:
• Backward from the current frame.
• Backward from the buffer end.
• Forward from the current frame.
• Forward from the buffer beginning.
Version 1.1
Page 227 of 245
Error! Unknown document property name.User's Manual
The Console window
The Console window displays messages of PICE. The error messages are marked with red
square. The information messages are marked with green square.
If the Console window is not open, then all the messages will be displayed in the message box
with the OK and Help buttons. If you open the Console window, then the message box will not appear and the subsequent messages will be displayed in this window. It is convenient to use the
Console window, because:
• You can see the last 256 messages and get help for any of them.
• The messages do not require any your response. However, when this feature is inexpedient,
you can turn on displaying all messages in the message box (use the Configure menu, the
Environment dialog, the Misc tab, the Always Display Message Box option).
The Console window stores the last 256 messages even if it is closed. You can open it at any time
to view the messages.
The selected message is highlighted. To select another message, click it with the mouse button or
use the arrow keys of the keyboard.
Local menu
The window local menu contains the following commands (there is the window toolbar button for
each command):
Command
Description
Help on Message
Displays help for the selected message.
Clear Window
Deletes all messages from the window.
The User window
The User window is intended for drawing or displaying text in them with the help of graphical output
functions accessed from script files (SF). Also, the User windows allow you to respond to events
(see WaitWindowEvent). With this capability, you can organize window operation in the interactive
mode. For more info, see Script Files and Emulator Use Automation.
To open the window, SF uses function OpenUserWindow.
All functions working with windows (and the User window) obtain the window identifier (handle) as
a parameter. Therefore, you can have several windows of this type opened at the same time.
Version 1.1
Page 228 of 245
Error! Unknown document property name.User's Manual
The User window toolbar contains 16 buttons (0...F). Pressing the button generates the
WE_TOOLBARBUTTON event.
The windows of this type do not have the local menu.
The I/O Stream window
Script files (SF) use windows of this type to display I/O streams in the form of text. The most usual
examples of the I/O streams are the text output into the window and input of characters from the
keyboard. Also, you can reassign the I/O streams to files and input data from files. For all these
purposes, SF uses the window operation functions.
To open the window, SF uses function OpenStreamWindow. For more info, see Script Files and
Emulator Use Automation.
The functions, which operate windows (the I/O Stream window included), receive the window identifier (handle) as a parameter. Therefore, you can have several windows of this type opened at the
same time.
When the text display function sends text to this window, the window displays the text from the current cursor position. To begin the next line, this function shall output '\n' (the line feed characters).
The window features two text display modes: with the automatic line advance (Wrap) and without it.
In the automatic line feed mode, every text line, which does not fit in the window, is wrapped to the
next line. In the other mode, if the line does not fit in the window, its end will lay beyond the window
border (cannot be seen). The Wrap button in the toolbar toggles window between these modes.
The Clear button clears the window contents.
The windows of this type do not have the local menu.
The Script Source window
Use this window to develop the script file (SF) source text and debug the script. In fact, this window
is the Source window and all usual commands of the Source window are operational there as well
(for example, Search for Text, Next Search, and so on).
Additionally, this window is equipped with necessary debugging functions. Syntax constructions
and the lines, which correspond to the current PC value and the set breakpoints, are highlighted in
the SF text (for more info, see Syntax Highlighting).
The source text lines, for which the compiler has generated the executable code, are marked with
the square in the first position.
Local menu
The window local menu contains the following commands (there is the window toolbar button for
each command):
Command
Description
Step
Executes one step (operator) of the script.
Run
Starts continuous execution of the script.
Run to Cursor
Executes the script up to the line, where the caret is positioned (the corresponding address). Alternatively, double-click the line to carry out this
command.
Version 1.1
Page 229 of 245
Error! Unknown document property name.User's Manual
Origin
Displays the source text from the line, whose address corresponds to
the SF Program Counter. This operation is not always available, because for some program addresses, there are no corresponding source
text lines.
New PC
Sets the SF Program Counter value to the address corresponding to the
line, where the caret is positioned.
Toggle Breakpoint
Sets up or clears the breakpoint at the address corresponding to the
line, where the caret is positioned.
Add to Watches Window
Opens the Watches window (if not opened yet) and places the name at
the caret position into it.
Restart
Restarts the script.
Note. To get help on a function or variable, point this function or variable with the cursor and press
Alt+F1. For more info, see How to Debug a Script File and Script Files and Emulator Use Automation.
Version 1.1
Page 230 of 245
Error! Unknown document property name.User's Manual
Using the Emulator
Scenarios of Use
PICE gives you flexibility to choose the way of development, which suits you better. You can employ the PICE emulator in two ways:
• As an external debugger for your own software development tools.
• As an integrated development environment (IDE) for the whole development process.
In the latter case, the whole your work on the microcontroller embedded programs takes the form of
a project and this gives you maximum ease and convenience. For more about IDE, see Working
with Projects.
It is supposed that first you complete developing your target device and then connect the emulator
to it and begin developing the embedded software. The primary option for PICE is to work while being directly connected to the target device.
Nonetheless, you can begin developing your software even before your target device is finished.
Just use the emulator hardware in the standalone mode.
The standalone mode means that the emulator operates without the adapter and target device
connected to the emulator (the disconnected adapter indicates to the emulator that it is not connected to any your target board). The emulator has all the necessary resources for such operation:
the code and data memory, clock generator, power supply, etc. All these resources provide exact
real-time emulation for the target application.
Moreover, you can begin working without the hardware emulator at all. In the Demonstration mode,
the PICE software runs without the hardware emulator and, despite that, is capable of full–scale
software development.
For more about preparing the emulator hardware for this or that use, see Preparing the Emulator
Hardware.
PICE as External Debugger
This way is the minimum scenario of using the PICE emulator. This way supposes you have an external development tool, which supports your target microcontroller. You use this tool to develop
your programs from the very beginning to the loadable (executable) module. Once the module is
ready, the further steps are for the PICE emulator:
1. Load your program executable module with the Load Program dialog (the File menu, the
Load Program for Debugging command). In this dialog, specify the executable module file
name and format. The Address Space radio button is set to Code by default. Other positions
of this radio button are for loading a data file or initializing the peripherals.
For the symbol and HEX file formats, the Start Address field is unavailable, because they
provide the start address themselves. For the binary format, you need to specify the start address, beginning from which the file will be loaded in the emulator memory.
2. Test your program for correct operation. Start it with any command, which requires running
your program (Step, Step Over, Run, Run to Address or Run to Cursor in the Run menu).
If the executable file is in the symbol format and the file includes the symbol debugging information, the Source window will open in the Debugger mode with the program source text. In
this mode, the Source window performs only the debugging actions.
If the executable file format is HEX, the Disassembler window will open and the debugging
will proceed only on the disassembled text.
3. As you find an error in your program or incorrect operation, switch to the external development
tool (just have it launched already), correct the source text and make the executable file. Reload the corrected executable file with the File menu, the Reload Program command. This
command does not open the Load Program dialog. Instead, it reuses the previously set parameters.
4. Repeat the above steps. Use breakpoints. Go on until the debugging is over.
Version 1.1
Page 231 of 245
Error! Unknown document property name.User's Manual
The Demonstration Mode
In the demonstration mode, the PICE software operates without the PICE hardware. You can work
without the hardware emulator at all. The demonstration mode serves primarily for demonstrating
the emulator functionality. In this mode, however, you can perform full-scale development of programs using the PICE integrated development environment (IDE). Also, PICE works as a simulator
of the 8051 instructions and you can do some debugging. Simulation of interrupts is supported. For
more about IDE, see Working with Projects.
To start PICE in the Demo mode, specify the /M switch in the command line. Also, use the “PICE52 Demo” shortcut in the Windows Start menu. Alternatively, switch the PICE software to this
mode by clicking the Demo button in the PICE-52 Communication dialog in the beginning of session.
Features not supported in the Demonstration mode
• Settings of the Hardware Configuration dialog are ignored.
• The hardware breakpoint processor is not simulated. You can make any BPP settings, but all
of them are ignored.
• The Tracer window always displays the same predefined set of frames.
Preparing the Emulator Hardware
WARNINGS:
1) TURN OFF THE EMULATOR HARDWARE AND THE TARGET DEVICE BEFORE ASSEMBLING, DISASSEMBLING, CONNECTING OR DISCONNECTING THE EMULATOR HARDWARE.
2) The adapter connectors are mechanically fragile parts. Please handle the emulator with care
and do not apply excess force to not destroy the connectors, when connecting the emulator to
or disconnecting it from the target board.
3) Take care to correctly insert the adapter connector into the target microcontroller socket. Incorrect insertion will cause damage in the emulator hardware and the target device.
Preparing for operation in the standalone mode (without the target device):
• Connect the main board to the POD, which corresponds to the chosen target microcontroller.
• Connect the emulator (see General View of Emulator) to a free COM port of the computer using the RS-232C communication cable. Use the cable included in the PICE delivery kit.
• Connect the power cord to the power connector of the emulator main board. Use only the included power supply unit.
• Turn power on.
Once these steps are accomplished, the emulator hardware is ready for operation in the standalone mode. Now you can run the PICE-52 software.
Preparing for operation together with the target device:
Perform the first three steps of those mentioned above and additionally perform the following procedure:
• Connect the POD board to the emulator package adapter, which corresponds to the chosen
package type.
• Connect the adapter (the emulator with adapter) to the target board. In case of DIP or PLCC
package, just remove the target microcontroller from the target device and insert the adapter
connector into the microcontroller socket on the target. If the target microcontroller is in SOIC,
SOP, QFP, BGA or similar types of packages, see Using QFP Package Adapters for more
info.
• Make sure that there is no short circuit between the power supply and GND circuits (test with
an ohmmeter).
Version 1.1
Page 232 of 245
Error! Unknown document property name.User's Manual
• Turn on the emulator and the target board one after another as quickly as possible.
Working with Projects
The preferred way of developing programs with PICE is the development with the use of its integrated Project Manager. With IDE, the development work is easy and convenient. The whole your
work on the microcontroller embedded programs takes the form of a project (see Concept of Project).
The PICE software is a shell, which interacts with external compilers. It does not have its own compilation tools. Usually, projects include and make use of many details and adjustments in regard to
the target microcontroller: the compiler settings, the address maps (in case of cross-development),
etc. IDE keeps all these parameters consistent and provides a set of advanced facilities for your
development process. With IDE, you can begin the development immediately. The project configuration file stores various parameters of the project.
The same Source window is used for both writing the source text and the debugging. The integrated project manager will transparently switch between editing and debugging. For example, you
can write a few lines of code and hit the Run to Cursor, Set Break, Run buttons, etc. IDE will
automatically re-compile and re-link your program, load it into the hardware emulator memory and
execute to the cursor or breakpoint.
A project is usable in both emulator and simulator: you can create and develop project in the simulator and, at some stage, open it in the emulator and go on further development, and vice versa.
You can combine capabilities of the two products for the benefit of your project.
Note. If you work in the simulator and keep some of its specialized windows open, after that close
the project and open it in the emulator, then the specialized windows of simulator, which are absent
in the emulator, will not be removed from the project configuration, but just not displayed. Later,
when you open your project in the simulator again, the simulator will display these windows as earlier.
To develop a project in IDE, the steps will be as follows.
1. Create the new project (see How to Create a New Project). The Project window for the new
project opens with all file groups being empty. The file groups for the source files (ASM
Sources, C Sources) in this window correspond to the working languages of the compiler.
2. Add necessary source files to the project (see How to Add Source Text File to the Project).
Later, if necessary, delete source file(s) from the project (see How to Delete Source File from
the Project).
3. Develop your source files (see How to Begin Editing the Source Text File) in the Source window.
4. When necessary, save the project (see How to Save Project) and make a break. Later, load
the project and continue your work (see How to Load an Existing Project).
5. Make the executable module of your program (see Building Project with Project Manager).
The resulting object modules, the loadable file(s) and other files will automatically get into their
respective file groups in the Project window.
Note. After compilation, the Messages window may contain the compilation error messages.
Also, the Project window informs about the total amount of errors and warnings, if any occurred, for each source file in the project.
6. Debug your program using IDE. To load the program into the emulator hardware and start debugging, just invoke any debugging command: Step, Run, Run to Cursor, Set a Breakpoint,
etc. (any local menu command or any button on the Source window toolbar). The Source
window will implicitly switch to the Debugger mode.
Note that you even do not need to make the project explicitly. If you have changed the source
file(s), each debugging command (Step, Run, etc.) will launch the Project Manager before
PICE executes this command. After that, if no errors are found out during compilation, PICE
will automatically reload the program into the emulator memory.
If the program is already loaded into the emulator memory and you have not changed it after
the loading, PICE will not reload it afresh.
Once you make any editing action in the Source window, while it is in the Debugger mode, it
immediately switches to the Editor mode (with no additional indication or message about this).
Version 1.1
Page 233 of 245
Error! Unknown document property name.User's Manual
In this mode, fix the bugs in your source file and go on testing the program for correct operation.
Your program is ready, when you are satisfied with its performance.
Also, read the following topics to learn more how to work with projects:
How to Interrupt Work on the Project
How to Compile the Source Text File
Scanning of the Selected Source File Dependencies
Adding Explicit Dependencies to Source File
How to Change Compilation Options for One Source File
How to Set up Cross-tools
Supporting Projects for Additional Cross-tools
How to Add a Cross-tool
How to Delete a Cross-tool
Developing and Debugging Programs with Memory Banks
Also, the PICE software features a tool for arranging your projects in a tree-like structure, the project repository tree.
Concept of Project
PICE provides full–scale support for development of programs for microcontrollers. You can edit
the program source texts, compile the projects by clicking single button and transparently switch
from editing to debugging. You do not need to remember compiler options and linker command
lines, because all of them are set up through the user-friendly dialog boxes. All of the above takes
the form of a project.
PROJECT is a set of parameters that describe your task:
• Project NAME and comments on the project.
• Names of all SOURCE files used in the project.
• Project OBJECTIVE (a promable file or a library).
• Operation mode of the Project Manager.
• Tool set used for this project (the compiler, linker, assembler and librarian) and their configuration.
• Default paths to the library files; the INCLUDE files and executable compiler files.
• Current state of the project and the desktop (the window of PICE) configuration.
PICE keeps the specified parameters throughout the development process until you change them.
Project Configuration File
Each project in PICE has own configuration file. PICE creates this file on the disk, when you save
the newly created project for the first time. The file contains the project and compiler parameters,
and screen configuration.
If you are working with a project and close PICE or load another project, PICE will save the current
state and parameters of the currently opened project in its configuration file. When you load this
project next time, PICE restores all the project parameters from its configuration file. As a result,
you continue developing or debugging the program as if you have not interrupted.
The project configuration file name is prj_name.ide, where "prj_name" is the project name. The
file resides in the project directory.
How to Create a New Project
To create the new project, use the Project menu, the New command.
In the Create New Project dialog, specify parameters for this project in the General Properties
group, select a cross-tool kit in the Cross-tools group and click OK. The previously loaded project,
if any, will be automatically saved. Other project options will be set to their default values.
Version 1.1
Page 234 of 245
Error! Unknown document property name.User's Manual
Later, you can change the cross-tools and their parameters (see How to Set up Cross-tools).
When you work with multiple projects and use the same source files, it is expedient to have individual directory for each project and to specify different paths for their output files in the Folders group
of the Create New Project dialog. This ensures that the Project Manager works correctly (takes the
correct object files, when comparing the dates, and so on).
How to add source text file to the project
To add a file to the project:
• Select the source file group for the respective programming language in the Project window
and click the Add button on the Project window toolbar (or use the Add File to Project
command in this window local menu).
• Specify the new file name in the Add File to Project dialog.
• Set up Copy Files to the Project Directory flag (we recommend to set this flag up).
• Click Open.
If a source file that you specified does not exist, PICE will create it in the project folder.
If you add the existing source files to the project and they refer to include-files (except for the standard include-files of the compiler software kit), you need to manually copy all these include-files to
the project directory. However, you do not have to add these include-files to the project using the
Add File to Project dialog.
How to delete source file from the project
To delete a file from the project:
• Select this file in the Project window.
• Click the Delete button on the window toolbar or use the Remove File from Project command of this window local menu.
If the source file has the directly dependent files, they will be also deleted from the project. For
more about dependent files, see Adding Explicit Dependencies to Source File.
How to begin editing the source text file
To open the Source window for a file of the project:
• Select this file name in the Project window.
• Click the Edit button on this window toolbar or choose the Edit File command in the window
local menu, or double-click the file name in the window.
Note. After compilation, the Messages window may contain the compilation error messages.
How to save project
To save the currently opened project, use the Project menu, the Save command.
PICE automatically saves the current project, when you load another project or close the project or
PICE itself. If there is an opened project when you close PICE, this project will be automatically
loaded next time PICE starts, provided that PICE starts from the same project directory.
How to load an existing project
To load an existing project, use the Project menu, the Open command. In the Open Project dialog, specify the project name and click OK.
Each time you launch the PICE software, it opens with the last project you worked with during the
previous session. Once opened, this project sets the emulator working parameters. When you load
a project, its directory becomes the current directory for PICE.
Version 1.1
Page 235 of 245
Error! Unknown document property name.User's Manual
Building Project with Project Manager
Choose the Project menu, the Make command, or click the Make Project button on the PICE toolbar. The Project Manager starts and:
• Checks if the project has been changed after the last building. If it has, then at least the linker
or the librarian starts (it depends on the project objective). To specify the project objective (a
promable file or library), use the Make Options group (the Project menu, the Options command, the Project Options dialog).
• Compares the dates of source files of the project, explicit dependencies and object files (if exist already). If the date of the source file or any of the directly dependent files is later than the
date of the corresponding object file, this source file will be recompiled. For more about dependent files, see Scanning of the Selected Source File Dependencies and Adding Explicit
Dependencies to Source File.
• Compares the dates of INCLUDE files (the files added to the project during compilation by the
INCLUDE directive) and the dates of object files for the project components (for which the INCLUDE files are looked for). If the files are modified since the last compilation, then the corresponding source file will be recompiled.
The Scan AutoDependencies flag in the Make Options group controls whether to perform this
comparison. If this flag is on, PICE will scan the project source files and any implicit dependencies
will be found out. In the C or assembler source files with correct syntax (here, the assembler version and compiler type used in the project is taken into account), the Project Manager will process
an INCLUDE file specified with the INCLUDE directive only, if it is specified explicitly and not by
means of identifier. For example, the ANSI C standard allows using an identifier in the INCLUDE directives.
While scanning, the comments that are allowed in the compilers are traced and the conditional
translation directives are not traced. As a result, some extra source files may be recompiled, however, this is preferable to an "insufficient" compilation.
• Compares dates of object files created by compiling the project source files, dates of object
and library files, which take part in the project, with the date of the project objective (the promable file or library), if it is created earlier. If any object or library file has the later date than
the project objective, then the linker or librarian will start and create the new promable file or
new library file.
If you change parameters of the compiler, assembler or linker, choose another target microcontroller type for your project or change certain paths in the Folders group, then it will be better to use
the Project menu, the Build All command to recompile and build the whole project. Otherwise, using the Project Manager may result in some files translated with one set of parameters and other
files translated with the different set of parameters (for example, the type of processor). This may
cause an error, which will be very hard to identify.
How to interrupt work on the project
You may want to temporarily stop working on the project. To stop working on a project and save it,
use the Project menu, the Close command.
How to compile the source text file
To compile a file:
• Select this file name in the Project window.
• Click the Compile button on this window toolbar or choose the Compile command in this
window local menu.
Also, if the Source window is opened with this source file, then click the Compile button on the
Source window toolbar or choose the Compile command in the Source window local menu.
Version 1.1
Page 236 of 245
Error! Unknown document property name.User's Manual
How to change compilation options for one source file
The elements of project may have individual options and different elements may have different options. For example, the disabled output of debug information, added description to this element, or
the disabled display of information about the previous compilation in the Project window.
To specify an individual set of options for a file:
• Select this file name in the Project window.
• Click the Setup button on the window toolbar or choose the File Options command of the
window local menu. In the File Options dialog, modify the options for this file.
How to set up cross-tools
You can set up the cross-tools to be used in the project or change the chosen cross-tools and their
parameters later. To do this, use the Project Options dialog, the Cross-tools group and its subordinate groups (through the Project menu, the Options command).
Supporting Projects for Additional Crosstools
Initially, the Cross-tools group of the Project Options dialog lists the cross-tools, with which the
PICE program can interoperate when working with projects. If you need to use a cross-tool, which
is absent in this list (an unspecified additional package), then the PICE program will be able to interoperate with this package, however, after you provide info about the tools of this package.
When developing and debugging the user programs, the PICE program interoperates with the additional cross-tool package in the same way as it does with any package of the built-in list mentioned
above.
In this way, you can add any number of cross-tool kits to the list of the Cross-tools group. You can
delete the added kits from the list.
How to control
To set up the PICE program for working with the additional cross-tool package, use the Crosstools group of the Project Options dialog. Also, see How to add a cross-tool and How to delete a
cross-tool.
Restrictions when working with additional cross-tools
At the moment, there are the following restrictions:
1. For the project files or folders that are related with your project and specified in the Folders
group, it is better to avoid using long names or names with space, for example, «Project_File_One.c» or «File one.c». The reason is that some cross-tools, or their earlier versions, do not support such names. If you specify such names anyway, then the output files will
get the corresponding short names, for example, «projec~1.obj» instead of «Project_File_One.obj».
2. You cannot specify the project objective as a library in the Make Options group, because of
essential differences in behavior of library utilities of some cross-tool packages.
3. The Output Directory field of the Folders group is not available, because not every crosstool can work with files in another folder except for the current one.
How to add a cross-tool
Press the Add Custom Toolset button in the Cross-tools group of the Project Options dialog. In
the opened General Tools Options group, fill in the fields in every its sub-group. The added crosstool will appear in the list of the radio button of the Cross-tools group.
Example: if you add a second package and specified its name as My Tools, then the list will display
a new position of Custom 2 (My Tools).
Version 1.1
Page 237 of 245
Error! Unknown document property name.User's Manual
How to delete a cross-tool
In the Cross-tools group of the Project Options dialog, set the Cross-tools Vendor radio button
to the additional package to be deleted and press the Delete Custom Toolset button. The record
in the project repository database, which the PICE program uses for interoperation with this package, and the corresponding position in the Cross-tools Vendor radio button will be deleted.
Developing and Debugging Programs with
Memory Banks
With PICE IDE, you can develop an advanced application with banked memory from scratch. Four
companies, Keil Software, IAR Systems, Raisonance S.A. and TASKING Software, ship C compilers that support memory banking for the 8051 microcontrollers. PICE supports symbol debugging
for all these compilers. For Keil and IAR C compilers, PICE also supports debugging and development of application programs at the project level. For more about projects and IDE, see Working
with Projects.
Setting up the banking options for projects
To set up the banking options for projects, do the following two steps:
1) Specify the start address for the Banking area. To do this, use the Project menu, the Options
command, the Project Options dialog, the Memory Model group. Normally, developers try to
minimize the common code and size of the Common area. Nonetheless, you can allocate any size
for it from 0 to 64 Kb.
2) For each source file in the project, specify the number of bank, to which the corresponding piece
of code shall be loaded. For the source file, which gives the common code, you should specify
loading to the Common area. To do this, use the File Options command of the Project window local menu (or the Setup button on this window toolbar), the File Options dialog.
Preparing programs for debugging
The entire banked memory may be considered as a linear address space of 1 Mb. The fifth digit of
the linear address in the HEX format represents the bank number. For example, the cell at address
12222H is in bank #1; the cell at address 34444H is in bank #3.
When loading a program in the memory, PICE carries out two tasks:
• Copies the common code to the Common area of each bank.
• Modifies the symbol information of this program so as to support all objects in the Common
area.
For example, if function main() resides in the Common area at address 052DH, then PICE will create symbol records about functions main() in other participating banks with addresses 1052DH,
2052DH, ... x052DH, where 'x' is the highest bank number used in the program.
If you work with files in symbol formats, the emulator will automatically copy the common code to
the banks. If you use files in non-symbol formats (HEX or BIN), you should properly load the Common areas and banks yourself.
Debugging
In the Source window and Disassembler window, the Toggle Banked Breakpoint command of
the local menu sets/clears unconditional breakpoints in all existing banks simultaneously.
Note. If your emulator main board carries extended memory and your program does not use the
banking feature at all (under any scenario of use), you should always disable banking in the Banking group (the Hardware Configuration dialog).
How C compilers implement banking of memory
Accessing an object (a piece of data or calling a function), which resides in another Code memory
bank, is transparent at the level of application program source text. In fact, when the application
program initiates such access, the compiler generates a call for a special function, which switches
the banks. Generally, this special function is the proprietary function and compiler vendors supply it
as a source file together with the compiler package (as part of the package library). To build a project with banked memory, you should include this file in your project as a source file of the common
code.
Version 1.1
Page 238 of 245
Error! Unknown document property name.User's Manual
If you need to modify the proposed method of switching, you may edit the function source. Do not
forget you shall recompile the corresponding program module after editing, for your amendments to
take effect.
A. Keil Software
This C compiler package provides the most advanced support of memory banking. The bank
switching function is in file L51_BANK.A51 (from folder \LIB of the Keil package). You must add this
file as source to your project. The file specifies the switching method (port or Xdata memory cell),
the port name or the address of the Xdata memory cell, and the address bit mask. By default, the
Keil compiler uses lines of port P1 beginning from bit #3 (P1.3, P1.4, etc.). File L51_BANK.A51
contains necessary comments that will help you to adjust settings to your target hardware configuration.
Some versions of the Keil linker have a bug: if you place all program modules in the Common area,
the linker will warn "NBANKS < NUMBER OF CODE BANKS" and generate incorrect output code.
However, this structure of program is rather theoretical, because it is not reasonable, if correct at
all.
When loading a program, PICE checks the banking parameters in the program for conformity to the
parameters specified in the Hardware Configuration dialog and warns about conflicts, if any.
B. IAR Systems and TASKING Software
By default, both C compilers use lines of port P1 beginning from bit #0 (P1.0, P1.2, etc.). The bank
switching function is in file L18.S03 (IAR) or in file STUB.SRC (TASKING).
Project Repository Tree
Project Repository Tree is a small database that stores records with links to the project files. Using
this database, you can sort and group the projects as you need, for better display and access. The
PICE program displays the repository in a tree-like form similar to that of the computer file system.
Operations with the repository do not reflect on the project files. The repository works only
with the records about the projects (links to the project files).
A tree branch may have projects and other branches. One and the same branch may contain different projects with the same names of project file. Different branches may contain links to one and
the same project.
How to control
To do any operation with the repository, use the Project Repository dialog. The branch displays
name of each project file without path and the project description, in square brackets, which is
specified in the Description field of the General Properties group (of the Project Options dialog).
You can see the path to the selected project file in the Project Properties panel below. The PICE
debugger remembers the state of the tree branches (expanded / collapsed) and restores them the
next time you open this dialog.
When installing the new version of the PICE program with copying the working environment from
the previously installed version, the version will inherit the existing project repository (file repos.ini).
Troubleshooting
We plan to completely develop this topic in near future. In the meantime, please:
• See Restrictions of PICE-52 and Special Considerations and check if your problem is touched
there.
• Check once more the hardware configuration parameters in the Hardware Configuration
dialog.
• Contact our Technical Support.
Error Messages
See this topic in the online help file of the PICE software.
Version 1.1
Page 239 of 245
Error! Unknown document property name.User's Manual
Configurations
Configuring the Hardware
In PICE, you configure two pieces of hardware: the emulator hardware and the PC interface port
(serial or USB), through which the emulator software communicates with the emulator hardware.
To configure the emulator hardware, use the Hardware Configuration dialog. This dialog is available at any moment when working with PICE.
To configure the interface port, use the PICE-52 Communication dialog. PICE opens this dialog in
the very beginning of session. Also, the PICE software will open this dialog, if it cannot establish
connection with the emulator hardware, or if you change the PC serial port or its parameters.
The Hardware Configuration dialog
See this topic on page 124 in chapter The Configure menu.
The PICE-52 Communication dialog
This dialog controls two interfaces of communication between the PICE software and hardware.
If you switch to USB Port, select the Phyton USB device in the USB Device List. The Phyton USB
cable activates and appears in the list even when connected without the hardware emulator. However, if the emulator is not connected, the PICE software will inform you that the emulator is not
available.
Element of dialog
Description
Port Number
Sets the number of the computer serial port connected to the emulator.
Baud Rate
Sets the serial port baud rate.
USB Device List
Lists the available Phyton devices at all USB ports of your computer.
Other USB devices, if any connected, are absent in this list.
Demo
Switches the emulator software to the Demonstration mode. In this
mode, connection with the emulator hardware is not required.
Version 1.1
Page 240 of 245
Error! Unknown document property name.User's Manual
For more about adjusting the communication over the serial interface, see Communication with PC.
The Project Options dialog
Groups of this dialog, except for the first group, configure the cross-tool kit used in the opened project. For more about the Project Options dialog, see page 151 in Section The Project menu.
Configuration Files
On exit, PICE automatically saves its configuration data in several configuration files. On start, it
opens these previously saved files. Also, you can save and load any of these files independently
from each other at any time using the File menu, the Configuration Files command. You can have
several sets of configuration files for different debugging purposes.
When you are working with projects, PICE keeps all necessary configuration options in the project
file. When you use PICE as a debugger for external development tools, PICE employs the following
two files in place of the project file:
• The desktop file contains data about the display options and screen configuration, the positions, dimensions, colors and fonts of all the debugger windows.
• The options file stores the processor type, debugging options, breakpoints, etc.
In the end, PICE saves these files to the directory, from which they were loaded or saved the last
time.
Besides these two files, PICE uses two more configuration files:
• The session file, which stores session data and specifies the desktop and options files PICE
shall load on the start of next session (if the project file is not used).
• The history file with all values, which you entered in the text boxes of all the PICE dialogs.
PICE saves the session and history files to the current directory.
Since you have no need to work with the history file, you cannot save or load it on your own.
Project Configuration File
See this topic on page 234 in chapter Working with Projects.
The Configure menu
See this topic on page 121 in Section Menus.
Version 1.1
Page 241 of 245
Error! Unknown document property name.User's Manual
Appendix Topics
Expressions
PICE accepts expressions in all situations, when a number is required. For example, when using
the Modify command in the Watches window, you can enter the new value in the form of number
or arithmetic expression.
Expressions in PICE are the mathematical constructions for calculating the result with the use of
one or more operands. PICE supports various operations in expressions. The following operands
are used:
• numbers;
• names of symbols;
• contents of memory locations.
Interpreting the expression result
The expression result is interpreted in accordance with the context, in which it is used.
In the dialog box, where an address is required (for example, the code breakpoint address), PICE
tries to interpret the expression result as the address. If you enter a variable name there, the result
of that expression will be the variable address but not the value of the variable.
If the dialog box waits for a number (for example, the Modify Memory dialog box of the Memory
Dump window), the expression result will be interpreted as a number. That is, if you enter a variable name there, then the result will be the value of the variable, but not its address.
Nonetheless, you can follow the default rules:
If you need to use the variable value, where an address is expected, then you can write something
like "var + 0". In this case, the variable value will be used in expression.
If you need to use the variable address, apply the & (address) operation, that is, "&var".
Examples of expressions
main
i + j << 2 / :CW0x1200
(unsigned char)i + 2
sizeof(array) > 200
(a == b && a <= 4) || a > '3'
sptr -> Member1 -> a[i]
*p
*((char *)ptr)
Operations in Expressions
PICE supports all arithmetic and logical operations valid for the C language, as well as the pointer
and address operations:
Designation
Description
( )
Brackets (higher priority)
[ ]
Array component selector
.
Structure component or union selector
->
Selection of a structure component or a union addressed with a pointer
Version 1.1
Page 242 of 245
Error! Unknown document property name.User's Manual
!
Logical negation
~
Bitwise inversion
-
Bitwise sign change
&
Returns address
*
Access by address
(type)
Explicit type conversion
(sizeof)
Returns size of operand, in bytes
*
Multiplication
/
Division
%
Division by modulus
+
Addition
-
Subtraction
<<
Left shift
>>
Right shift
<
Less than
<=
Less than or equal to
>
Greater than
>=
Greater than or equal to
==
Equal to
!=
Not equal to
&
Bitwise AND
^
Bitwise XOR
|
Bitwise OR
&&
Logical AND
||
Logical OR
=
Assignment
The types of operands are converted in accordance with the ANSI standard.
The results of logical operations are 0 (false) or 1 (true).
The allowed conversions of type:
• Operands can be converted to simple types (char, int, ... float).
• Pointers can be converted to simple types (char *, int *, ... float *) and to structures or unions.
• The word "struct" is not necessary (MyStruct *).
Numbers
By default, the PICE software treats numbers as decimals. The integers should fit into 32 bits; the
floating point numbers should fit into the single precision format (32 bits).
The PICE software supports the following formats:
1) Decimal integer.
Example: 126889
2) Decimal floating point.
Examples: 365.678;
Version 1.1
2.12e-9
Page 243 of 245
Error! Unknown document property name.User's Manual
3) Hexadecimal. PICE understands numbers in the C format and the assembly format.
Examples: 0xF6D7;
0F6D7H;
0xFFFF1111
4) Binary. Binary numbers must end with 'B'.
Examples: 011101B;
111111111111111000011B
5) Symbol (ASCII).
Examples: 'a';
'ab';
'$B%8'.
Names of Symbols
The symbol names known to PICE are subdivided into two groups: the names defined in the program loaded for debugging ("external") names and the debugger "internal" names.
The names defined in the loaded program are absent, if no program is loaded or if the program has
no debug information (see Preparing Programs for Source-level Debugging).
The "internal" names of PICE-52 are the names of special function registers (see Special Function
Registers and Bits) and debug registers. Usually, the debug register names begin with two underscores. The set of internal names depends on the processor type, because different processors
have different sets of the debug registers. If the program being debugged contains a name that
matches the debug register name or the special function register name, then the "internal" name
takes precedence. This is important, because PICE-52 "knows" more about SFRs and the "external" names are treated as simple memory locations. Because of this, even if the "external" and "internal" names have the same address, they may differ in value.
Accessing the module-local names
The module-local names are either the assembly names that are declared on the file level and are
non-public, or the C program names declared as "static" outside functions. The module-local
names can be used only in the source text of that module.
Different modules may have matching local names. During the debug process, the module-local
name is visible only when the Program Counter is in the module, where the name is declared (if the
name is unique, then it will be always visible alike the public ones).
To access a name declared in certain module, write variable_name@module_name, e.g.
MY_VAR@MODULE1
where 'MY_VAR' is the local name; 'MODULE1' is the module name.
Contents of Memory Locations
The following construction in an expression specifies the memory location:
:<Address space mnemonic><size><address>
Where:
<Address space mnemonic> is the letter designation of the space:
C for the Code space,
D for the Data space, etc.
<size> specifies the size of location:
B for byte
W for word (2 bytes)
D for double word (4 bytes)
<address> specifies the address of location in the memory.
Examples:
:DW1234H
Specifies the value of Data memory Word at the address of 1234h.
:CB(main + 1)
Specifies the value of Code memory Byte at the address of the main function
plus 1.
Version 1.1
Page 244 of 245
Error! Unknown document property name.User's Manual
Script Files and Emulator Use Automation
See this topic in the online help file of the PICE software.
Command-line Switches
There are the following command line switches for launching PICE (the switches are case–
insensitive):
Switches
Description
/S<file>
Load the specified session file instead of the default one. The default
session file is the file found in the working directory.
/D<file>
Load the specified screen configuration (desktop) instead of the default
one.
/O<file>
Load the specified options file instead of the default one.
/B
Bypass the PICE Communication dialog.
If PICE has been started at least once, then the communication parameters (the serial port number and baud rate) are saved in the options or project configuration file. When you start PICE next time with
the /B option, the previously set communication parameters are applied
and the PICE Communication dialog box is bypassed.
/M
Start PICE in the Demo mode.
Note. The file name must follow the switch without the blank space.
For more info about the session, desktop and options files, see Configuration Files.
Automatic Name Completion
Use the automatic name completion to build the list of names beginning with the specified substring. In any text box of any dialog, you can enter part of a symbol name and then press F2: PICE
will display the list of appropriate names, which begin with the part you have entered.
To choose a name from this list and place it in the text box, double-click it or click it and then click
OK. If there is only one appropriate name, then no list will appear and the name will be automatically placed in the text box.
The list of names includes:
• Public symbol names defined in the program being debugged.
• Names of symbols, which are local in the modules defined in the program, and whose symbol
scope is not checked.
• Names of debug registers and special function registers (see Special Function Registers and
Bits).
Also, the list includes the names beginning with underscore plus the specified substring. This is
convenient for C programs, for which the compiler generates underscore in the beginning of symbol
names.
Version 1.1
Page 245 of 245