1
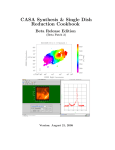
CASA Synthesis & Single Dish
Reduction Cookbook
Beta Release Edition
(Patch 4 Version 2.4.0)
Version: June 29, 2009
CASA Synthesis & Single Dish
Reduction Cookbook
Beta Release Edition
Chef Editor: Steven T. Myers
CASA Project Scientist
Sous-Chef: Joe McMullin
CASA Project Manager
CASA Synthesis & Single Dish Reduction Cookbook, Beta Release Edition,
Version June 29, 2009,
c
2007
National Radio Astronomy Observatory
The National Radio Astronomy Observatory is a facility of the National Science Foundation
operated under cooperative agreement by Associated Universities, Inc.
This tome was scribed by:
The CASA Developers and the NRAO Applications User Group (NAUG)
http://casa.nrao.edu/
http://www.aoc.nrao.edu/~smyers/naug/
Do you dare to enter CASA Stadium and join battle with the Ironic Chefs?
Let us see whose cuisine reigns supreme . . .
Contents
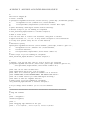
1 Introduction
1.1 About This Beta Release . . . . . . . . . . . . . . . . .
1.1.1 What’s New in Beta Patch 4 . . . . . . . . . . .
1.1.1.1 Previous changes in Patch3 . . . . . . .
1.1.1.2 Previous changes introduced in Patch 2
1.2 CASA Basics — Information for First-Time Users . . .
1.2.1 Before Starting CASA . . . . . . . . . . . . . . .
1.2.1.1 Environment Variables . . . . . . . . .
1.2.1.2 Where is CASA? . . . . . . . . . . . . .
1.2.2 Starting CASA . . . . . . . . . . . . . . . . . . .
1.2.3 Ending CASA . . . . . . . . . . . . . . . . . . .
1.2.4 What happens if something goes wrong? . . . . .
1.2.5 Aborting CASA execution . . . . . . . . . . . . .
1.2.6 What happens if CASA crashes? . . . . . . . . .
1.2.7 Python Basics for CASA . . . . . . . . . . . . .
1.2.7.1 Variables . . . . . . . . . . . . . . . . .
1.2.7.2 Lists and Ranges . . . . . . . . . . . . .
1.2.7.3 Indexes . . . . . . . . . . . . . . . . . .
1.2.7.4 Indentation . . . . . . . . . . . . . . . .
1.2.7.5 System shell access . . . . . . . . . . .
1.2.7.6 Executing Python scripts . . . . . . . .
1.2.8 Getting Help in CASA . . . . . . . . . . . . . . .
1.2.8.1 TAB key . . . . . . . . . . . . . . . . . .
1.2.8.2 help <taskname> . . . . . . . . . . . .
1.2.8.3 help and PAGER . . . . . . . . . . . . .
1.2.8.4 help par.<parameter> . . . . . . . . .
1.2.8.5 Python help . . . . . . . . . . . . . . .
1.3 Tasks and Tools in CASA . . . . . . . . . . . . . . . . .
1.3.1 What Tasks are Available? . . . . . . . . . . . .
1.3.2 Running Tasks and Tools . . . . . . . . . . . . .
1.3.2.1 Aborting Synchronous Tasks . . . . . .
1.3.3 Getting Return Values . . . . . . . . . . . . . . .
1.3.4 Running Tasks Asynchronously . . . . . . . . . .
1.3.4.1 Monitoring Asynchronous Tasks . . . .
3
.
.
.
.
.
.
.
.
.
.
.
.
.
.
.
.
.
.
.
.
.
.
.
.
.
.
.
.
.
.
.
.
.
.
.
.
.
.
.
.
.
.
.
.
.
.
.
.
.
.
.
.
.
.
.
.
.
.
.
.
.
.
.
.
.
.
.
.
.
.
.
.
.
.
.
.
.
.
.
.
.
.
.
.
.
.
.
.
.
.
.
.
.
.
.
.
.
.
.
.
.
.
.
.
.
.
.
.
.
.
.
.
.
.
.
.
.
.
.
.
.
.
.
.
.
.
.
.
.
.
.
.
.
.
.
.
.
.
.
.
.
.
.
.
.
.
.
.
.
.
.
.
.
.
.
.
.
.
.
.
.
.
.
.
.
.
.
.
.
.
.
.
.
.
.
.
.
.
.
.
.
.
.
.
.
.
.
.
.
.
.
.
.
.
.
.
.
.
.
.
.
.
.
.
.
.
.
.
.
.
.
.
.
.
.
.
.
.
.
.
.
.
.
.
.
.
.
.
.
.
.
.
.
.
.
.
.
.
.
.
.
.
.
.
.
.
.
.
.
.
.
.
.
.
.
.
.
.
.
.
.
.
.
.
.
.
.
.
.
.
.
.
.
.
.
.
.
.
.
.
.
.
.
.
.
.
.
.
.
.
.
.
.
.
.
.
.
.
.
.
.
.
.
.
.
.
.
.
.
.
.
.
.
.
.
.
.
.
.
.
.
.
.
.
.
.
.
.
.
.
.
.
.
.
.
.
.
.
.
.
.
.
.
.
.
.
.
.
.
.
.
.
.
.
.
.
.
.
.
.
.
.
.
.
.
.
.
.
.
.
.
.
.
.
.
.
.
.
.
.
.
.
.
.
.
.
.
.
.
.
.
.
.
.
.
.
.
.
.
.
.
.
.
.
.
.
.
.
.
.
.
.
.
.
.
.
.
.
.
.
.
.
.
.
.
.
.
.
.
.
.
.
.
.
.
.
.
.
.
.
.
.
.
.
.
.
.
.
.
.
.
.
.
.
.
.
.
.
.
.
.
.
.
.
.
.
.
.
.
.
.
.
.
.
.
.
.
.
.
.
.
.
.
.
.
.
.
.
.
.
.
.
.
.
.
.
.
.
.
.
.
.
.
.
.
.
.
.
.
.
.
.
.
.
.
.
.
.
.
.
.
.
.
.
.
.
.
.
20
22
23
25
27
28
28
29
29
30
30
30
31
31
32
32
32
33
33
33
34
34
34
35
37
37
37
38
39
42
44
44
45
45
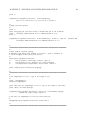
1.3.4.2 Aborting Asynchronous Tasks . . . . . . . .
Setting Parameters and Invoking Tasks . . . . . . . .
1.3.5.1 The scope of parameters in CASA . . . . . .
1.3.5.2 The default Command . . . . . . . . . . . .
1.3.5.3 The go Command . . . . . . . . . . . . . . .
1.3.5.4 The inp Command . . . . . . . . . . . . . .
1.3.5.5 The saveinputs Command . . . . . . . . . .
1.3.5.6 The tget Command . . . . . . . . . . . . . .
1.3.5.7 The .last file . . . . . . . . . . . . . . . . .
1.3.6 Tools in CASA . . . . . . . . . . . . . . . . . . . . . .
Getting the most out of CASA . . . . . . . . . . . . . . . . .
1.4.1 Your command line history . . . . . . . . . . . . . . .
1.4.2 Logging your session . . . . . . . . . . . . . . . . . . .
1.4.2.1 Starup options for the logger . . . . . . . .
1.4.2.2 Setting priority levels in the logger . . . . .
1.4.3 Where are my data in CASA? . . . . . . . . . . . . .
1.4.3.1 How do I get rid of my data in CASA? . . .
1.4.4 What’s in my data? . . . . . . . . . . . . . . . . . . .
1.4.5 Data Selection in CASA . . . . . . . . . . . . . . . . .
From Loading Data to Images . . . . . . . . . . . . . . . . . .
1.5.1 Loading Data into CASA . . . . . . . . . . . . . . . .
1.5.1.1 VLA: Filling data from VLA archive format
1.5.1.2 Filling data from UVFITS format . . . . . .
1.5.1.3 Loading FITS images . . . . . . . . . . . . .
1.5.1.4 Concatenation of multiple MS . . . . . . . .
1.5.2 Data Examination, Editing, and Flagging . . . . . . .
1.5.2.1 Interactive X-Y Plotting and Flagging . . . .
1.5.2.2 Flag the Data Non-interactively . . . . . . .
1.5.2.3 Viewing and Flagging the MS . . . . . . . .
1.5.3 Calibration . . . . . . . . . . . . . . . . . . . . . . . .
1.5.3.1 Prior Calibration . . . . . . . . . . . . . . . .
1.5.3.2 Bandpass Calibration . . . . . . . . . . . . .
1.5.3.3 Gain Calibration . . . . . . . . . . . . . . . .
1.5.3.4 Polarization Calibration . . . . . . . . . . . .
1.5.3.5 Examining Calibration Solutions . . . . . . .
1.5.3.6 Bootstrapping Flux Calibration . . . . . . .
1.5.3.7 Calibration Accumulation . . . . . . . . . . .
1.5.3.8 Correcting the Data . . . . . . . . . . . . . .
1.5.3.9 Splitting the Data . . . . . . . . . . . . . . .
1.5.4 Synthesis Imaging . . . . . . . . . . . . . . . . . . . .
1.5.4.1 Cleaning a single-field image or a mosaic . .
1.5.4.2 Feathering in a Single-Dish image . . . . . .
1.5.5 Self Calibration . . . . . . . . . . . . . . . . . . . . . .
1.5.6 Data and Image Analysis . . . . . . . . . . . . . . . .
1.5.6.1 What’s in an image? . . . . . . . . . . . . . .
1.3.5
1.4
1.5
.
.
.
.
.
.
.
.
.
.
.
.
.
.
.
.
.
.
.
.
.
.
.
.
.
.
.
.
.
.
.
.
.
.
.
.
.
.
.
.
.
.
.
.
.
.
.
.
.
.
.
.
.
.
.
.
.
.
.
.
.
.
.
.
.
.
.
.
.
.
.
.
.
.
.
.
.
.
.
.
.
.
.
.
.
.
.
.
.
.
.
.
.
.
.
.
.
.
.
.
.
.
.
.
.
.
.
.
.
.
.
.
.
.
.
.
.
.
.
.
.
.
.
.
.
.
.
.
.
.
.
.
.
.
.
.
.
.
.
.
.
.
.
.
.
.
.
.
.
.
.
.
.
.
.
.
.
.
.
.
.
.
.
.
.
.
.
.
.
.
.
.
.
.
.
.
.
.
.
.
.
.
.
.
.
.
.
.
.
.
.
.
.
.
.
.
.
.
.
.
.
.
.
.
.
.
.
.
.
.
.
.
.
.
.
.
.
.
.
.
.
.
.
.
.
.
.
.
.
.
.
.
.
.
.
.
.
.
.
.
.
.
.
.
.
.
.
.
.
.
.
.
.
.
.
.
.
.
.
.
.
.
.
.
.
.
.
.
.
.
.
.
.
.
.
.
.
.
.
.
.
.
.
.
.
.
.
.
.
.
.
.
.
.
.
.
.
.
.
.
.
.
.
.
.
.
.
.
.
.
.
.
.
.
.
.
.
.
.
.
.
.
.
.
.
.
.
.
.
.
.
.
.
.
.
.
.
.
.
.
.
.
.
.
.
.
.
.
.
.
.
.
.
.
.
.
.
.
.
.
.
.
.
.
.
.
.
.
.
.
.
.
.
.
.
.
.
.
.
.
.
.
.
.
.
.
.
.
.
.
.
.
.
.
.
.
.
.
.
.
.
.
.
.
.
.
.
.
.
.
.
.
.
.
.
.
.
.
.
.
.
.
.
.
.
.
.
.
.
.
.
.
.
.
.
.
.
.
.
.
.
.
.
.
.
.
.
.
.
.
.
.
.
.
.
.
.
.
.
.
.
.
.
.
.
.
.
.
.
.
.
.
.
.
.
.
.
.
.
.
.
.
.
.
.
.
.
.
.
.
.
.
.
.
.
.
.
.
.
.
.
.
.
.
.
.
.
.
.
.
.
.
.
.
.
.
.
.
.
.
.
.
.
.
.
.
.
.
.
.
.
.
.
.
.
.
.
.
.
.
.
.
.
.
.
.
.
.
.
.
.
.
.
.
.
.
.
.
.
.
.
.
.
.
.
.
.
.
.
.
.
.
.
.
.
.
.
.
.
.
.
.
.
.
.
47
47
49
49
50
51
53
55
56
57
57
58
58
60
61
62
63
64
64
64
65
66
66
66
67
67
67
68
68
68
69
69
69
70
70
70
70
70
71
71
71
72
72
72
73
.
.
.
.
.
.
.
.
.
.
.
.
.
.
.
.
.
.
.
.
.
.
.
.
.
.
.
.
.
.
.
.
.
.
.
.
.
.
.
.
.
.
.
.
.
.
.
.
73
73
73
73
74
74
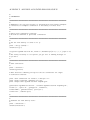
2 Visibility Data Import, Export, and Selection
2.1 CASA Measurement Sets . . . . . . . . . . . . . . . . . . . . . . . . . .
2.1.1 Under the Hood: Structure of the Measurement Set . . . . . . .
2.2 Data Import and Export . . . . . . . . . . . . . . . . . . . . . . . . . . .
2.2.1 UVFITS Import and Export . . . . . . . . . . . . . . . . . . . .
2.2.1.1 Import using importuvfits . . . . . . . . . . . . . . .
2.2.1.2 Export using exportuvfits . . . . . . . . . . . . . . .
2.2.2 VLA: Filling data from archive format (importvla) . . . . . . .
2.2.2.1 Parameter applytsys . . . . . . . . . . . . . . . . . .
2.2.2.2 Parameter bandname . . . . . . . . . . . . . . . . . . .
2.2.2.3 Parameter frequencytol . . . . . . . . . . . . . . . .
2.2.2.4 Parameter project . . . . . . . . . . . . . . . . . . . .
2.2.2.5 Parameters starttime and stoptime . . . . . . . . . .
2.2.2.6 Parameter autocorr . . . . . . . . . . . . . . . . . . .
2.2.2.7 Parameter antnamescheme . . . . . . . . . . . . . . . .
2.2.3 ALMA: Filling ALMA Science Data Model (ASDM) observations
2.3 Summarizing your MS (listobs) . . . . . . . . . . . . . . . . . . . . . .
2.4 Listing and manipulating MS metadata (vishead) . . . . . . . . . . . .
2.5 Concatenating multiple datasets (concat) . . . . . . . . . . . . . . . . .
2.6 Data Selection . . . . . . . . . . . . . . . . . . . . . . . . . . . . . . . .
2.6.1 General selection syntax . . . . . . . . . . . . . . . . . . . . . . .
2.6.1.1 String Matching . . . . . . . . . . . . . . . . . . . . . .
2.6.2 The field Parameter . . . . . . . . . . . . . . . . . . . . . . . .
2.6.3 The spw Parameter . . . . . . . . . . . . . . . . . . . . . . . . . .
2.6.3.1 Channel selection in the spw parameter . . . . . . . . .
2.6.4 The selectdata Parameters . . . . . . . . . . . . . . . . . . . .
2.6.4.1 The antenna Parameter . . . . . . . . . . . . . . . . . .
2.6.4.2 The scan Parameter . . . . . . . . . . . . . . . . . . . .
2.6.4.3 The timerange Parameter . . . . . . . . . . . . . . . .
2.6.4.4 The uvrange Parameter . . . . . . . . . . . . . . . . . .
2.6.4.5 The msselect Parameter . . . . . . . . . . . . . . . . .
.
.
.
.
.
.
.
.
.
.
.
.
.
.
.
.
.
.
.
.
.
.
.
.
.
.
.
.
.
.
.
.
.
.
.
.
.
.
.
.
.
.
.
.
.
.
.
.
.
.
.
.
.
.
.
.
.
.
.
.
.
.
.
.
.
.
.
.
.
.
.
.
.
.
.
.
.
.
.
.
.
.
.
.
.
.
.
.
.
.
.
.
.
.
.
.
.
.
.
.
.
.
.
.
.
.
.
.
.
.
.
.
.
.
.
.
.
.
.
.
.
.
.
.
.
.
.
.
.
.
.
.
.
.
.
.
.
.
.
.
.
.
.
.
.
.
.
.
.
.
.
.
.
.
.
.
.
.
.
.
.
.
.
.
.
.
.
.
.
.
.
.
.
.
.
.
.
.
.
.
.
.
.
.
.
.
.
.
.
.
.
.
.
.
.
.
.
.
.
.
.
.
.
.
.
.
.
.
.
.
75
76
76
79
79
80
80
81
82
83
83
83
84
84
84
84
86
89
89
91
91
92
93
94
95
96
96
98
98
99
100
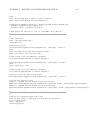
3 Data Examination and Editing
3.1 Plotting and Flagging Visibility Data in CASA
3.2 Managing flag versions with flagmanager . . .
3.3 Flagging auto-correlations with flagautocorr
3.4 X-Y Plotting and Editing of the Data . . . . .
3.4.1 GUI Plot Control . . . . . . . . . . . . .
.
.
.
.
.
.
.
.
.
.
.
.
.
.
.
.
.
.
.
.
.
.
.
.
.
.
.
.
.
.
.
.
.
.
.
101
101
102
103
103
107
1.5.7
1.5.6.2
1.5.6.3
1.5.6.4
1.5.6.5
1.5.6.6
Getting
Image statistics . . . . . . .
Moments of an Image Cube .
Image math . . . . . . . . .
Regridding an Image . . . .
Displaying Images . . . . . .
data and images out of CASA
.
.
.
.
.
.
.
.
.
.
.
.
.
.
.
.
.
.
.
.
.
.
.
.
.
.
.
.
.
.
.
.
.
.
.
.
.
.
.
.
.
.
.
.
.
.
.
.
.
.
.
.
.
.
.
.
.
.
.
.
.
.
.
.
.
.
.
.
.
.
.
.
.
.
.
.
.
.
.
.
.
.
.
.
.
.
.
.
.
.
.
.
.
.
.
.
.
.
.
.
.
.
.
.
.
.
.
.
.
.
.
.
.
.
.
.
.
.
.
.
.
.
.
.
.
.
.
.
.
.
.
.
.
.
.
.
.
.
.
.
.
.
.
.
.
.
.
.
.
.
.
.
.
.
3.4.2
3.4.3
3.5
3.6
3.7
3.8
3.9
The selectplot Parameters . . . . . . . . . . . . .
Plot Control Parameters . . . . . . . . . . . . . . . .
3.4.3.1
iteration . . . . . . . . . . . . . . . . .
3.4.3.2
overplot . . . . . . . . . . . . . . . . . .
3.4.3.3
plotrange . . . . . . . . . . . . . . . . .
3.4.3.4
plotsymbol . . . . . . . . . . . . . . . . .
3.4.3.5
showflags . . . . . . . . . . . . . . . . .
3.4.3.6
subplot . . . . . . . . . . . . . . . . . . .
3.4.4 Averaging in plotxy . . . . . . . . . . . . . . . . . .
3.4.5 Interactive Flagging in plotxy . . . . . . . . . . . .
3.4.6 Flag extension in plotxy . . . . . . . . . . . . . . .
3.4.7 Setting rest frequencies in plotxy . . . . . . . . . .
3.4.8 Printing from plotxy . . . . . . . . . . . . . . . . .
3.4.9 Exiting plotxy . . . . . . . . . . . . . . . . . . . . .
3.4.10 Example session using plotxy . . . . . . . . . . . . .
Non-Interactive Flagging using flagdata . . . . . . . . . .
3.5.1 Flag Antenna/Channels . . . . . . . . . . . . . . . .
3.5.1.1 Manual flagging and clipping in flagdata .
3.5.1.2 Flagging the beginning of scans . . . . . .
Browse the Data . . . . . . . . . . . . . . . . . . . . . . . .
Plotting antenna positions (plotants) . . . . . . . . . . . .
MS Plotting and Editing using casaplotms . . . . . . . . .
Examples of Data Display and Flagging . . . . . . . . . . .
.
.
.
.
.
.
.
.
.
.
.
.
.
.
.
.
.
.
.
.
.
.
.
.
.
.
.
.
.
.
.
.
.
.
.
.
.
.
.
.
.
.
.
.
.
.
.
.
.
.
.
.
.
.
.
.
.
.
.
.
.
.
.
.
.
.
.
.
.
.
.
.
.
.
.
.
.
.
.
.
.
.
.
.
.
.
.
.
.
.
.
.
.
.
.
.
.
.
.
.
.
.
.
.
.
.
.
.
.
.
.
.
.
.
.
.
.
.
.
.
.
.
.
.
.
.
.
.
.
.
.
.
.
.
.
.
.
.
.
.
.
.
.
.
.
.
.
.
.
.
.
.
.
.
.
.
.
.
.
.
.
.
.
.
.
.
.
.
.
.
.
.
.
.
.
.
.
.
.
.
.
.
.
.
.
.
.
.
.
.
.
.
.
.
.
.
.
.
.
.
.
.
.
.
.
.
.
.
.
.
.
.
.
.
.
.
.
.
.
.
.
.
.
.
.
.
.
.
.
.
.
.
.
.
.
.
.
.
.
.
.
.
.
.
.
.
.
.
.
.
.
.
.
.
.
.
.
.
.
.
.
.
.
.
.
.
.
.
.
.
.
.
.
.
.
.
.
.
.
.
.
.
.
.
.
.
.
.
.
.
.
.
.
.
.
.
.
.
.
.
.
.
.
.
.
.
.
.
.
.
.
.
.
.
.
.
.
.
.
.
.
.
108
109
109
109
110
111
112
112
113
114
115
116
117
118
118
121
122
123
124
124
126
127
127
4 Synthesis Calibration
128
4.1 Calibration Tasks . . . . . . . . . . . . . . . . . . . . . . . . . . . . . . . . . . . . . . 128
4.2 The Calibration Process — Outline and Philosophy . . . . . . . . . . . . . . . . . . . 129
4.2.1 The Philosophy of Calibration in CASA . . . . . . . . . . . . . . . . . . . . . 131
4.2.2 Keeping Track of Calibration Tables . . . . . . . . . . . . . . . . . . . . . . . 132
4.2.3 The Calibration of VLA data in CASA . . . . . . . . . . . . . . . . . . . . . 133
4.3 Preparing for Calibration . . . . . . . . . . . . . . . . . . . . . . . . . . . . . . . . . 134
4.3.1 System Temperature Correction . . . . . . . . . . . . . . . . . . . . . . . . . 134
4.3.2 Antenna Gain-Elevation Curve Calibration . . . . . . . . . . . . . . . . . . . 135
4.3.3 Atmospheric Optical Depth Correction . . . . . . . . . . . . . . . . . . . . . . 136
4.3.3.1 Determining opacity corrections for VLA data . . . . . . . . . . . . 136
4.3.4 Setting the Flux Density Scale using (setjy) . . . . . . . . . . . . . . . . . . 137
4.3.4.1 Using Calibration Models for Resolved Sources . . . . . . . . . . . . 139
4.3.5 Other a priori Calibrations and Corrections . . . . . . . . . . . . . . . . . . . 141
4.4 Solving for Calibration — Bandpass, Gain, Polarization . . . . . . . . . . . . . . . . 141
4.4.1 Common Calibration Solver Parameters . . . . . . . . . . . . . . . . . . . . . 141
4.4.1.1 Parameters for Specification : vis and caltable . . . . . . . . . . 142
4.4.1.2 Selection: field, spw, and selectdata . . . . . . . . . . . . . . . . 142
4.4.1.3 Prior Calibration and Correction: parang, gaincurve and opacity 143
4.4.1.4 Previous Calibration: gaintable, gainfield, interp and spwmap 143
4.4.1.5 Solving: solint, combine, preavg, refant, minblperant, minsnr 145
4.4.1.6 Action: append and solnorm . . . . . . . . . . . . .
Spectral Bandpass Calibration (bandpass) . . . . . . . . . . .
4.4.2.1 Bandpass Normalization . . . . . . . . . . . . . . . .
4.4.2.2 B solutions . . . . . . . . . . . . . . . . . . . . . . . .
4.4.2.3 BPOLY solutions . . . . . . . . . . . . . . . . . . . .
4.4.3 Complex Gain Calibration (gaincal) . . . . . . . . . . . . . .
4.4.3.1 Polarization-dependent Gain (G) . . . . . . . . . . . .
4.4.3.2 Polarization-independent Gain (T) . . . . . . . . . . .
4.4.3.3 GSPLINE solutions . . . . . . . . . . . . . . . . . . .
4.4.4 Establishing the Flux Density Scale (fluxscale) . . . . . . .
4.4.4.1 Using Resolved Calibrators . . . . . . . . . . . . . . .
4.4.5 Instrumental Polarization Calibration (D,X) . . . . . . . . . . .
4.4.5.1 Heuristics and Strategies for Polarization Calibration
4.4.5.2 A Polarization Calibration Example . . . . . . . . . .
4.4.6 Baseline-based Calibration (blcal) . . . . . . . . . . . . . . . .
4.4.7 EXPERIMENTAL: Fringe Fitting (fringecal) . . . . . . . . .
Plotting and Manipulating Calibration Tables . . . . . . . . . . . . . .
4.5.1 Plotting Calibration Solutions (plotcal) . . . . . . . . . . . .
4.5.1.1 Examples for plotcal . . . . . . . . . . . . . . . . . .
4.5.2 Listing calibration solutions with (listcal) . . . . . . . . . . .
4.5.3 Calibration Smoothing (smoothcal) . . . . . . . . . . . . . . . .
4.5.4 Calibration Interpolation and Accumulation (accum) . . . . . .
4.5.4.1 Interpolation using (accum) . . . . . . . . . . . . . . .
4.5.4.2 Incremental Calibration using (accum) . . . . . . . . .
Application of Calibration to the Data . . . . . . . . . . . . . . . . . .
4.6.1 Application of Calibration (applycal) . . . . . . . . . . . . . .
4.6.2 Examine the Calibrated Data . . . . . . . . . . . . . . . . . . .
4.6.3 Resetting the Applied Calibration using (clearcal) . . . . . .
Other Calibration and UV-Plane Analysis Options . . . . . . . . . . .
4.7.1 Splitting out Calibrated uv data (split) . . . . . . . . . . . .
4.7.1.1 Averaging in split (EXPERIMENTAL) . . . . . . .
4.7.2 Hanning smoothing of uv data (hanningsmooth) . . . . . . . .
4.7.3 Model subtraction from uv data (uvsub) . . . . . . . . . . . . .
4.7.4 UV-Plane Continuum Subtraction (uvcontsub) . . . . . . . . .
4.7.5 UV-Plane Model Fitting (uvmodelfit) . . . . . . . . . . . . . .
Examples of Calibration . . . . . . . . . . . . . . . . . . . . . . . . . .
4.4.2
4.5
4.6
4.7
4.8
5 Synthesis Imaging
5.1 Imaging Tasks Overview . . . . . .
5.2 Common Imaging Task Parameters
5.2.1 Parameter cell . . . . . .
5.2.2 Parameter field . . . . .
5.2.3 Parameter imagename . . .
5.2.4 Parameter imsize . . . . .
5.2.5 Parameter mode . . . . . .
.
.
.
.
.
.
.
.
.
.
.
.
.
.
.
.
.
.
.
.
.
.
.
.
.
.
.
.
.
.
.
.
.
.
.
.
.
.
.
.
.
.
.
.
.
.
.
.
.
.
.
.
.
.
.
.
.
.
.
.
.
.
.
.
.
.
.
.
.
.
.
.
.
.
.
.
.
.
.
.
.
.
.
.
.
.
.
.
.
.
.
.
.
.
.
.
.
.
.
.
.
.
.
.
.
.
.
.
.
.
.
.
.
.
.
.
.
.
.
.
.
.
.
.
.
.
.
.
.
.
.
.
.
.
.
.
.
.
.
.
.
.
.
.
.
.
.
.
.
.
.
.
.
.
.
.
.
.
.
.
.
.
.
.
.
.
.
.
.
.
.
.
.
.
.
.
.
.
.
.
.
.
.
.
.
.
.
.
.
.
.
.
.
.
.
.
.
.
.
.
.
.
.
.
.
.
.
.
.
.
.
.
.
.
.
.
.
.
.
.
.
.
.
.
.
.
.
.
.
.
.
.
.
.
.
.
.
.
.
.
.
.
.
.
.
.
.
.
.
.
.
.
.
.
.
.
.
.
.
.
.
.
.
.
.
.
.
.
.
.
.
.
.
.
.
.
.
.
.
.
.
.
.
.
.
.
.
.
.
.
.
.
.
.
.
.
.
.
.
.
.
.
.
.
.
.
.
.
.
.
.
.
.
.
.
.
.
.
.
.
.
.
.
.
.
.
.
.
.
.
.
.
.
.
.
.
.
.
.
.
.
.
.
.
.
.
.
.
.
.
.
.
.
.
.
.
.
.
.
.
.
.
.
.
.
.
.
.
.
.
.
.
.
.
.
.
.
.
.
.
.
.
.
.
.
.
.
.
.
.
.
.
.
.
.
.
.
.
.
.
.
.
.
.
.
.
.
.
.
.
.
.
.
.
.
.
.
.
.
.
.
.
.
.
.
.
.
.
146
146
147
148
149
150
151
152
153
154
156
157
158
159
160
161
161
162
163
165
168
170
171
171
174
175
177
179
179
179
180
180
181
181
183
186
.
.
.
.
.
.
.
.
.
.
.
.
.
.
.
.
.
.
.
.
.
.
.
.
.
.
.
.
.
.
.
.
.
.
.
.
.
.
.
.
.
.
.
.
.
.
.
.
.
.
.
.
.
.
.
.
188
188
189
189
190
190
190
190
5.3
5.2.5.1 Mode mfs . . . . . . . . . . .
5.2.5.2 Mode channel . . . . . . . . .
5.2.5.3 Mode frequency . . . . . . .
5.2.5.4 Mode velocity . . . . . . . .
5.2.5.5 Sub-parameter interpolation
5.2.6 Parameter phasecenter . . . . . . . .
5.2.7 Parameter restfreq . . . . . . . . . .
5.2.8 Parameter spw . . . . . . . . . . . . . .
5.2.9 Parameter stokes . . . . . . . . . . . .
5.2.10 Parameter uvtaper . . . . . . . . . . .
5.2.11 Parameter weighting . . . . . . . . . .
5.2.11.1 ’natural’ weighting . . . . .
5.2.11.2 ’uniform’ weighting . . . . .
5.2.11.3 ’superuniform’ weighting . .
5.2.11.4 ’radial’ weighting . . . . . .
5.2.11.5 ’briggs’ weighting . . . . . .
5.2.11.6 ’briggsabs’ weighting . . . .
5.2.12 Parameter vis . . . . . . . . . . . . . .
5.2.13 Primary beams in imaging . . . . . . .
Deconvolution using CLEAN (clean) . . . . .
5.3.1 Parameter psfmode . . . . . . . . . . .
5.3.1.1 The clark algorithm . . . . .
5.3.1.2 The hogbom algorithm . . . . .
5.3.1.3 The clarkstokes algorithm .
5.3.2 The multiscale parameter . . . . . . .
5.3.3 Parameter gain . . . . . . . . . . . . .
5.3.4 Parameter imagermode . . . . . . . . .
5.3.4.1 Sub-parameter cyclefactor .
5.3.4.2 Sub-parameter cyclespeedup
5.3.4.3 Sub-parameter ftmachine . .
5.3.4.4 Sub-parameter mosweight . .
5.3.4.5 Sub-parameter scaletype . .
5.3.4.6 The threshold revisited . . .
5.3.5 Parameter interactive . . . . . . . .
5.3.6 Parameter mask . . . . . . . . . . . . .
5.3.6.1 Setting clean boxes . . . . . .
5.3.6.2 Using clean box files . . . . . .
5.3.6.3 Using clean mask images . . .
5.3.6.4 Using region files . . . . . . . .
5.3.7 Parameter minpb . . . . . . . . . . . .
5.3.8 Parameter modelimage . . . . . . . . .
5.3.9 Parameter niter . . . . . . . . . . . .
5.3.10 Parameter pbcor . . . . . . . . . . . .
5.3.11 Parameter restoringbeam . . . . . . .
5.3.12 Parameter threshold . . . . . . . . . .
.
.
.
.
.
.
.
.
.
.
.
.
.
.
.
.
.
.
.
.
.
.
.
.
.
.
.
.
.
.
.
.
.
.
.
.
.
.
.
.
.
.
.
.
.
.
.
.
.
.
.
.
.
.
.
.
.
.
.
.
.
.
.
.
.
.
.
.
.
.
.
.
.
.
.
.
.
.
.
.
.
.
.
.
.
.
.
.
.
.
.
.
.
.
.
.
.
.
.
.
.
.
.
.
.
.
.
.
.
.
.
.
.
.
.
.
.
.
.
.
.
.
.
.
.
.
.
.
.
.
.
.
.
.
.
.
.
.
.
.
.
.
.
.
.
.
.
.
.
.
.
.
.
.
.
.
.
.
.
.
.
.
.
.
.
.
.
.
.
.
.
.
.
.
.
.
.
.
.
.
.
.
.
.
.
.
.
.
.
.
.
.
.
.
.
.
.
.
.
.
.
.
.
.
.
.
.
.
.
.
.
.
.
.
.
.
.
.
.
.
.
.
.
.
.
.
.
.
.
.
.
.
.
.
.
.
.
.
.
.
.
.
.
.
.
.
.
.
.
.
.
.
.
.
.
.
.
.
.
.
.
.
.
.
.
.
.
.
.
.
.
.
.
.
.
.
.
.
.
.
.
.
.
.
.
.
.
.
.
.
.
.
.
.
.
.
.
.
.
.
.
.
.
.
.
.
.
.
.
.
.
.
.
.
.
.
.
.
.
.
.
.
.
.
.
.
.
.
.
.
.
.
.
.
.
.
.
.
.
.
.
.
.
.
.
.
.
.
.
.
.
.
.
.
.
.
.
.
.
.
.
.
.
.
.
.
.
.
.
.
.
.
.
.
.
.
.
.
.
.
.
.
.
.
.
.
.
.
.
.
.
.
.
.
.
.
.
.
.
.
.
.
.
.
.
.
.
.
.
.
.
.
.
.
.
.
.
.
.
.
.
.
.
.
.
.
.
.
.
.
.
.
.
.
.
.
.
.
.
.
.
.
.
.
.
.
.
.
.
.
.
.
.
.
.
.
.
.
.
.
.
.
.
.
.
.
.
.
.
.
.
.
.
.
.
.
.
.
.
.
.
.
.
.
.
.
.
.
.
.
.
.
.
.
.
.
.
.
.
.
.
.
.
.
.
.
.
.
.
.
.
.
.
.
.
.
.
.
.
.
.
.
.
.
.
.
.
.
.
.
.
.
.
.
.
.
.
.
.
.
.
.
.
.
.
.
.
.
.
.
.
.
.
.
.
.
.
.
.
.
.
.
.
.
.
.
.
.
.
.
.
.
.
.
.
.
.
.
.
.
.
.
.
.
.
.
.
.
.
.
.
.
.
.
.
.
.
.
.
.
.
.
.
.
.
.
.
.
.
.
.
.
.
.
.
.
.
.
.
.
.
.
.
.
.
.
.
.
.
.
.
.
.
.
.
.
.
.
.
.
.
.
.
.
.
.
.
.
.
.
.
.
.
.
.
.
.
.
.
.
.
.
.
.
.
.
.
.
.
.
.
.
.
.
.
.
.
.
.
.
.
.
.
.
.
.
.
.
.
.
.
.
.
.
.
.
.
.
.
.
.
.
.
.
.
.
.
.
.
.
.
.
.
.
.
.
.
.
.
.
.
.
.
.
.
.
.
.
.
.
.
.
.
.
.
.
.
.
.
.
.
.
.
.
.
.
.
.
.
.
.
.
.
.
.
.
.
.
.
.
.
.
.
.
.
.
.
.
.
.
.
.
.
.
.
.
.
.
.
.
.
.
.
.
.
.
.
.
.
.
.
.
.
.
.
.
.
.
.
.
.
.
.
.
.
.
.
.
.
.
.
.
.
.
.
.
.
.
.
.
.
.
.
.
.
.
.
.
.
.
.
.
.
.
.
.
.
.
.
.
.
.
.
.
.
.
.
.
.
.
.
.
.
.
.
.
.
.
.
.
.
.
.
.
.
.
.
.
.
.
.
.
.
.
.
.
.
.
.
.
.
.
.
.
.
.
.
.
.
.
.
.
.
.
.
.
.
.
.
.
.
.
.
.
.
.
.
.
.
.
.
.
.
.
.
.
.
.
.
.
.
.
.
.
.
.
.
.
.
.
.
.
.
.
.
.
.
.
.
.
.
.
.
.
191
191
192
192
193
193
193
194
194
195
195
196
196
197
197
197
198
198
198
199
202
202
202
202
203
203
204
205
206
206
207
207
207
208
208
208
209
209
209
209
210
210
210
210
211
5.3.13 Interactive Cleaning — Example . . . . . . . . . . . .
5.3.14 Mosaic imaging . . . . . . . . . . . . . . . . . . . . . .
5.3.15 Heterogeneous imaging . . . . . . . . . . . . . . . . . .
5.3.16 Polarization imaging . . . . . . . . . . . . . . . . . . .
5.4 Wide-field imaging and deconvolution (widefield) . . . . . .
5.4.1 ftmachine modes for widefield . . . . . . . . . . . .
5.4.1.1 pure w-projection . . . . . . . . . . . . . . .
5.4.1.2 faceting only . . . . . . . . . . . . . . . . . .
5.4.1.3 combination of w-projection and faceting . .
5.5 Combined Single Dish and Interferometric Imaging (feather)
5.6 Making Deconvolution Masks (makemask) . . . . . . . . . . .
5.7 Transforming an Image Model (ft) . . . . . . . . . . . . . . .
5.8 Image-plane deconvolution (deconvolve) . . . . . . . . . . .
5.9 Self-Calibration . . . . . . . . . . . . . . . . . . . . . . . . . .
5.10 Examples of Imaging . . . . . . . . . . . . . . . . . . . . . . .
6 Image Analysis
6.1 Common Image Analysis Task Parameters . . . . . . . .
6.1.1 Region Selection (box) . . . . . . . . . . . . . . .
6.1.2 Plane Selection (chans, stokes) . . . . . . . . .
6.1.3 Lattice Expressions (expr) . . . . . . . . . . . .
6.1.4 Masks (mask) . . . . . . . . . . . . . . . . . . . .
6.1.5 Regions (region) . . . . . . . . . . . . . . . . . .
6.2 Image Header Manipulation (imhead) . . . . . . . . . .
6.2.1 Examples for imhead . . . . . . . . . . . . . . . .
6.3 Continuum Subtraction on an Image Cube (imcontsub)
6.3.1 Examples for imcontsub) . . . . . . . . . . . . .
6.4 Image-plane Component Fitting (imfit) . . . . . . . . .
6.5 Mathematical Operations on an Image (immath) . . . .
6.5.1 Examples for immath . . . . . . . . . . . . . . . .
6.5.1.1 Simple math . . . . . . . . . . . . . . .
6.5.1.2 Polarization manipulation . . . . . . . .
6.5.1.3 Primary beam correction/uncorrection
6.5.1.4 Spectral analysis . . . . . . . . . . . . .
6.5.2 Using masks in immath . . . . . . . . . . . . . .
6.6 Computing the Moments of an Image Cube (immoments)
6.6.1 Hints for using (immoments) . . . . . . . . . . . .
6.6.2 Examples using (immoments) . . . . . . . . . . .
6.7 Computing image statistics (imstat) . . . . . . . . . . .
6.7.1 Using the task return value . . . . . . . . . . . .
6.7.2 Examples using imstat . . . . . . . . . . . . . .
6.8 Extracting data from an image (imval) . . . . . . . . .
6.9 Regridding an Image (imregrid) . . . . . . . . . . . . .
6.10 Image Convolution(imsmooth) . . . . . . . . . . . . . . .
6.11 Image Import/Export to FITS . . . . . . . . . . . . . .
.
.
.
.
.
.
.
.
.
.
.
.
.
.
.
.
.
.
.
.
.
.
.
.
.
.
.
.
.
.
.
.
.
.
.
.
.
.
.
.
.
.
.
.
.
.
.
.
.
.
.
.
.
.
.
.
.
.
.
.
.
.
.
.
.
.
.
.
.
.
.
.
.
.
.
.
.
.
.
.
.
.
.
.
.
.
.
.
.
.
.
.
.
.
.
.
.
.
.
.
.
.
.
.
.
.
.
.
.
.
.
.
.
.
.
.
.
.
.
.
.
.
.
.
.
.
.
.
.
.
.
.
.
.
.
.
.
.
.
.
.
.
.
.
.
.
.
.
.
.
.
.
.
.
.
.
.
.
.
.
.
.
.
.
.
.
.
.
.
.
.
.
.
.
.
.
.
.
.
.
.
.
.
.
.
.
.
.
.
.
.
.
.
.
.
.
.
.
.
.
.
.
.
.
.
.
.
.
.
.
.
.
.
.
.
.
.
.
.
.
.
.
.
.
.
.
.
.
.
.
.
.
.
.
.
.
.
.
.
.
.
.
.
.
.
.
.
.
.
.
.
.
.
.
.
.
.
.
.
.
.
.
.
.
.
.
.
.
.
.
.
.
.
.
.
.
.
.
.
.
.
.
.
.
.
.
.
.
.
.
.
.
.
.
.
.
.
.
.
.
.
.
.
.
.
.
.
.
.
.
.
.
.
.
.
.
.
.
.
.
.
.
.
.
.
.
.
.
.
.
.
.
.
.
.
.
.
.
.
.
.
.
.
.
.
.
.
.
.
.
.
.
.
.
.
.
.
.
.
.
.
.
.
.
.
.
.
.
.
.
.
.
.
.
.
.
.
.
.
.
.
.
.
.
.
.
.
.
.
.
.
.
.
.
.
.
.
.
.
.
.
.
.
.
.
.
.
.
.
.
.
.
.
.
.
.
.
.
.
.
.
.
.
.
.
.
.
.
.
.
.
.
.
.
.
.
.
.
.
.
.
.
.
.
.
.
.
.
.
.
.
.
.
.
.
.
.
.
.
.
.
.
.
.
.
.
.
.
.
.
.
.
.
.
.
.
.
.
.
.
.
.
.
.
.
.
.
.
.
.
.
.
.
.
.
.
.
.
.
.
.
.
.
.
.
.
.
.
.
.
.
.
.
.
.
.
.
.
.
.
.
.
.
.
.
.
.
.
.
.
.
.
.
.
.
.
.
.
.
.
.
.
.
.
.
.
.
.
.
.
.
.
.
.
.
.
.
.
.
.
.
.
.
.
.
.
.
.
.
.
.
.
.
.
.
.
.
.
.
.
.
.
.
.
.
.
.
211
214
217
217
218
220
220
220
221
221
222
224
225
225
226
.
.
.
.
.
.
.
.
.
.
.
.
.
.
.
.
.
.
.
.
.
.
.
.
.
.
.
.
227
. 228
. 228
. 228
. 229
. 230
. 230
. 231
. 232
. 234
. 235
. 235
. 236
. 236
. 236
. 238
. 238
. 239
. 240
. 241
. 243
. 243
. 244
. 245
. 247
. 248
. 250
. 251
. 251
6.11.1 FITS Image Export (exportfits) .
6.11.2 FITS Image Import (importfits) .
6.12 Using the CASA Toolkit for Image Analysis
6.13 Examples of CASA Image Analysis . . . . .
.
.
.
.
.
.
.
.
.
.
.
.
.
.
.
.
.
.
.
.
.
.
.
.
.
.
.
.
.
.
.
.
.
.
.
.
.
.
.
.
.
.
.
.
.
.
.
.
.
.
.
.
.
.
.
.
.
.
.
.
.
.
.
.
.
.
.
.
.
.
.
.
.
.
.
.
.
.
.
.
.
.
.
.
.
.
.
.
.
.
.
.
252
252
253
255
7 Visualization With The CASA Viewer
7.1 Starting the viewer . . . . . . . . . . . . . . . . . . . . . .
7.1.1 Running the CASA viewer outside casapy . . . . . .
7.2 The viewer GUI . . . . . . . . . . . . . . . . . . . . . . . .
7.2.1 The Viewer Display Panel . . . . . . . . . . . . . . .
7.2.2 Saving and Restoring Display Panel State . . . . . .
7.2.3 Region Selection and Positioning . . . . . . . . . . .
7.2.4 The Load Data Panel . . . . . . . . . . . . . . . . .
7.2.4.1 Registered vs. Open Datasets . . . . . . .
7.3 Viewing Images . . . . . . . . . . . . . . . . . . . . . . . . .
7.3.1 Viewing a raster map . . . . . . . . . . . . . . . . .
7.3.1.1 Raster Image — Basic Settings . . . . . . .
7.3.1.2 Raster Image — Other Settings . . . . . .
7.3.2 Viewing a contour map . . . . . . . . . . . . . . . .
7.3.3 Overlay contours on a raster map . . . . . . . . . . .
7.3.4 Spectral Profile Plotting . . . . . . . . . . . . . . . .
7.3.5 Managing and Saving Regions . . . . . . . . . . . . .
7.3.6 Adjusting Canvas Parameters/Multi-panel displays .
7.3.6.1 Setting up multi-panel displays . . . . . . .
7.3.6.2 Background Color . . . . . . . . . . . . . .
7.4 Viewing Measurement Sets . . . . . . . . . . . . . . . . . .
7.4.1 Data Display Options Panel for Measurement Sets .
7.4.1.1 MS Options — Basic Settings . . . . . . .
7.4.1.2 MS Options— MS and Visibility Selections
7.4.1.3 MS Options — Display Axes . . . . . . . .
7.4.1.4 MS Options — Flagging Options . . . . . .
7.4.1.5 MS Options— Advanced . . . . . . . . . .
7.4.1.6 MS Options — Apply Button . . . . . . .
7.5 Printing from the Viewer . . . . . . . . . . . . . . . . . . .
.
.
.
.
.
.
.
.
.
.
.
.
.
.
.
.
.
.
.
.
.
.
.
.
.
.
.
.
.
.
.
.
.
.
.
.
.
.
.
.
.
.
.
.
.
.
.
.
.
.
.
.
.
.
.
.
.
.
.
.
.
.
.
.
.
.
.
.
.
.
.
.
.
.
.
.
.
.
.
.
.
.
.
.
.
.
.
.
.
.
.
.
.
.
.
.
.
.
.
.
.
.
.
.
.
.
.
.
.
.
.
.
.
.
.
.
.
.
.
.
.
.
.
.
.
.
.
.
.
.
.
.
.
.
.
.
.
.
.
.
.
.
.
.
.
.
.
.
.
.
.
.
.
.
.
.
.
.
.
.
.
.
.
.
.
.
.
.
.
.
.
.
.
.
.
.
.
.
.
.
.
.
.
.
.
.
.
.
.
.
.
.
.
.
.
.
.
.
.
.
.
.
.
.
.
.
.
.
.
.
.
.
.
.
.
.
.
.
.
.
.
.
.
.
.
.
.
.
.
.
.
.
.
.
.
.
.
.
.
.
.
.
.
.
.
.
.
.
.
.
.
.
.
.
.
.
.
.
.
.
.
.
.
.
.
.
.
.
.
.
.
.
.
.
.
.
.
.
.
.
.
.
.
.
.
.
.
.
.
.
.
.
.
.
.
.
.
.
.
.
.
.
.
.
.
.
.
.
.
.
.
.
.
.
.
.
.
.
.
.
.
.
.
.
.
.
.
.
.
.
.
.
.
.
.
.
.
.
.
.
.
.
.
.
.
.
.
.
.
.
.
.
.
.
.
.
.
.
.
.
.
.
.
.
256
. 256
. 258
. 259
. 259
. 263
. 263
. 264
. 266
. 266
. 266
. 268
. 270
. 271
. 272
. 273
. 273
. 275
. 277
. 277
. 277
. 278
. 279
. 279
. 281
. 282
. 285
. 286
. 286
A Appendix: Single Dish Data Processing
A.1 Guidelines for Use of ASAP and SDtasks in CASA
A.1.1 Environment Variables . . . . . . . . . . . .
A.1.2 Assignment . . . . . . . . . . . . . . . . . .
A.1.3 Lists . . . . . . . . . . . . . . . . . . . . . .
A.1.4 Dictionaries . . . . . . . . . . . . . . . . . .
A.1.5 Line Formatting . . . . . . . . . . . . . . .
A.2 Single Dish Analysis Tasks . . . . . . . . . . . . . .
A.2.1 SDtask Summaries . . . . . . . . . . . . . .
A.2.1.1 sdaverage . . . . . . . . . . . . .
.
.
.
.
.
.
.
.
.
.
.
.
.
.
.
.
.
.
.
.
.
.
.
.
.
.
.
.
.
.
.
.
.
.
.
.
.
.
.
.
.
.
.
.
.
.
.
.
.
.
.
.
.
.
.
.
.
.
.
.
.
.
.
.
.
.
.
.
.
.
.
.
.
.
.
.
.
.
.
.
.
.
.
.
.
.
.
.
.
.
.
.
.
.
.
.
.
.
.
.
.
.
.
.
.
.
.
.
.
.
.
.
.
.
.
.
.
.
.
.
.
.
.
.
.
.
.
.
.
.
.
.
.
.
.
.
.
.
.
.
.
.
.
.
.
.
.
.
.
.
.
.
.
.
.
.
.
.
.
.
.
.
.
.
.
.
.
.
.
.
.
288
288
288
289
289
290
290
291
294
294
A.2.1.2 sdsmooth . . . . . . . . . . . . . . . . . . . . . . . . . . . . .
A.2.1.3 sdbaseline . . . . . . . . . . . . . . . . . . . . . . . . . . .
A.2.1.4 sdcal . . . . . . . . . . . . . . . . . . . . . . . . . . . . . . .
A.2.1.5 sdcoadd . . . . . . . . . . . . . . . . . . . . . . . . . . . . . .
A.2.1.6 sdflag . . . . . . . . . . . . . . . . . . . . . . . . . . . . . .
A.2.1.7 sdfit . . . . . . . . . . . . . . . . . . . . . . . . . . . . . . .
A.2.1.8 sdlist . . . . . . . . . . . . . . . . . . . . . . . . . . . . . .
A.2.1.9 sdmath . . . . . . . . . . . . . . . . . . . . . . . . . . . . . .
A.2.1.10 sdplot . . . . . . . . . . . . . . . . . . . . . . . . . . . . . .
A.2.1.11 sdsave . . . . . . . . . . . . . . . . . . . . . . . . . . . . . .
A.2.1.12 sdscale . . . . . . . . . . . . . . . . . . . . . . . . . . . . . .
A.2.1.13 sdstat . . . . . . . . . . . . . . . . . . . . . . . . . . . . . .
A.2.1.14 sdtpimaging . . . . . . . . . . . . . . . . . . . . . . . . . . .
A.2.2 Single Dish Analysis Use Cases With SDTasks . . . . . . . . . . . . .
A.2.2.1 GBT Position Switched Data Analysis . . . . . . . . . . . . .
A.2.2.2 Imaging of Total Power Raster Scans . . . . . . . . . . . . .
A.3 Using The ASAP Toolkit Within CASA . . . . . . . . . . . . . . . . . . . . .
A.3.1 Environment Variables . . . . . . . . . . . . . . . . . . . . . . . . . . .
A.3.2 Import . . . . . . . . . . . . . . . . . . . . . . . . . . . . . . . . . . . .
A.3.3 Scantable Manipulation . . . . . . . . . . . . . . . . . . . . . . . . . .
A.3.3.1 Data Selection . . . . . . . . . . . . . . . . . . . . . . . . . .
A.3.3.2 State Information . . . . . . . . . . . . . . . . . . . . . . . .
A.3.3.3 Masks . . . . . . . . . . . . . . . . . . . . . . . . . . . . . . .
A.3.3.4 Scantable Management . . . . . . . . . . . . . . . . . . . . .
A.3.3.5 Scantable Mathematics . . . . . . . . . . . . . . . . . . . . .
A.3.3.6 Scantable Save and Export . . . . . . . . . . . . . . . . . . .
A.3.4 Calibration . . . . . . . . . . . . . . . . . . . . . . . . . . . . . . . . .
A.3.4.1 Tsys scaling . . . . . . . . . . . . . . . . . . . . . . . . . . .
A.3.4.2 Flux and Temperature Unit Conversion . . . . . . . . . . . .
A.3.4.3 Gain-Elevation and Atmospheric Optical Depth Corrections
A.3.4.4 Calibration of GBT data . . . . . . . . . . . . . . . . . . . .
A.3.5 Averaging . . . . . . . . . . . . . . . . . . . . . . . . . . . . . . . . . .
A.3.6 Spectral Smoothing . . . . . . . . . . . . . . . . . . . . . . . . . . . .
A.3.7 Baseline Fitting . . . . . . . . . . . . . . . . . . . . . . . . . . . . . . .
A.3.8 Line Fitting . . . . . . . . . . . . . . . . . . . . . . . . . . . . . . . . .
A.3.9 Plotting . . . . . . . . . . . . . . . . . . . . . . . . . . . . . . . . . . .
A.3.9.1 ASAP plotter . . . . . . . . . . . . . . . . . . . . . . . . . .
A.3.9.2 Line Catalog . . . . . . . . . . . . . . . . . . . . . . . . . . .
A.3.10 Setting/Getting Rest Frequencies . . . . . . . . . . . . . . . . . . . . .
A.3.11 Single Dish Spectral Analysis Use Case With ASAP Toolkit . . . . . .
A.4 Single Dish Imaging . . . . . . . . . . . . . . . . . . . . . . . . . . . . . . . .
A.4.1 Single Dish Imaging Use Case With ASAP Toolkit . . . . . . . . . . .
A.5 Known Issues, Problems, Deficiencies and Features . . . . . . . . . . . . . . .
.
.
.
.
.
.
.
.
.
.
.
.
.
.
.
.
.
.
.
.
.
.
.
.
.
.
.
.
.
.
.
.
.
.
.
.
.
.
.
.
.
.
.
.
.
.
.
.
.
.
.
.
.
.
.
.
.
.
.
.
.
.
.
.
.
.
.
.
.
.
.
.
.
.
.
.
.
.
.
.
.
.
.
.
.
.
.
.
.
.
.
.
.
.
.
.
.
.
.
.
.
.
.
.
.
.
.
.
.
.
.
.
.
.
.
.
.
.
.
.
.
.
.
.
.
.
.
.
.
.
.
.
.
.
.
.
.
.
.
.
.
.
.
.
.
.
.
.
.
.
.
.
.
.
.
.
.
.
.
.
.
.
.
.
.
.
.
.
.
.
.
.
297
298
302
306
308
309
312
313
315
319
321
321
324
326
326
339
340
342
343
345
345
346
347
348
348
348
349
349
349
349
350
351
352
352
353
354
354
354
355
356
359
360
362
B Appendix: Simulation
365
B.1 Simulating ALMA with almasimmos . . . . . . . . . . . . . . . . . . . . . . . . . . . 365
C Appendix: Obtaining and Installing CASA
367
C.1 Installation Script . . . . . . . . . . . . . . . . . . . . . . . . . . . . . . . . . . . . . 367
C.2 Startup . . . . . . . . . . . . . . . . . . . . . . . . . . . . . . . . . . . . . . . . . . . 367
D Appendix: Python and CASA
D.1 Automatic parentheses . . . . . . . . . . . . . . . .
D.2 Indentation . . . . . . . . . . . . . . . . . . . . . .
D.3 Lists and Ranges . . . . . . . . . . . . . . . . . . .
D.4 Dictionaries . . . . . . . . . . . . . . . . . . . . . .
D.4.1 Saving and Reading Dictionaries . . . . . .
D.5 Control Flow: Conditionals, Loops, and Exceptions
D.5.1 Conditionals . . . . . . . . . . . . . . . . .
D.5.2 Loops . . . . . . . . . . . . . . . . . . . . .
D.6 System shell access . . . . . . . . . . . . . . . . . .
D.6.1 Using the os.system methods . . . . . . .
D.6.2 Directory Navigation . . . . . . . . . . . . .
D.6.3 Shell Command and Capture . . . . . . . .
D.7 Logging . . . . . . . . . . . . . . . . . . . . . . . .
D.8 History and Searching . . . . . . . . . . . . . . . .
D.9 Macros . . . . . . . . . . . . . . . . . . . . . . . . .
D.10 On-line editing . . . . . . . . . . . . . . . . . . . .
D.11 Executing Python scripts . . . . . . . . . . . . . .
D.12 How do I exit from CASA? . . . . . . . . . . . . .
.
.
.
.
.
.
.
.
.
.
.
.
.
.
.
.
.
.
.
.
.
.
.
.
.
.
.
.
.
.
.
.
.
.
.
.
.
.
.
.
.
.
.
.
.
.
.
.
.
.
.
.
.
.
.
.
.
.
.
.
.
.
.
.
.
.
.
.
.
.
.
.
.
.
.
.
.
.
.
.
.
.
.
.
.
.
.
.
.
.
.
.
.
.
.
.
.
.
.
.
.
.
.
.
.
.
.
.
.
.
.
.
.
.
.
.
.
.
.
.
.
.
.
.
.
.
.
.
.
.
.
.
.
.
.
.
.
.
.
.
.
.
.
.
.
.
.
.
.
.
.
.
.
.
.
.
.
.
.
.
.
.
.
.
.
.
.
.
.
.
.
.
.
.
.
.
.
.
.
.
.
.
.
.
.
.
.
.
.
.
.
.
.
.
.
.
.
.
.
.
.
.
.
.
.
.
.
.
.
.
.
.
.
.
.
.
.
.
.
.
.
.
.
.
.
.
.
.
.
.
.
.
.
.
.
.
.
.
.
.
.
.
.
.
.
.
.
.
.
.
.
.
.
.
.
.
.
.
.
.
.
.
.
.
.
.
.
.
.
.
.
.
.
.
.
.
.
.
.
.
.
.
.
.
.
.
.
.
.
.
.
.
.
.
.
.
.
.
.
.
.
.
.
.
.
.
.
.
.
.
.
.
.
.
.
.
.
.
.
.
.
.
.
.
368
. 368
. 369
. 369
. 370
. 370
. 372
. 372
. 374
. 375
. 375
. 377
. 377
. 379
. 379
. 381
. 382
. 382
. 383
E Appendix: The Measurement Equation and Calibration
384
E.1 The HBS Measurement Equation . . . . . . . . . . . . . . . . . . . . . . . . . . . . . 384
E.2 General Calibrater Mechanics . . . . . . . . . . . . . . . . . . . . . . . . . . . . . . . 388
F Appendix: Annotated Example Scripts
389
F.1 NGC 5921 — VLA red-shifted HI emission . . . . . . . . . . . . . . . . . . . . . . . 389
F.2 Jupiter — VLA continuum polarization . . . . . . . . . . . . . . . . . . . . . . . . . 414
F.3 BIMA Mosaic Spectral Imaging . . . . . . . . . . . . . . . . . . . . . . . . . . . . . . 453
G Appendix: CASA Dictionaries
G.1 AIPS – CASA dictionary . . . . . . . . . . . . . . . . . . . . . . . . . . . . . . . .
G.2 MIRIAD – CASA dictionary . . . . . . . . . . . . . . . . . . . . . . . . . . . . . .
G.3 CLIC – CASA dictionary . . . . . . . . . . . . . . . . . . . . . . . . . . . . . . . .
473
. 473
. 473
. 473
H Appendix: Writing Tasks in CASA
H.1 The XML file . . . . . . . . . . . .
H.2 The task yourtask.py file . . . .
H.3 Example: The clean task . . . . .
H.3.1 File clean.xml . . . . . .
.
.
.
.
.
.
.
.
.
.
.
.
.
.
.
.
.
.
.
.
.
.
.
.
.
.
.
.
.
.
.
.
.
.
.
.
.
.
.
.
.
.
.
.
.
.
.
.
.
.
.
.
.
.
.
.
.
.
.
.
.
.
.
.
.
.
.
.
.
.
.
.
.
.
.
.
.
.
.
.
.
.
.
.
.
.
.
.
.
.
.
.
.
.
.
.
.
.
.
.
.
.
.
.
.
.
.
.
.
.
.
.
476
476
480
480
480
H.3.2 File task clean.py . . . . . . . . . . . . . . . . . . . . . . . . . . . . . . . . 498
List of Tables
2.1
2.2
Common MS Columns . . . . . . . . . . . . . . . . . . . . . . . . . . . . . . . . . . . 78
Commonly accessed MAIN Table columns . . . . . . . . . . . . . . . . . . . . . . . . . 79
4.1
Recognized Flux Density Calibrators. . . . . . . . . . . . . . . . . . . . . . . . . . . . 138
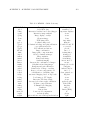
G.1 MIRIAD – CASA dictionary . . . . . . . . . . . . . . . . . . . . . . . . . . . . . . . 474
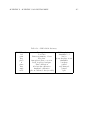
G.2 CLIC–CASA dictionary . . . . . . . . . . . . . . . . . . . . . . . . . . . . . . . . . . 475
14
List of Figures
1.1
1.2
1.3
1.4
1.5
1.6
1.7
1.8
Screen shot of the default CASA inputs for task clean. . . . . . . . . . . . . . . .
The clean inputs after setting values away from their defaults (blue text). Note that
some of the boldface ones have opened up new dependent sub-parameters (indented
and green). . . . . . . . . . . . . . . . . . . . . . . . . . . . . . . . . . . . . . . . .
The clean inputs where one parameter has been set to an invalid value. This is
drawn in red to draw attention to the problem. This hapless user probably confused
the ’hogbom’ clean algorithm with Harry Potter. . . . . . . . . . . . . . . . . . .
The CASA Logger GUI window under Linux. Note that under MacOSX a stripped
down logger will instead appear as a Console. . . . . . . . . . . . . . . . . . . . . .
Using the Search facility in the casalogger. Here we have specified the string
’plotted’ and it has highlighted all instances in green. . . . . . . . . . . . . . . .
Using the casalogger Filter facility. The log output can be sorted by Priority, Time,
Origin, and Message. In this example we are filtering by Origin using ’clean’, and
it now shows all the log output from the clean task. . . . . . . . . . . . . . . . . .
CASA Logger - Insert facility: The log output can be augmented by adding notes
or comments during the reduction. The file should then be saved to disk to retain
these changes. . . . . . . . . . . . . . . . . . . . . . . . . . . . . . . . . . . . . . . .
Flow chart of the data processing operations that a general user will carry out in an
end-to-end CASA reduction session. . . . . . . . . . . . . . . . . . . . . . . . . . .
. 53
. 54
. 55
. 58
. 59
. 60
. 61
. 65
2.1
The contents of a Measurement Set. These tables compose a Measurement Set named
ngc5921.demo.ms on disk. This display is obtained by using the File:Open menu
in browsetable and left double-clicking on the ngc5921.demo.ms directory. . . . . . 77
3.1
The plotxy plotter, showing the Jupiter data versus uv-distance. You can see bad
data in this plot. The bottom set of buttons on the lower left are: 1,2,3) Home,
Back, and Forward. Click to navigate between previously defined views (akin to
web navigation). 4) Pan. Click and drag to pan to a new position. 5) Zoom. Click
to define a rectangular region for zooming. 6) Subplot Configuration. Click to
configure the parameters of the subplot and spaces for the figures. 7) Save. Click
to launch a file save dialog box. The upper set of buttons in the lower left
are: 1) Mark Region. Press this to begin marking regions (rather than zooming or
panning). 2,3,4) Flag, Unflag, Locate. Click on these to flag, unflag, or list the
data within the marked regions. 5) Next. Click to move to the next in a series of
iterated plots. Finally, the cursor readout is on the bottom right. . . . . . . . . . . 104
15
3.2
3.3
3.4
3.5
3.6
3.7
3.8
3.9
4.1
4.2
4.3
4.4
4.5
4.6
The plotxy iteration plot. The first set of plots from the example in § 3.4.3.1 with
iteration=’antenna’. Each time you press the Next button, you get the next
series of plots. . . . . . . . . . . . . . . . . . . . . . . . . . . . . . . . . . . . . . . . . 110
Multi-panel display of visibility versus channel (top), antenna array configuration
(bottom left) and the resulting uv coverage (bottom right). The commands to
make these three panels respectively are: 1) plotxy(’ngc5921.ms’, xaxis=’channel’,
datacolumn=’data’, field=’0’, subplot=211, plotcolor=’’, plotsymbol=’go’)
2) plotxy(’ngc5921.ms’, xaxis=’x’, field=’0’, subplot=223, plotsymbol=’r.’),
3) plotxy(’ngc5921.ms’, xaxis=’u’, yaxis=’v’, field=’0’, subplot=224, plotsymbol=’b,’,figf
. . . . . . . . . . . . . . . . . . . . . . . . . . . . . . . . . . . . . . . . . . . . . . . . 113
Plot of amplitude versus uv distance, before (left) and after (right) flagging two
marked regions. The call was: plotxy(vis=’ngc5921.ms’,xaxis=’uvdist’, field=’1445*’).
. . . . . . . . . . . . . . . . . . . . . . . . . . . . . . . . . . . . . . . . . . . . . . . . 115
flagdata: Example showing before and after displays using a selection of one antenna and a range of channels. Note that each invocation of the flagdata task represents a cumulative selection, i.e., running antenna=’0’ will flag all data with antenna
0, while antenna=’0’, spw=’0:10 15’ will flag only those channels on antenna 0. . . 123
flagdata: Flagging example using the clip facility. . . . . . . . . . . . . . . . . . . 124
browsetable: The browser displays the main table within a frame. You can scroll
through the data (x=columns of the MAIN table, and y=the rows) or select a specific
page or row as desired. By default, 1000 rows of the table are loaded at a time, but
you can step through the MS in batches. . . . . . . . . . . . . . . . . . . . . . . . . . 125
browsetable: You can use the tab for Table Keywords to look at other tables within
an MS. You can then double-click on a table to view its contents. . . . . . . . . . . . 126
browsetable: Viewing the SOURCE table of the MS. . . . . . . . . . . . . . . . . . . 127
Flow chart of synthesis calibration operations. Not shown are use of table manipulation and plotting tasks accum, plotcal, and smoothcal (see Figure 4.2). . . . .
Chart of the table flow during calibration. The parameter names for input or output
of the tasks are shown on the connectors. Note that from the output solver through
the accumulator only a single calibration type (e.g. ’B’, ’G’) can be smoothed,
interpolated or accumulated at a time. The final set of cumulative calibration tables
of all types are then input to applycal as shown in Figure 4.1. . . . . . . . . . .
Display of the amplitude (upper) and phase (lower) gain solutions for all antennas
and polarizations in the ngc5921 post-fluxscale table. . . . . . . . . . . . . . . .
Display of the amplitude (upper), phase (middle), and signal-to-noise ratio (lower)
of the bandpass ’B’ solutions for antenna=’0’ and both polarizations for ngc5921.
Note the falloff of the SNR at the band edges in the lower panel. . . . . . . . . . .
Display of the amplitude of the bandpass ’B’ solutions. Iteration over antennas was
turned on using iteration=’antenna’. The first page is shown. The user would
use the Next button to advance to the next set of antennas. . . . . . . . . . . . .
The ’amp’ of gain solutions for NGC4826 before (top) and after (bottom) smoothing
with a 7200 sec smoothtime and smoothtype=’mean’. Note that the first solution
is in a different spw and on a different source, and is not smoothed together with the
subsequent solutions. . . . . . . . . . . . . . . . . . . . . . . . . . . . . . . . . . . .
. 130
. 133
. 164
. 166
. 167
. 169
4.7
The ’phase’ of gain solutions for NGC4826 before (top) and after (bottom) ’linear’
interpolation onto a 20 sec accumtime grid. The first scan was 3C273 in spw=’0’
while the calibrator scans on 1331+305 were in spw=’1’. The use of spwmap was
necessary to transfer the interpolation correctly onto the NGC4826 scans. . . . . . .
4.8 The final ’amp’ (top) and ’phase’ (bottom) of the self-calibration gain solutions for
Jupiter. An initial phase calibration on 10s solint was followed by an incremental
gain solution on each scan. These were accumulated into the cumulative solution
shown here. . . . . . . . . . . . . . . . . . . . . . . . . . . . . . . . . . . . . . . . .
4.9 The final ’amp’ versus ’uvdist’ plot of the self-calibrated Jupiter data, as shown
in plotxy. The ’RR LL’ correlations are selected. No outliers that need flagging are
seen. . . . . . . . . . . . . . . . . . . . . . . . . . . . . . . . . . . . . . . . . . . . .
4.10 Use of plotxy to display corrected data (red and blue points) and uv model fit data
(green circles). . . . . . . . . . . . . . . . . . . . . . . . . . . . . . . . . . . . . . . .
5.1
5.2
5.3
5.4
5.5
Close-up of the top of the interactive clean window. Note the boxes at the left (where
the iterations, cycles, and threshold can be changed), the buttons that control
add/erase, the application of mask to channels, and whether to stop, complete, or
continue cleaning, and the row of Mouse-button tool assignment icons. . . . . . . .
Screen-shots of the interactive clean window during deconvolution of the VLA 6m
Jupiter dataset. We start from the calibrated data, but before any self-calibration.
In the initial stage (left), the window pops up and you can see it dominated by a
bright source in the center. Next (right), we zoom in and draw a box around this
emission. We have also at this stage dismissed the tape deck and Position Tracking
parts of the display (§ 7.2.1) as they are not used here. We have also changed the
iterations to 30 for this boxed clean. We will now hit the Next Action Continue
Cleaning button (the green clockwise arrow) to start cleaning. . . . . . . . . . .
We continue in our interactive cleaning of Jupiter from where Figure 5.2 left off. In
the first (left) panel, we have cleaned 30 iterations in the region previously marked,
and are zoomed in again ready to extend the mask to pick up the newly revealed
emission. Next (right), we have used the Polygon tool to redraw the mask around
the emission, and are ready to Continue Cleaning for another 100 iterations. . .
We continue in our interactive cleaning of Jupiter from where Figure 5.3 left off. In
the first (left) panel, it has cleaned deeper, and we come back and zoom in to see
that our current mask is good and we should clean further. We change npercycle
to 500 (from 100) in the box at upper right of the window. In the final panel (right),
we see the results after this clean. The residuals are such that we should terminate
the clean using the red X button and use our model for self-calibration. . . . . . .
After clean and self-calibration using the intensity image, we arrive at the final
polarization image of Jupiter. Shown in the viewer superimposed on the intensity
raster is the linear polarization intensity (green contours) and linear polarization
B-vectors (vectors). The color of the contours and the sampling and rotation by 90
degrees of the vectors was set in the Display Options panel. A LEL expression was
used in the Load Data panel to mask the vectors on the polarized intensity. . . . .
172
175
178
186
. 204
. 212
. 213
. 214
. 215
5.6
Screen-shot of the interactive clean window during deconvolution of the NGC5921
spectral line dataset. Note where we have selected the mask to apply to the Displayed
Plane rather than All Channels. We have just used the Polygon tool to draw a
mask region around the emission in this channel, which will apply to this channel
only. . . . . . . . . . . . . . . . . . . . . . . . . . . . . . . . . . . . . . . . . . . . . 216
6.1
NGC2403 VLA moment zero (left) and NGC4826 BIMA moment one (right) images
as shown in the viewer. . . . . . . . . . . . . . . . . . . . . . . . . . . . . . . . . . . 244
7.1
The Viewer Display Panel (left) and Data Display Options (right) panels that
appear when the viewer is called with the image cube from NGC5921 (viewer(’ngc5921.usecase.clean.i
The initial display is of the first channel of the cube. . . . . . . . . . . . . . . . . . . 257
7.2 The Viewer Display Panel (left) and Data Display Options (right) panels that
appear when the viewer is called with the NGC5921 Measurement Set (viewer(’ngc5921.usecase.ms’)).2
7.3 The display panel’s Main Toolbar appears directly below the menus and contains
’shortcut’ buttons for most of the frequently-used menu items. . . . . . . . . . . . . 261
7.4 The ’Mouse Tool’ Bar allows you to assign separate mouse buttons to tools you
control with the mouse within the image display area. Initially, zooming, color
adjustment, and rectangular regions are assigned to the left, middle and right mouse
buttons, respectively. . . . . . . . . . . . . . . . . . . . . . . . . . . . . . . . . . . . . 261
7.5 The Load Data - Viewer panel that appears if you open the viewer without any
infile specified, or if you use the Data:Open menu or Open icon. You can see the
images and MS available in your current directory, and the options for loading them. 265
7.6 The Load Data - Viewer panel as it appears if you select an image. You can see
all options are available to load the image as a Raster Image, Contour Map, Vector
Map, or Marker Map. In this example, clicking on the Raster Image button would
bring up the displays shown in Figure 7.1. . . . . . . . . . . . . . . . . . . . . . . . . 267
7.7 The Basic Settings category of the Data Display Options panel as it appears
if you load the image as a Raster Image. This is a zoom-in for the data displayed
in Figure 7.1. . . . . . . . . . . . . . . . . . . . . . . . . . . . . . . . . . . . . . . . . 268
7.8 Example curves for scaling power cycles. . . . . . . . . . . . . . . . . . . . . . . . . . 270
7.9 The Viewer Display Panel (left) and Data Display Options panel (right) after
choosing Contour Map from the Load Data panel. The image shown is for channel
11 of the NGC5921 cube, selected using the Animator tape deck, and zoomed in
using the tool bar icon. Note the different options in the open Basic Settings
category of the Data Display Options panel. . . . . . . . . . . . . . . . . . . . . . 271
7.10 The Viewer Display Panel (left) and Data Display Options panel (right) after
overlaying a Contour Map of velocity on a Raster Image of intensity. The image
shown is for the moments of the NGC5921 cube, zoomed in using the tool bar icon.
The tab for the contour plot is open in the Data Display Options panel. . . . . . 273
7.11 The Image Profile panel that appears if you use the Tools:Spectral Profile
menu, and then use the rectangle or polygon tool to select a region in the image.
You can also use the crosshair to get the profile at a single position in the image.
The profile will change to track movements of the region or crosshair if moved by
dragging with the mouse. . . . . . . . . . . . . . . . . . . . . . . . . . . . . . . . . . 274
7.12 The Region Manager panel that appears if you select the Tools:Region Manager
menu item. . . . . . . . . . . . . . . . . . . . . . . . . . . . . . . . . . . . . . . . .
7.13 Selecting an image region with the polygon tool. . . . . . . . . . . . . . . . . . . .
7.14 A multi-panel display set up through the Viewer Canvas Manager. . . . . . . .
7.15 The Load Data - Viewer panel as it appears if you select an MS. The only option
available is to load this as a Raster Image. In this example, clicking on the Raster
Image button would bring up the displays shown in Figure 7.2. . . . . . . . . . . .
7.16 The MS for NGC4826 BIMA observations has been loaded into the viewer. We see
the first of the spw in the Display Panel, and have opened up MS and Visibility
Selections in the Data Display Options panel. The display panel raster is not
full of visibiltiies because spw 0 is continuum and was only observed for the first few
scans. This is a case where the different spectral windows have different numbers of
channels also. . . . . . . . . . . . . . . . . . . . . . . . . . . . . . . . . . . . . . . .
7.17 The MS for NGC4826 from Figure 7.16, now with the Display Axes open in the
Data Display Options panel. By default, channels are on the Animation Axis
and thus in the tapedeck, while spectral window and polarization are on the
Display Axes sliders. . . . . . . . . . . . . . . . . . . . . . . . . . . . . . . . . . .
7.18 The MS for NGC4826, continuing from Figure 7.17. We have now put spectral
window on the Animation Axis and used the tapedeck to step to spw 2, where we
see the data from the rest of the scans. Now channels is on a Display Axes slider,
which has been dragged to show Channel 33. . . . . . . . . . . . . . . . . . . . . .
7.19 Setting up to print to a file. The background color has been set to white, the line
width to 2, and the print resolution to 600 dpi (for an postscript plot). To make the
plot, use the Save button on the Viewer Print Manager panel (positioned in the
figure in the upper right) and select a format with the drop-down, or use the Print
button to send directly to a printer. . . . . . . . . . . . . . . . . . . . . . . . . . .
A.1 Wiring diagram for the SDtask sdcal. The stages of processing within the task are
shown, along with the parameters that control them. . . . . . . . . . . . . . . . .
A.2 Total power data display using sdtpimaging, with calmode=’baseline’. The top
panel shows uncalibrated data versus row numbers.The middle panel shows baseline
fitting of each scan (only shown here the last scan). The bottom panel shows the
calibrated (baseline subtracted) data. . . . . . . . . . . . . . . . . . . . . . . . . .
A.3 Multi-panel display of the scantable. There are two plots per scan indicating the
psr (reference position data) and the ps (source data). . . . . . . . . . . . . . . .
A.4 Two panel plot of the calibrated spectra. The GBT data has a separate scan for the
SOURCE and REFERENCE positions so scans 20,21,22 and 23 result in these two
spectra. . . . . . . . . . . . . . . . . . . . . . . . . . . . . . . . . . . . . . . . . . .
A.5 Calibrated spectrum with a line at zero (using histograms). . . . . . . . . . . . . .
A.6 FLS3a HI emission. The display illustrates the visualization of the data cube (left)
and the profile display of the cube at the cursor location (right); the Tools menu of
the Viewer Display Panel has a Spectral Profile button which brings up this display.
By default, it grabs the left-mouse button. Pressing down the button and moving in
the display will show the profile variations. . . . . . . . . . . . . . . . . . . . . . .
. 275
. 276
. 277
. 278
. 280
. 282
. 283
. 287
. 293
. 340
. 357
. 358
. 358
. 362
Chapter 1
Introduction
This document describes how to calibrate and image interferometric and single-dish radio astronomical data using the CASA (Common Astronomy Software Application) package. CASA is a
suite of astronomical data reduction tools and tasks that can be run via the IPython interface to
Python. CASA is being developed in order to fulfill the data post-processing requirements of the
ALMA and EVLA projects, but also provides basic and advanced capabilities useful for the analysis
of data from other radio, millimeter, and submillimeter telescopes.
You have in your hands the Beta Release of CASA. This means that there are a number of
caveats and limitations for the use of this package. See § 1.1 below for more information, and pay
heed to the numerous BETA ALERTs placed throughout this cookbook. You can expect regular
updates and patches, as well as increasing functionality. But you can also expect interface changes.
The goals of this Beta Release are to get the package out into the hands of real users so you can
take it for a spin. Please knock it about a bit, but remember it is not a polished, finished product.
Beware!
This cookbook is a task-based walk-through of interferometric data reduction and analysis. In CASA, tasks repInside the Toolkit:
resent the more streamlined operations that a typical user Throughout this Cookbook, we will
would carry out. The idea for having tasks is that they occasionally intersperse boxed-off
are simple to use, provide a more familiar interface, and pointers to parts of the toolkit that
are easy to learn for most astronomers who are familiar power users might want to explore.
with radio interferometric data reduction (and hopefully
for novice users as well). In CASA, the tools provide the
full capability of the package, and are the atomic functions that form the basis of data reduction.
These tools augment the tasks, or fill in gaps left by tasks that are under development but not yet
available. See the CASA User Reference Manual for more details on the tools. Note that in
most cases, the tasks are Python interface scripts to the tools, but with specific, limited access to
them and a standardized interface for parameter setting. The tasks and tools can be used together
to carry out more advanced data reduction operations.
For the moment, the audience is assumed to have some basic grasp of the fundamentals of synthesis
imaging, so details of how a radio interferometer or telescope works and why the data needs to
20
CHAPTER 1. INTRODUCTION
21
undergo calibration in order to make synthesis images are left to other documentation — a good
place to start might be Synthesis Imaging in Radio Astronomy II (1999, ASP Conference Series
Vol. 180, eds. Taylor, Carilli & Perley).
This cookbook is broken down by the main phases of data analysis:
• data import, export, and selection (Chapter 2),
• examination and flagging of data (Chapter 3),
• interferometric calibration (Chapter 4),
• interferometric imaging (Chapter 5),
• image analysis (Chapter 6), and
• data and image visualization (Chapter 7).
BETA ALERT: For the Beta Release, there are also special chapters in the Appendix on
• single dish data analysis (Chapter A), and
• simulation (Chapter B).
These are included for users that will be doing EVLA and ALMA telescope commissioning and
software development. They will become part of the main cookbook in later releases.
The general appendices provide more details on what’s happening under the hood of CASA, as
well as supplementary material on tasks, scripts, and relating CASA to other packages. These
appendices include:
• obtaining and installing CASA (Appendix C),
• more details about Python and CASA (Appendix D),
• a discussion of the Hamaker-Bregman-Sault Measurement Equation (Appendix E),
• annotated scripts for typical data reduction cases (Appendix F), and
• CASA dictionaries to AIPS, MIRIAD, and CLIC (Appendix G).
• Writing your own CASA Task (Appendix H).
The CASA User Documentation includes:
• CASA Synthesis & Single Dish Reduction Cookbook — this document, a task-based
data analysis walk-through and instructions;
• CASA in-line help — accessed using help in the casapy interface;
CHAPTER 1. INTRODUCTION
22
• The CASA Toolkit Reference Manual — details on a specific task or tool does and how
to use it.
• The CASA Task Reference Manual — the information from the inline help and task
documentation, available online in HTML.
The CASA home page can be found at:
http://casa.nrao.edu
From there you can find documentation and assistance for the use of the package, including the
User Documentation. You will also find information on how to obtain the latest release and receive
user support.
1.1
About This Beta Release
Currently, CASA is in the Beta Release stage. This
means that much, but not all, of the eventual functionality
Beta Alert!
is available. Furthermore, the package is still under devel- Boxes like this will bring to your atopment, and some features might change in future releases. tention some of the features (or lack
This should be taken into account as users begin to learn thereof) in the current Beta release
the package. We will do our best to point out commands, version of CASA.
tasks, and parameters that are likely to change underfoot.
Unfortunately, bugs and crashes also come along with the Beta release territory. We will do our
best to stamp these out as soon as we find them, but sometimes known bugs will persist until we
can find the right time to fix them (like in a task that we know we want to make a big change
to next month). See the release notes for the current version for more details. In this cookbook,
we will try to point out known pitfalls and workarounds in the Beta Alert boxes, or in BETA
ALERT notes in the text.
Not only is the software in Beta Release, but this cookbook is also a living document. You can expect
this document, as well as other on-line and in-line user support guides, to be updated regularly.
Also, feel free to send us comments and suggestions on the contents of our documentation.
Please check the CASA Home page (http://casa.nrao.edu) regularly to look for updates to the
release and to the documentation, and to check the list of known problems. You can find the
contact information for feedback here also.
We also note here that we are also in the process of commissioning our User Support system for
CASA. Thus, we can only support a limited number of official Beta Release Users at this time.
See the CASA Home Page for more information on the policies and conditions on obtaining and
getting support for this Beta Release.
CHAPTER 1. INTRODUCTION
1.1.1
23
What’s New in Beta Patch 4
This Cookbook is for CASA Beta Release Patch 4 (version Versions 2.4.0). This patch differs from
previous versions of CASA in a number of ways:
• New interface changes:
– The AIPSPATH environment variable is now the CASAPATH variable.
– If you type help task without quotes around the task name, you will get two copies
of the help with alot of extraneous stuff. This is a bug introduced in 2.4.0 and will be
fixed in later releases.
• New data handling features:
– A number of importvla improvements were made:
1. In previous releases, importvla did not provide a valid DOPPLER subtable. This has
been fixed in 2.4.0. release.
2. The keepblanks parameter is defaulted to False, so tipping scans will not be included in the measurement set. Setting this to True will include the tipping scans.
3. Data edited as having zero weight are now flagged, instead of simply being carried
around with a weight of 0. This fixes an issue in the viewer where existing flags
were ignored while performing additional flagging.
4. VLA antennas are now sorted into numerical (name) order, and the station naming
has been enhanced to include the VLA/EVLA distinction.
5. Duplicate field names for different source positions in the archive (a rare occurence)
are resolved with an appended digit to permit selecting such fields uniquely in subsequent processing.
– The task importuvfits has a new parameter antnamescheme (as in importvla) which
when set to ’new’ and you are importing VLA data, then it will prepend either VA or
EV to the antenna name (§ 2.2.1.1).
– Data can be compressed in importasdm by setting compression = True (§ 2.2.3).
– The concat task now has a timesort parameter to trigger time-based resorting of the
output MS (§ 2.5).
– A number of changes to listobs output, including reporting of rest frequency and
velocity information, integration time, source identification, time frame (§ 2.3).
– There is a prototype vishead task that allows the user to manipulate some common
metadata items in a measurement set (e.g. to list, get, and put values) (§ 2.4).
– A new task called rmtables has been created to cleanly remove tables. This helps if
the user is trying to process data (e.g. an image) from scratch, and not continue from a
previous session. It will not remove things that have open handles (§ 1.4.3.1).
• New plotting and flagging features:
– A number of changes were made to flagdata (§ 3.5):
CHAPTER 1. INTRODUCTION
24
1. The task now has the feature where some parameters can take lists, so only one
invocation of the task can apply any number of flagging specification
2. The task now uses the standard selectdata parameters.
3. The correlation sub-parameter now takes more options, e.g. ’RR LL’, ’RR,LL’,
etc.
4. The mode parameter now has a ’shadow’ option.
– The task plotants now has the capability to save a plot as a file (parameter figfile).
(§ 3.7).
– There is a new prototype MS plotting application casaplotms. This is experimental
and under active development, and is not yet integrated into casapy (§ 3.8).
• New synthesis calibration features:
– There are models for 3C147 at C and X band now available in setjy (§ 4.3.4).
– In the calibration tasks, there is now a minblperant parameter, which enables the user
to control the minimum number of baselines required for an antenna to be solved for
(§ 4.4.1.5).
– The task split can now go directly from a multi SPW measurement set to a time
averaged one with the same set of SPWs, and/or split to a single SPW at the same time
(§ 4.7.1).
– The split task can now do frequency averaging then time averaging consecutively with
no issues. (§ 4.7.1).
– The split task datacolumn parameter now takes options ’data’, ’corrected’, ’model’,
’all’ (§ 4.7.1).
• New synthesis imaging features:
– A number of clean improvements were made:
1. The mode parameter has a new sub-parameter interpolation to control how data
is gridded onto the spectral cube axis in channel, velolcity, and frequency modes.
This has 3 possible values: ‘nearest’, ‘linear’, and ‘cubic’. (§ 5.2.5.5).
2. There were a number of cosmetic and fuctional changes made to the interactive
clean viewer panel (§ 5.3.5).
3. In clean if you are reducing data from a telescope whose beam is not found in the
list of known arrays in CASA, the dish diameter (found in the antenna table) is
used to scale an Airy disk pattern beam (§ 5.2.13).
4. Option stokes = ’IQU’ is now available.
5. The psfmode settings ’hogbom’ does sequential cleaning while ’clark’ and ’csclean’
do joint convolution.
6. For imagermode=’mosaic’ the minpb parameter now cuts the imaging off at the
specified level in the unweighted primary-beam coverage, as reflected in the new
output image <imagename>.flux.pbcoverage (§ 5.3.7).
• New image analysis features:
CHAPTER 1. INTRODUCTION
25
– All of the WCS projections for FITS images described in the FITS standard v3.0 are
now supported by CASA. CASA will read and write standard-compliant FITS images.
FITS image files that are not WCS compliant are accepted by applying a dummy linear
coordinate along each axis.
– In FITS images, all brightness units complying with the FITS standard v3.0 are recognized. Non-recognized units are accepted and treated as ”non-dimensional”. The unit
maps in quanta and the FITS unit add-on were extended to cover the FITS standard
v3.0.
– There is a new task called imsmooth that will smooth images in the spectral and XY
planes. (§ 6.10).
– All of the image analysis tasks (imstat, imval, etc.) with the region parameter have
been updated to take as input: region file name saved by the viewers region manager,
region name stored with the image given by imagename, region in any image with the
syntax image filename:region name.
• New viewer features:
– The viewer Maximum Contour slider has been replaced with the Unit Contour slider,
found under basic settings (§ 7.3.2).
– The region manager on the viewer has changed, and you can now save regions with an
image file and/or on disk (§ 7.3.5).
• New single-dish processing features:
– The sdfit task now has the capability to plot the whole spectral region to see the entire
spectral shape when the fitted result is verified (§ A.2.1.7).
– In the sdbaseline and sdcal tasks the parameter interactive has been renamed as
verify (§ A.2.1).
– In the sdcal task interactive mask selection is enabled with blmode = ’interact’
(§ A.2.1.4).
– It is now possible in sdplot to get statistics by selecting a region with mouse button on
a plot displayed by the task. (§ A.2.1.10).
– There are a number of other changes, as this CASA module is under continuous development. See the Appendix A for the latest guide.
• New simulator features:
– The simulator task is now called simdata (used to be almasimmos). This task has many
new features (§ B).
1.1.1.1
Previous changes in Patch3
CASA Beta Release Patch 3 (version 2.3.0) was released in December 2008. In January 2009, we
released an update to Patch 3 as Version 2.3.1. This fixed and updated a small number of issues
encountered in the original Patch 3 release version 2.3.0.
CHAPTER 1. INTRODUCTION
26
• New interface changes:
– The versioning of CASA has changed such that the startup and casalog.version now
report Version X.Y.Z where X=2 for the Beta Release, Y is the Patch number, and Z
is the sub-patch release. For example, the December 2008 Patch 3.0 release is Version
2.3.0.
• New data handling features:
– The importasdm task now has better handling of ALMA ATF data (§ 2.2.3).
• New plotting and flagging features:
– The plotxy task now has the extendflag parameter and sub-parameters that allow the
extension of interactive flagging to data cells beyond those plotted (§ 3.4.6).
– The plotxy task now has the restfreq parameter and sub-parameters that allow the
setting of a rest frequency or transition name as well as frame info (§ 3.4.7).
• New synthesis calibration features:
– The bandtype=’BPOLY’ option now has the capability of getting solutions in different
sets of spectral windows (§ 4.4.2.3).
• New synthesis imaging features:
– NEW: widefield — a prototype task to make wide-field (e.g. low frequency) images
using w-projection and/or faceting. Includes the ability to image multiple flanking fields
set up using a box file (§ 5.4).
– The clean task now handles multiple dish sizes for heterogeneous imaging (§ 5.3.15).
– The clean task has been improved in its handling of mosaics (§ 5.3.14).
• New image analysis features:
– NEW: imval — a task that will return the data values in an image at a given pixel or
in a specified region (§ 6.8).
– The imfit task has improved reporting of fit results (§ 6.4).
– The task regrid has been renamed imregrid. This task will regrid an image onto a
template image (§ 6.9).
• New viewer features:
– The viewer now includes the ability to Save and Restore the GUI settings via a Data
menu item (§ 7.2.2).
– There is now improved control and appearance of Printing from the viewer (§ 7.5).
• New documentation features:
– There is now an appendix on how to write and include your own CASA tasks, intended
for the power-user (§ H).
– There is now an online CASA Task Reference Manual.
CHAPTER 1. INTRODUCTION
1.1.1.2
27
Previous changes introduced in Patch 2
These were changes made in July 2008 with Beta Release Patch 2.0–2.2:
• New interface changes:
– Global parameters (variables) are not changed in task calls (§ 1.3.5.1).
– Global parameters (variables) are not used if a task is called as a function with one or
more arguments specified, e.g. task(arg1=val1,...). Non-specified parameters are
defaulted to the task-specific default values (§ 1.3.2).
– Return values from tasks are used instead of output variables (§ 1.3.3).
• New data handling features:
– The concat task now takes multiple input MS and will combine into a possibly new
output MS (§ 2.5).
• New synthesis calibration features:
– The calibration tasks now include a combine which allows control of the scope of solutions
(§ 4.4.1.5).
– The behavior of the solint parameter has changed, with solint=0 now giving perintegration solutions instead of per-scan. This is used in conjunction with combine to
control solution scope (§ 4.4.1.5).
• New synthesis imaging features:
– The clean task now incorporates the features of old tasks invert and mosaic, with
added capabilities (§ 5.3).
• New image analysis features:
– Lattice Expression Language (LEL) in the image analysis tasks and tools is now fully 0based, while previously it was partly 1-based. This is most noticeable in the immoments
task with the planes parameter, and in using the INDEXIN LEL function in the ia tool
methods (§ 6.1.3).
– NEW: imfit — a task to do image-plane Gaussian fitting (§ 6.4).
– The immath task now includes the options to make spectral index, linearly polarized
intensity and angle images (§ 6.5).
• New viewer features:
– The viewer now includes a Region Manager tool that can save the last box or polygon
region to a file. In addition, the pixel coordinates under the cursor are displayed in the
Position Tracking panel. (§ 7).
WARNING: Some of these changes will require scripts from Patch 1 or earlier to be changed.
In some cases, you may not get an error but will get noticeably different behavior (e.g. from the
solint changes in Calibration).
CHAPTER 1. INTRODUCTION
1.2
28
CASA Basics — Information for First-Time Users
This section assumes that CASA has been installed on your LINUX or OSX system. See Appendix C
for instructions on how to obtain and install CASA.
1.2.1
Before Starting CASA
First, you will most likely be starting CASA running from a working directory that has your data
in it, or at least where you want your output to go. It is easiest to start from there rather than
changing directories inside casapy. BETA ALERT: There is at least one task (plotxy) that fails
if the path to your working directory contains spaces in its name, e.g. /users/smyers/MyTest/ is
fine, but /users/smyers/My Test/ is not! We will try to bulletproof the file-handling better.
If you have done a default installation under Linux using rpms, or on the Mac with the CASA
application, then there should be a sh script called casapy in the /usr/bin area which is in your
path. This shell will set up its environment and run the version of casapy that it points to. If this
is how you set up the system, then you need to nothing further and can run casapy.
Depending on your setup, there may be other specially built versions available. For example at the
NRAO AOC, the “stable build” can be started by running “casapy-test”, e.g.
/usr/bin/casapy-test
On some systems, particularly if you have multiple versions installed, to define environment variables and the casapy alias, you will need to run one of the casainit shell scripts. The location of
the startup scripts for CASA will depend upon where you installed CASA on your system. For a
default installation this will likely be in /usr/lib/casapy/. For example, at the NRAO AOC, the
current release is executed as
/usr/bin/casapy
and uses the pathname to
/usr/lib/casapy/23.0.6654-001
Sometimes, you will have multiple non-default versions (for example, various development versions).
For example at the NRAO AOC, the “stable build” is in /home/casa. Then, to use this version:
In bash:
> . /home/casa/casainit.sh
or for csh:
> source /home/casa/casainit.csh
depending on what shell you are running (Bourne or [t]csh).
BETA ALERT: If you want to run the casabrowser (see § 3.6) outside of the casapy shell, then
you will need to put the CASA root in your path using one of the above mechanisms.
CHAPTER 1. INTRODUCTION
1.2.1.1
29
Environment Variables
Before starting up casapy, you should set or reset any environment variables needed, as CASA
will adopt these on startup. For example, the PAGER environment variable determines how help is
displayed in the CASA terminal window (see § 1.2.8.3). The choices are less, more, and cat.
In bash, pick one of
PAGER=less
PAGER=more
PAGER=cat
followed by
export PAGER
In csh or tcsh, pick one of
setenv PAGER less
setenv PAGER more
setenv PAGER cat
The actions of these are as if you were using the equivalent Unix shell command to view the help
material. See § 1.2.8.3 for more information on these choices. We recommend using the cat option
for most users, as this works smoothly both interactively and in scripts.
BETA ALERT: There is currently no way within CASA to change these environment variables.
1.2.1.2
Where is CASA?
Note that the path to the CASA installation, which contains the scripts and data repository, will
also depend upon the installation. With a default installation under Linux this will probably be in
/usr/lib/casapy/
while in a Mac OSX default install it will likely be an application (in the Applications folder), with
the data repository in:
/opt/casa/
You can find the location after initialized by looking at the CASAPATH environment variable. You
can find it within casapy by
pathname=os.environ.get(’CASAPATH’).split()[0]
print pathname
BETA ALERT: Previous to release 2.4.0 this was called AIPSPATH.
CHAPTER 1. INTRODUCTION
1.2.2
30
Starting CASA
After having run the appropriate casainit script, CASA is started by typing
casapy
on the UNIX command line, e.g.
casapy
After startup information, you should get an IPython
CASA <1>:
command prompt in the xterm window where you started CASA. CASA will take approximately 10
seconds to initialize at startup in a new working directory; subsequent startups are faster. CASA
is active when you get a
CASA <1>
prompt in the command line interface. You will also see a logger GUI appear on your Desktop
(usually near the upper left). Note: Under MacOSX the logger will appear in a Console window.
You also have the option of starting CASA with various logger options (see § 1.4.2.1). For example,
if you are running remotely in a terminal window without an X11 connection, or if you just do not
want to see the logger GUI, and want the logger messages to come to your terminal, do
casapy --nologger --log2term
See § 1.4.2 for information on the logger in general.
1.2.3
Ending CASA
You can exit CASA by typing quit. This will bring up the query
Do you really want to exit ([y]/n)?
to give you a chance in case you did not mean to exit. You can also quit using %exit or CTRL-D.
If you don’t want to see the question "Do you really want to exit [y]/n?", then just type
Exit or exit and CASA will stop right then and there.
1.2.4
What happens if something goes wrong?
BETA ALERT: This is a Beta Release, and there are still ways to cause CASA to crash. Please
check the CASA Home Page for Beta Release information including a list of known problems. If
you think you have encountered an unknown problem, please consult the CASA HelpDesk (contact
information on the CASA Home Page). See also the caveats to this Beta Release (§ 1.1 for pointers
to our policy on User Support.
First, always check that your inputs are correct; use the
CHAPTER 1. INTRODUCTION
31
help <taskname>
(§ 1.2.8.2) or
help par.<parameter name>
(§ 1.2.8.4) to review the inputs/output.
1.2.5
Aborting CASA execution
If something has gone wrong and you want to stop what is executing, then typing CNTL-C (Control
and C keys simultaneously) will usually cleanly abort the application. This will work if you are
running a task synchronously. If this does not work on your system, or you are running a task
asynchronously (§ 1.3.4) then try CNTL-Z to put the task or shell in the background, and then
follow up with a kill -9 <PID> where you have found the relevant casapy process ID (PID) using
ps (see § 1.2.6 below).
See § 1.3.2 for more information on running tasks.
If the problem causes CASA to crash, see the next sub-section.
1.2.6
What happens if CASA crashes?
Usually, restarting casapy is sufficient to get you going again after a crash takes you out of
the Python interface. Note that there may be spawned subprocesses still running, such as the
casaviewer or the logger. These can be dismissed manually in the usual manner. After a crash,
there may also be hidden processes. You can find these by listing processes, e.g. in linux:
ps -elf | grep casa
or on MacOSX (or other BSD Unix):
ps -aux | grep casa
You can then kill these, for example using the Unix kill or killall commands. This may be
necessary if you are running remotely using ssh, as you cannot logout until all your background
processes are terminated. For example,
killall ipcontroller
or
killall Python
will terminate the most common post-crash zombies.
CHAPTER 1. INTRODUCTION
1.2.7
32
Python Basics for CASA
Within CASA, you use Python to interact with the system. This does not mean an extensive
Python course is necessary - basic interaction with the system (assigning parameters, running
tasks) is straightforward. At the same time, the full potential of Python is at the more experienced
user’s disposal. Some further details about Python, IPython, and the interaction between Python
and CASA can be found in Appendix D.
The following are some examples of helpful hints and tricks on making Python work for you in
CASA.
1.2.7.1
Variables
Python variables are set using the <parameter> = <value> syntax. Python assigns the type
dynamically as you set the value, and thus you can easily give it a non-sensical value, e.g.
vis = ’ngc5921.ms’
vis = 1
The CASA parameter system will check types when you run a task or tool, or more helpfully when
you set inputs using inp (see below). CASA will check and protect the assignments of the global
parameters in its namespace.
Note that Python variable names are case-sensitive:
CASA <109>:
CASA <110>:
CASA <111>:
Out[111]:
CASA <112>:
Out[112]:
Foo = ’bar’
foo = ’Bar’
foo
’Bar’
Foo
’bar’
so be careful.
Also note that mis-spelling a variable assignment will not be noticed (as long as it is a valid Python
variable name) by the interface. For example, if you wish to set correlation=’RR’ but instead
type corellation=’RR’ you will find correlation unset and a new corellation variable set.
Command completion (see § 1.2.8.1) should help you avoid this.
1.2.7.2
Lists and Ranges
Sometimes, you need to give a task a list of indices. If these are consecutive, you can use the
Python range function to generate this list:
CASA <1>: iflist=range(4,8)
CASA <2>: print iflist
CHAPTER 1. INTRODUCTION
[4, 5, 6,
CASA <3>:
CASA <4>:
[0, 1, 2,
33
7]
iflist=range(4)
print iflist
3]
See Appendix D.3 for more information.
1.2.7.3
Indexes
As in C, Python indices are 0-based. For example, the first element in a list antlist would be
antlist[0]:
CASA <113>:
CASA <114>:
Out[114]:
CASA <115>:
Out[115]:
CASA <116>:
Out[116]:
antlist=range(5)
antlist
[0, 1, 2, 3, 4]
antlist[0]
0
antlist[4]
4
CASA also uses 0-based indexing internally for elements in the Measurement Set (MS – the basic
construct that contains visibility and/or single dish data; see Chapter 2). Thus, we will often talk
about Field or Antenna “ID”s which will be start at 0. For example, the first field in an MS would
have FIELD ID==0 in the MSselect syntax, and can be addressed as be indexed as field=’0’ in
most tasks, as well as by name field=’0137+331’ (assuming thats the name of the first field).
You will see these indices in the MS summary from the task listobs.
1.2.7.4
Indentation
Python pays attention to the indentation of lines, as it uses indentation to determine the level
of nesting in loops. Be careful when cutting and pasting: if you get the wrong indentation, then
unpredictable things can happen (usually it just gives an error).
See Appendix D.2 for more information.
1.2.7.5
System shell access
If you want to access system commands from a script, use the os.system command (Appendix D.6.1).
In interactive mode, any input line beginning with a ’!’ character is passed verbatim (minus the
’!’, of course) to the underlying operating system. Also, several common commands (ls, pwd,
less) may be executed with or without the ’!’, although the cp command must use ’!’ and cd
must be executed without the ’!’. For example:
CASA <5>: !rm -r mydata.ms
CHAPTER 1. INTRODUCTION
34
Note that if you want to access a Unix environment variable, you will need to prefix with a double
$$ instead of a single $ — for example, to print the value of the $PAGER variable, you would use
CASA <6>: !echo $$PAGER
See Appendix D.6 for more information.
1.2.7.6
Executing Python scripts
You can execute Python scripts (ASCII text files containing Python or casapy commands) using
the execfile command. For example, to execute the script contained in the file myscript.py (in
the current directory), you would type
CASA <7>: execfile(’myscript.py’)
or
CASA <8>: execfile ’myscript.py’
which will invoke the IPython auto-parenthesis feature.
NOTE: in some cases, you can use the IPython run command instead, e.g.
CASA <9>: run myscript.py
In this case, you do not need the quotes around the filename. This is most useful for re-initializing
the task parameters, e.g.
CASA <10>: run clean.last
(see § 1.3.5.7).
See Appendix D.11 for more information.
1.2.8
1.2.8.1
Getting Help in CASA
TAB key
At any time, hitting the <TAB> key will complete any available commands or variable names and
show you a list of the possible completions if there’s no unambiguous result. It will also complete
filenames in the current directory if no CASA or Python names match.
For example, it can be used to list the available functionality using minimum match; once you have
typed enough characters to make the command unique, <TAB> will complete it.
CHAPTER 1. INTRODUCTION
CASA <15>: cle<TAB>
clean
clearplot
clean_check_params
clearplot_defaults
clean_defaults
clearplot_description
1.2.8.2
clean_description
clearstat
clear
clearstat_defaults
clearcal
clearstat_description
35
clearcal_check_params
clearcal_defaults
clearcal_description
help <taskname>
Basic information on an application, including the parameters used and their defaults, can be
obtained by typing pdoc task, help ’task’ or task?. The pdoc task currently gives the cleanest
documentation format with the smallest amount of object-oriented (programmer) output. This
inline help provides a one line description of the task and then lists all parameters, a brief description
of the parameter, the parameter default, an example setting the parameter and any options if there
are limited allowed values for the parameter.
For example:
CASA <10>: pdoc importvla
Class Docstring:
Import VLA archive file(s) to a measurement set
Imports an arbitrary number of VLA archive-format data sets into
a casa measurement set. If more than one band is present, they
will be put in the same measurement set but in a separate spectral
window. The task will handle old style and new style VLA (after
July 2007) archive data and apply the tsys to the data and to
the weights.
Keyword arguments:
archivefiles -- Name of input VLA archive file(s)
default: none. Must be supplied
example: archivefiles = ’AP314_A959519.xp1’
example: archivefiles=[’AP314_A950519.xp1’,’AP314_A950519.xp2’]
vis -- Name of output visibility file
default: none. Must be supplied.
example: vis=’NGC7538.ms’
Will not over-write existing ms of same name.
A backup flag-file version ’Original’ will be made in
vis.flagversions. See help flagmanager
bandname -- VLA Frequency band
default: => ’’ = all bands
example: bandname=’K’
Options: ’4’=48-96 MHz,’P’=298-345 MHz,’L’=1.15-1.75 GHz,
’C’=4.2-5.1 GHz,’X’=6.8-9.6 GHz,’U’=13.5-16.3 GHz,
’K’=20.8-25.8 GHz,’Q’=38-51 GHz
frequencytol -- Tolerance in frequency shift in making spectral windows
default: => 150000 (Hz). For Doppler shifted data, <10000 Hz may
CHAPTER 1. INTRODUCTION
36
may produce too many unnecessary spectral windows.
example: frequencytol = 1500000.0 (units = Hz)
project -- Project name to import from archive files:
default: ’’ => all projects in file
example: project=’AL519’
project = ’al519’ or AL519 will work. Do not include
leading zeros; project = ’AL0519’ will not work.
starttime -- Time after which data will be considered for importing
default: ’’ => all: Date must be included.
syntax: starttime = ’2003/1/31/05:05:23’
stoptime -- Time before which data will be considered for importing
default: ’’ => all: Date must be included.
syntax: stoptime = ’2003/1/31/08:05:23’
applytsys -- Apply data scaling and weight scaling by nominal
sensitivity (~Tsys)
default: True. Strongly recommended
autocorr -- import autocorrelations to ms
default: => False (no autocorrelations)
antnamescheme -- ’old’ or ’new’ antenna names.
default => ’new’ gives antnenna names
’VA04’ or ’EA13 for VLA telescopse 04 and 13 (EVLA)
’old’ gives names ’04’ or ’13’
async -- Run asynchronously
default = False; do not run asychronously
Constructor Docstring:
None
BETA ALERT: If you type help task without quotes around the task name, you will get two
copies of the help with alot of extraneous stuff. This is a bug introduced in 2.4.0 and will be fixed
in later releases.
You can also get the short help for a CASA tool method by typing ’help tool.method’.
CASA <46>: help ia.subimage
----------> help(ia.subimage)
Help on built-in function subimage:
subimage(...)
Create a (sub)image from a region of the image‘
outfile
region
mask
dropdeg
= false
overwrite = false
list
= true
----------------------------------------
:
For a full list of keywords associated with the various tools, see the CASA User Reference
Manual. BETA ALERT: The User Reference Manual currently covers only tools, not tasks.
CHAPTER 1. INTRODUCTION
1.2.8.3
37
help and PAGER
Your PAGER environment variable (§ 1.2.1) determines how help is displayed in the terminal window
where you start CASA. If you set your bash environment variable PAGER=less (setenv PAGER less
in csh) then typing help <taskname> will show you the help but the text will vanish and return
you to the command line when you are done viewing it. Setting PAGER=more (setenv PAGER more)
will scroll the help onto your command window and then return you to your prompt (but leaving
it on display). Setting PAGER=cat (setenv PAGER cat) will give you the more equivalent without
some extra formatting baggage and is the recommended choice.
If you have set PAGER=more or PAGER=less, the help display will be fine, but the display of
’taskname?’ will often have confusing formatting content at the beginning (lots of ESC surrounding
the text). This can be remedied by exiting casapy and doing an ’unset PAGER’ (unsetenv PAGER
in [t]csh) at the Unix command line.
You can see the current value of the PAGER environment variable with CASA by typing:
!echo $$PAGER
(note the double $$). This will show what command paging is pointed to.
1.2.8.4
help par.<parameter>
Typing help par.<parameter> provides a brief description of a given parameter <parameter>.
CASA <46>: help par.robust
Help on function robust in module parameter_dictionary:
robust()
Brigg’s robustness parameter.
Options: -2.0 (close to uniform) to 2.0 (close to natural)
1.2.8.5
Python help
Typing help at the casapy prompt with no arguments will bring up the native Python help facility,
and give you the help> prompt for further information; hitting <RETURN> at the help prompt
returns you to the CASA prompt.
CASA <2>: help
--------> help()
Welcome to Python 2.5!
This is the online help utility.
If this is your first time using Python, you should definitely check out
the tutorial on the Internet at http://www.python.org/doc/tut/.
CHAPTER 1. INTRODUCTION
38
Enter the name of any module, keyword, or topic to get help on writing
Python programs and using Python modules. To quit this help utility and
return to the interpreter, just type "quit".
To get a list of available modules, keywords, or topics, type "modules",
"keywords", or "topics". Each module also comes with a one-line summary
of what it does; to list the modules whose summaries contain a given word
such as "spam", type "modules spam".
help> keywords
Here is a list of the Python keywords.
help.
Enter any keyword to get more
and
assert
break
class
continue
def
del
elif
import
in
is
lambda
not
or
pass
print
else
except
exec
finally
for
from
global
if
raise
return
try
while
yield
help>
# hit <RETURN> to return to CASA prompt
You are now leaving help and returning to the Python interpreter.
If you want to ask for help on a particular object directly from the
interpreter, you can type "help(object)". Executing
"help(’string’)" has the same effect as typing a particular string
at the help> prompt.
Further help in working within the Python shell is given in Appendix D.
1.3
Tasks and Tools in CASA
Originally, CASA consisted of a collection of tools, combined in the so-called toolkit. Since the
majority of prospective users is far more familiar with the concept of tasks, an effort is underway
to replace most - if not all - toolkit functionality by tasks.
While running CASA, you will have access to and be interacting with tasks, either indirectly
by providing parameters to a task, or directly by running a task. Each task has a well defined
purpose, and a number of associated parameters, the values of which are to be supplied by the
user. Technically speaking, tasks are built on top of tools - when you are running a task, you are
running tools in the toolkit, though this should be transparent.
As more tasks are being written, and the functionality of each task is enhanced, there will be less
CHAPTER 1. INTRODUCTION
39
and less reason to run tools in the toolkit. We are working toward a system in which direct access
to the underlying toolkit is unnecessary for all standard data processing.
1.3.1
What Tasks are Available?
As mentioned in the introduction, tasks in CASA are python interfaces to the more basic toolkit.
Tasks are executed to perform a single job, such as loading, plotting, flagging, calibrating, and
imaging the data.
Basic information on tasks, including the parameters used and their defaults, can be obtained by
typing help <taskname> or <taskname>? at the CASA prompt, where <taskname> is the name
of a given task. As described above in § 1.2.8.2, help <taskname> provides a description of the
task and then lists all parameters, a brief description of the parameter, the parameter default, an
example setting the parameter and any options if there are limited allowed values for the parameter.
To see what tasks are available in CASA, use tasklist, e.g.
CASA <4>: tasklist()
Available tasks:
Import/Export
------------importvla
(importasdm)
importfits
importuvfits
exportfits
exportuvfits
Information
----------listcal
listhistory
listobs
listvis
imhead
imstat
vishead
Data Editing
-----------flagautocorr
flagdata
flagmanager
plotxy
Display/Plot
-----------clearplot
plotants
plotcal
plotxy
viewer
Calibration
----------accum
applycal
bandpass
(blcal)
gaincal
fluxscale
(fringecal)
clearcal
listcal
smoothcal
polcal
hanningsmooth
Imaging
------clean
deconvolve
feather
ft
invert
makemask
mosaic
Modelling
--------setjy
uvcontsub
uvmodelfit
Utility
------help task
help par.parameter
taskhelp
tasklist
browsetable
clearplot
clearstat
concat
filecatalog
startup
split
fixvis
Image Analysis
-------------imcontsub
Simulation
---------simdata
Single Dish
----------sdaverage
CHAPTER 1. INTRODUCTION
imhead
immath
immoments
imregrid
imstat
imval
(specfit)
40
sdbaseline
sdcal
sdcoadd
sdfit
sdflag
sdlist
sdplot
sdsave
sdscale
sdsmooth
sdstat
The tasks with name in parentheses are experimental.
Typing taskhelp provides a one line description of all available tasks.
CASA <5>: taskhelp()
Available tasks:
accum
almasimmos
applycal
bandpass
blcal
browsetable
clean
clearcal
clearplot
clearstat
concat
deconvolve
exportfits
exportuvfits
feather
find
flagautocorr
flagdata
flagmanager
fluxscale
fringecal
ft
gaincal
hanningsmooth
imcontsub
imfit
imhead
immath
immoments
importasdm
importfits
importuvfits
:
:
:
:
:
:
:
:
:
:
:
:
:
:
:
:
:
:
:
:
:
:
:
:
:
:
:
:
:
:
:
:
Accumulate incremental calibration solutions into a calibration table
ALMA mosaic simulation task (prototype):
Apply calibrations solutions(s) to data
Calculates a bandpass calibration solution
Calculate a baseline-based calibration solution (gain or bandpass)
Browse a table (MS, calibration table, image)
Deconvolve an image with selected algorithm
Re-initializes the calibration for a visibility data set
Clear the matplotlib plotter and all layers
Clear all read/write locks
Concatenate two visibility data sets.
Image based deconvolver
Convert a CASA image to a FITS file
Convert a CASA visibility data set to a UVFITS file:
Feathering: Combine two images using the Fourier Addition
Find string in tasks, task names, parameter names:
Flag autocorrelations
All purpose flagging task based on selections
Enable list, save, restore and delete flag version files.
Bootstrap the flux density scale from standard calibrators
Calculate a baseline-based fringe-fitting solution (phase, delay, delay-rate); Note: cu
Insert a source model into the MODEL_DATA column of a visibility set:
Determine temporal gains from calibrator observations
Hanning smooth frequency channel data to remove Gibbs ringing
Subtracts specified continuum channels from a spectral line data set
Fit One Elliptical Gaussian Component on an image region(s)
List, get and put image header parameters
Perform math operations on images
Compute moments from an image
Convert an ALMA Science Data Model observation into a CASA visibility file
Convert an image FITS file into a CASA image
Convert a UVFITS file to a CASA visibility data set
CHAPTER 1. INTRODUCTION
importvla
imregrid
imstat
imval
invert
listcal
listhistory
listobs
listvis
makemask
mosaic
newclean
newflagdata
oldclean
plotants
plotcal
plotxy
polcal
sdaverage
sdbaseline
sdcal
sdcoadd
sdfit
sdflag
sdlist
sdplot
sdsave
sdscale
sdsmooth
sdstat
sdtpimaging
setjy
smoothcal
(specfit)
split
uvcontsub
uvmodelfit
uvsub
viewer
widefield
41
: Import VLA archive file(s) to a measurement set
: regrid an image onto a template image
: Displays statistical information from an image or image region
: Get the data value(s) and/or mask value in an image.
: Calculate the dirty image and dirty beam from a visibility set
: List calibrated antenna gain solutions
: List the processing history of a dataset:
: List data set summary in the logger
: List measurement set visibilities.
: Derive a mask image from a cleanbox blc, trc regions
: Create a multi-field deconvolved image with selected algorithm
: Deconvolve an image with selected algorithm
: Flag/Clip data based on selections
: Deconvolve an image with selected algorithm
: Plot the antenna distribution in the local reference frame:
: An all-purpose plotter for calibration results
: An X-Y plotter/interactive flagger for visibility data.
: Determine instrumental polarization calibrations
: ASAP SD task: do data selection, calibration, and averaging
: ASAP SD task: fit/remove a spectral baseline
: ASAP SD task: do sdaverage, sdsmooth, and sdbaseline in one task
: ASAP SD task: coadd multiple scantables into one
: ASAP SD task: fit a spectral line
: ASAP SD spectral flagging task
: ASAP SD task: list summary of single dish data
: ASAP SD plotting task
: ASAP SD task: save the sd spectra in various format
: ASAP SD task: scale the sd spectra
: ASAP SD task: do smoothing of spectra
: ASAP SD task: list statistics of spectral region
: SD task: do a simple calibration and imaging for total power data
:
: Smooth calibration solution(s) derived from one or more sources:
: Fit 1-dimentional profile(s) or polynomial(s) to an image or image region
:
: Continuum fitting and subtraction in the uv plane
: Fit a single component source model to the uv data
: Subtract/add model from/to the corrected visibility data.
: View an image or visibility data set:
: Wide-field imaging and deconvolution with selected algorithm
Typing startup will provide the startup page displayed when entering CASA. For example,
CASA <6>: startup()
___________________________________________________________
Available tasks:
accum
applycal
bandpass
flagdata
flagmanager
fluxscale
invert
listcal
listhistory
sdflag
sdlist
sdplot
CHAPTER 1. INTRODUCTION
browsetable
clean
clearcal
clearplot
clearstat
concat
deconvolve
exportfits
exportuvfits
feather
filecatalog
find
ft
gaincal
hanningsmooth
imcontsub
imhead
immoments
importfits
importuvfits
importvls
imregrid
imstat
imval
42
listobs
listvis
makemask
mosaic
plotants
plotcal
plotxy
sdaverage
sdbaseline
sdcal
sdciadd
sdfit
sdsave
sdscale
sdsmooth
sdstat
setjy
smoothcal
specfit
split
tget
uvcontsub
uvmodelfit
viewer
Additional tasks available for ALMA commissioning use
(still alpha code as of release):
simdata
blcal
fringecal
importasdm
Available tools:
cb
ia
mp
sm
vp
(calibrater)
cp
(image analysis) im
(MS plot)
ms
(simulation)
tb
(voltage patterns)
(cal plot)
(imager)
(MS)
(table)
fg
me
qa
tp
(flagger)
(measures)
(quanta)
(table plot)
pl (pylab functions)
sd (ASAP functions - run asap_init() to import into CASA)
casalogger
- Call up the casalogger (if it goes away)
___________________________________________________________________
Help :
help taskname
- Full help for task
help par.parametername - Full help for parameter name
find string
- Find occurances of string in doc
tasklist
- Task list organized by catagory
taskhelp
- One line summary of available tasks
toolhelp
- One line summary of available tools
startup
- The start up screen
___________________________________________________________________
1.3.2
Running Tasks and Tools
Tools are functions linked to the Python interface which
must be called by name with arguments. Tasks have
higher-level capabilities than tools. Tasks require input pa-
BETA ALERT:
This is a new behavior in Patch 2 and
later. In previous versions global parameters were always used no matter
how the task was called.
CHAPTER 1. INTRODUCTION
43
rameters which maybe be specified when you call the task
as a function, or be set as parameters in the interface. A
task, like a tool, is a function under Python and may be
written in Python, C, or C++ (the CASA toolkit is made
up of C++ functions).
There are two distinct ways to run tasks. You can either set the global CASA parameters relevant
to the task and tell the task to “go”, or you can call the task as a function with one or more
arguments specified. These two invocation methods differ in whether the global parameter values
are used or not.
For example,
default(’plotxy’)
vis=’ngc5921.ms’
xaxis=’channel’
yaxis=’amp’
datacolumn=’data’
go
will execute plotxy with the set values for the parameters (see § 1.3.5). Instead of using go
command (§ 1.3.5.3) to invoke the task, you can also call the task with no arguments, e.g.
default(’plotxy’)
vis=’ngc5921.ms’
xaxis=’channel’
yaxis=’amp’
datacolumn=’data’
plotxy()
which will also use the global parameter values.
Second, one may call tasks and tools by name with parameters set on the same line. Parameters
may be set either as explicit <parameter>=<value> arguments, or as a series of comma delimited
<value>s in the correct order for that task or tool. Note that missing parameters will use the
default values for that task. For example, the following are equivalent:
# Specify parameter names for each keyword input:
plotxy(vis=’ngc5921.ms’,xaxis=’channel’,yaxis=’amp’,datacolumn=’data’)
# when specifying the parameter name, order doesn’t matter, e.g.:
plotxy(xaxis=’channel’,vis=’ngc5921.ms’,datacolumn=’data’,yaxis=’amp’)
# use parameter order for invoking tasks
plotxy(’ngc5921.ms’,’channel’,’amp’,’data’)
This non-use of globals when calling as a function is so that robust scripts can be written. One
need only cut-and-paste the calls and need not worry about the state of the global variables or
what has been run previously. It is also more like the standard behavior of function calls in Python
and other languages.
Tools can only be called in this second manner by name, with arguments (§ 1.3.6). Tools never use
the global parameters and the related mechanisms of inp and go.
CHAPTER 1. INTRODUCTION
1.3.2.1
44
Aborting Synchronous Tasks
If you are running CASA tasks synchronously, then you can usually use CNTL-C to abort execution
of the task. If this does not work, try CNTL-Z followed by a kill. See § 1.2.5 for more on these
methods to abort CASA execution.
You may have to quit and restart CASA after an abort, as the internal state can get mixed up.
1.3.3
Getting Return Values
Some tasks and tools return a record (usually a Python dictionary) to the interface. For example,
the imstat task (§ 6.7) returns a dictionary with the image statistics in it. To catch these return
values into a Python variable, you MUST assign that variable to the task call, e.g.
xstat = imstat(’ngc5921.clean.image’)
or
default(’imstat’)
imagename = ’ngc5921.clean.image’
xstat = imstat()
Note that tools that return values work in the same way (§ 1.3.6).
You can print or use the return value in Python for controlling scripts. For example,
CASA <1>: xstat = imstat(’ngc5921.clean.image’)
CASA <2>: xstat
Out[2]:
{’blc’: array([0, 0, 0, 0]),
’blcf’: ’15:24:08.404, +04.31.59.181, I, 1.41281e+09Hz’,
’flux’: array([ 4.15292207]),
’max’: array([ 0.05240594]),
’maxpos’: array([134, 134,
0, 38]),
’maxposf’: ’15:21:53.976, +05.05.29.998, I, 1.41374e+09Hz’,
’mean’: array([ 1.62978083e-05]),
’medabsdevmed’: array([ 0.00127287]),
’median’: array([ -1.10467618e-05]),
’min’: array([-0.0105249]),
’minpos’: array([160,
1,
0, 30]),
’minposf’: ’15:21:27.899, +04.32.14.923, I, 1.41354e+09Hz’,
’npts’: array([ 3014656.]),
’quartile’: array([ 0.00254587]),
’rms’: array([ 0.00201818]),
’sigma’: array([ 0.00201811]),
’sum’: array([ 49.1322855]),
’sumsq’: array([ 12.27880404]),
’trc’: array([255, 255,
0, 45]),
CHAPTER 1. INTRODUCTION
45
’trcf’: ’15:19:52.390, +05.35.44.246, I, 1.41391e+09Hz’}
CASA <3>: myrms = xstat[’rms’][0]
CASA <4>: print 10.0*myrms
0.0201817648485
If you do not catch the return variable, it will be lost
imstat(’ngc5921.clean.image’)
or
default(’imstat’)
imagename = ’ngc5921.clean.image’
imstat()
and spewed to terminal. Note that go will trap and lose the return value, e.g.
default(’imstat’)
imagename = ’ngc5921.clean.image’
go
will not dump the return to the terminal either.
NOTE: You cannot currently catch a return value from a task run asynchronously (§ 1.3.4).
BETA ALERT: Before Patch 2, the return values for tasks like imstat and imhead were put into
the global variables (xstat and hdvalue respectively). This is no longer the case.
1.3.4
Running Tasks Asynchronously
By default, most tasks run synchronously in the foreground. Many tasks, particularly those that
can take a long time to execute, have the async parameter. This allows the user to send the task
to the background for execution.
BETA ALERT: A few tasks, such as the exportuvfits and exportfits tasks, have async=True
by default. This is a workaround for a known problem where they can trample on other tasks and
tools if they use the default global tools underneath.
1.3.4.1
Monitoring Asynchronous Tasks
BETA ALERT: Currently, this is only available with the tm tool. We are working on a taskmanager
task.
CHAPTER 1. INTRODUCTION
There is a “taskmanager” tool tm that allows the user to
retrieve the status of, and to abort the execution of, tasks
running with async=True in the background. There are
two methods of interest for the user, tm.retrieve and
tm.abort.
If you run a task with async=True then several things will
happen. First of all, the task returns a “handle” that is a
number used to identify the process. This is printed to the
screen, e.g.
46
BETA ALERT:
You should not use the go command
to run a task asynchronously, as the
“handle” will be swallowed by the
Python task wrapper and you will
not be able to access it with tm. This
is also true if you run in a Python
script.
CASA <5>: inp()
# mosaic :: Calculate a multi-field deconvolved image with selected clean algorithm:
...
async
=
True
#
if True run in the background, prompt is freed
CASA <6>: mosaic()
Connecting to controller:
Out[6]: 0
(’127.0.0.1’, 60775)
where the output value 0 is the handle id.
You can also catch the return value in a variable, e.g.
CASA <7>: handle = mosaic()
...
CASA <8>: print handle
1
You should also see the usual messages from the task in the logger, with some extra lines of
information
###############################################
### Begin Task: mosaic ###
Tue Oct 2 17:58:16 2007
NORMAL ::mosaic:
""
"Use: "
tm.abort(return_value)
# to abort the asynchronous task
tm.retrieve(return_value) # to retrieve the status
""
... usual messages here ...
### End Task: mosaic ###
###############################################
""
for the example above.
To show the current state of an asynchronous task, use the tm.retrieve method using the handle
id as the argument. For example,
CHAPTER 1. INTRODUCTION
47
CASA <9>: tm.retrieve(handle)
Out[9]: {’result’: None, ’state’: ’pending’}
or
CASA <10>: tm.retrieve(1)
Out[10]: {’result’: None, ’state’: ’pending’}
which means its still running. You should be seeing output in the logger also while the task is
running.
When a task is finished, you will see:
CASA <11>: tm.retrieve(1)
Out[11]: {’result’: None, ’state’: ’done’}
which indicates completion.
1.3.4.2
Aborting Asynchronous Tasks
To abort a task while it is running in the background, use the tm.abort method, again with the
task handle id as the argument. For example,
CASA <12>: handle = mosaic()
...
CASA <13>: tm.abort(handle)
will abort the task if it is running.
If this does not work, try CNTL-Z followed by a kill -9 <PID> for the appropriate process ID. See
§ 1.2.5 for more on these methods to abort CASA execution.
1.3.5
Setting Parameters and Invoking Tasks
One can set parameters for tasks (but currently not for
tools) by performing the assignment within the CASA shell
and then inspecting them using the inp command:
Inside the Toolkit:
In the current version of CASA,
you cannot use the task parameter
setting features, such as the inp,
default, or go commands, for the
tools.
CASA <30>: default(bandpass)
CASA <31>: vis = ’ngc5921.demo.ms’
CASA <32>: caltable = ’ngc5921.demo.bcal’
CASA <33>: field = ’0’
CASA <34>: refant = ’15’
CASA <35>: inp(’bandpass’)
# bandpass :: Calculates a bandpass calibration solution
vis
= ’ngc5921.demo.ms’ # Nome of input visibility file
CHAPTER 1. INTRODUCTION
caltable
field
spw
selectdata
solint
combine
refant
minblperant
solnorm
bandtype
fillgaps
append
gaintable
gainfield
interp
spwmap
gaincurve
opacity
parang
async
48
= ’ngc5921.demo.bcal’ # Name of output gain calibration table
=
’0’
# Select field using field id(s) or field name(s)
=
’’
# Select spectral window/channels
=
False
# Other data selection parameters
=
’inf’
# Solution interval
=
’scan’
# Data axes which to combine for solve (scan, spw, field)
=
’15’
# Reference antenna name
=
4
# Minimum baselines _per antenna_ required for solve
=
False
# Normalize average solution amplitudes to 1.0 (G, T only)
=
’B’
# Type of bandpass solution (B or BPOLY)
=
0
# Fill flagged solution channels by interpolation
=
False
# Append solutions to the (existing) table
=
’’
# Gain calibration table(s) to apply on the fly
=
’’
# Select a subset of calibrators from gaintable(s)
=
’’
# Interpolation mode (in time) to use for each gaintable
=
[]
# Spectral windows combinations to form for gaintables(s)
=
False
# Apply internal VLA antenna gain curve correction
=
0.0
# Opacity correction to apply (nepers)
=
False
# Apply parallactic angle correction
=
False
#
See § 1.3.5.4 below for more details on the use of the inputs
command.
All task parameters have global scope within CASA: the
parameter values are common to all tasks and also at the
CASA command line. This allows the convenience of not
changing parameters that are shared between tasks but does require care when chaining together
sequences of task invocations (to ensure proper values are provided).
If you want to reset the input keywords for a single task, use the default command (§ 1.3.5.2).
For example, to set the defaults for the bandpass task, type:
CASA <30>: default(’bandpass’)
as we did above.
To inspect a single parameter value just type it at the command line. Continuing the above example:
CASA <36>: combine
Out[14]: ’scan’
CASA parameters are just Python variables.
Parameters for a given task can be saved by using the saveinputs command (see § 1.3.5.5) and
restored using the execfile ’<filename>’ command. Note that if the task is successfully executed, then a <taskname>.last file is created in the working directory containing the parameter
values (see § 1.3.5.7).
We now describe the individual CASA task parameter interface commands and features in more
detail.
CHAPTER 1. INTRODUCTION
1.3.5.1
49
The scope of parameters in CASA
All task parameters have global scope within CASA: the
parameter values are common to all tasks and also at the
CASA command line. This allows the convenience of not
changing parameters that are shared between tasks but
does require care when chaining together sequences of task
invocations (to ensure proper values are provided). Tasks
DO NOT change the values of the global parameters, nor
does the invocation of tasks using the functional call with
arguments change the globals.
This does mean that unless you do an explict default of
the task (§ 1.3.5.2), previously set values may be unexpectedly used if you do not inspect the inp carefully. For
example, good practice is:
Advanced Tip
By default, the scope of CASA
parameters is global, as stated
here.
However, if you call a
task as a function with one or
more arguments specified, e.g.
task(arg1=val1,...),
then
non-specified parameters will be
defaulted and no globals used.
This makes scripting more robust.
Tasks DO NOT change the value of
globals.
default(’imhead’)
imagename = ’ngc5921.demo.cleanimg.image’
mode = ’list’
imhead()
If you supply the task call with arguments, then these will
be used for the values of those parameters (see above). However, if some but not all arguments
are supplied, then those parameters not given as arguments will default and NOT use the current
global values. Thus,
imhead(’ngc5921.demo.cleanimg.image’,mode=’list’)
will reproduce the above.
1.3.5.2
The default Command
Each task has a special set of default parameters defined for its parameters. You can use the
default command to reset the parameters for a specified task (or the current task as defined by
the taskname variable) to their default.
Important Note: The default command resets the values of the task parameters to a set of
“defaults” as specified in the task code. Some defaults are blank strings ’’ or empty lists [],
others are specific numerical values, strings, or lists. It is important to understand that just setting
a string parameter to an empty string ’’ is not setting it to its default! Some parameters do not
have a blank as an allowed value. See the help for a particular task to find out its default. If ’’
is the default or an allowed value, it will say so explicitly.
For example, suppose we have been running CASA on a particular dataset, e.g.
CHAPTER 1. INTRODUCTION
50
CASA <40>: inp clean
---------> inp(’clean’)
# clean :: Deconvolve an image with selected algorithm
vis
= ’ngc5921.demo.src.split.ms.contsub’ # name of input visibility file
imagename
= ’ngc5921.demo.cleanimg’ # Pre-name of output images
field
=
’0’
# Field Name
spw
=
’’
# Spectral windows:channels: ’’ is all
selectdata
=
False
# Other data selection parameters
mode
= ’channel’
# Type of selection (mfs, channel, velocity, frequency)
nchan
=
46
# Number of channels (planes) in output image
start
=
5
# first input channel to use
width
=
1
# Number of input channels to average
interpolation = ’nearest’
# Spectral interpolation (nearest, linear, cubic)
niter
=
6000
# Maximum number of iterations
...
and now we wish to switch to a different one. We can reset the parameter values using default:
CASA <41>: default
---------> default()
CASA <42>: inp
---------> inp()
# clean :: Deconvolve an image with selected algorithm
vis
=
’’
# name of input visibility file
imagename
=
’’
# Pre-name of output images
field
=
’’
# Field Name
spw
=
’’
# Spectral windows:channels: ’’ is all
selectdata
=
False
# Other data selection parameters
mode
=
’mfs’
# Type of selection (mfs, channel, velocity, frequency)
niter
=
500
# Maximum number of iterations
...
It is good practice to use default before running a task if you are unsure what state the CASA
global variables are in.
BETA ALERT: You currently can only reset ALL of the parameters for a given task to their
defaults. In an upcoming update we will allow the default command to take a second argument
with a specific parameter to default its value.
1.3.5.3
The go Command
You can execute a task using the go command, either explicitly
CASA <44>: go listobs
---------> go(listobs)
Executing: listobs()
...
CHAPTER 1. INTRODUCTION
51
or implicitly if taskname is defined (e.g. by previous use of default or inp)
CASA <45>: taskname = ’clean’
CASA <46>: go
---------> go()
Executing: clean()
...
You can also execute a task simply by typing the taskname.
CASA <46>: clean
---------> clean()
Executing: clean()
...
The go command can also be used to launch a different task without changing the current taskname,
without disrupting the inp process on the current task you are working on. For example
default ’gaincal’
vis = ’n5921.ms’
...
go listobs
inp
#
#
#
#
#
set current task to gaincal and default
set the working ms
set some more parameters
launch listobs w/o chaning current task
see the inputs for gaincal (not listobs!)
BETA ALERT: Doing go listobs(vis=’foo.ms’) will currently change the taskname, and will
change vis, which might not be what is desired.
1.3.5.4
The inp Command
You can set the values for the parameters for tasks (but currently not for tools) by performing the assignment within the CASA shell and then inspecting them using the inp command. This command
can be invoked in any of three ways: via function call inp(’<taskname>’) or inp(<taskname>),
without parentheses inp ’<taskname>’ or inp <taskname>, or using the current taskname variable setting with inp. For example,
CASA <1>: inp(’clean’)
...
CASA <2>: inp ’clean’
----------> inp(’clean’)
...
CASA <3>: inp(clean)
...
CASA <4>: inp clean
----------> inp(clean)
...
CASA <5>: taskname = ’clean’
CASA <6>: inp
----------> inp()
CHAPTER 1. INTRODUCTION
52
all do the same thing.
When you invoke the task inputs via inp, you see a list of the parameters, their current values, and
a short description of what that parameters does. For example, starting from the default values,
CASA <18>: inp(’clean’)
# clean :: Deconvolve an image with selected algorithm
vis
=
’’
# name of input visibility file
imagename
=
’’
# Pre-name of output images
field
=
’’
# Field Name
spw
=
’’
# Spectral windows:channels: ’’ is all
selectdata
=
False
# Other data selection parameters
mode
=
’mfs’
# Type of selection (mfs, channel, velocity, frequency)
niter
=
500
# Maximum number of iterations
gain
=
0.1
# Loop gain for cleaning
threshold
=
’0.0mJy’
# Flux level to stop cleaning. Must include units
psfmode
=
’clark’
# method of PSF calculation to use during minor cycles
imagermode
=
’’
# Use csclean or mosaic. If ’’, use psfmode
multiscale
=
[]
# multi-scale deconvolution scales (pixels)
interactive
=
False
# use interactive clean (with GUI viewer)
mask
=
[]
# cleanbox(es), mask image(s), and/or region(s)
imsize
= [256, 256]
# x and y image size in pixels
cell
= [’1.0arcsec’, ’1.0arcsec’] # x and y cell size. default unit arcsec
phasecenter
=
’’
# Image phase center: position or field index
restfreq
=
’’
# rest frequency to assign to image (see help)
stokes
=
’I’
# Stokes params to image (eg I,IV, QU,IQUV)
weighting
= ’natural’
# Weighting of uv (natural, uniform, briggs, ...)
uvtaper
=
False
# Apply additional uv tapering of visibilities.
modelimage
=
’’
# Name of model image(s) to initialize cleaning
restoringbeam
=
[’’]
# Output Gaussian restoring beam for CLEAN image
pbcor
=
False
# Output primary beam-corrected image
minpb
=
0.1
# Minimum PB level to use
async
=
False
# If true the taskname must be started using clean(...)
Figure 1.1 shows how this will look to you on your terminal. Note that some parameters are in
boldface with a gray background. This means that some values for this parameter will cause it to
expand, revealing new sub-parameters to be set.
CASA uses color and font to indicate different properties of parameters and their values:
Parameter and Values in CASA inp
CHAPTER 1. INTRODUCTION
53
Figure 1.1: Screen shot of the default CASA inputs for task clean.
Text Font
Parameters:
plain
bold
plain
Values:
plain
plain
plain
Text Color
Highlight
Indentation
Meaning
black
black
green
none
grey
none
none
none
yes
standard parameter
expandable parameter
sub-parameter
black
blue
red
none
none
none
none
none
none
default value
non-default value
invalid value
Figure 1.2 shows what happens when you set some of the clean parameters to non-default values.
Some have opened up sub-parameters, which can now be seen and set. Figure 1.3 shows what
happens when you set a parameter, in this case vis and mode, to an invalid value. Its value
now appears in red. Reasons for invalidation include incorrect type, an invalid menu choice, or a
filename that does not exist. For example, since vis expects a filename, it will be invalidated (red)
if it is set to a non-string value, or a string that is not the name of a file that can be found. The
mode=’happy’ is invalid because its not a supported choice (’mfs’, ’channel’, ’velocity’, or
’frequency’).
1.3.5.5
The saveinputs Command
The saveinputs command will save the current values of a given task parameters to a Python
(plain ascii) file. It can take up to two arguments, e.g.
saveinputs(taskname, outfile)
CHAPTER 1. INTRODUCTION
54
Figure 1.2: The clean inputs after setting values away from their defaults (blue text). Note that
some of the boldface ones have opened up new dependent sub-parameters (indented and green).
The first is the usual taskname parameter. The second is the name for the output Python file. If
there is no second argument, for example,
saveinputs(’clean’)
a file with name <taskname>.saved (in this case ’clean.saved’ will be created or overwritten if
extant. If invoked with no arguments, e.g.
saveinputs
it will use the current values of the taskname variable (as set using inp <taskname> or default
<taskname>). You can also use the taskname global parameter explicitly,
saveinputs(taskname, taskname+’_1.save’)
For example, starting from default values
CASA <1>: default(’listobs’)
CASA <2>: vis=’ngc5921.demo.ms’
CASA <3>: saveinputs
CASA <4>: !more ’listobs.saved’
IPython system call: more ’listobs.saved’
taskname
= "listobs"
CHAPTER 1. INTRODUCTION
55
Figure 1.3: The clean inputs where one parameter has been set to an invalid value. This is drawn
in red to draw attention to the problem. This hapless user probably confused the ’hogbom’ clean
algorithm with Harry Potter.
vis
= "ngc5921.demo.ms"
verbose
= True
#listobs(vis="ngc5921.ms",verbose=False)
To read these back in, use the Python execfile command. For example,
CASA <5>: execfile(’listobs.saved’)
and we are back.
An example save to a custom named file:
CASA <6>: saveinputs(’listobs’,’ngc5921_listobs.par’)
You can also use the CASA tget command (see § 1.3.5.6 below) instead of the Python execfile
to restore your inputs.
1.3.5.6
The tget Command
The tget command will recover saved values of the inputs of tasks. This is a convenient alternative
to using the Python execfile command (see above).
CHAPTER 1. INTRODUCTION
56
Typing tget without a taskname will recover the saved values of the inputs for the current task as
given in the current value of the taskname parameter.
Adding a task name, e.g. tget <taskname> will recover values for the specified task. This is done
by searching for 1) a <taskname>.last file (see § 1.3.5.7 below), then for 2) a <taskname>.saved
file (see § 1.3.5.5 above), and then executing the Python in these files.
For example,
default(’gaincal’)
tget
inp
tget bandpass
inp
1.3.5.7
#
#
#
#
#
set current task to gaincal and default
read saved inputs from gaincal.last (or gaincal.saved)
see these inputs!
now get from bandpass.last (or bandpass.saved)
task is now bandpass, with recovered inputs
The .last file
Whenever you successfully execute a CASA task, a Python script file called <taskname>.last will
be written (or over-written) into the current working directory. For example, if you ran the listobs
task as detailed above, then
CASA <14>: vis = ’ngc5921.ms’
CASA <15>: verbose = True
CASA <16>: listobs()
CASA <17>: !more ’listobs.last’
IPython system call: more listobs.last
taskname
= "listobs"
vis
= "ngc5921.ms"
verbose
= True
#listobs(vis="ngc5921.ms",verbose=False)
You can restore the parameter values from the save file using
CASA <18>: execfile(’listobs.last’)
or
CASA <19>: run listobs.last
Note that the .last file in generally not created until the task actually finished (successfully), so
it is often best to manually create a save file beforehand using the saveinputs command if you are
running a critical task that you strongly desire to have the inputs saved for.
CHAPTER 1. INTRODUCTION
1.3.6
57
Tools in CASA
The CASA toolkit is the foundation of the functionality in the package, and consists of a suite of
functions that are callable from Python. The tools are used by the tasks, and can be used by
advanced users to perform operations that are not available through the tasks.
It is beyond the scope of this Cookbook to describe the toolkit in detail. Occasionally, examples
will be given that utilize the tools (e.g. § 6.12). In short, tools are always called as functions, with
any parmeters that are not to be defaulted given as arguments. For example:
ia.open(’ngc5921.chan21.clean.cleanbox.mask’)
ia.calcmask(’"ngc5921.chan21.clean.cleanbox.mask">0.5’,’mymask’)
ia.summary()
ia.close()
uses the image tool (ia) to turn a clean mask image into an image mask. Tools never use the
CASA global parameters.
To find what tools are available, use the toolhelp command:
CASA <1>: toolhelp()
Available tools:
at :
cb :
cp :
fg :
ia :
im :
me :
ms :
mp :
tb :
tp :
qa :
sm :
vp :
--pl :
---
Juan Pardo ATM library
Calibration utilities
Cal solution plotting utilities
Flagging/Flag management utilities
Image analysis utilities
Imaging utilities
Measures utilities
MeasurementSet (MS) utilties
MS plotting (data (amp/phase) versus other quantities)
Table utilities (selection, extraction, etc)
Table plotting utilities
Quanta utilities
Simulation utilities
Voltage pattern/primary beam utilties
pylab functions (e.g., pl.title, etc)
You can find much more information about the toolkit in the CASA User Reference Manual:
http://casa.nrao.edu/docs/casaref/CasaRef.html
1.4
Getting the most out of CASA
There are some other general things you should know about using CASA in order to make things
go smoothly during your data reduction.
CHAPTER 1. INTRODUCTION
1.4.1
58
Your command line history
Your command line history is automatically maintained and stored as ipython.log in your local directory . This file can be edited and re-executed as appropriate using the execfile ’<filename>’
feature.
You can also use the “up-arrow” and “down-arrow” keys for command line recall in the casapy
interface. If you start typing text, and then use “up-arrow”, you will navigate back through
commands matching what you typed.
1.4.2
Logging your session
The output from CASA commands is sent to the file casapy.log, also in your local directory.
Whenever you start up casapy, the previous casapy.log is renamed (based on the date and time)
and a new log file is started.
Figure 1.4: The CASA Logger GUI window under Linux. Note that under MacOSX a stripped
down logger will instead appear as a Console.
The output contained in casapy.log is also displayed in a separate window using the casalogger.
Generally, the logger window will be brought up when casapy is started. If you do not want the
logger GUI to appear, then start casapy using the --nologger option,
casapy --nologger
which will run CASA in the terminal window. See § 1.4.2.1 for more startup options.
BETA ALERT: Due to problems with Qt under MacOSX, we had to replace the GUI qtcasalogger
with a special stripped down one that uses the Mac Console. This still has the important capabilties such as showing the messages and cut/paste. The following description is for the Linux version
CHAPTER 1. INTRODUCTION
59
Figure 1.5: Using the Search facility in the casalogger. Here we have specified the string
’plotted’ and it has highlighted all instances in green.
and thus should mostly be disregarded on OSX. On the Mac, you treat this as just another console
window and use the usual mouse and hot-key actions to do what is needed.
The CASA logger window for Linux is shown in Figure 1.4. The main feature is the display area
for the log text, which is divided into columns. The columns are:
• Time — the time that the message was generated. Note that this will be in local computer
time (usually UT) for casapy generated messages, and may be different for user generated
messages;
• Priority — the Priority Level (see below) of the message;
• Origin — where within CASA the message came from. This is in the format Task::Tool::Method
(one or more of the fields may be missing depending upon the message);
• Message — the actual text.
The casalogger GUI has a range of features, which include:
• Search — search messages by entering text in the Search window and clicking the search
icon. The search currently just matches the exact text you type anywhere in the message.
See Figure 1.5 for an example.
• Filter — a filter to sort by message priority, time, task/tool of origin, and message contents.
Enter text in the Filter window and click the filter icon to the right of the window. Use the
pull-down at the left of the Filter window to choose what to filter. The matching is for the
exact text currently (no regular expressions). See Figure 1.6 for an example.
CHAPTER 1. INTRODUCTION
60
Figure 1.6: Using the casalogger Filter facility. The log output can be sorted by Priority, Time,
Origin, and Message. In this example we are filtering by Origin using ’clean’, and it now shows
all the log output from the clean task.
• View — show and hide columns (Time, Priority, Origin, Message) by checking boxes under
the View menu pull-down. You can also change the font here.
• Insert Message — insert additional comments as “notes” in the log. Enter the text into the
“Insert Message” box at the bottom of the logger, and click on the Add (+) button, or choose
to enter a longer message. The entered message will appear with a priority of “NOTE” with
the Origin as your username. See Figure 1.7 for an example. BETA ALERT: This message
currently will not be inserted into the correct (or user controllable) order into the log.
• Copy — left-click on a row, or click-drag a range of rows, or click at the start and shift click
at the end to select. Use the Copy button or Edit menu Copy to put the selected rows into
the clipboard. You can then (usually) paste this where you wish. BETA ALERT: this does
not work routinely in the current version. You are best off going to the casapy.log file if
you want to grab text.
• Open — There is an Open function in the File menu, and an Open button, that will allow
you to load old casalogger files. BETA ALERT: You cannot see the old casapy.log files
with timestamps (e.g. names like casapy.log-2009-05-26T22:24:31) currently in the file
browser, but you can type the name in explicitly and hit <return> to view them.
Other operations are also possible from the menu or buttons. Mouse “flyover” will reveal the
operation of buttons, for example.
1.4.2.1
Starup options for the logger
One can specify logger options at the startup of casapy on the command line:
CHAPTER 1. INTRODUCTION
61
Figure 1.7: CASA Logger - Insert facility: The log output can be augmented by adding notes or
comments during the reduction. The file should then be saved to disk to retain these changes.
casapy <logger option>
These options are:
--log2term
== logging message go to terminal
--nologfile
== no casapy.log logfile is produced
--logfile <filename>
== use specified name for logfile instead of casapy.log
--nologger
== do not bring up GUI logger (see above)
--nolog (is deprecated use --nologger)
For example, to not bring up a GUI but send the message to your terminal, do
casapy --nologger --log2term
while
casapy --logfile mynewlogfile.log
will start casapy with logger messages going to the file mynewlogfile.log.
1.4.2.2
Setting priority levels in the logger
Logger messages are assigned a Priority Level when generated within CASA. The current levels of
Priority are:
1. SEVERE — errors;
CHAPTER 1. INTRODUCTION
62
2. WARN — warnings;
3. INFO — basic information every user should be aware of or has requested;
4. INFO1 — information possibly helpful to the user;
5. INFO2 — details the power user might want to see;
6. INFO3 — even more details;
7. INFO4 — lowest level of non-debugging information;
8. DEBUGGING — most “important” debugging messages;
9. DEBUG1 — more details;
10. DEBUG2 — lowest level of debugging messages.
The “debugging” levels are intended for the developers use.
There is a threshold for which these messages are written to the casapy.log file and are thus visible in the
logger. By default, only messages at level INFO and
above are logged. The user can change the threshold using
the casalog.filter method. This takes a single string
argument of the level for the threshold. The level sets
the lowest priority that will be generated, and all messages
of this level or higher will go into the casapy.log file.
Inside the Toolkit:
The casalog tool can be used to control the logging. In particular, the
casalog.filter method sets the
priority threshold. This tool can also
be used to change the output log file,
and to post messages into the logger.
Some examples:
casalog.filter(’INFO’)
casalog.filter(’INFO2’)
casalog.filter(’INFO4’)
casalog.filter(’DEBUG2’)
#
#
#
#
the default
should satisfy even advanced users
all INFOx messages
all messages including debugging
WARNING: Setting the threshold to DEBUG2 will put lots of messages in the log!
BETA ALERT: We are transitioning to the new Priority Level system, and not all tasks and tools
obey the guidelines uniformly. This will be improved as we progress through the Beta patches. Also,
the casalog tool is the only way to set the threshold currently.
1.4.3
Where are my data in CASA?
Interferometric data are filled into a so-called Measurement Set (or MS). In its logical structure,
the MS looks like a generalized description of data from any interferometric or single dish telescope.
Physically, the MS consists of several tables in a directory on disk.
Tables in CASA are actually directories containing files that are the sub-tables. For example, when
you create a MS called AM675.ms, then the name of the directory where all the tables are stored will
CHAPTER 1. INTRODUCTION
63
be called AM675.ms/. See Chapter 2 for more information on Measurement Set and Data Handling
in CASA.
The data that you originally get from a telescope can be put in any directory that is convenient to
you. Once you ”fill” the data into a measurement set that can be accessed by CASA, it is generally
best to keep that MS in the same directory where you started CASA so you can get access to it
easily (rather than constantly having to specify a full path name).
When you generate calibration solutions or images (again these are in table format), these will also
be written to disk. It is a good idea to keep them in the directory in which you started CASA.
1.4.3.1
How do I get rid of my data in CASA?
Note that when you delete a measurement set, calibration table, or image, which are in fact directories, you must delete this and all underlying directories and files. If you are not running casapy,
this is most simply done by using the file delete method of the operating system you started CASA
from. For example, when running CASA on a Linux system, in order to delete the measurement
set named AM675.ms type:
CASA <5>: !rm -r AM675.ms
from within CASA. The ! tells CASA that a system command follows (see § 1.2.7.5), and the -r
makes sure that all subdirectories are deleted recursively.
It is convenient to prefix all MS, calibration tables, and output files produced in a run with a
common string. For example, one might prefix all files from VLA project AM675 with AM675, e.g.
AM675.ms, AM675.cal, AM675.clean. Then,
CASA <6>: !rm -r AM675*
will clean up all of these.
In scripts, the ! escape to the OS will not work. Instead, use the os.system() function (Appendix D.6.1) to do the same thing:
os.system(’rm -r AM675*’)
If you are within casapy, then the CASA system is keeping a cache of tables that you have been
using and using the OS to delete them will confuse things. For example, running a script that
contains rm commands multiple times will often not run or crash the second time as the cache gets
confused. The clean way of removing CASA tables (MS, caltables, images) inside casapy is to use
the rmtables task:
rmtables(’AM675.ms’)
and this can also be wildcarded
rmtables(’AM675*’)
CHAPTER 1. INTRODUCTION
64
(though you may get warnings if it tries to delete files or directories that fit the name wildcard that
are not CASA tables).
BETA ALERT: Some CASA processes lock the file and forget to give it up when they are done
(plotxy is usually the culprit. You will get WARNING messages from rmtables and your script
will probably crash second time around as the file isnt removed. The safest thing is still to exit
casapy and start a new session for multiple runs.
1.4.4
What’s in my data?
The actual data is in a large MAIN table that is organized in such a way that you can access
different parts of the data easily. This table contains a number of “rows”, which are effectively a
single timestamp for a single spectral window (like an IF from the VLA) and a single baseline (for
an interferometer).
There are a number of “columns” in the MS, the most important of which for our purposes is the
DATA column — this contains the original visibility data from when the MS was created or filled.
There are other helpful “scratch” columns which hold useful versions of the data or weights for further processing: the CORRECTED DATA column, which is used to hold calibrated data; the MODEL DATA
column, which holds the Fourier inversion of a particular model image; and the IMAGING WEIGHT
column which can hold the weights to be used in imaging. The creation and use of the scratch
columns is generally done behind the scenes, but you should be aware that they are there (and
when they are used). We will occasionally refer to the rows and columns in the MS.
More on the contents of the MS can be found in § 2.1.
1.4.5
Data Selection in CASA
We have tried to make the CASA task interface as uniform as possible. If a given parameter appears
in multiple tasks, it should, as far as is possible, mean the same thing and be used in the same way
in each. There are groups of parameters that appear in a number of tasks to do the same thing,
such as for data selection.
The parameters field, spw, and selectdata (which if True expands to a number of sub-parameters)
are commonly used in tasks to select data on which to work. These common data selection parameters are described in § 2.6.
1.5
From Loading Data to Images
The subsections below provide a brief overview of the steps you will need to load data into CASA
and obtain a final, calibrated image. Each subject is covered in more detail in Chapters 2 through
6.
CHAPTER 1. INTRODUCTION
65
An end-to-end workflow diagram for CASA data reduction for interferometry data is shown in
Figure 1.8. This might help you chart your course through the package. In the following subsections, we will chart a rough course through this process, with the later chapters filling in the
individual boxes.
Figure 1.8: Flow chart of the data processing operations that a general user will carry out in an
end-to-end CASA reduction session.
Note that single-dish data reduction (for example with the ALMA single-dish system) follows a
similar course. This is detailed in Chapter A.
1.5.1
Loading Data into CASA
The key data and image import tasks are:
CHAPTER 1. INTRODUCTION
66
• importuvfits — import visibility data in UVFITS format (§ 2.2.1);
• importvla — import data from VLA that is in export format (§ 2.2.2);
• importasdm — import data in ALMA ASDM format (§ 2.2.3);
• importfits — import a FITS image into a CASA image format table (§ 6.11).
These are used to bring in your interferometer data, to be stored as a CASA Measurement set
(MS), and any previously made images or models (to be stored as CASA image tables).
The data import tasks will create a MS with a path and name specified by the vis parameter. See
§ 1.4.3 for more information on MS in CASA. The measurement set is the internal data format used
by CASA, and conversion from any other native format is necessary for most of the data reduction
tasks.
Once data is imported, there are other operations you can use to manipulate the datasets:
• concat — concatenate a second MS into a given MS (§ 2.5)
Data import, export, concatenation, and selection detailed in Chapter 2.
1.5.1.1
VLA: Filling data from VLA archive format
VLA data in “archive” format are read into CASA from disk using the importvla task (see § 2.2.2).
This filler supports the new naming conventions of EVLA antennas when incorporated into the old
VLA system.
Note that future data from the EVLA in ASDM format will use a different filler. This will be made
available in a later release.
1.5.1.2
Filling data from UVFITS format
For UVFITS format, use the importuvfits task. A subset of popular flavors of UVFITS (in
particular UVFITS as written by AIPS) is supported by the CASA filler. See § 2.2.1 for details.
1.5.1.3
Loading FITS images
For FITS format images, such as those to be used as calibration models, use the importfits task.
Most, though not all, types of FITS images written by astronomical software packages can be read
in.
See § 6.11 for more information.
CHAPTER 1. INTRODUCTION
1.5.1.4
67
Concatenation of multiple MS
Once you have loaded data into measurement sets on disk, you can use the concat task to combine
them. Currently, concat will add a second MS to an existing MS (not producing a new one). This
would be run multiple times if you had more than two sets to combine.
See § 2.5 for details.
1.5.2
Data Examination, Editing, and Flagging
The main data examination and flagging tasks are:
• listobs — summarize the contents of a MS (§ 2.3);
• flagmanager — save and manage versions of the flagging entries in the measurement set
(§ 3.2);
• flagautocorr — non-interactive flagging of auto-correlations (§ 3.3);
• plotxy — interactive X-Y plotting and flagging of visibility data (§ 3.4);
• flagdata — non-interactive flagging (and unflagging) of specified data (§ 3.5);
• viewer — the CASA viewer can display (as a raster image) MS data, with some editing
capabilities (§ 7);
• casaplotms — a prototype experimental next-generation interactive MS X-Y plotting and
flagging tool, that will eventually replace plotxy (new in Version 2.4.0) (§ 3.8).
These tasks allow you to list, plot, and/or flag data in a CASA MS.
There will eventually be tasks for “automatic” flagging to data based upon statistical criteria. Stay
tuned.
Examination and editing of synthesis data is described in Chapter 3.
Visualization and editing of an MS using the casaviewer is described in Chapter 7.
1.5.2.1
Interactive X-Y Plotting and Flagging
The principal tool for making X-Y plots of visibility data is plotxy (see § 3.4). Amplitudes and
phases (among other things) can be plotted against several x-axis options.
Interactive flagging (i.e., “see it – flag it”) is possible on the plotxy X-Y displays of the data
(§ 3.4.5). Since flags are inserted into the measurement set, it is useful to backup (or make a copy)
of the current flags before further flagging is done, using flagmanager (§ 3.2). Copies of the flag
table can also be restored to the MS in this way.
CHAPTER 1. INTRODUCTION
1.5.2.2
68
Flag the Data Non-interactively
The flagdata task (§ 3.5) will flag the visibility data set based on the specified data selections.
The listobs task (§ 2.3) may be run (e.g. with verbose=True) to provide some of the information
needed to specify the flagging scope.
1.5.2.3
Viewing and Flagging the MS
The CASA viewer can be used to display the data in the MS as a (grayscale or color) raster image.
The MS can also be edited. Use of the viewer on an MS is detailed in § 7.4.
1.5.3
Calibration
The major calibration tasks are:
• setjy — Computes the model visibilities for a specified source given a flux density or model
image, knows about standard calibrator sources (§ 4.3.4);
• bandpass — Solves for frequency-dependent (bandpass) complex gains (§ 4.4.2);
• gaincal — Solves for time-dependent (frequency-independent) complex gains (§ 4.4.3);
• fluxscale — Bootstraps the flux density scale from standard calibrators (§ 4.4.4);
• polcal — polarization calibration (§ 4.4.5);
• accum — Accumulates incremental calibration solutions into a cumulative calibration table
(§ 4.5.4);
• smoothcal— Smooths calibration solutions derived from one or more sources (§ 4.5.3);
• applycal — Applies calculated calibration solutions (§ 4.6.1);
• clearcal — Re-initializes calibrated visibility data in a given measurement set (§ 4.6.3);
• listcal — Lists calibration solutions (§ 4.5.2);
• plotcal — Plots (and optionally flags) calibration solutions (§ 4.5.1);
• uvcontsub — carry out uv-plane continuum subtraction for spectral-line data (§ 4.7.4);
• split — write out a new (calibrated) MS for specified sources (§ 4.7.1).
During the course of calibration, the user will specify a set of calibrations to pre-apply before
solving for a particular type of effect, for example gain or bandpass or polarization. The solutions
are stored in a calibration table (subdirectory) which is specified by the user, not by the task: care
must be taken in naming the table for future use. The user then has the option, as the calibration
process proceeds, to accumulate the current state of calibration in a new cumulative table. Finally,
the calibration can be applied to the dataset.
Synthesis data calibration is described in detail in Chapter 4.
CHAPTER 1. INTRODUCTION
1.5.3.1
69
Prior Calibration
The setjy task places the Fourier transform of a standard calibration source model in the MODEL DATA
column of the measurement set. This can then be used in later calibration tasks. Currently, setjy
knows the flux density as a function of frequency for several standard VLA flux calibrators, and
the value of the flux density can be manually inserted for any other source. If the source is not
well-modeled as a point source, then a model image of that source structure can be used (with the
total flux density scaled by the values given or calculated above for the flux density). Models are
provided for the standard VLA calibrators.
Antenna gain-elevation curves (e.g. for the VLA antennas) and atmospheric optical depth corrections (applied as an elevation-dependent function) may be pre-applied before solving for the
bandpass and gains. This is currently done by setting the gaincurve and opacity parameters in
the various calibration solving tasks.
See § 4.3 for more details.
1.5.3.2
Bandpass Calibration
The bandpass task calculates a bandpass calibration solution: that is, it solves for gain variations
in frequency as well as in time. Since the bandpass (relative gain as a function of frequency)
generally varies much more slowly than the changes in overall (mean) gain solved for by gaincal,
one generally uses a long time scale when solving for the bandpass. The default ’B’ solution mode
solves for the gains in frequency slots consisting of channels or averages of channels.
A polynomial fit for the solution (solution type ’BPOLY’) may be carried out instead of the default
frequency-slot based ’B’ solutions. This single solution will span (combine) multiple spectral
windows.
Bandpass calibration is discussed in detail in § 4.4.2.
If the gains of the system are changing over the time that the bandpass calibrator is observed, then
you may need to do an initial gain calibration (see next step).
1.5.3.3
Gain Calibration
The gaincal task determines solutions for the time-based complex antenna gains, for each spectral
window, from the specified calibration sources. A solution interval may be specified. The default
’G’ solution mode solved for gains in specified time solution invervals.
A spline fit for the solution (solution type ’GSPLINE’) may be carried out instead of the default
time-slot based ’G’ solutions. This single solution will span (combine) multiple spectral windows.
See § 4.4.3 for more on gain calibration.
CHAPTER 1. INTRODUCTION
1.5.3.4
70
Polarization Calibration
The polcal task will solve for any unknown polarization leakage and cross-hand phase terms (’D’
and ’X’ solutions). The ’D’ leakage solutions will work on sources with no polarization, sources
with known (and supplied) polarization, and sources with unknown polarization tracked through a
range in parallactic angle on the sky.
The solution for the unknown cross-hand polarization phase difference ’X’ term requires a polarized
source with known linear polarization (Q,U).
See § 4.4.5 for more on polarization calibration.
1.5.3.5
Examining Calibration Solutions
The plotcal task (§ 4.5.1) will plot the solutions in a calibration table. The xaxis choices include
time (for gaincal solutions) and channel (e.g. for bandpass calibration). The plotcal interface
and plotting surface is similar to that in plotxy. Eventually, plotcal will allow you to flag and
unflag calibration solutions in the same way that data can be edited in plotxy.
The listcal task (§ 4.5.2) will print out the calibration solutions in a specified table.
1.5.3.6
Bootstrapping Flux Calibration
The fluxscale task bootstraps the flux density scale from “primary” standard calibrators to
the “secondary” calibration sources. Note that the flux density scale must have been previously
established on the “primary” calibrator(s), typically using setjy, and of course a calibration table
containing valid solutions for all calibrators must be available.
See § 4.4.4 for more.
1.5.3.7
Calibration Accumulation
The accum task applies an incremental solution, of a given type, from a table to a previous calibration table (of the same type), and writes out a cumulative solution table. Different interpolation
schemes may be selected.
A description of this process is given in § 4.5.4.
1.5.3.8
Correcting the Data
The final step in the calibration process, applycal may be used to apply several calibration tables
(e.g., from gaincal or bandpass). The corrections are applied to the DATA column of the visibility,
writing the CORRECTED DATA column which can then be plotted (e.g. in plotxy), split out as
the DATA column of a new MS, or imaged (e.g. using clean). Any existing corrected data are
overwritten.
CHAPTER 1. INTRODUCTION
71
See § 4.6.1 for details.
1.5.3.9
Splitting the Data
After a suitable calibration is achieved, it may be desirable to create one or more new measurement
sets containing the data for selected sources. This can be done using the split task (§ 4.7.1).
Further imaging and calibration (e.g. self-calibration) can be carried out on these split Measurement
Sets.
1.5.4
Synthesis Imaging
The key synthesis imaging tasks are:
• clean — Calculates a deconvolved image based on the visibility data, using one of several
clean algorithms (§ 5.3);
• feather — Combines a single dish and synthesis image in the Fourier plane (§ 5.5).
Most of these tasks are used to take calibrated interferometer data, with the possible addition of a
single-dish image, and reconstruct a model image of the sky.
There are several other utility imaging tasks of interest:
• makemask — Makes a mask image from a cleanbox, a file or list specifying sets of pairs of
box corners (§ 5.6);
• ft — Fourier transforms the specified model (or component list) and inserts this into the
MODEL DATA column of the MS (§ 5.7);
• deconvolve — Deconvolve an input image from a provided PSF, using one of several imageplane deconvolution algorithms (§ 5.8).
These are not discussed in this walk-through, see the indicated sections for details.
See Chapter 5 for more on synthesis imaging.
1.5.4.1
Cleaning a single-field image or a mosaic
The CLEAN algorithm is the most popular and widely-studied method for reconstructing a model
image based on interferometer data. It iteratively removes at each step a fraction of the flux in the
brightest pixel in a defined region of the current “dirty” image, and places this in the model image.
The clean task implements the CLEAN algorithm for single-field data. The user can choose from
a number of options for the particular flavor of CLEAN to use.
CHAPTER 1. INTRODUCTION
72
Often, the first step in imaging is to make a simple gridded Fourier inversion of the calibrated data
to make a “dirty” image. This can then be examined to look for the presence of noticeable emission
above the noise, and to assess the quality of the calibration by searching for artifacts in the image.
This is done using clean with niter=0.
The clean task can jointly deconvolve mosaics as well as single fields.
See § 5.3 for an in-depth discussion of the clean task.
1.5.4.2
Feathering in a Single-Dish image
If you have a single-dish image of the large-scale emission in the field, this can be “feathered” in
to the image obtained from the interferometer data. This is carried out using the feather tasks
as the weighted sum in the uv-plane of the gridded transforms of these two images. While not as
accurate as a true joint reconstruction of an image from the synthesis and single-dish data together,
it is sufficient for most purposes.
See § 5.5 for details on the use of the feather task.
1.5.5
Self Calibration
Once a calibrated dataset is obtained, and a first deconvolved model image is computed, a “selfcalibration” loop can be performed. Effectively, the model (not restored) image is passed back to
another calibration process (on the target data). This refines the calibration of the target source,
which up to this point has had (usually) only external calibration applied. This process follows the
regular calibration procedure outlined above.
Any number of self-calibration loops can be performed. As long as the images are improving, it is
usually prudent to continue the self-calibration iterations.
This process is described in § 5.9.
1.5.6
Data and Image Analysis
The key data and image analysis tasks are:
• imhead — summarize and manipulate the “header” information in a CASA image (§ 6.2);
• imcontsub — perform continuum subtraction on a spectral-line image cube (§ 6.3);
• immath — perform mathematical operations on or between images (§ 6.5);
• immoments — compute the moments of an image cube (§ 6.6);
• imstat — calculate statistics on an image or part of an image (§ 6.7);
• imregrid — regrid an image onto the coordinate system of another image (§ 6.9);
CHAPTER 1. INTRODUCTION
73
• viewer — there are useful region statistics and image cube plotting capabilities in the viewer
(§ 7).
1.5.6.1
What’s in an image?
The imhead task will print out a summary of image “header” keywords and values. This task can
also be used to retrieve and change the header values.
See § 6.2 for more.
1.5.6.2
Image statistics
The imstat task will print image statistics. There are options to restrict this to a box region,
and to specified channels and Stokes of the cube. This task will return the statistics in a Python
dictionary return variable.
See § 6.7 for more.
1.5.6.3
Moments of an Image Cube
The immoments task will compute a “moments” image of an input image cube. A number of options
are available, from the traditional true moments (zero, first, second) and variations thereof, to other
images such as median, minimum, or maximum along the moment axis.
See § 6.6 for details.
1.5.6.4
Image math
The immath task will allow you to form a new image by mathematical combinations of other images
(or parts of images). This is a powerful, but tricky, task to use.
See § 6.5 for more.
1.5.6.5
Regridding an Image
It is occasionally necessary to regrid an image onto a new coordinate system. The imregrid task
can be used to regrid an input image onto the coordinate system of an existing template image,
creating a new output image.
See § 6.9 for a description of this task.
CHAPTER 1. INTRODUCTION
1.5.6.6
74
Displaying Images
To display an image use the viewer task. The viewer will display images in raster, contour, or
vector form. Blinking and movies are available for spectral-line image cubes. To start the viewer,
type:
viewer
Executing the viewer task will bring up two windows: a viewer screen showing the data or image,
and a file catalog list. Click on an image or ms from the file catalog list, choose the proper display,
and the image should pop up on the screen. Clicking on the wrench tool (second from left on upper
left) will obtain the data display options. Most functions are self-documenting.
The viewer can be run outside of casapy by typing casaviewer.
See § 7 for more on viewing images.
1.5.7
Getting data and images out of CASA
The key data and image export tasks are:
• exportuvfits — export a CASA MS in UVFITS format (§ 2.2.1);
• exportfits — export a CASA image table as FITS (§ 6.11).
These tasks can be used to export a CASA MS or image to UVFITS or FITS respectively. See the
individual sections referred to above for more on each.
Chapter 2
Visibility Data Import, Export, and
Selection
To use CASA to process your data, you first will need to get it into a form that is understood
by the package. These are “measurement sets” for synthesis (and single dish) data, and “image
tables” for images.
There are a number of tasks used to fill telescope-specific data, to import/export standard formats,
to list data contents, and to concatenate multiple datasets. These are:
• importuvfits — import visibility data in UVFITS format (§ 2.2.1.1)
• importvla — import data from VLA that is in export format (§ 2.2.2)
• importasdm — import data in ALMA ASDM format (§ 2.2.3)
• exportuvfits — export a CASA MS in UVFITS format (§ 2.2.1.2)
• listobs — summarize the contents of a MS (§ 2.3)
• concat — concatenate two or more MS into a new MS (§ 2.5)
• vishead — list and change the metadata contents of a MS (§ 2.4)
In CASA, there is a standard syntax for selection of data that is employed by multiple tasks. This
is described in § 2.6.
There are also tasks for the import and export of image data using FITS:
• importfits — import a FITS image into a CASA image format table (§ 6.11)
• exportfits — export a CASA image table as FITS (§ 6.11)
75
CHAPTER 2. VISIBILITY DATA IMPORT, EXPORT, AND SELECTION
2.1
76
CASA Measurement Sets
Data is handled in CASA via the table system. In particular, visibility data are stored in a CASA
table known as a Measurement Set (MS). Details of the physical and logical MS structure are given
below, but for our purposes here an MS is just a construct that contains the data. An MS can also
store single dish data (essentially a set of auto-correlations of a 1-element interferometer), though
there are also data formats more suitable for single-dish spectra (see § A).
Note that images are handled through special image tables,
although standard FITS I/O is also supported. Images and
image data are described in a separate chapter.
Inside the Toolkit:
Measurement sets are handled in
the ms tool. Import and export
methods include ms.fromfits and
ms.tofits.
Unless your data was previously processed by CASA or
software based upon its predecessor aips++, you will need
to import it into CASA as an MS. Supported formats include some “standard” flavors of UVFITS, the VLA “Export” archive format, and most recently, the ALMA Science Data Model (ASDM) format. These
are described below in § 2.2.
Once in Measurement Set form, your data can be accessed through various tools and tasks with a
common interface. The most important of these is the data selection interface (§ 2.6) which allows
you to specify the subset of the data on which the tasks and tools will operate.
2.1.1
Under the Hood: Structure of the Measurement Set
It is not necessary that a casual CASA user know the specific details on how the data in the MS is stored and the
contents of all the sub-tables. However, we will occasionally refer to specific “columns” of the MS when describing
the actions of various tasks, and thus we provide the following synopsis to familiarize the user with the necessary
nomenclature. You may skip ahead to subsequent sections
if you like!
Inside the Toolkit:
Generic CASA tables are handled in
the tb tool. You have direct access
to keywords, rows and columns of the
tables with the methods of this tool.
All CASA data files, including Measurement Sets, are written into the current working directory by
default, with each CASA table represented as a separate sub-directory. MS names therefore need
only comply with UNIX file or directory naming conventions, and can be referred to from within
CASA directly, or via full path names.
An MS consists of a MAIN table containing the visibility data. and associated sub-tables containing
auxiliary or secondary information. The tables are logical constructs, with contents located in the
physical table.* files on disk. The MAIN table consists of the table.* files in the main directory of
the ms-file itself, and the other tables are in the respective subdirectories. The various MS tables
and sub-tables can be seen by listing the contents of the MS directory itself (e.g. using Unix ls),
or via the browsetable task (§ 3.6).
See Fig 2.1 for an example of the contents of a MS directory. Or, from the casapy prompt,
CHAPTER 2. VISIBILITY DATA IMPORT, EXPORT, AND SELECTION
CASA <1>: ls ngc5921.ms
IPython system call: ls -F ngc5921.ms
ANTENNA
POLARIZATION
table.f1
DATA_DESCRIPTION PROCESSOR
table.f10
FEED
SORTED_TABLE
table.f10_TSM1
FIELD
SOURCE
table.f11
FLAG_CMD
SPECTRAL_WINDOW table.f11_TSM1
HISTORY
STATE
table.f2
OBSERVATION
table.dat
table.f2_TSM1
POINTING
table.f0
table.f3
table.f3_TSM1
table.f4
table.f5
table.f5_TSM1
table.f6
table.f6_TSM0
table.f7
table.f7_TSM1
77
table.f8
table.f8_TSM1
table.f9
table.f9_TSM1
table.info
table.lock
Note that the MAIN table information is contained in the table.* files in this directory. Each of
the sub-table sub-directories contain their own table.dat and other files, e.g.
CASA <2>: ls ngc5921.ms/SOURCE
IPython system call: ls -F ngc5921.ms/SOURCE
table.dat table.f0 table.f0i table.info table.lock
Figure 2.1: The contents of a Measurement Set. These tables compose a Measurement Set named
ngc5921.demo.ms on disk. This display is obtained by using the File:Open menu in browsetable
and left double-clicking on the ngc5921.demo.ms directory.
CHAPTER 2. VISIBILITY DATA IMPORT, EXPORT, AND SELECTION
78
Each “row” in a table contains entries for a number of specified “columns”. For example, in the
MAIN table of the MS, the original visibility data is contained in the DATA column — each “cell”
contains a matrix of observed complex visibilities for that row at a single time stamp, for a single
baseline in a single spectral window. The shape of the data matrix is given by the number of
channels and the number of correlations (voltage-products) formed by the correlator for an array.
Table 2.1 lists the non-data columns of the MAIN table that are most important during a typical
data reduction session. Table 2.2 lists the key data columns of the MAIN table of an interferometer MS. The MS produced by fillers for specific instruments may insert special columns, such as
ALMA PHASE CORR, ALMA NO PHAS CORR and ALMA PHAS CORR FLAG ROW for ALMA data filled using
the importasdm filler (§ 2.2.3). These columns are visible in browsetable and are accessible from
the toolkit in the ms tool (e.g. the ms.getdata method) and from the tb “table” tool (e.g. using
tb.getcol).
Note that when you examine table entries for IDs such as FIELD ID or DATA DESC ID, you will see
0-based numbers.
Table 2.1: Common columns in the MAIN table of the MS.
Parameter
ANTENNA1
ANTENNA2
FIELD ID
DATA DESC ID
ARRAY ID
OBSERVATION ID
POLARIZATION ID
SCAN NUMBER
TIME
UVW
Contents
First antenna in baseline
Second antenna in baseline
Field (source no.) identification
Spectral window number, polarization identifier pair (IF no.)
Subarray number
Observation identification
Polarization identification
Scan number
Integration midpoint time
UVW coordinates
The MS can contain a number of “scratch” columns, which are used to hold useful versions of other
columns such as the data or weights for further processing. The most common scratch columns
are:
• CORRECTED DATA — used to hold calibrated data for imaging or display;
• MODEL DATA — holds the Fourier inversion of a particular model image for calibration or
imaging;
• IMAGING WEIGHT —holds the gridding weights to be used in imaging.
The creation and use of the scratch columns is generally done behind the scenes, but you should
be aware that they are there (and when they are used).
CHAPTER 2. VISIBILITY DATA IMPORT, EXPORT, AND SELECTION
79
Table 2.2:
Commonly accessed MAIN Table data-related columns. Note that the columns
ALMA PHASE CORR, ALMA NO PHAS CORR and ALMA PHAS CORR FLAG ROW are specific to ALMA data
filled using the importasdm filler.
Column
DATA
Format
Complex(Nc , Nf )
FLAG
WEIGHT
WEIGHT SPECTRUM
ALMA PHASE CORR
Bool(Nc , Nf )
Float(Nc )
Float(Nc , Nf )
Complex(Nc , Nf )
ALMA NO PHAS CORR
Bool(Nc , Nf )
ALMA PHAS CORR FLAG ROW
Bool(Nc , Nf )
MODEL DATA
Complex(Nc , Nf )
CORRECTED DATA
Complex(Nc , Nf )
IMAGING WEIGHT
Float(Nc )
Contents
complex visibility data matrix (=
ALMA PHASE CORR by default)
cumulative data flags
weight for a row
individual weights for a data matrix
on-line phase corrected data (Not in
VLA data)
data that has not been phase corrected
(Not in VLA data)
flag to use phase-corrected data or not
(not in VLA data)
Scratch: created by calibrater or imager tools
Scratch: created by calibrater or imager tools
Scratch: created by calibrater or imager tools
The most recent specification for the MS is Aips++ MeasurementSet definition version 2.0
(http://casa.nrao.edu/Memos/229.html).
2.2
Data Import and Export
There are a number of tasks available to bring data in various forms into CASA as a Measurement
Set:
• UVFITS format can be imported into and exported from CASA (importuvfits and exportuvfits)
• VLA Archive format data can be imported into CASA (importvla)
• ALMA and EVLA Science Data Model format data can be imported into CASA (importasdm)
2.2.1
UVFITS Import and Export
The UVFITS format is not exactly a standard, but is a popular archive and transport format
nonetheless. CASA supports UVFITS files written by the AIPS FITTP task, and others.
UVFITS is supported for both import and export.
CHAPTER 2. VISIBILITY DATA IMPORT, EXPORT, AND SELECTION
2.2.1.1
80
Import using importuvfits
To import UVFITS format data into CASA, use the importuvfits task:
CASA <1>: inp(importuvfits)
fitsfile
=
’’
vis
=
’’
antnamescheme
=
’old’
async
=
False
# Name of input UVFITS file
# Name of output visibility file (MS)
# For VLA only; ’new’ or ’old’; ’VA04’ or ’04’ for VLA ant 4
# if True run in the background, prompt is freed
This is straightforward, since all it does is read in a UVFITS file and convert it as best it can into
a MS.
For example:
importuvfits(fitsfile=’NGC5921.fits’,vis=’ngc5921.ms’)
BETA ALERT: We cannot currently fill CARMA data exported via Miriad UVFITS.
2.2.1.2
Export using exportuvfits
The exportuvfits task will take a MS and write it out in UVFITS format. The defaults are:
#
exportuvfits :: Convert a CASA visibility data set (MS) to a UVFITS file
vis
fitsfile
datacolumn
field
spw
antenna
time
nchan
start
width
writesyscal
multisource
combinespw
writestation
async
=
’’
=
’’
= ’corrected’
=
’’
=
’’
=
’’
=
’’
=
-1
=
0
=
1
=
False
=
True
=
True
=
True
=
False
#
#
#
#
#
#
#
#
#
#
#
#
#
#
#
Name of input visibility file
Name of output UVFITS file)
which data to write (data, corrected, model)
Field name list
Spectral window and channel selection
antenna list to select
time range selection
Number of channels to select
Start channel
Channel averaging width (value>1 indicates averaging)
Write GC and TY tables
Write in multi-source format
Combine spectral windows (True for AIPS)
Write station name instead of antenna name
if True run in the background, prompt is freed
For example:
exportuvfits(vis=’ngc5921.split.ms’,
fitsfile=’NGC5921.split.fits’,
multisource=False)
CHAPTER 2. VISIBILITY DATA IMPORT, EXPORT, AND SELECTION
81
The MS selection parameters field, spw, antenna, and timerange follow the standard selection
syntax described in § 2.6.
BETA ALERT: The nchan, start, and width parameters will be superseded by channel selection
in spw. Currently, there is a time parameter rather than timerange.
The datacolumn parameter chooses which data-containing column of the MS (see § 2.1.1) is to be
written out to the UV FITS file. Choices are: ’data’, ’corrected’, and ’model’.
There are a number of special parameters that control what is written out. These are mostly here
for compatibility with AIPS.
The writesyscal parameter toggles whether GC and TY extension tables are written. These are
important for VLBA data, and for EVLA data. BETA ALERT: Not yet available.
The multisource parameter determines whether the UV FITS file is a multi-source file or a singlesource file, if you have a single-source MS or choose only a single source. Note: the difference
between a single-source and multi-source UVFITS file here is whether it has a source (SU) table
and the source ID in the random parameters. If you select more than one source in fields, then
the multisource parameter will be overridden to be True regardless.
The combinespw parameter allows combination of all spectral windows at one time. If True, then
all spectral windows must have the same shape. For AIPS to read an exported file, then set
combinespw=True.
The writestation parameter toggles the writing of the station name instead of antenna name.
2.2.2
VLA: Filling data from archive format (importvla)
VLA data in archive format (i.e., as downloaded from the VLA data archive) are read into CASA
from disk using the importvla task. The inputs are:
#
importvla :: import VLA archive file(s) to a measurement set:
archivefiles
vis
bandname
frequencytol
project
starttime
stoptime
applytsys
autocorr
antnamescheme
keepblanks
async
=
=
=
=
=
=
=
=
=
=
=
=
’’
’’
’’
150000.0
’’
’’
’’
True
False
’new’
False
False
#
#
#
#
#
#
#
#
#
#
#
Name of input VLA archive file(s)
Name of output visibility file
VLA frequency band name:’’=>obtain all bands in archive files
Frequency shift to define a unique spectral window (Hz)
Project name: ’’ => all projects in file
start time to search for data
end time to search for data
apply nominal sensitivity scaling to data & weights
import autocorrelations to ms, if set to True
’old’ or ’new’; ’VA04’ or ’4’ for ant 4
Fill scans with empty source names (e.g. tipping scans)?
The main parameters are archivefiles to specify the input VLA Archive format file names, and
vis to specify the output MS name.
CHAPTER 2. VISIBILITY DATA IMPORT, EXPORT, AND SELECTION
82
BETA ALERT: The scaling of VLA data both before and after the June 2007 Modcomp-turnoff
is fully supported, based on the value of applytsys.
The NRAO Archive is located at:
• https://archive.nrao.edu
Note that archivefiles takes a string or list of strings, as there are often multiple files for a
project in the archive.
For example:
archivefiles = [’AP314_A950519.xp1’,’AP314_A950519.xp2’]
vis = ’NGC7538.ms’
The importvla task allows selection on the frequency band. Suppose that you have 1.3 cm line
observations in K-band and you have copied the archive data files AP314 A95019.xp* to your
working directory and started casapy. Then,
default(’importvla’)
archivefiles = [’AP314_A950519.xp1’,’AP314_A950519.xp2’,’AP314_A950519.xp3’]
vis = ’ngc7538.ms’
bandname = ’K’
frequencytol = 10e6
importvla()
If the data is located in a different directory on disk, then use the full path name to specify each
archive file, e.g.:
archivefiles=[’/home/rohir2/jmcmulli/ALMATST1/Data/N7538/AP314_A950519.xp1’,\
’/home/rohir2/jmcmulli/ALMATST1/Data/N7538/AP314_A950519.xp2’,\
’/home/rohir2/jmcmulli/ALMATST1/Data/N7538/AP314_A950519.xp3’]
Important Note: importvla will import the on-line flags (from the VLA system) along with the
data. These will be put in the MAIN table and thus available to subsequent tasks and tools. If you
wish to revert to unflagged data, use flagmanager (§ 3.2) to save the flags (if you wish), and then
use flagdata (§ 3.5) with mode=’manualflag’ and unflag=True to toggle off the flags.
The other parameters are:
2.2.2.1
Parameter applytsys
The applytys parameter controls whether the nominal sensitivity scaling (based on the measured
TSYS, with the weights scaled accordingly using the integration time) is applied to the visibility
amplitudes or not. If True, then it will be scaled so as to be the same as AIPS FILLM (ie. approximately in deciJanskys). Note that post-Modcomp data is in raw correlation coefficient and will
be scaled using the TSYS values, while Modcomp-era data had this applied online. In all cases
CHAPTER 2. VISIBILITY DATA IMPORT, EXPORT, AND SELECTION
83
importvla will do the correct thing to data and weights based on an internal flag in the VLA
Archive file, either scaling it or unscaling based on your choice for applytys.
If applytsys=True and you see strange behavior in data amplitudes, it may be due to erroneous
TSYS values from the online system. You might want to then fill with applytsys=False and look
at the correlation coefficients to see if the behavior is as expected.
2.2.2.2
Parameter bandname
The bandname indicates the VLA Frequency band(s) to load, using the traditional bandname codes.
These are:
• ’4’ = 48-96 MHz
• ’P’ = 298-345 MHz
• ’L’ = 1.15-1.75 GHz
• ’C’ = 4.2-5.1 GHz
• ’X’ = 6.8-9.6 GHz
• ’U’ = 13.5-16.3 GHz
• ’K’ = 20.8-25.8 GHz
• ’Q’ = 38-51 GHz
• ’’ = all bands (default)
Note that as the transition from the VLA to EVLA progresses, the actual frequency ranges covered
by the bands will expand, and additional bands will be added (namely ’S’ from 1-2 GHz and ’A’
from 26.4-40 GHz).
2.2.2.3
Parameter frequencytol
The frequencytol parameter specifies the frequency separation tolerated when assigning data to
spectral windows. The default is frequencytol=150000 (Hz). For Doppler tracked data, where
the sky frequency changes with time, a frequencytol < 10000 Hz may may produce too many
unnecessary spectral windows.
2.2.2.4
Parameter project
You can specify a specific project name to import from archive files. The default ’’ will import
data from all projects in file(s) archivefiles.
For example for VLA Project AL519:
CHAPTER 2. VISIBILITY DATA IMPORT, EXPORT, AND SELECTION
project = ’AL519’
project = ’al519’
84
# this will work
# this will also work
while project=’AL0519’ will NOT work (even though that is what queries to the VLA Archive
will print it as - sorry!).
2.2.2.5
Parameters starttime and stoptime
You can specify start and stop times for the data, e.g.:
starttime = ’1970/1/31/00:00:00’
stoptime = ’2199/1/31/23:59:59’
Note that the blank defaults will load all data fitting other criteria.
2.2.2.6
Parameter autocorr
Note that autocorrelations are filled into the data set if autocorr=True. Generally for the VLA,
autocorrelation data is not useful, and furthermore the imaging routine will try to image the
autocorrelation data (it assumes it is single dish data) which will swamp any real signal. Thus, if
you do fill the autocorrelations, you will have to flag them before imaging.
2.2.2.7
Parameter antnamescheme
The antnamescheme parameter controls whether importvla will try to use a naming scheme where
EVLA antennas are prefixed with EA (e.g. ’EA16’) and old VLA antennas have names prefixed
with VA (e.g. ’VA11’). Our method to detect whether an antenna is EVLA is not yet perfected,
and thus unless you require this feature, simply use antnamescheme=’old’.
2.2.3
ALMA: Filling ALMA Science Data Model (ASDM) observations
The importasdm task will fill an ASDM into a CASA visibility data set (MS).
BETA ALERT: Note that ASDM data are not generally available at this time, except for commissioning at the ALMA Test Facility (ATF) and the site. Thus, this filler is in a development
stage. Also, currently there are no options for filling selected data (you get the whole data set).
Current inputs are:
# importasdm
asdm
corr_mode
srt
time_sampling
::
=
=
=
=
Convert
’’
’all’
’all’
’all’
an
#
#
#
#
ALMA Science Data Model observation into a CASA visibility file
Name of input asdm directory (on disk)
Correlation mode on input (e.g. ’ao’ ’co’ ’ac’)
Spectral resolution type on input (e.g. ’fr’ ’ca’ ’bw’)
Time sampling (INTEGRATION ’i’ and/or SUBINTEGRATION ’si’)
CHAPTER 2. VISIBILITY DATA IMPORT, EXPORT, AND SELECTION
ocorr_mode
compression
async
=
=
=
’co’
False
False
#
#
#
85
Output correlation mode AUTO_ONLY (ao), CROSS_ONLY (co), or CROSS_AND_AUTO (c
Flag for turning on data compression
Run task asynchronously
For example:
CASA <1>: importasdm(’/home/basho3/jmcmulli/ASDM/ExecBlock3’)
Parameter: asdm is: /home/basho3/jmcmulli/ASDM/ExecBlock3 and has type <type ’str’>.
Taking the dataset /home/basho3/jmcmulli/ASDM/ExecBlock3 as input.
Time spent parsing the XML medata :1.16 s.
The measurement set will be filled with complex data
About to create a new measurement set ’/home/basho3/jmcmulli/ASDM/ExecBlock3.ms’
The dataset has 4 antennas...successfully copied them into the measurement set.
The dataset has 33 spectral windows...successfully copied them into the measurement set.
The dataset has 4 polarizations...successfully copied them into the measurement set.
The dataset has 41 data descriptions...successfully copied them into the measurement set.
The dataset has 125 feeds...successfully copied them into the measurement set.
The dataset has 2 fields...successfully copied them into the measurement set.
The dataset has 0 flags...
The dataset has 0 historys...
The dataset has 1 execBlock(s)...successfully copied them into the measurement set.
The dataset has 12 pointings...successfully copied them into the measurement set.
The dataset has 3 processors...successfully copied them into the measurement set.
The dataset has 72 sources...successfully copied them into the measurement set.
The dataset has 3 states...
The dataset has 132 calDevices...
The dataset has 72 mains...
Processing row # 0 in MainTable
Entree ds getDataCols
About to clear
About to getData
About to new VMSData
Exit from getDataCols
ASDM Main table row #0 transformed into 40 MS Main table rows
Processing row # 1 in MainTable
Entree ds getDataCols
About to clear
About to getData
About to new VMSData
Exit from getDataCols
ASDM Main table row #1 transformed into 40 MS Main table rows
...
ASDM Main table row #71 transformed into 40 MS Main table rows
...successfully copied them into the measurement set.
About to flush and close the measurement set.
Overall time spent in ASDM methods to read/process the ASDM Main table : cpu = 5.31 s.
Overall time spent in AIPS methods to fill the MS Main table : cpu = 1.3
CHAPTER 2. VISIBILITY DATA IMPORT, EXPORT, AND SELECTION
2.3
86
Summarizing your MS (listobs)
Once you import your data into a CASA Measurement Set, you can get a summary of the MS
contents with the listobs task.
The inputs are:
vis
verbose
=
=
’’
True
#
#
Name of input visibility file (MS)
Extended summary list of data set in logger
The summary will be written to the logger and to the casapy.log file. For example, using
verbose=False:
listobs(’n5921.ms’,False)
results in the logger messages:
Thu Jul 5 17:20:55 2007
NORMAL ms::summary:
MeasurementSet Name:
/home/scamper/CASA/N5921/n5921.ms
MS Version 2
Observer: TEST
Project:
Observation: VLA(28 antennas)
Thu Jul 5 17:20:55 2007
NORMAL ms::summary:
Data records: 22653
Total integration time = 5280 seconds
Observed from
09:19:00
to
10:47:00
Thu Jul 5 17:20:55 2007
NORMAL ms::summary:
Fields: 3
ID
Name
Right Ascension Declination
Epoch
0
1331+30500002_013:31:08.29
+30.30.32.96 J2000
1
1445+09900002_014:45:16.47
+09.58.36.07 J2000
2
N5921_2
15:22:00.00
+05.04.00.00 J2000
Thu Jul 5 17:20:55 2007
NORMAL ms::summary:
Spectral Windows: (1 unique spectral windows and 1 unique polarization setups)
SpwID #Chans Frame Ch1(MHz)
Resoln(kHz) TotBW(kHz) Ref(MHz)
Corrs
0
63 LSRK 1412.68608 24.4140625 1550.19688 1413.44902 RR LL
Thu Jul 5 17:20:55 2007
NORMAL ms::summary:
Antennas: 27
ID=
0-3: ’1’=’VLA:N7’, ’2’=’VLA:W1’, ’3’=’VLA:W2’, ’4’=’VLA:E1’,
ID=
4-7: ’5’=’VLA:E3’, ’6’=’VLA:E9’, ’7’=’VLA:E6’, ’8’=’VLA:W8’,
ID= 8-11: ’9’=’VLA:N5’, ’10’=’VLA:W3’, ’11’=’VLA:N4’, ’12’=’VLA:W5’,
ID= 12-15: ’13’=’VLA:N3’, ’14’=’VLA:N1’, ’15’=’VLA:N2’, ’16’=’VLA:E7’,
ID= 16-19: ’17’=’VLA:E8’, ’18’=’VLA:W4’, ’19’=’VLA:E5’, ’20’=’VLA:W9’,
ID= 20-24: ’21’=’VLA:W6’, ’22’=’VLA:E4’, ’24’=’VLA:E2’, ’25’=’VLA:N6’,
ID= 25-26: ’26’=’VLA:N9’, ’27’=’VLA:N8’
CHAPTER 2. VISIBILITY DATA IMPORT, EXPORT, AND SELECTION
Thu Jul 5 17:20:55 2007
87
NORMAL ms::summary:
Tables(rows):
(-1 = table absent)
MAIN(22653)
ANTENNA(28)
DATA_DESCRIPTION(1)
DOPPLER(-1)
FEED(28)
FIELD(3)
FLAG_CMD(0)
FREQ_OFFSET(-1)
HISTORY(310)
OBSERVATION(1)
POINTING(168)
POLARIZATION(1)
PROCESSOR(0)
SOURCE(3)
SPECTRAL_WINDOW(1)
STATE(0)
SYSCAL(-1)
WEATHER(-1)
Thu Jul 5 17:20:55 2007
NORMAL ms::summary ""
Thu Jul 5 17:20:55 2007
NORMAL ms::close:
Readonly measurement set: just detaching from file.
If you choose the (default) verbose=True option, there will be more information. For example,
listobs(’n5921.ms’,True)
will result in the logger messages:
Thu Jul 5 17:23:55 2007
NORMAL ms::summary:
MeasurementSet Name:
Observer: TEST
Observation: VLA
/home/scamper/CASA/N5921/n5921.ms
MS Version 2
Project:
Thu Jul 5 17:23:55 2007
NORMAL ms::summary:
Data records: 22653
Total integration time = 5280 seconds
Observed from
09:19:00
to
10:47:00
Thu Jul 5 17:23:55 2007
ObservationID = 0
Date
Timerange
13-Apr-1995/09:19:00.0
09:27:30.0
09:33:00.0
09:50:30.0
10:22:00.0
10:26:00.0
10:45:30.0
NORMAL ms::summary:
-
ArrayID = 0
Scan
09:24:30.0
1
09:29:30.0
2
09:48:00.0
3
09:51:00.0
4
10:23:00.0
5
10:43:00.0
6
10:47:00.0
7
FldId
0
1
2
1
1
2
1
FieldName
SpwIds
1331+30500002_0 [0]
1445+09900002_0 [0]
N5921_2
[0]
1445+09900002_0 [0]
1445+09900002_0 [0]
N5921_2
[0]
1445+09900002_0 [0]
Thu Jul 5 17:23:55 2007
NORMAL ms::summary:
Fields: 3
ID
Name
Right Ascension Declination
Epoch
0
1331+30500002_013:31:08.29
+30.30.32.96 J2000
1
1445+09900002_014:45:16.47
+09.58.36.07 J2000
CHAPTER 2. VISIBILITY DATA IMPORT, EXPORT, AND SELECTION
2
N5921_2
15:22:00.00
+05.04.00.00
J2000
Thu Jul 5 17:23:55 2007
NORMAL ms::summary:
Spectral Windows: (1 unique spectral windows and 1 unique polarization setups)
SpwID #Chans Frame Ch1(MHz)
Resoln(kHz) TotBW(kHz) Ref(MHz)
Corrs
0
63 LSRK 1412.68608 24.4140625 1550.19688 1413.44902 RR LL
Thu Jul 5 17:23:55 2007
NORMAL ms::summary:
Feeds: 28: printing first row only
Antenna
Spectral Window
# Receptors
Polarizations
1
-1
2
[
R, L]
Thu Jul 5 17:23:55 2007
NORMAL ms::summary:
Antennas: 27:
ID
Name Station
Diam.
Long.
Lat.
0
1
VLA:N7
25.0 m
-107.37.07.2 +33.54.12.9
1
2
VLA:W1
25.0 m
-107.37.05.9 +33.54.00.5
2
3
VLA:W2
25.0 m
-107.37.07.4 +33.54.00.9
3
4
VLA:E1
25.0 m
-107.37.05.7 +33.53.59.2
4
5
VLA:E3
25.0 m
-107.37.02.8 +33.54.00.5
5
6
VLA:E9
25.0 m
-107.36.45.1 +33.53.53.6
6
7
VLA:E6
25.0 m
-107.36.55.6 +33.53.57.7
7
8
VLA:W8
25.0 m
-107.37.21.6 +33.53.53.0
8
9
VLA:N5
25.0 m
-107.37.06.7 +33.54.08.0
9
10
VLA:W3
25.0 m
-107.37.08.9 +33.54.00.1
10
11
VLA:N4
25.0 m
-107.37.06.5 +33.54.06.1
11
12
VLA:W5
25.0 m
-107.37.13.0 +33.53.57.8
12
13
VLA:N3
25.0 m
-107.37.06.3 +33.54.04.8
13
14
VLA:N1
25.0 m
-107.37.06.0 +33.54.01.8
14
15
VLA:N2
25.0 m
-107.37.06.2 +33.54.03.5
15
16
VLA:E7
25.0 m
-107.36.52.4 +33.53.56.5
16
17
VLA:E8
25.0 m
-107.36.48.9 +33.53.55.1
17
18
VLA:W4
25.0 m
-107.37.10.8 +33.53.59.1
18
19
VLA:E5
25.0 m
-107.36.58.4 +33.53.58.8
19
20
VLA:W9
25.0 m
-107.37.25.1 +33.53.51.0
20
21
VLA:W6
25.0 m
-107.37.15.6 +33.53.56.4
21
22
VLA:E4
25.0 m
-107.37.00.8 +33.53.59.7
23
24
VLA:E2
25.0 m
-107.37.04.4 +33.54.01.1
24
25
VLA:N6
25.0 m
-107.37.06.9 +33.54.10.3
25
26
VLA:N9
25.0 m
-107.37.07.8 +33.54.19.0
26
27
VLA:N8
25.0 m
-107.37.07.5 +33.54.15.8
27
28
VLA:W7
25.0 m
-107.37.18.4 +33.53.54.8
Thu Jul 5 17:23:55 2007
Tables:
MAIN
ANTENNA
DATA_DESCRIPTION
DOPPLER
NORMAL ms::summary:
22653 rows
28 rows
1 row
<absent>
88
CHAPTER 2. VISIBILITY DATA IMPORT, EXPORT, AND SELECTION
FEED
FIELD
FLAG_CMD
FREQ_OFFSET
HISTORY
OBSERVATION
POINTING
POLARIZATION
PROCESSOR
SOURCE
SPECTRAL_WINDOW
STATE
SYSCAL
WEATHER
28
3
<empty>
<absent>
310
1
168
1
<empty>
3
1
<empty>
<absent>
<absent>
Thu Jul 5 17:23:55 2007
89
rows
rows
rows
row
rows
row
rows
row
NORMAL ms::summary ""
Thu Jul 5 17:23:55 2007
NORMAL ms::close:
Readonly measurement set: just detaching from file.
The most useful extra information that verbose=True gives is the list of the scans in the dataset.
2.4
Listing and manipulating MS metadata (vishead)
BETA ALERT: This is still a prototype task.
The default inputs are:
# vishead :: List, get, and put metadata in a measurement set
vis
=
’’
# Name of input visibility file
mode
=
’summary’
# options: list, summary, get, put
async
=
False
#
For mode = ’list’ the options are: ’telescope’, ’observer’, ’project’, ’field’, ’freq group name’,
’spw name’, ’schedule’, ’schedule type’, ’release date’.
2.5
Concatenating multiple datasets (concat)
Once you have your data in the form of CASA Measurement Sets, you can go ahead and process
your data using the editing, calibration, and imaging tasks. In some cases, you will most efficiently
operate on single MS for a particular session (such as calibration). Other tasks will (eventually)
take multiple Measurement Sets as input. For others, it is easiest to combine your multiple data
files into one.
If you need to combine multiple datasets, you can use the concat task. The default inputs are:
CHAPTER 2. VISIBILITY DATA IMPORT, EXPORT, AND SELECTION
90
# concat :: Concatenate two or more visibility data sets.
vis
=
[’’]
# Name of input visibility files to be concatenated
concatvis
=
’’
# Name of output visibility file
freqtol
=
’’
# Frequency tolerance for considering data as the same spwid
dirtol
=
’’
# Direction tolerance for considering data as the same field
timesort
=
False
# If true, sort by TIME in ascending order
async
=
False
# If true the taskname must be started using concat(...)
The vis parameter will take a list of one or more MS. Usually, this will contain all the MS to
combine.
The concatvis parameter contains the name of the output MS. If this points to an existing file
on disk, then the MS in vis will appended to it, otherwise a new MS file is created to contain the
concatenated data. Be careful here!
The parameters freqtol and dirtol control how close together in frequency and angle on the sky
spectral windows or field locations need to be before calling them the same.
BETA ALERT: Note that if multiple frequencies or pointings are combined using freqtol or
dirtol, then the data are not changed (ie. not rephased to the single phase center). Use of these
parameters is intended to be tolerant of small offsets (e.g. planets tracked which move slightly
in J2000 over the course of observations, or combining epochs observed with slightly different
positions).
For example:
default(’concat’)
vis = [’n4826_16apr.split.ms’,’n4826_22apr.split.ms’]
concatvis = ’n4826_tboth.ms’
freqtol = ’50MHz’
concat()
combines the two days in ’n4826 16apr.split.ms’ and ’n4826 22apr.split.ms’ into a new
output MS called ’n4826 tboth.ms’.
BETA ALERT: There are additional issues when concatenating individual MS files with different
spectral windows. In this case, the rest frequencies (if set) of these windows may be lost in subsequent operations (e.g. split). If this occurs, then you can either set the restfreq explicitly in
certain tasks (plotxy and clean), or use the following snippet of code to fix this up after concat
has run:
#
##########################################################################
#
# Fix up the MS after concat (NOTE: STILL NECESSARY IN 2.4)
# This ensures that the rest freq will be found for all spws.
# print ’--Fixing up spw rest frequencies in MS--’
vis=’ngc4826.tutorial.ms’
# Example vis name, put yours here!
tb.open(vis+’/SOURCE’,nomodify=false)
spwid=tb.getcol(’SPECTRAL_WINDOW_ID’)
CHAPTER 2. VISIBILITY DATA IMPORT, EXPORT, AND SELECTION
91
# The following is for 64bit systems 08-Jul-2008. ok on 32bit also.
spwid.setfield(-1,’int32’)
tb.putcol(’SPECTRAL_WINDOW_ID’,spwid)
tb.close()
For example, this is used in the NGC4826 BIMA mosaic script (Appendix F.3).
2.6
Data Selection
Once in MS form, subsets of the data can be operated on
using the tasks and tools. In CASA, there are three comBeta Alert!
mon data selection parameters used in the various tasks: Data selection is being changed over
field, spw, and selectdata. In addition, the selectdata to this new unified system. In variparameter, if set to True, will open up a number of other ous tasks, you may find relics of the
sub-parameters for selection. The selection operation is old way, such as fieldid or spwid.
unified across all the tasks. The available selectdata parameters may not be the same in all tasks. But if present,
the same parameters mean the same thing and behave in the same manner when used in any task.
For example:
field
spw
selectdata
=
=
=
’’
’’
False
#
#
#
field names or index of calibrators ’’==>all
spectral window:channels: ’’==>all
Other data selection parameters
=
=
=
=
=
=
=
=
’’
’’
True
’’
’’
’’
’’
’’
#
#
#
#
#
#
#
#
field names or index of calibrators ’’==>all
spectral window:channels: ’’==>all
Other data selection parameters
time range: ’’==>all
uv range’’=all
antenna/baselines: ’’==>all
scan numbers: Not yet implemented
Optional data selection (Specialized. but see help)
versus
field
spw
selectdata
timerange
uvrange
antenna
scan
msselect
The following are the general syntax rules and descriptions of the individual selection parameters
of particular interest for the tasks:
2.6.1
General selection syntax
Most of the selections are effected through the use of selection strings. This sub-section describes
the general rules used in constructing and parsing these strings. Note that some selections are done
CHAPTER 2. VISIBILITY DATA IMPORT, EXPORT, AND SELECTION
92
though the use of numbers or lists. There are also parameter-specific rules that are described under
each parameter.
All lists of basic selection specification-units are comma separated lists and can be of any length.
White-spaces before and after the commas (e.g. ’3C286, 3C48, 3C84’) are ignored, while whitespace within sub-strings is treated as part of the sub-string (e.g. ’3C286, VIRGO A, 3C84’).
All integers can be of any length (in terms of characters) composed of the characters 0–9. Floating
point numbers can be in the standard format (DIGIT.DIGIT, DIGIT., or .DIGIT) or in the mantissaexponent format (e.g. 1.4e9). Places where only integers make sense (e.g. IDs), if a floating point
number is given, only the integer part is used (it is truncated).
Range of numbers (integers or real numbers) can be given in the format ’N0~N1’. For integer
ranges, it is expanded into a list of integers starting from N0 (inclusive) to N1 (inclusive). For real
numbers, it is used to select all values present for the appropriate parameter in the Measurement
Set between N0 and N1 (including the boundaries). Note that the ’~’ character is used rather than
the more obvious ’-’ in order to accommodate hyphens in strings and minus signs in numbers.
Wherever appropriate, units can be specified. The units are used to convert the values given to
the units used in the Measurement Set. For ranges, the unit is specified only once (at the end) and
applies to both the range boundaries.
2.6.1.1
String Matching
String matching can be done in three ways. Any component of a comma separated list that cannot
be parsed as a number, a number range, or a physical quantity is treated as a regular expression
or a literal string. If the string does not contain the characters ’*’, ’{’, ’}’ or ’?’, it is treated
as a literal string and used for exact matching. If any of the above mentioned characters are part
of the string, they are used as a regular expression. As a result, for most cases, the user does not
need to supply any special delimiters for literal strings and/or regular expressions. For example:
field = ’3’
# match field ID 3 and not select field named "3C286".
field = ’3*’
#
#
#
#
#
field = ’30*’
# will match only with "3020+2207" in above set.
used as a pattern and matched against field names. If
names like "3C84", "3C286", "3020+2207" are found,
all will match. Field ID 3 will not be selected
(unless of course one of the above mentioned field
names also correspond to field ID 3!).
However if it is required that the string be matched exclusively as a regular expression, it can be
supplied within a pair of ’/’ as delimiters (e.g. ’/.+BAND.+/’). A string enclosed within double
quotes (’"’) is used exclusively for pattern matching (patterns are a simplified form of regular
expressions - used in most UNIX commands for string matching). Patterns are internally converted
to equivalent regular expressions before matching. See the Unix command "info regex", or visit
http://www.regular-expressions.info, for details of regular expressions and patterns.
Strings can include any character except the following:
CHAPTER 2. VISIBILITY DATA IMPORT, EXPORT, AND SELECTION
’,’
’;’
’"’
’/’
93
NEWLINE
(since these are part of the selection syntax). Strings that do not contain any of the characters
used to construct regular expressions or patterns are used for exact matches. Although it is highly
discouraged to have name in the MS containing the above mentioned reserved characters, if one
does choose to include the reserved characters as parts of names etc., those names can only be
matched against quoted strings (since regular expression and patterns are a super-set of literal
strings – i.e., a literal string is also a valid regular expression).
This leaves ’"’, ’*’, ’{’, ’}’ or ’?’ as the list of printable character that cannot be part of a
name (i.e., a name containing this character can never be matched in a MSSelection expression).
These will be treated as pattern-matching even inside double double quotes (’" "’). There is
currently no escape mechanism (e.g. via a backslash).
Some examples of strings, regular expressions, and patterns:
• The string ’LBAND’ will be used as a literal string for exact match. It will match only the
exact string LBAND.
• The wildcarded string ’*BAND*’ will be used as a string pattern for matching. This will
match any string which has the sub-string BAND in it.
• The string ’"*BAND*"’ will also be used as a string pattern, matching any string which has
the sub-string BAND in it.
• The string ’/.+BAND.+/’ will be used as a regular expression. This will also match any string
which as the sub-string BAND in it. (the .+ regex operator has the same meaning as the *
wildcard operator of patterns).
2.6.2
The field Parameter
The field parameter is a string that specifies which field names or ids will be processed in the
task or tool. The field selection expression consists of comma separated list of field specifications
inside the string.
Field specifications can be literal field names, regular expressions or patterns (see § 2.6.1.1). Those
fields for which the entry in the NAME column of the FIELD MS sub-table match the literal field
name/regular expression/pattern are selected. If a field name/regular expression/pattern fails to
match any field name, the given name/regular expression/pattern are matched against the field
code. If still no field is selected, an exception is thrown.
Field specifications can also be given by their integer IDs. IDs can be a single or a range of IDs.
Field ID selection can also be done as a boolean expression. For a field specification of the form
’>ID’, all field IDs greater than ID are selected. Similarly for ’<ID’ all field IDs less than the ID
are selected.
For example, if the MS has the following observations:
CHAPTER 2. VISIBILITY DATA IMPORT, EXPORT, AND SELECTION
94
MS summary:
==========
FIELDID
SPWID
NChan
Pol
NRows
Source Name
--------------------------------------------------------------0
0
127
RR
10260
0530+135
1
0
127
RR
779139
05582+16320
2
0
127
RR
296190
05309+13319
3
0
127
RR
58266
0319+415
4
0
127
RR
32994
1331+305
5
1
1
RR,RL,LL,RR
23166
KTIP
one might select
field = ’0~2,KTIP’
field = ’0530+135’
field = ’05*’
2.6.3
# FIELDID 0,1,2 and field name KTIP
# field 0530+135
# fields 0530+135,05582+16320,05309+13319
The spw Parameter
The spw parameter is a string that indicates the specific spectral windows and the channels within
them to be used in subsequent processing. Spectral window selection (’SPWSEL’) can be given as
a spectral window integer ID, a list of integer IDs, a spectral window name specified as a literal
string (for exact match) or a regular expression or pattern.
The specification can be via frequency ranges or by indexes. A range of frequencies are used to
select all spectral windows which contain channels within the given range. Frequencies can be
specified with an optional unit — the default unit being Hz. Other common choices for radio and
mm/sub-mm data are kHz, MHz, and GHz. You will get the entire spectral windows, not just the
channels in the specified range. You will need to do channel selection (see below) to do that.
The spw can also be selected via comparison for integer IDs. For example, ’>ID’ will select all
spectral windows with ID greater than the specified value, while ’<ID’ will select those with ID
lesser than the specified value.
BETA ALERT: In the current Beta Release, ’<ID’ and ’>ID’ are inclusive with the ID specified
included in the selection, e.g. spw=’<2’ is equivalent to spw=’0,1,2’ and not spw=’0,1’ as was
intended. This will be fixed in an upcoming release.
Spectral window selection using strings follows the standard rules:
spw
spw
spw
spw
spw
spw
spw
=
=
=
=
=
=
=
’1’
’1,3,5’
’0~3’
’0~3,5’
’<3,5’
’*’
’1412~1415MHz’
#
#
#
#
#
#
#
SPWID 1
SPWID 1,3,5
SPWID 0,1,2,3
SPWID 0,1,2,3 and 5
SPWID 0,1,2,3 and 5
All spectral windows
Spectral windows containing 1412-1415MHz
In some cases, the spectral windows may allow specification by name. For example,
CHAPTER 2. VISIBILITY DATA IMPORT, EXPORT, AND SELECTION
spw = ’3mmUSB, 3mmLSB’
95
# choose by names (if available)
might be meaningful for the dataset in question.
Note that the order in which multiple spws are given may be important for other parameters. For
example, the mode = ’channel’ in clean uses the first spw as the origin for the channelization of
the resulting image cube.
2.6.3.1
Channel selection in the spw parameter
Channel selection can be included in the spw string in the
form ’SPWSEL:CHANSEL’ where CHANSEL is the channel selector. In the end, the spectral selection within a given
spectral window comes down to the selection of specific
channels. We provide a number of shorthand selection options for this. These CHANSEL options include:
Beta Alert!
Not all options are available yet, such
as percentages or velocities. Stay
tuned!
• Channel ranges: ’START~STOP’
• Frequency ranges: ’FSTART~FSTOP’
• Velocity ranges: ’VSTART~VSTOP’ (not yet available)
• Bandwidth percentages: ’PSTART~PSTOP’ or ’PWIDTH’ (not yet available)
• Channel striding/stepping: ’START~STOP^STEP’ or ’FSTART~FSTOP^FSTEP’
The most common selection is via channel ranges ’START~STOP’ or frequency ranges ’FSTART~FSTOP’:
spw = ’0:13~53’
spw = ’0:1413~1414MHz’
# spw 0, channels 13-53, inclusive
# spw 0, 1413-1414MHz section only
All ranges are inclusive, with the channel given by, or containing the frequency or velocity given
by, START and STOP plus all channels between included in the selection. You can also select the
spectral window via frequency ranges ’FSTART~FSTOP’, as described above:
spw = ’1413~1414MHz:1413~1414MHz’
spw = ’*:1413~1414MHz’
# channels falling within 1413~1414MHz
# does the same thing
You can also specify multiple spectral window or channel ranges, e.g.
spw
spw
spw
spw
=
=
=
=
’2:16, 3:32~34’
’2:1~3;57~63’
’1~3:10~20’
’*:4~56’
#
#
#
#
spw
spw
spw
all
2, channel 16 plus spw 3 channels 32-34
2, channels 1-3 and 57-63
1-3, channels 10-20
spw, channels 4-56
CHAPTER 2. VISIBILITY DATA IMPORT, EXPORT, AND SELECTION
96
Note the use of the wildcard in the last example.
A step can be also be included using ’^STEP’ as a postfix:
spw = ’0:10~100^2’
spw = ’:^4’
spw = ’:100~150GHz^10GHz’
# chans 10,12,14,...,100 of spw 0
# chans 0,4,8,... of all spw
# closest chans to 100,110,...,150GHz
A step in frequency or velocity will pick the channel in which that frequency or velocity falls, or
the nearest channel.
2.6.4
The selectdata Parameters
The selectdata parameter, if set to True, will expand the inputs to include a number of subparameters, given below and in the individual task descriptions (if different). If selectdata =
False, then the sub-parameters are treated as blank for selection by the task. The default for
selectdata is False.
The common selectdata expanded sub-parameters are:
2.6.4.1
The antenna Parameter
The antenna selection string is a semi-colon (’;’) separated list of baseline specifications. A
baseline specification is of the form:
• ’ANT1’ — Select all baselines including the antenna(s) specified by the selector ANT1.
• ’ANT1&’ — Select only baselines between the antennas specified by the selector ANT1.
• ’ANT1&ANT2’ — Select only the cross-correlation baselines between the antennas specified by
selector ANT1 and antennas specified by selector ANT2. Thus ’ANT1&’ is an abbreviation for
’ANT1&ANT1’.
• ’ANT1&&ANT2’ — Select only auto-correlation and cross-correlation baselines between antennas specified by the selectors ANT1 and ANT2. Note that this is what the default antenna=’’
gives you.
• ’ANT1&&&’ — Select only autocorrelations specified by the selector ANT1.
The selectors ANT1 and ANT2 are comma-separated lists of antenna integer-IDs or literal antenna
names, patterns, or regular expressions. The ANT strings are parsed and converted to a list of
antenna integer-IDs or IDs of antennas whose name match the given names/pattern/regular expression. Baselines corresponding to all combinations of the elements in lists on either side of
ampersand are selected.
CHAPTER 2. VISIBILITY DATA IMPORT, EXPORT, AND SELECTION
97
Integer IDs can be specified as single values or a range of integers. When items of the list are parsed
as literal strings or regular expressions or patterns (see § 2.6.1 for more details on strings). All
antenna names that match the given string (exact match)/regular expression/pattern are selected.
The comma is used only as a separator for the list of antenna specifications. The list of baselines
specifications is a semi-colon separated list, e.g.
antenna = ’1~3 & 4~6 ; 10&11’
will select baselines between antennas 1,2,3 and 4,5,6 (’1&4’, ’1&5’, . . . , ’3&6’) plus baseline
’10&11’.
The wildcard operator (’*’) will be the most often used pattern. To make it easy to use, the
wildcard (and only this operator) can be used without enclosing it in quotes. For example, the
selection
antenna = ’VA*’
will match all antenna names which have ’VA’ as the first 2 characters in the name (irrespective
of what follows after these characters).
Some examples:
antenna=’’
antenna=’*&*’
antenna=’*&&*’
antenna=’*&&&’
#
#
#
#
shows blank autocorr pages
does not show the autocorrs
show both auto and cross-cor (default)
shows only autocorrs
antenna=’5&*’
# shows non-auto baselines with AN 5
antenna=’5,6&&&’
antenna=’5&&&;6&*’
# AN 5 and 6 autocor
# AN 5 autocor plus cross-cors to AN 6
Antenna numbers as names: Needless to say, naming antennas such that the names can also be
parsed as a valid token of the syntax is a bad idea. Nevertheless, antenna names that contain any
of the reserved characters and/or can be parsed as integers or integer ranges can still be used by
enclosing the antenna names in double quotes (’ "ANT" ’). E.g. the string
antenna = ’10~15,21,VA22’
will expand into an antenna ID list 10,11,12,13,14,15,21,22 (assuming the index of the antenna
named ’VA22’ is 22). If the antenna with ID index 50 is named ’21’, the string
antenna = ’10~15,"21",VA22’
will expand into an antenna ID list of 10,11,12,13,14,15,50,22.
Read elsewhere (e.g. info regex under Unix) for details of regular expression and patterns.
CHAPTER 2. VISIBILITY DATA IMPORT, EXPORT, AND SELECTION
2.6.4.2
98
The scan Parameter
The scan parameter selects the scan ID numbers of the data. There is currently no naming
convention for scans. The scan ID is filled into the MS depending on how the data was obtained,
so use this with care.
Examples:
scan
scan
scan
scan
=
=
=
=
’3’
’1~8’
’1,2,4,6’
’<9’
#
#
#
#
scan number 3.
scan numbers 1 through 8, inclusive
scans 1,2,4,6
scans <9 (1-8)
NOTE: ALMA and VLA/EVLA number scans starting with 1 and not 0. You can see what the
numbering is in your MS using the listobs task with verbose=True (see § 2.3).
2.6.4.3
The timerange Parameter
The time strings in the following (T0, T1 and dT) can be specified as YYYY/MM/DD/HH:MM:SS.FF.
The time fields (i.e., YYYY, MM, DD, HH, MM, SS and FF), starting from left to right, may be omitted
and they will be replaced by context sensitive defaults as explained below.
Some examples:
1. timerange=’T0~T1’: Select all time stamps from T0 to T1. For example:
timerange = ’2007/10/09/00:40:00 ~ 2007/10/09/03:30:00’
Note that fields missing in T0 are replaced by the fields in the time stamp of the first valid
row in the MS. For example,
timerange = ’09/00:40:00 ~ 09/03:30:00’
where the YY/MM/ part of the selection has been defaulted to the start of the MS.
Fields missing in T1, such as the date part of the string, are replaced by the corresponding
fields of T0 (after its defaults are set). For example:
timerange = ’2007/10/09/22:40:00 ~ 03:30:00’
does the same thing as above.
2. timerange=’T0’: Select all time stamps that are within an integration time of T0. For
example,
timerange = ’2007/10/09/23:41:00’
Integration time is determined from the first valid row (more rigorously, an average integration
time should be computed). Default settings for the missing fields of T0 are as in (1).
CHAPTER 2. VISIBILITY DATA IMPORT, EXPORT, AND SELECTION
99
3. timerange=’T0+dT’: Select all time stamps starting from T0 and ending with time stamp
T0+dT. For example,
timerange = ’23:41:00+01:00:00’
picks an hour-long chunk of time.
Defaults of T0 are set as usual. Defaults for dT are set from the time corresponding to MJD=0.
Thus, dT is a specification of length of time from the assumed nominal ”start of time”.
4. timerange=’>T0’: Select all times greater than T0. For example,
timerange = ’>2007/10/09/23:41:00’
Default settings for T0 are as above.
5. timerange=’<T1’: Select all times less than T1. For example,
timerange = ’<2007/10/09/23:41:00’
Default settings for T1 are as above.
An ultra-conservative selection might be:
timerange = ’1960/01/01/00:00:00~2020/12/31/23:59:59’
which would choose all possible data!
2.6.4.4
The uvrange Parameter
Rows in the MS can also be selected based on the uv-distance or physical baseline length that the
visibilities in each row correspond to. This uvrange can be specified in various formats.
The basic building block of uv-distance specification is a valid number with optional units in the
format N[UNIT] (the unit in square brackets is optional). We refer to this basic building block
as UVDIST. The default unit is meter. Units of length (such as ’m’ and ’km’) select physical
baseline distances (independent of wavelength). The other allowed units are in wavelengths (such
as ’lambda’, ’klambda’ and ’Mlambda’ and are true uv-plane radii
ruv =
p
u2 + v 2 .
(2.1)
If only a single UVDIST is specified, all rows, the uv-distance of which exactly matches the given
UVDIST, are selected.
UVDIST can be specified as a range in the format ’N0~N1[UNIT]’ (where N0 and N1 are valid
numbers). All rows corresponding to uv-distance between N0 and N1 (inclusive) when converted
the specified units are selected.
CHAPTER 2. VISIBILITY DATA IMPORT, EXPORT, AND SELECTION
100
UVDIST can also be selected via comparison operators. When specified in the format ’>UVDIST’, all
visibilities with uv-distances greater than the given UVDIST are selected. Likewise, when specified
in the format ’<UVDIST’, all rows with uv-distances less than the given UVDIST are selected.
Any number of above mentioned uv-distance specifications can be given as a comma-separated list.
Examples:
uvrange
uvrange
uvrange
uvrange
uvrange
uvrange
2.6.4.5
=
=
=
=
=
=
’100~200km’
’24~35Mlambda, 40~45Mlambda’
’< 45klambda’
’> 0lambda’
’100km’
’100klambda’
#
#
#
#
#
#
an annulus in physical baseline length
two annuli in units of mega-wavelengths
less than 45 kilolambda
greater than zero length (no auto-corrs)
baselines of length 100km
uv-radius 100 kilolambda
The msselect Parameter
More complicated selections within the MS structure are possible using the Table Query Language
(TaQL). This is accessed through the msselect parameter.
Note that the TaQL syntax does not follow the rules given in § 2.6.1 for our other selection strings.
TaQL is explained in more detail in Aips++ NOTE 199 — Table Query Language (http:
//aips2.nrao.edu/docs/notes/199/199.html). This will eventually become a CASA document.
The specific columns of the MS are given in the most recent MS specification document: Aips++
NOTE 229 — MeasurementSet definition version 2.0 (http://aips2.nrao.edu/docs/
notes/229/229.html). This documentation will eventually be updated to the CASA document
system.
Most selection can be carried out using the other selection parameters. However, these are merely
shortcuts to the underlying TaQL selection. For example, field and spectral window selection can
be done using msselect rather than through field or spw:
msselect=’FIELD_ID ==
msselect=’FIELD_ID <=
msselect=’FIELD_ID IN
msselect=’FIELD_ID==0
0’
1’
[1,2]’
&& DATA_DESC_ID==3’
#
#
#
#
Field
Field
Field
Field
id
id
id
id
0
0
1
0
only
and 1
and 2
in spw id 3 only
BETA ALERT: The msselect style parameters will be phased out of the tasks. TaQL selection
will still be available in the Toolkit.
Chapter 3
Data Examination and Editing
3.1
Plotting and Flagging Visibility Data in CASA
The tasks available for plotting and flagging of data are:
• flagmanager — manage versions of data flags (§ 3.2)
• flagautocorr — non-interactive flagging of auto-correlations (§ 3.3)
• plotxy — create X-Y plots of data in MS, flag data (§ 3.4)
• flagdata — non-interactive flagging of data (§ 3.5)
• browsetable — browse data in any CASA table (including a MS) (§ 3.6)
• plotants — create simple plots of antenna positions (§ 3.7)
• casaplotms — prototype next-generation X-Y MS plotter (experimental) (§ 3.8)
The following sections describe the use of these tasks.
Information on other related operations can be found in:
• listobs — list what’s in a MS (§ 2.3)
• selectdata — general data selection syntax (§ 2.6)
• viewer — use the casaviewer to display the MS as a raster image, and flag it (§ 7)
101
CHAPTER 3. DATA EXAMINATION AND EDITING
3.2
102
Managing flag versions with flagmanager
The flagmanager task will allow you to manage different versions of flags in your data. These are
stored inside a CASA flagversions table, under the name of the MS <msname>.flagversions. For
example, for the MS jupiter6cm.usecase.ms, there will need to be jupiter6cm.usecase.ms.flagversions
on disk. This is created on import (by importvla or importuvfits) or when flagging is first done
on an MS without a .flagversions (e.g. with plotxy).
By default, when the .flagversions is created, this directory will contain a flags.Original in
it containing a copy of the original flags in the MAIN table of the MS so that you have a backup.
It will also contain a file called FLAG VERSION LIST that has the information on the various flag
versions there.
The inputs for flagmanager are:
vis
mode
=
=
’’
’list’
#
#
Name of input visibility file (MS)
Flag management operation (list,save,restore,delete)
The mode=’list’ option will list the available flagversions from the <msname>.flagversions file.
For example:
CASA
CASA
CASA
CASA
MS :
<102>: default(’flagmanager’)
<103>: vis = ’jupiter6cm.usecase.ms’
<104>: mode = ’list’
<105>: flagmanager()
/home/imager-b/smyers/Oct07/jupiter6cm.usecase.ms
main : working copy in main table
Original : Original flags at import into CASA
flagautocorr : flagged autocorr
xyflags : Plotxy flags
The mode parameter expands the options. For example, if you wish to save the current flagging
state of vis=<msname>,
mode
versionname
comment
merge
=
=
=
=
’save’
’’
’’
’replace’
#
#
#
#
Flag management operation (list,save,restore,delete)
Name of flag version (no spaces)
Short description of flag version
Merge option (replace, and, or)
with the output version name specified by versionname. For example, the above xyflags version
was written using:
default(’flagmanager’)
vis = ’jupiter6cm.usecase.ms’
mode = ’save’
versionname = ’xyflags’
comment = ’Plotxy flags’
flagmanager()
CHAPTER 3. DATA EXAMINATION AND EDITING
103
and you can see that there is now a sub-table in the flagversions directory
CASA <106>: ls jupiter6cm.usecase.ms.flagversions/
IPython system call: ls -F jupiter6cm.usecase.ms.flagversions/
flags.flagautocorr flags.Original flags.xyflags FLAG_VERSION_LIST
It is recommended that you use this facility regularly to save versions during flagging.
You can restore a previously saved set of flags using the mode=’restore’ option:
mode
versionname
merge
=
=
=
’restore’
’’
’replace’
#
#
#
Flag management operation (list,save,restore,delete)
Name of flag version (no spaces)
Merge option (replace, and, or)
The merge sub-parameter will control the action. For merge=’replace’, the flags in versionname
will replace those in the MAIN table of the MS. For merge=’and’, only data that is flagged in
BOTH the current MAIN table and in versionname will be flagged. For merge=’or’, data flagged
in EITHER the MAIN or in versionname will be flagged.
The mode=’delete’ option can be used to remove versionname from the flagversions:
mode
versionname
3.3
=
=
’delete’
’’
#
#
Flag management operation (list,save,restore,delete)
Name of flag version (no spaces)
Flagging auto-correlations with flagautocorr
The flagautocorr task can be used if all you want to do is to flag the auto-correlations out of the
MS. Nominally, this can be done upon filling from the VLA for example, but you may be working
from a dataset that still has them.
This task has a single input, the MS file name:
vis
=
’’
#
Name of input visibility file (MS)
To use it, just set and go:
CASA <90>: vis = ’jupiter6cm.usecase.ms’
CASA <91>: flagautocorr()
Note that the auto-correlations can also be flagged using flagdata (§ 3.5) but the flagautocorr
task is an handy shortcut for this common operation.
3.4
X-Y Plotting and Editing of the Data
BETA ALERT: The plotxy code is fragile and slow, and is being replaced by the casaplotms
tool (§ 3.8). A prototype version of that application is available in Version 2.4.0.
CHAPTER 3. DATA EXAMINATION AND EDITING
The principal way to get X-Y plots of visibility data is using
the plotxy task. This task also provides editing capability.
CASA uses the matplotlib plotting library to display its
plots. You can find information on matplotlib at http:
//matplotlib.sourceforge.net/.
104
Inside the Toolkit:
Access to matplotlib is also provided through the pl tool. See below for a description of the pl tool
functions.
Figure 3.1: The plotxy plotter, showing the Jupiter data versus uv-distance. You can see bad
data in this plot. The bottom set of buttons on the lower left are: 1,2,3) Home, Back, and
Forward. Click to navigate between previously defined views (akin to web navigation). 4) Pan.
Click and drag to pan to a new position. 5) Zoom. Click to define a rectangular region for zooming.
6) Subplot Configuration. Click to configure the parameters of the subplot and spaces for the
figures. 7) Save. Click to launch a file save dialog box. The upper set of buttons in the lower
left are: 1) Mark Region. Press this to begin marking regions (rather than zooming or panning).
2,3,4) Flag, Unflag, Locate. Click on these to flag, unflag, or list the data within the marked
regions. 5) Next. Click to move to the next in a series of iterated plots. Finally, the cursor
readout is on the bottom right.
CHAPTER 3. DATA EXAMINATION AND EDITING
105
To bring up this plotter use the plotxy task. The inputs
are:
#
plotxy :: X-Y plotter/interactive flagger for visibility data
vis
xaxis
yaxis
datacolumn
=
=
=
=
’’
’time’
’amp’
’data’
#
#
#
#
Name of input visibility
X-axis: def = ’time’: see help for options
Y-axis: def = ’amp’: see help for options
data (raw), corrected, model, residual (corrected - model)
selectdata
spw
field
averagemode
timebin
crossscans
crossbls
crossarrays
stackspw
width
=
=
=
=
=
=
=
=
=
=
False
’’
’’
’vector’
’0’
False
False
False
False
’1’
#
#
#
#
#
#
#
#
#
#
Other data selection parameters
spectral window:channels: ’’==>all, spw=’1:5~57’
field names or index of calibrators: ’’==>all
Select averaging type: vector, scalar
Length of time-interval in seconds to average
Have time averaging cross scan boundaries?
have averaging cross over baselines?
have averaging cross over arrays?
stack multiple spw on top of each other?
Number of channels to average
restfreq
extendflag
subplot
plotsymbol
plotcolor
plotrange
multicolor
selectplot
overplot
showflags
interactive
figfile
async
=
’’
=
False
=
111
=
’.’
= ’darkcyn’
= [-1, -1, -1,
=
’corr’
=
False
=
False
=
False
=
True
=
’’
=
False
# a frequency quanta or transition name. see help for options
# Have flagging extend to other data points?
# Panel number on display screen (yxn)
# Options include . : , o ^ v > < s + x D d 2 3 4 h H | _
# Plot color
-1] # The range of data to be plotted (see help)
# Plot in different colors: Options: none, both, chan, corr
# Select additional plotting options (e.g, fontsize, title,etc)
# Overplot on current plot (if possible)
# Show flagged data?
# Show plot on gui?
# ’’= no plot hardcopy, otherwise supply name
# If true the taskname must be started using plotxy(...)
BETA ALERT: The plotxy task expects all of the scratch columns to be present in the MS, even
if it is not asked to plot the contents. If you get an error to the effect "Invalid Table operation:
Table: cannot add a column" then use clearcal() to force these columns to be made in the
MS. Note that this will clear anything in all scratch columns (in case some were actually there and
being used).
Setting selectdata=True opens up the selection sub-parameters:
selectdata
antenna
timerange
correlation
scan
feed
array
uvrange
=
=
=
=
=
=
=
=
True
’’
’’
’’
’’
’’
’’
’’
#
#
#
#
#
#
#
#
Other data selection parameters
antenna/baselines: ’’==>all, antenna = ’3,VA04’
time range: ’’==>all
correlations: default = ’’
scan numbers: Not yet implemented
multi-feed numbers: Not yet implemented
array numbers: Not yet implemented
uv range’’==>all; uvrange = ’0~100kl’ (default unit=meters)
CHAPTER 3. DATA EXAMINATION AND EDITING
106
These are described in § 2.6.
Averaging is controlled with the set of parameters
averagemode
timebin
crossscans
crossbls
crossarrays
stackspw
width
=
=
=
=
=
=
=
’vector’
’0’
False
False
False
False
’1’
#
#
#
#
#
#
#
Select averaging type: vector, scalar
Length of time-interval in seconds to average
Have time averaging cross scan boundaries?
have averaging cross over baselines?
have averaging cross over arrays?
stack multiple spw on top of each other?
Number of channels to average
Note that the timebin, crossscans, and width sub-parameters are always open and available
whether averagemode=’vector’ or ’scalar’. See § 3.4.4 below for more on averaging.
You can extend the flagging beyond the data cell plotted:
extendflag
extendcorr
extendchan
extendspw
extendant
extendtime
=
=
=
=
=
=
True
’’
’’
’’
’’
’’
#
#
#
#
#
#
Have flagging extend to other data points?
flagging correlation extension type
flagging channel extension type
flagging spectral window extension type
flagging antenna extension type
flagging time extension type
See § 3.4.6 below for more on flag extension.
The restfreq parameter can be set to a transition or frequency:
restfreq
frame
doppler
=
’HI’
= ’LSRK’
= ’RADIO’
#
#
#
a frequency quanta or transition name. see help for options
frequency frame for spectral axis. see help for options
doppler mode. see help for options
See § 3.4.7 below for more on setting rest frequencies and frames.
Setting selectplot=True will open up a set of plotting control sub-parameters. These are described
in § 3.4.2 below.
The interactive and figfile parameters allow non-interactive production of hardcopy plots. See
§ 3.4.8 for more details on saving plots to disk.
The iteration, overplot, plotrange, plotsymbol, showflags and subplot parameters deserve
extra explanation, and are described in § 3.4.3 below.
For example:
plotxy(vis=’jupiter6cm.ms’,
xaxis=’uvdist’,
yaxis=’amp’,
field=’JUPITER’,
selectdata=True,
correlation=’RR,LL’,
selectplot=True,
title = ’Jupiter 6cm uncalibrated’)
#
#
#
#
#
#
#
#
jupiter 6cm dataset
plot uv-distance on x-axis
plot amplitude on y-axis
plot only JUPITER
open data selection
plot RR and LL correlations
open plot controls
give it a title
CHAPTER 3. DATA EXAMINATION AND EDITING
107
The plotter resulting from these settings is shown in figure 3.1.
BETA ALERT: The plotxy task still has a number of issues. The averaging has been greatly
speeded up in this release, but there are cases where the plots will be made incorrectly. In particular,
there are problems plotting multiple spw at the same time. There are sometimes also cases where
data that you have flagged in plotxy from averaged data is done so incorrectly. This task is under
active developement for the next cycle to fix these remaining problems, so users should be aware
of this.
BETA ALERT: Another know problem with (plotxy) is that it fails if the path to your working
directory contains spaces in its name, e.g. /users/smyers/MyTest/ is fine, but /users/smyers/My
Test/ is not!
3.4.1
GUI Plot Control
You can use the various buttons on the plotxy GUI to control its operation – in particular, to
determine flagging and unflagging behaviors.
There is a standard row of buttons at the bottom. These include (left to right):
• Home — The “house” button (1st on left) returns to the original zoom level.
• Step — The left and right arrow buttons (2nd and 3rd from left) step through the zoom
settings you’ve visited.
• Pan — The “four-arrow button” (4th from left) lets you pan in zoomed plot.
• Zoom — The most useful is the “magnifying glass” (5th from the left) which lets you draw
a box and zoom in on the plot.
• Panels — The “window-thingy” button (second from right) brings up a menu to adjust the
panel placement in the plot.
• Save – The “disk” button (last on right) saves a .png copy of the plot to a generically named
file on disk.
In a row above these, there are a set of other buttons (left to right):
• Mark Region — If depressed lets you draw rectangles to mark points in the panels. This
is done by left-clicking and dragging the mouse. You can Mark multiple boxes before doing
something. Clicking the button again will un-depress it and forget the regions. ESC will
remove the last region marked.
• Flag — Click this to Flag the points in a marked region.
• Unflag — Click this to Unflag any flagged point that would be in that region (even if
invisible).
CHAPTER 3. DATA EXAMINATION AND EDITING
108
• Locate — Print out some information to the logger on points in the marked regions.
• Next — Step to the next plot in an iteration.
• Quit — Exit plotcal, clear the window and detach from the MS.
These buttons are shared with the plotcal tool.
3.4.2
The selectplot Parameters
These parameters work in concert with the native matplotlib functionality to enable flexible representations of data displays.
Setting selectplot=True will open up a set of plotting control sub-parameters:
selectplot
markersize
linewidth
skipnrows
newplot
clearpanel
title
xlabels
ylabels
fontsize
windowsize
=
=
=
=
=
=
=
=
=
=
=
True
5.0
1.0
1
False
’Auto’
’’
’’
’’
10.0
5.0
#
#
#
#
#
#
#
#
#
#
#
Select additional plotting options (e.g, fontsize, title,etc)
Size of plotted marks
Width of plotted lines
Plot every nth point
Replace the last plot or not when overplotting
Specify if old plots are cleared or not
Plot title (above plot)
Label for x-axis
Label for y-axis
Font size for labels
Window size: not yet implemented
The markersize parameter will change the size of the plot
symbols. Increasing it will help legibility when doing screen
shots. Decreasing it can help in congested plots. The
linewidth parameter will do similar things to the lines.
Inside the Toolkit:
For even more functionality, you can
access the pl tool directly using Pylab functions that allow one to annotate, alter, or add to any plot
displayed in the matplotlib plotter
(e.g. plotxy).
The skipnrows parameter, if set to an integer n greater
than 1, will allow only every nth point to be plotted. It does
this, as the name suggests, by skipping over whole rows of
the MS, so beware (channels are all within the same row for
a given spw). Be careful flagging on data where you have
skipped points! Note that you can also reduce the number
of points plotted via averaging (§ 3.4.4) or channel striding in the spw specification (§ 2.6.3).
The newplot toggle lets you choose whether or not the last layer plotted is replaced when overplot=True,
or whether a new layer is added.
The clearpanel parameter turns on/off the clearing of plot panels that lie under the current
panel layer being plotted. The options are: ’none’ (clear nothing), ’auto’ (automatically clear
the plotting area), ’current’ (clear the current plot area only), and ’all’ (clear the whole plot
panel).
The title, xlabels, and ylabels parameters can be used to change the plot title and axes labels.
CHAPTER 3. DATA EXAMINATION AND EDITING
109
The fontsize parameter is useful in order to enlarge the label fonts so as to be visible when making
plots for screen capture, or just to improve legibility. Shrinking can help if you have lots of panels
on the plot also.
The windowsize parameter is supposed to allow adjustments on the window size. BETA ALERT:
This currently does nothing, unless you set it below 1.0, in which case it will produce an error.
3.4.3
Plot Control Parameters
The iteration, overplot, plotrange, plotsymbol, showflags and subplot parameters deserve
extra explanation:
3.4.3.1
iteration
There are currently four iteration options available: ’field’, ’antenna’, and ’baseline’. If
one of these options is chosen, the data will be split into separate plot displays for each value of
the iteration axis (e.g., for the VLA, the ’antenna’ option will get you 27 displays, one for each
antenna).
BETA ALERT: There will eventually be ’scan’ and ’feed’ options also.
An example use of iteration:
# choose channel averaging, every 5 channels
plotxy(’n5921.ms’,’channel’,subplot=221,iteration=’antenna’,width=’5’)
The results of this are shown in Figure 3.2. Note that this example combines the use of width,
iteration and subplot.
NOTE: If you use iteration=’antenna’ or ’baseline’, be aware if you have set antenna selection. You can also control whether you see auto-correlations or not using the appropriate syntax,
e.g. antenna=’*&&*’ or antenna=’*&&&’ (§ 2.6.4.1).
3.4.3.2
overplot
The overplot parameter toggles whether the current plot will be overlaid on the previous plot or
subpanel (via the subplot setting, § section:edit.plot.opt.subplot) or will overwrite it. The default
is False and the new plot will replace the old.
The overplot parameter interacts with the newplot sub-parameter (see § 3.4.2).
See § 3.4.3.5 for an example using overplot.
CHAPTER 3. DATA EXAMINATION AND EDITING
110
Figure 3.2: The plotxy iteration plot. The first set of plots from the example in § 3.4.3.1 with
iteration=’antenna’. Each time you press the Next button, you get the next series of plots.
3.4.3.3
plotrange
The plotrange parameter can be used to specify the size of the plot. The format is [xmin, xmax,
ymin, ymax]. The units are those on the plot. For example,
plotrange = [-20,100,15,30]
Note that if xmin=xmax and/or ymin=ymax, then the values will be ignored and a best guess will
be made to auto-range that axis. BETA ALERT: Unfortunately, the units for the time axis must be
in Julian Days, which are the plotted values.
CHAPTER 3. DATA EXAMINATION AND EDITING
3.4.3.4
111
plotsymbol
The plotsymbol parameter defines both the line or symbol for the data being drawn as well as the
color; from the matplotlib online documentation (e.g., type pl.plot? for help):
The following line styles are supported:
: solid line
-: dashed line
-.
: dash-dot line
:
: dotted line
.
: points
,
: pixels
o
: circle symbols
^
: triangle up symbols
v
: triangle down symbols
<
: triangle left symbols
>
: triangle right symbols
s
: square symbols
+
: plus symbols
x
: cross symbols
D
: diamond symbols
d
: thin diamond symbols
1
: tripod down symbols
2
: tripod up symbols
3
: tripod left symbols
4
: tripod right symbols
h
: hexagon symbols
H
: rotated hexagon symbols
p
: pentagon symbols
|
: vertical line symbols
_
: horizontal line symbols
steps : use gnuplot style ’steps’ # kwarg only
The following color abbreviations are supported
b : blue
g : green
r : red
c : cyan
m : magenta
y : yellow
k : black
w : white
In addition, you can specify colors in many weird and
wonderful ways, including full names ’green’, hex strings
’#008000’, RGB or RGBA tuples (0,1,0,1) or grayscale
intensities as a string ’0.8’.
Line styles and colors are combined in a single format string, as in
’bo’ for blue circles.
CHAPTER 3. DATA EXAMINATION AND EDITING
3.4.3.5
112
showflags
The showflags parameter determines whether only unflagged data (showflags=False) or flagged
(showflags=True) data is plotted by this execution. The default is False and will show only
unflagged “good” data.
Note that if you want to plot both unflagged and flagged data, in different colors, then you need
to run plotxy twice using overplot (see § 3.4.3.2) the second time, e.g.
> plotxy(vis="myfile", xaxis=’uvdist’, yaxis=’amp’ )
> plotxy(vis="myfile", xaxis=’uvdist’, yaxis=’amp’, overplot=True, showflags=True )
3.4.3.6
subplot
The subplot parameter takes three numbers. The first is the number of y panels (stacking vertically), the second is the number of xpanels (stacking horizontally) and the third is the number
of the panel you want to draw into. For example, subplot=212 would draw into the lower of two
panels stacked vertically in the figure.
An example use of subplot capability is shown in Fig 3.3. These were drawn with the commands
(for the top, bottom left, and bottom right panels respectively):
plotxy(’n5921.ms’,’channel’,
field=’0’,
datacolumn=’corrected’,
plotcolor=’’,
plotsymbol=’go’,
subplot=211)
# plot channels for the n5921.ms data set
# plot only first field
# plot corrected data
# over-ride default plot color
# use green circles
# plot to the top of two panels
plotxy(’n5921.ms’,’x’,
field=’0’,
datacolumn=’corrected’,
subplot=223,
plotcolor=’’,
plotsymbol=’r.’)
# plot antennas for n5921.ms data set
# plot only first field
# plot corrected data
# plot to 3rd panel (lower left) in 2x2 grid
# over-ride default plot color
# red dots
plotxy(’n5921.ms’,’u’,’v’,
field=’0’,
datacolumn=’corrected’,
subplot=224,
plotcolor=’’,
plotsymbol=’b,’)
# plot uv-coverage for n5921.ms data set
# plot only first field
# plot corrected data
# plot to the lower right in a 2x2 grid
# over-ride default plot color
# blue, somewhat larger dots
# NOTE: You can change the gridding
# and panel size by manipulating
# the ny x nx grid.
See also § 3.4.3.1 above, and Figure 3.2 for an example of channel averaging using iteration and
subplot.
CHAPTER 3. DATA EXAMINATION AND EDITING
113
Figure 3.3:
Multi-panel display of visibility versus channel (top), antenna array
configuration (bottom left) and the resulting uv coverage (bottom right).
The
commands to make these three panels respectively are:
1) plotxy(’ngc5921.ms’,
xaxis=’channel’, datacolumn=’data’, field=’0’, subplot=211, plotcolor=’’,
plotsymbol=’go’)
2)
plotxy(’ngc5921.ms’, xaxis=’x’, field=’0’, subplot=223,
plotsymbol=’r.’),
3)
plotxy(’ngc5921.ms’, xaxis=’u’, yaxis=’v’, field=’0’,
subplot=224, plotsymbol=’b,’,figfile=’ngc5921 multiplot.png’).
3.4.4
Averaging in plotxy
The averaging parameters and sub-parameters are:
averagemode
timebin
crossscans
crossbls
= ’vector’ #
=
’0’ #
=
False #
=
False #
Select averaging type: vector, scalar
length of time in seconds to average, default=’0’, or: ’all’
have time averaging cross over scans?
have averaging cross over baselines?
CHAPTER 3. DATA EXAMINATION AND EDITING
crossarrays =
stackspw
=
width
=
False #
False #
’1’ #
114
have averaging cross over arrays?
stack multiple spw on top of each other?
number of channels to average, default: ’1’, or: ’all’, ’allspw’
The choice of averagemode controls how the amplitudes are calculated in the average. The default
mode is ’vector’, where the complex average is formed by averaging the real and imaginary parts
of the relevant visibilities. If ’scalar’ is chosen, then the amplitude of the average is formed by a
scalar average of the individual visibility amplitudes.
Time averaging is effected by setting the timebin parameter to a value larger than the integration
time. Currently, timebin takes a string containing the averaging time in seconds, e.g.
timebin = ’60.0’
to plot one-minute averages.
Channel averaging is invoked by setting width to a value greater than 1. Currently, the averaging
width is given as a number of channels.
By default, the averaging will not cross scan boundaries (as set in the import process). However,
if crossscans=True, then averaging will cross scans.
Note that data taken in different sub-arrays are never averaged together. Likewise, there is no way
to plot data averaged over field.
3.4.5
Interactive Flagging in plotxy
Interactive flagging, on the principle of “see it — flag it”, is
possible on the X-Y display of the data plotted by plotxy.
The user can use the cursor to mark one or more regions,
and then flag, unflag, or list the data that falls in these
zones of the display.
Hint!
In the plotting environments such as
plotxy, the ESC key can be used to
remove the last region box drawn.
There is a row of buttons below the plot in the window. You
can punch the Mark Region button (which will appear
to depress), then mark a region by left-clicking and dragging the mouse (each click and drag will
mark an additional region). You can get rid of all your regions by clicking again on the Mark
Region button (which will appear to un-depress), or you can use the ESC key to remove the last
box you drew. Once regions are marked, you can then click on one of the other buttons to take
action:
1. Flag — flag the points in the region(s),
2. Unflag — unflag flagged points in the region(s),
3. Locate — spew out a list of the points in the region(s) to the logger (Warning: this could
be a long list!).
CHAPTER 3. DATA EXAMINATION AND EDITING
115
Figure 3.4: Plot of amplitude versus uv distance, before (left) and after (right) flagging two marked
regions. The call was: plotxy(vis=’ngc5921.ms’,xaxis=’uvdist’, field=’1445*’).
Whenever you click on a button, that action occurs without forcing a disk-write (unlike previous
versions). If you quit plotxy and re-enter, you will see your previous edits.
A table with the name <msname>.flagversions (where vis=<msname>) will be created in the same
directory if it does not exist already.
It is recommended that you save important flagging stages using the flagmanager task (§ 3.2).
3.4.6
Flag extension in plotxy
Flag extension is controlled using extendflag=T and its sub-parameters:
extendflag
extendcorr
extendchan
extendspw
extendant
extendtime
=
=
=
=
=
=
True
’’
’’
’’
’’
’’
#
#
#
#
#
#
Have flagging extend to other data points?
flagging correlation extension type
flagging channel extension type
flagging spectral window extension type
flagging antenna extension type
flagging time extension type
The use of extendflag enables the user to plot a subset of the data and extend the flagging to a
wider set.
BETA ALERT: Using the extendflag options will greatly slow down the flagging in plotxy.
You will see a long delay after hitting the Flag button, with lots of logger messages as it goes
through each flag. Fixing this requires a refactoring of plotxy which is underway starting in Patch
4 development.
CHAPTER 3. DATA EXAMINATION AND EDITING
116
Setting extendchan=’all’ will extend the flagging to other channels in the same spw as the displayed point. For example, if spw=’0:0’ and channel 0 is displayed, then flagging will extend to
all channels in spw 0.
The extendcorr sub-parameter will extend the flagging beyond the correlations displayed. If
extendcorr=’all’, then all correlations will be flagged, e.g. with RR displayed RR,RL,LR,LL will
be flagged. If extendcorr=’half’, then the extension will be to those correlations in common with
that show, e.g. with RR displayed then RR,RL,LR will be flagged.
Setting extendspw=’all’ will extend the flagging to all other spw for the selection. Using the
same example as above, with spw=’0:0’ displayed, then channel 0 in ALL spw will be flagged.
Note that use of extendspw could result in unintended behavior if the spw have different numbers
of channels, or if it is used in conjunction with extendchan.
WARNING: use of the following options, particularly in conjunction with other flag extensions,
may lead to deletion of much more data than desired. Be careful!
Setting extendant=’all’ will extend the flagging to all baselines that have antennas in common
with those displayed and marked. For example, if antenna=’1&2’ is shown, then ALL baselines to
BOTH antennas 1 and 2 will be flagged. Currently, there is no option to extend the flag to ONLY
baselines to the first (or second) antenna in a displayed pair, so it is better to use flagdata to
remove specific antennas.
Setting extendtime=’all’ will extend the flagging to all times matching the other selection or
extension for the data in the marked region.
3.4.7
Setting rest frequencies in plotxy
The restfreq parameter can be set to a transition or frequency and expands to allow setting of
frame information. For example,
restfreq
frame
doppler
=
’HI’
= ’LSRK’
= ’RADIO’
#
#
#
a frequency quanta or transition name. see help for options
frequency frame for spectral axis. see help for options
doppler mode. see help for options
#
#
#
21cm HI frequency
21cm HI transition name
CO 1-0 line frequency
Examples of transitions include:
restfreq=’1420405751.786Hz’
restfreq=’HI’
restfreq=’115.2712GHz’
For a list of known lines in the CASA measures system, use the toolkit command me.linelist().
For example:
CASA <14>: me.linelist()
Out[14]: ’C109A CI CII166A DI H107A H110A H138B H166A H240A H272A H2CO HE110A HE138B HI OH1612 OH1665 O
CHAPTER 3. DATA EXAMINATION AND EDITING
117
BETA ALERT: The list of known lines in CASA is currently very restricted, and will be increased
in upcoming releases (to include lines in ALMA bands for example).
You can use the me.spectralline tool method to turn transition names into frequencies
CASA <16>: me.spectralline(’HI’)
Out[17]:
{’m0’: {’unit’: ’Hz’, ’value’: 1420405751.786},
’refer’: ’REST’,
’type’: ’frequency’}
(not necessary for this task, but possibly useful).
The frame sub-parameter sets the frequency frame. The allowed options can be listed using the
me.listcodes method on the me.frequency() method, e.g.
CASA <17>: me.listcodes(me.frequency())
Out[17]:
{’extra’: array([],
dtype=’|S1’),
’normal’: array([’REST’, ’LSRK’, ’LSRD’, ’BARY’, ’GEO’, ’TOPO’, ’GALACTO’, ’LGROUP’,
’CMB’],
dtype=’|S8’)}
The doppler sub-parameter likewise sets the Doppler system. The allowed codes can be listed
using the me.listcodes method on the me.doppler() method,
CASA <18>: me.listcodes(me.doppler())
Out[18]:
{’extra’: array([],
dtype=’|S1’),
’normal’: array([’RADIO’, ’Z’, ’RATIO’, ’BETA’, ’GAMMA’, ’OPTICAL’, ’TRUE’,
’RELATIVISTIC’],
dtype=’|S13’)}
For most cases the ’RADIO’’ Doppler system is appropriate, but be aware of differences.
For more information on frequency frames and spectral coordinate systems, see the paper by Greisen
et al. (A&A, 446, 747, 2006) 1 .
3.4.8
Printing from plotxy
There are two ways to get hardcopy plots in plotxy.
The first is to use the “disk save” icon from the interactive plot GUI to print the current plot. This
will bring up a sub-menu GUI that will allow you to choose the filename and format. The allowed
formats are .png (PNG), .eps (EPS), and svg (SVG). If you give the filename with a suffix (.png,
1
Also at http://www.aoc.nrao.edu/~egreisen/scs.ps
CHAPTER 3. DATA EXAMINATION AND EDITING
118
.eps, or svg) it will make a plot of that type. Otherwise it will put a suffix on depending on the
format chosen from the menu.
BETA ALERT: The plot files produced by the EPS option can be large, and the SVG files can
be very large. The PNG is the smallest.
The second is to specify a figfile. You probably want to disable the GUI using interactive=False
in this case. The type of plot file that is made will depend upon the filename suffix. The allowed
choices are .png (PNG), .eps (EPS), and svg (SVG).
This latter option is most useful from scripts. For example,
default(’plotxy’)
vis = ’ngc5921.ms’
field = ’2’
spw = ’’
xaxis = ’uvdist’
yaxis = ’amp’
interactive=False
figfile = ’ngc5921.uvplot.amp.png’
plotxy()
will plot amplitude versus uv-distance in PNG format. No plotxy GUI will appear.
BETA ALERT: if you use this option to print to figfile with an iteration set, you will only
get the first plot.
3.4.9
Exiting plotxy
You can use the Quit button to clear the plot from the window and detach from the MS. You can
also dismiss the window by killing it with the X on the frame, which will also detach the MS.
You can also just leave it alone. The plotter pretty much keeps running in the background even
when it looks like it’s done! You can keep doing stuff in the plotter window, which is where the
overplot parameter comes in. Note that the plotcal task (§ 4.5.1) will use the same window, and
can also overplot on the same panel.
If you leave plotxy running, beware of (for instance) deleting or writing over the MS without
stopping. It may work from a memory version of the MS or crash.
3.4.10
Example session using plotxy
The following is an example of interactive plotting and flagging using plotxy on the Jupiter 6cm
continuum VLA dataset. This is extracted from the script jupiter6cm usecase.py available in
the script area.
This assumes that the MS jupiter6cm.usecase.ms is on disk with flagautocorr already run.
BETA ALERT: Exact syntax may be slightly different in your version as the Beta Release
progress.
CHAPTER 3. DATA EXAMINATION AND EDITING
default(’plotxy’)
vis = ’jupiter6cm.usecase.ms’
# The fields we are interested in: 1331+305,JUPITER,0137+331
selectdata = True
# First we do the primary calibrator
field = ’1331+305’
# Plot only the RR and LL for now
correlation = ’RR LL’
# Plot amplitude vs. uvdist
xaxis = ’uvdist’
yaxis = ’amp’
multicolor = ’both’
# The easiest thing is to iterate over antennas
iteration = ’antenna’
plotxy()
# You’ll see lots of low points as you step through RR LL RL LR
# A basic clip at 0.75 for RR LL and 0.055 for RL LR will work
# If you want to do this interactively, set
iteration = ’’
plotxy()
# You can also use flagdata to do this non-interactively
# (see below)
# Now look at the cross-polar products
correlation = ’RL LR’
plotxy()
#--------------------------------------------------------------------# Now do calibrater 0137+331
field = ’0137+331’
correlation = ’RR LL’
xaxis = ’uvdist’
spw = ’’
iteration = ’’
antenna = ’’
plotxy()
# You’ll see a bunch of bad data along the bottom near zero amp
# Draw a box around some of it and use Locate
119
CHAPTER 3. DATA EXAMINATION AND EDITING
# Looks like much of it is Antenna 9 (ID=8) in spw=1
xaxis = ’time’
spw = ’1’
correlation = ’’
# Note that the strings like antenna=’9’ first try to match the
# NAME which we see in listobs was the number ’9’ for ID=8.
# So be careful here (why naming antennas as numbers is bad).
antenna = ’9’
plotxy()
# YES! the last 4 scans are bad.
Box ’em and flag.
# Go back and clean up
xaxis = ’uvdist’
spw = ’’
antenna = ’’
correlation = ’RR LL’
plotxy()
# Box up the bad low points (basically a clip below 0.52) and flag
# Note that RL,LR are too weak to clip on.
#--------------------------------------------------------------------# Finally, do JUPITER
field = ’JUPITER’
correlation = ’’
iteration = ’’
xaxis = ’time’
plotxy()
# Here you will see that the final scan at 22:00:00 UT is bad
# Draw a box around it and flag it!
# Now look at whats left
correlation = ’RR LL’
xaxis = ’uvdist’
spw = ’1’
antenna = ’’
iteration = ’antenna’
plotxy()
# As you step through, you will see that Antenna 9 (ID=8) is often
# bad in this spw. If you box and do Locate (or remember from
# 0137+331) its probably a bad time.
120
CHAPTER 3. DATA EXAMINATION AND EDITING
121
# The easiset way to kill it:
antenna = ’9’
iteration = ’’
xaxis = ’time’
correlation = ’’
plotxy()
# Draw a box around all points in the last bad scans and flag ’em!
# Now clean up the rest
xaxis = ’uvdist’
correlation = ’RR LL’
antenna = ’’
spw = ’’
# You will be drawing many tiny boxes, so remember you can
# use the ESC key to get rid of the most recent box if you
# make a mistake.
plotxy()
# Note that the end result is we’ve flagged lots of points
# in RR and LL. We will rely upon imager to ignore the
# RL LR for points with RR LL flagged!
3.5
Non-Interactive Flagging using flagdata
Task flagdata will flag the visibility data set based on the specified data selections, most of the
information coming from a run of the listobs task (with/without verbose=True). Currently you
can select based on any combination of:
• antennas (antenna)
• baselines (antenna)
• spectral windows and channels (spw)
• correlation types (correlation)
• field ids or names (field)
• uv-ranges (uvrange)
• times (timerange) or scan numbers (scan)
CHAPTER 3. DATA EXAMINATION AND EDITING
122
• antenna arrays (array)
and choose to flag, unflag, clip (setclip and sub-parameters), and remove the first part of each
scan (setquack) and/or the autocorrelations (autocorr).
The inputs to flagdata are:
#
flagdata :: Flag/Clip data based on selections:
vis
mode
=
’’
#
= ’manualflag’ #
=
False
#
=
False
#
=
’ABS RR’
#
=
[]
#
=
’DATA’
#
=
True
#
Name of input visibility file
Mode (manualflag, quack, shadow, autoflag, summary)
Flag autocorrelations
Unflag the data specified
Expression to clip on
Range to use for clipping
Data column to use for clipping
Clip outside the range, or within it
spw
field
selectdata
antenna
timerange
correlation
scan
feed
array
uvrange
=
=
=
=
=
=
=
=
=
=
’’
’’
True
’’
’’
’’
’’
’’
’’
’’
#
#
#
#
#
#
#
#
#
#
spectral-window/frequency/channel
Field names or field index numbers: ’’==>all, field=’0~2,3C286’
More data selection parameters (antenna, timerange etc)
antenna/baselines: ’’==>all, antenna = ’3,VA04’
time range: ’’==>all, timerange=’09:14:0~09:54:0’
Select data based on correlation
scan numbers: ’’==>all
multi-feed numbers: Not yet implemented
(sub)array numbers: ’’==>all
uv range: ’’==>all; uvrange = ’0~100klambda’, default units=meters
async
=
False
#
If true the taskname must be started using flagdata(...)
autocorr
unflag
clipexpr
clipminmax
clipcolumn
clipoutside
The default flagging mode is ’manualflag’. See § 3.5.1.1 more more on this option.
The mode=’summary’ will print out a summary of the current state of flagging into the logger.
The mode=’quack’ will allow dropping of integrations from the beginning of scans. See § 3.5.1.2
for details.
The mode=’shadow’ option will allow shadowed data to be flagged (if it has not already during
filling).
BETA ALERT: the mode=’autoflag’ option is not currently supported.
————————-
3.5.1
Flag Antenna/Channels
The following commands give the results shown in Figure 3.5:
CHAPTER 3. DATA EXAMINATION AND EDITING
123
default{’plotxy’)
plotxy(’ngc5921.ms’,’channel’,iteration=’antenna’,subplot=311)
default(’flagdata’)
flagdata(vis=’ngc5921.ms’,antenna=’0’,spw=’0:10~15’)
default plotxy
plotxy(’ngc5921.ms’,’channel’,iteration=’antenna’,subplot=311)
Figure 3.5: flagdata: Example showing before and after displays using a selection of one antenna
and a range of channels. Note that each invocation of the flagdata task represents a cumulative selection, i.e., running antenna=’0’ will flag all data with antenna 0, while antenna=’0’, spw=’0:10 15’
will flag only those channels on antenna 0.
3.5.1.1
Manual flagging and clipping in flagdata
For mode=’manualflag’’, manual flagging and clipping is controlled by the sub-parameters:
mode
autocorr
unflag
clipexpr
clipminmax
clipcolumn
clipoutside
= ’manualflag’ #
=
False
#
=
False
#
=
’ABS RR’
#
=
[]
#
=
’DATA’
#
=
True
#
Mode (manualflag,autoflag,summary,quack)
Flag autocorrelations
Unflag the data specified
Expression to clip on
Range to use for clipping
Data column to use for clipping
Clip outside the range, or within it
The following commands give the results shown in Figure 3.6:
plotxy(’ngc5921.ms’,’uvdist’)
flagdata(vis=’ngc5921.ms’,clipexpr=’LL’,clipminmax=[0.0,1.6],clipoutside=True)
plotxy(’ngc5921.ms’,’uvdist’)
CHAPTER 3. DATA EXAMINATION AND EDITING
124
Figure 3.6: flagdata: Flagging example using the clip facility.
3.5.1.2
Flagging the beginning of scans
You can use the mode=’quack’ option to drop integrations from the beginning of scans (as in the
AIPS task QUACK):
mode
autocorr
unflag
quackinterval
=
=
=
=
’quack’
False
False
0.0
#
#
#
#
Mode (manualflag,autoflag,summary,quack)
Flag autocorrelations
Unflag the data specified
Quack n seconds from scan beginning
Note that the time is measured from the first integration in the MS for a given scan, and this is
often already flagged by the online system.
For example, assuming the integration time is 3.3 seconds (e.g. for VLA), then
mode = ’quack’
quackinterval = 14.0
will flag the first 4 integrations in every scan.
3.6
Browse the Data
The browsetable task is available for viewing data directly (and handles all CASA tables, including
Measurement Sets, calibration tables, and images). This task brings up the CASA Qt casabrowser,
which is a separate program. You can launch this from outside casapy.
The default inputs are:
CHAPTER 3. DATA EXAMINATION AND EDITING
#
125
browsetable :: Browse a table (MS, calibration table, image)
tablename
=
’’
#
Name of input table
Currently, its single input is the tablename, so an example would be:
browsetable(’ngc5921.ms’)
For an MS such as this, it will come up with a browser of the MAIN table (see Fig 3.7). If you want
to look at sub-tables, use the tab table keywords along the left side to bring up a panel with
the sub-tables listed (Fig 3.8), then choose (left-click) a table and View:Details to bring it up
(Fig 3.9). You can left-click on a cell in a table to view the contents.
Figure 3.7: browsetable: The browser displays the main table within a frame. You can scroll
through the data (x=columns of the MAIN table, and y=the rows) or select a specific page or row
as desired. By default, 1000 rows of the table are loaded at a time, but you can step through the
MS in batches.
Note that one useful feature is that you can Edit the table and its contents. Use the Edit table
choice from the Edit menu, or click on the Edit button. Be careful with this, and make a backup
copy of the table before editing!
Use the Close Tables and Exit option from the Files menu to quit the casabrowser.
CHAPTER 3. DATA EXAMINATION AND EDITING
126
Figure 3.8: browsetable: You can use the tab for Table Keywords to look at other tables within
an MS. You can then double-click on a table to view its contents.
There are alot of features in the casabrowser that are not fully documented here. Feel free to
explore the capabilities such as plotting and sorting!
BETA ALERT: You are likely to find that the casabrowser needs to get a table lock before
proceeding. Use the clearstat command to clear the lock status in this case.
3.7
Plotting antenna positions (plotants)
This task is a simple plotting interface (to the plotxy functionality) to produce plots of the antenna
positions (taken from the ANTENNA sub-table of the MS).
The inputs to plotants are:
# plotants :: Plot the antenna distribution in the local reference frame:
vis
=
’’
# Name of input visibility file (MS)
figfile
=
’’
# Save the plotted figure to this file
async
=
False
#
CHAPTER 3. DATA EXAMINATION AND EDITING
127
Figure 3.9: browsetable: Viewing the SOURCE table of the MS.
3.8
MS Plotting and Editing using casaplotms
BETA ALERT: The casaplotms tool is an experimental standalone plotter application based
on Qt. It is intended to replace plotxy and will be integrated more fully into CASA in the next
release.
There is no task or toolkit interface to casaplotms from inside casapy. You can start the application outside CASA (e.g. by typing casaplotms) or from inside the shell using the OS command
syntax, either !casaplotms from IPython, or os.system(’casaplotms’) from IPython or script.
3.9
Examples of Data Display and Flagging
See the scripts provied in Appendix F for examples of data examination and flagging. In particular,
we refer the interested user to the demonstrations for:
• NGC5921 (VLA HI) — a quick demo of basic CASA capabilities (F.1)
• Jupiter (VLA 6cm continuum polarimetry) — more extensive editing (F.2)
Chapter 4
Synthesis Calibration
This chapter explains how to calibrate interferometer data
within the CASA task system. Calibration is the process
Inside the Toolkit:
of determining the complex correction factors that must be The workhorse for synthesis calibraapplied to each visibility in order to make them as close as tion is the cb tool.
possible to what an idealized interferometer would measure,
such that when the data is imaged an accurate picture of the sky is obtained. This is not an arbitrary
process, and there is a philosophy behind the CASA calibration methodology (see § 4.2.1 for more
on this). For the most part, calibration in CASA using the tasks is not too different than calibration
in other packages such as AIPS or Miriad, so the user should not be alarmed by cosmetic differences
such as task and parameter names!
4.1
Calibration Tasks
The standard set of calibration tasks are:
• accum — Accumulate incremental calibration solutions into a cumulative cal table (§ 4.5.4),
• applycal — Apply calculated calibration solutions (§ 4.6.1),
• bandpass — B calibration solving; supports pre-apply of other calibrations (§ 4.4.2),
• clearcal — Re-initialize visibility data set calibration data (§ 4.6.3),
• fluxscale — Bootstrap the flux density scale from standard calibration sources (§ 4.4.4),
• gaincal — G calibration solving; supports pre-apply of other calibrations (§ 4.4.3),
• listcal — list calibration solutions (§ 4.5.2),
• plotcal — Plot calibration solutions (§ 4.5.1),
• polcal — polarization calibration (§ 4.4.5),
128
CHAPTER 4. SYNTHESIS CALIBRATION
129
• setjy — Compute the model visibility for a specified source flux density (§ 4.3.4),
• smoothcal — Smooth calibration solutions derived from one or more sources (§ 4.5.3),
• split — Write out new MS containing calibrated data from a subset of the original MS
(§ 4.7.1).
There are some development versions of calibration and utility tasks that are recently added to the
Beta Release suite:
• hanningsmooth — apply a Hanning smoothing filter to spectral-line uv data (§ 4.7.2),
• uvcontsub — uv-plane continuum fitting and subtraction (§ 4.7.4),
• uvsub — subtract the transform of a model image from the uv data (§ 4.7.3).
These are not yet full-featured, and may have only rudimentary controls and options.
Finally, there are also more advanced and experimental calibration tasks available in this release:
• blcal — baseline-based gain or bandpass calibration; supports pre-apply of other calibrations
(§ 4.4.6),
• fringecal — Experimental: baseline-based fringe-fitting calibration solving; supports preapply of other calibrations (§ 4.4.7),
• uvmodelfit — fit a component source model to the uv data (§ 4.7.5).
The following sections outline the use of these tasks in standard calibration processes.
Information on other useful tasks and parameter setting can be found in:
• listobs — list what is in a MS (§ 2.3),
• plotxy — X-Y plotting and editing (§ 3.4),
• flagdata — non-interactive data flagging (§ 3.5),
• data selection — general data selection syntax (§ 2.6).
4.2
The Calibration Process — Outline and Philosophy
A work-flow diagram for CASA calibration of interferometry data is shown in Figure 4.1. This
should help you chart your course through the complex set of calibration steps. In the following
sections, we will detail the steps themselves and explain how to run the necessary tasks and tools.
This can be broken down into a number of discrete phases:
CHAPTER 4. SYNTHESIS CALIBRATION
130
Figure 4.1: Flow chart of synthesis calibration operations. Not shown are use of table manipulation
and plotting tasks accum, plotcal, and smoothcal (see Figure 4.2).
CHAPTER 4. SYNTHESIS CALIBRATION
131
• Prior Calibration — set up previously known calibration quantities that need to be preapplied, such as the flux density of calibrators, antenna gain-elevation curves, and atmospheric
models. Use the setjy task (§ 4.3.4), and set the gaincurve (§ 4.3.2) and opacity (§ 4.3.3)
parameters in subsequent tasks;
• Bandpass Calibration — solve for the relative gain of the system over the frequency channels in the dataset (if needed), having pre-applied the prior calibration. Use the bandpass
task (§ 4.4.2);
• Gain Calibration — solve for the gain variations of the system as a function of time, having
pre-applied the bandpass (if needed) and prior calibration. Use the gaincal task (§ 4.4.3);
• Polarization Calibration — solve for any unknown polarization leakage terms. BETA
ALERT: Polarization Calibration tasks are now available as of Beta Release Patch 1 (§ 4.4.5);
• Establish Flux Density Scale — if only some of the calibrators have known flux densities, then rescale gain solutions and derive flux densities of secondary calibrators. Use the
fluxscale task (§ 4.4.4);
• Manipulate, Accumulate, and Iterate — if necessary, accumulate different calibration
solutions (tables), smooth, and interpolate/extrapolate onto different sources, bands, and
times. Use the accum (§ 4.5.4) and smoothcal (§ 4.5.3) tasks;
• Examine Calibration — at any point, you can (and should) use plotcal (§ 4.5.1) and/or
listcal (§ 4.5.2) to look at the calibration tables that you have created;
• Apply Calibration to the Data — this can be forced explicitly by using the applycal
task (§ 4.6.1), and can be undone using clearcal (§ 4.6.3);
• Post-Calibration Activities — this includes the determination and subtraction of continuum signal from line data, the splitting of data-sets into subsets (usually single-source), and
other operations (such as model-fitting). Use the uvcontsub (§ 4.7.4), split (§ 4.7.1), and
uvmodelfit (§ 4.7.5) tasks.
The flow chart and the above list are in a suggested order. However, the actual order in which
you will carry out these operations is somewhat fluid, and will be determined by the specific
data-reduction use cases you are following. For example, you may need to do an initial Gain
Calibration on your bandpass calibrator before moving to the Bandpass Calibration stage. Or
perhaps the polarization leakage calibration will be known from prior service observations, and can
be applied as a constituent of Prior Calibration.
4.2.1
The Philosophy of Calibration in CASA
Calibration is not an arbitrary process, and there is a methodology that has been developed to
carry out synthesis calibration and an algebra to describe the various corruptions that data might
be subject to: the Hamaker-Bregman-Sault Measurement Equation (ME), described in Appendix E.
The user need not worry about the details of this mathematics as the CASA software does that for
CHAPTER 4. SYNTHESIS CALIBRATION
132
you. Anyway, its just matrix algebra, and your familiar scalar methods of calibration (such as in
AIPS) are encompassed in this more general approach.
There are a number of “physical” components to calibration in CASA:
• data — in the form of the Measurement Set (§ 2.1). The MS includes a number of columns
that can hold calibrated data, model information, and weights;
• calibration tables — these are in the form of standard CASA tables, and hold the calibration
solutions (or parameterizations thereof);
• task parameters — sometimes the calibration information is in the form of CASA task
parameters that tell the calibration tasks to turn on or off various features, contain important
values (such as flux densities), or list what should be done to the data.
At its most basic level, Calibration in CASA is the process of taking “uncalibrated” data, setting
up the operation of calibration tasks using parameters, solving for new calibration tables, and
then applying the calibration tables to form “calibrated” data. Iteration can occur as necessary,
with the insertion of other non-calibration steps (e.g. “self-calibration” via imaging).
4.2.2
Keeping Track of Calibration Tables
The calibration tables are the currency that is exchanged between the calibration tasks. The
“solver” tasks (gaincal, bandpass, blcal, fringecal) take in the MS (which may have a calibration model in the MODEL DATA column from setjy or ft) and previous calibration tables, and
will output an “incremental” calibration table (it increments the previous calibration, if any). This
table can then be smoothed using smoothcal if desired.
You can accumulate the incremental calibration onto previous calibration tables with accum, which
will then output a cumulative calibration table. This task will also interpolate onto a different time
scale. See § 4.5.4 for more on accumulation and interpolation.
Figure 4.2 graphs the flow of these tables through the sequence
solve
=>
smooth
=>
accumulate
Note that this sequence applied to separate types of tables (e.g. ’B’, ’G’) although tables of other
types can be previous calibration input to the solver.
The final set of cumulative calibration tables is what is applied to the data using applycal. You
will have to keep track of which tables are the intermediate incremental tables, and which are
cumulative, and which were previous to certain steps so that they can also be previous to later
steps until accumulation. This can be a confusing business, and it will help if you adopt a consistent
table naming scheme (see Figure 4.2) for an example naming scheme).
CHAPTER 4. SYNTHESIS CALIBRATION
133
Figure 4.2: Chart of the table flow during calibration. The parameter names for input or output of
the tasks are shown on the connectors. Note that from the output solver through the accumulator
only a single calibration type (e.g. ’B’, ’G’) can be smoothed, interpolated or accumulated at
a time. The final set of cumulative calibration tables of all types are then input to applycal as
shown in Figure 4.1.
4.2.3
The Calibration of VLA data in CASA
CASA supports the calibration of VLA data that is imported from the Archive through the
importvla task. See § 2.2.2 for more information.
BETA ALERT: Data taken both before and after the Modcomp turn-off in late June 2007 will
be handled automatically by importvla. You do not need to set special parameters to do so, and
it will obey the scaling specified by applytsys.
You can also import VLA data in UVFITS format with the importuvfits task (§ 2.2.1.1). However,
in this case, you must be careful during calibration in that some prior or previous calibrations (see
below) may or may not have been done in AIPS and applied (or not) before export.
CHAPTER 4. SYNTHESIS CALIBRATION
134
For example, the default settings of AIPS FILLM will apply VLA gaincurve and approximate
(weather-based) atmospheric optical depth corrections when it generates the extension table CL
1. If the data is exported immediately using FITTP, then this table is included in the UVFITS
file. However, CASA is not able to read or use the AIPS SN or CL tables, so that prior calibration
information is lost and must be applied during calibration here (ie. using gaincurve=True and
setting the opacity parameter).
On the other hand, if you apply calibration in AIPS by using the SPLIT or SPLAT tasks to apply
the CL tables before exporting with FITTP, then this calibration will be in the data itself. In this
case, you do not want to re-apply these calibrations when processing in CASA.
4.3
Preparing for Calibration
There are a number of “a priori” calibration quantities that may need to be applied to the data
before further calibration is carried out. These include
• system temperature correction — turn correlation coefficient into correlated flux density
(necessary for some telescopes),
• gain curves — antenna gain-elevation dependence,
• atmospheric optical depth — attenuation of the signal by the atmosphere, correcting for
its elevation dependence.
• flux density models — establish the flux density scale using “standard” calibrator sources,
with models for resolved calibrators,
These are pre-determined effects and should be applied (if known) before solving for other calibration terms. If unknown, then they will need to be solved for as one of the standard calibration
types (gain or bandpass).
We now deal with these in turn.
4.3.1
System Temperature Correction
Some telescopes, including the EVLA and the VLBA, record the visibilities in the form of raw
correlation coefficient with weights proportional to the number of bits correlated. The correlation
coefficient is the fraction of the total signal that is correlated, and thus multiplication by the system
temperature and the antenna gain (in Jy/K) will produce visibilities with units of correlated flux
density. Note that the old VLA system did this initial calibration on-line, and ALMA will also
provide some level of on-line calibration (TBD).
BETA ALERT: There is as yet no mechanism available in importvla or in the calibration tasks
to use the system temperature information provided by the VLA/EVLA on-line system to calibrate
EVLA or VLBA data in raw form. This includes VLA data taken after the Modcomp turn-over
CHAPTER 4. SYNTHESIS CALIBRATION
135
in late June 2007. You may pass the data through AIPS first. You can also just forge ahead with
standard calibration. The drawback to this is that short-term changes in Tsys which are not tracked
by calibrator observations or self-calibration will remain in the data.
4.3.2
Antenna Gain-Elevation Curve Calibration
Large antennas (such as the 25-meter antennas used in the VLA and VLBA) have a forward gain
and efficiency that changes with elevation. Gain curve calibration involves compensating for the
effects of elevation on the amplitude of the received signals at each antenna. Antennas are not
absolutely rigid, and so their effective collecting area and net surface accuracy vary with elevation
as gravity deforms the surface. This calibration is especially important at higher frequencies where
the deformations represent a greater fraction of the observing wavelength. By design, this effect is
usually minimized (i.e., gain maximized) for elevations between 45 and 60 degrees, with the gain
decreasing at higher and lower elevations. Gain curves are most often described as 2nd- or 3rd-order
polynomials in zenith angle.
Gain curve calibration has been implemented in CASA for the VLA (only), with gain curve polynomial coefficients available directly from the CASA data repository. To make gain curve corrections
for VLA data, set gaincurve=True for any of the calibration tasks.
BETA ALERT: The gaincurve parameter must be supplied to any calibration task that allows
pre-application of the prior calibration (e.g. bandpass, gaincal, applycal). This should be done
consistently through the calibration process. In future updates we will likely move to a separate
task to calibrate the gain curve.
For example, to pre-apply the gaincurve during gain calibration:
gaincal(’data.ms’,’cal.G0’,gaincuve=True, solint=0.,refant=11)
NOTE: Set gaincurve=False if you are not using VLA data.
The gain curve will be calculated per timestamp. Upon execution of a calibration task (e.g.,
gaincal, bandpass, applycal, etc.), the gain curve data appropriate to the observing frequencies
will be automatically retrieved from the data repository and applied.
BETA ALERT: Currently, gain-curves for VLA are built into the CASA system and this is what is
applied when gaincurve=True. Therefore, the application of the gain-curves, if gaincurve=True,
is allowed only if the VLA is set as the telescope of observation in the MS, otherwise an error will
be generated. Set gaincurve=False if you are not using VLA data. A general mechanism for
incorporating gaincurve information for other arrays will be made available in future releases. Also
note that the VLA gain-curves are the most recent ones (that are also supplied in AIPS). Caution
should be used in applying these gaincurve corrections to VLA data taken before 2001, as antenna
changes were poorly tracked previous to this time. We will include gain curves for EVLA antennas
when those are measured and become available.
CHAPTER 4. SYNTHESIS CALIBRATION
4.3.3
136
Atmospheric Optical Depth Correction
The troposphere is not completely transparent. At high radio frequencies (>15 GHz), water vapor
and molecular oxygen begin to have a substantial effect on radio observations. According to the
physics of radiative transmission, the effect is threefold. First, radio waves from astronomical
sources are absorbed (and therefore attenuated) before reaching the antenna. Second, since a good
absorber is also a good emitter, significant noise-like power will be added to the overall system noise.
Finally, the optical path length through the troposphere introduces a time-dependent phase error.
In all cases, the effects become worse at lower elevations due to the increased air mass through
which the antenna is looking. In CASA, the opacity correction described here compensates only
for the first of these effects, tropospheric attenuation, using a plane-parallel approximation for the
troposphere to estimate the elevation dependence.
Opacity corrections are a component of calibration type ’T’. To make opacity corrections in CASA,
an estimate of the zenith opacity is required (see observatory-specific chapters for how to measure
zenith opacity). This is then supplied to the opacity parameter in the calibration tasks.
BETA ALERT: The opacity parameter must be supplied to any calibration task that allows
pre-application of the prior calibration (e.g. bandpass, gaincal, applycal). This should be done
consistently through the calibration process. In future updates we will likely move to a separate
task to calibrate the atmospheric optical depth.
For example, if the zenith optical depth is 0.1 nepers, then use the following parameters:
gaincal(’data.ms’, ’cal.G0’, solint=0., refant=11, opacity=0.1)
The calibration task in this example will apply an elevation-dependent opacity correction (scaled
to 0.1 nepers at the zenith for all antennas for this example) calculated at each scan (solint=0).
Set solint=-1 instead to get a solution every timestamp.
BETA ALERT: Currently, you can only supply a single value of opacity, which will then be
pre-applied to whatever calibration task that you set it in. Generalizations to antenna- and timedependent opacities, including derivation (from weather information) and solving (directly from
the visibility data) capabilities, will be made available in the future.
If you do not have an externally supplied value for opacity, for example from a VLA tip procedure,
then you should either use an average value for the telescope, or leave it at zero and hope that your
gain calibration compensates (e.g. that your calibrator is at the same elevation as your target at
approximately the same time. As noted above, there are no facilities yet to estimate this from the
data (e.g. by plotting TANT vs. elevation).
Below, we give instructions for determining opacity for VLA observations where tip-curve data is
available. It is beyond the scope of this cookbook to provide information for other telescopes.
4.3.3.1
Determining opacity corrections for VLA data
For VLA data, zenith opacity can be measured at the frequency and during the time observations
are made using a VLA tipping scan in the observe file. Historical tipping data are available at:
CHAPTER 4. SYNTHESIS CALIBRATION
137
http://www.vla.nrao.edu/astro/calib/tipper
Choose a year, and click Go to get a list of all tipping scans that have been made for that year.
If a tipping scan was made for your observation, then select the appropriate file. Go to the bottom
of the page and click on the button that says Press here to continue.. The results of the tipping
scan will be displayed. Go to the section called ’Overall Fit Summary’ to find the fit quality and
the fitted zenith opacity in percent. If the zenith opacity is reported as 6%, then the actual zenith
optical depth value is opacity=0.060 for gaincal and other calibration tasks.
If there were no tipping scans made for your observation, then look for others made in the same
band around the same time and weather conditions. If nothing is available here, then at K and Q
bands you might consider using an average value (e.g. 6% in reasonable weather). See the VLA
memo
http://www.vla.nrao.edu/memos/test/232/232.pdf
for more on the atmospheric optical depth correction at the VLA, including plots of the seasonal
variations.
4.3.4
Setting the Flux Density Scale using (setjy)
When solving for visibility-plane calibration, CASA calibration applications compare the observed
DATA column with the MODEL DATA column. The first time that an imaging or calibration task is
executed for a given MS, the MODEL DATA column is created and initialized with unit point source
flux density visibilities (unpolarized) for all sources (e.g. AMP=1, phase=0◦ ). The setjy task
is then used to set the proper flux density for flux calibrators. For sources that are recognized
flux calibrators (listed in Table 4.1), setjy will calculate the flux densities, Fourier transform the
data and write the results to the MODEL DATA column. For the VLA, the default source models are
customarily point sources defined by the Baars or Perley-Taylor flux density scales, or point sources
of unit flux density if the flux density is unknown. The MODEL DATA column can also be filled with
a model generated from an image of the source (e.g. the Fourier transform of an image generated
after initial calibration of the data).
The inputs for setjy are:
#
setjy :: Place flux density of sources in the measurement set:
vis
field
spw
modimage
fluxdensity
standard
=
’’
#
=
’’
#
=
’’
#
=
’’
#
=
-1
#
= ’Perley-Taylor 99’
Name of input visibility file
Field name list or field ids list
Spectral window identifier (list)
Model image name
Specified flux density [I,Q,U,V]
#
Flux density standard
CHAPTER 4. SYNTHESIS CALIBRATION
138
Table 4.1:
3C Name
3C286
3C48
3C147
3C138
–
3C295
B1950 Name
1328+307
0134+329
0538+498
0518+165
1934-638
1409+524
J2000 Name
1331+305
0137+331
0542+498
0521+166
–
1411+522
By default the setjy task will cycle through all fields and spectral windows, setting the flux density
either to 1 Jy (unpolarized), or if the source is recognized as one of the calibrators in the above table,
to the flux density (assumed unpolarized) appropriate to the observing frequency. For example, to
run setjy on a measurement set called data.ms:
setjy(vis=’data.ms’)
# This will set all fields and spectral windows
BETA ALERT: At this time, all that setjy does is to fill the MODEL DATA column of the MS with
the Fourier transform of a source model. The ft task (§ 5.7) will do the same thing, although it
does not offer the options for flux rescaling that setjy does. Note also that currently setjy will
not transform a full-Stokes model image such that all polarizations are filled correct. You need to
use ft for this.
To limit this operation to certain fields and spectral windows, use the field and/or spw parameters,
which take the usual data selection strings (§ 2.6). For example, to set the flux density of the first
field (all spectral windows)
setjy(vis=’data.ms’,field=’0’)
or to set the flux density of the second field in spectral window 17
setjy(vis=’data.ms’,field=’1’,spw=’17’)
The full-polarization flux density (I,Q,U,V) may also be explicitly provided:
setjy(vis=’data.ms’,
field=’1’,spw=’16’,
fluxdensity=[3.5,0.2,0.13,0.0])
# Run setjy on field id 1, spw id 17
# and set I,Q,U,V explicitly
Note: The setjy (or ft) operation is different than the antenna gain-elevation and atmospheric
opacity Prior Calibrations (§ 4.3.2–4.3.3) in that it is applied to (and carried with) the MS itself,
rather than via other tables or parameters to the subsequent tasks. It is more like the Tsys
correction (§ 4.3.1) in this regard.
CHAPTER 4. SYNTHESIS CALIBRATION
4.3.4.1
139
Using Calibration Models for Resolved Sources
If the flux density calibrator is resolved at the observing frequency, the point source model generated
by setjy will not be appropriate. If available, a model image of the resolved source at the observing
frequency may be used to generate the appropriate visibilities using the modimage parameter (or
in older versions explicitly with the ft task). To use this, provide modimage with the path to the
model image. Remember, if you just give the file name, it will assume that it is in the current
working directory. Note also that setjy using a model image will only operate on that single
source, thus you would run it multiple times (with different field settings) for different sources.
Otherwise, you may need to use the uvrange selection (§ 4.4.1.2) in the calibration solving tasks to
exclude the baselines where the resolution effect is significant. There is not hard and fast rule for
this, though you should consider this if your calibrator is shows a drop of more than 10% on the
longest baselines (use plotxy, § 3.4, to look at this). You may need to do antenna selection also,
if it is heavily resolved and there are few good baselines to the outer antennas. Note that uvrange
may also be needed to exclude the short baselines on some calibrators that have extended flux not
accounted for in the model. Note: the calibrator guides for the specific telescopes usually indicate
appropriate min and max for uvrange. For example, see the VLA Calibration Manual at:
http://www.vla.nrao.edu/astro/calib/manual/
for details on the use of standard calibrators for the VLA.
Model images for some flux density calibrators are provided with CASA:
• Red Hat Linux RPMs (RHE4, Fedora 6): located in /usr/lib/casapy/data/nrao/VLA/CalModels
• MAC OSX .dmg: located in /opt/casa/data/nrao/VLA/CalModels
• NRAO-AOC stable: /home/casa/data/nrao/VLA/CalModels
• NRAO-AOC daily: /home/ballista/casa/daily/data/nrao/VLA/CalModels
e.g., these are found in the data/nrao/VLA/CalModels sub-directory of the CASA installation. For
example, just point to the repository copy, e.g.
modimage = ’/usr/lib/casapy/data/nrao/VLA/CalModels/3C48_C.im’
or if you like, you can copy the ones you wish to use to your working directory.
The models available are:
3C138_C.im
3C138_K.im
3C138_L.im
3C138_Q.im
3C138_U.im
3C138_X.im
3C147_C.im
3C147_K.im
3C147_Q.im
3C147_U.im
3C147_X.im
3C286_C.im
3C286_K.im
3C286_L.im
3C286_Q.im
3C286_U.im
3C286_X.im
3C48_C.im
3C48_K.im
3C48_L.im
3C48_Q.im
3C48_U.im
3C48_X.im
CHAPTER 4. SYNTHESIS CALIBRATION
140
These are all un-reconvolved images of AIPS CC lists, properly scaled to the Perley-Taylor 1999
flux density for the frequencies at which they were observed.
It is important that the model image not be one convolved with a finite beam; it must have units
of Jy/pixel (not Jy/beam).
Note that setjy will rescale the flux in the models for known sources (e.g. those in Table 4.1) to
match those it would have calculated. It will thus extrapolated the flux out of the frequency band
of the model image to whatever spectral windows in the MS are specified (but will use the structure
of the source in the model image).
BETA ALERT: The reference position in the modimage is currently used by setjy when it does
the Fourier transform, thus differences from the positions for the calibrator in the MS will show
up as phase gradients in the uv-plane. If your model image position is significantly different but
you don’t want this to affect your calibration, then you can doctor either the image header using
imhead (§ 6.2) or in the MS (using the ms tool) as appropriate. In an upcoming Beta patch we will
put in a toggle to use or ignore the position of the modimage. Note that this will not affect the flux
scaling (only put in erroneous model phases); in any event small position differences, such as those
arising by changing epoch from B1950 to J2000 using regridimage (§ 6.9), will be inconseqential
to the calibration.
This illustrates the use of uvrange for a slightly resolved calibrator:
# Import the data
importvla(archivefiles=’AS776_A031015.xp2’, vis=’ngc7538_XBAND.ms’,
freqtol=10000000.0, bandname=’X’)
# Flag the ACs
flagautocorr(’ngc7538_XBAND.ms’)
# METHOD 1:
Use point source model for 3C48, plus uvrange in solve
# Use point source model for 3C48
setjy(vis=’ngc7538_XBAND.ms’,field=’0’);
# Limit 3C48 (fieldid=0) solutions to uvrange = 0-40 klambda
gaincal(vis=’ngc7538_XBAND.ms’, caltable=’cal.G’, field=’0’,
solint=60.0, refant=’10’, selectdata=True, uvrange=’0~40klambda’,
append=False, gaincurve=False, opacity=0.0)
# Append phase-calibrator’s solutions (no uvrange) to the same table
gaincal(vis=’ngc7538_XBAND.ms’, caltable=’cal.G’, field=’2’,
solint=60.0, refant=’10’, selectdata=True, uvrange=’’,
append=True, gaincurve=False, opacity=0.0)
# Fluxscale
fluxscale(vis=’ngc7538_XBAND.ms’, caltable=’cal.G’, reference=[’0137+331’],
transfer=[’2230+697’], fluxtable=’cal.Gflx’, append=False)
while the following illustrates the use of of a model:
CHAPTER 4. SYNTHESIS CALIBRATION
141
# METHOD 2: use a resolved model copied from the data respository
#
for 3C48, and no uvrange
# (NB: detailed freq-dep flux scaling TBD)
# Copy the model image 3C48_X.im to the working directory first!
setjy(vis=’ngc7538_XBAND.ms’, field=’0’, modimage=’3C48_X.im’)
# Solutions on both calibrators with no uvrange
gaincal(vis=’ngc7538_XBAND.ms’, caltable=’cal.G2’, field=’0,2’,
solint=60.0, refant=’10’,
append=False, gaincurve=False, opacity=0.0)
# Fluxscale
fluxscale(vis=’ngc7538_XBAND.ms’, caltable=’cal.G2’, reference=[’0137+331’],
transfer=[’2230+697’], fluxtable=’cal.G2flx’, append=False)
# Both methods give 2230 flux densities ~0.7 Jy, in good agreement with
#
AIPS
4.3.5
Other a priori Calibrations and Corrections
Other a priori calibrations will be added to the calibrater (cb) tool in the near future. These
will include antenna-position (phase) corrections, system temperature normalization (amplitude)
corrections, tropospheric phase corrections derived from Water Vapor Radiometry (WVR) measurements, instrumental line-length corrections, etc. Where appropriate, solving capabilities for
these effects will also be added.
4.4
Solving for Calibration — Bandpass, Gain, Polarization
These tasks actually solve for the unknown calibration parameters, placing the results in a calibration table. They take as input an MS, and a number of parameters that specify any prior
calibration or previous calibration tables to pre-apply before computing the solution. These are
placed in the proper sequence of the Measurement Equation automatically.
We first discuss the parameters that are in common between many of the calibration tasks. Then
we describe each solver in turn.
4.4.1
Common Calibration Solver Parameters
There are a number of parameters that are in common between the calibration “solver” tasks.
These also appear in some of the other calibration manipulation and application tasks.
CHAPTER 4. SYNTHESIS CALIBRATION
4.4.1.1
142
Parameters for Specification : vis and caltable
The input measurement set and output table are controlled by the following parameters:
vis
caltable
=
=
’’
’’
#
#
Name of input visibility file
Name of output calibration table
The MS name is input in vis. If it is highlighted red in the inputs (§ 1.3.5.4) then it does not exist,
and the task will not execute. Check the name and path in this case.
The output table name is placed in caltable. Be sure to give a unique name to the output table,
or be careful. If the table exists, then what happens next will depend on the task and the values of
other parameters (e.g. § 4.4.1.6). The task may not execute giving a warning that the table already
exists, or will go ahead and overwrite the solutions in that table, or append them. Be careful.
4.4.1.2
Selection: field, spw, and selectdata
Selection is controlled by the parameters:
field
spw
selectdata
=
=
=
’’
’’
False
#
#
#
field names or index of calibrators: ’’==>all
spectral window:channels: ’’==>all
Other data selection parameters
Field and spectral window selection are so often used, that we have made these standard parameters
field and spw respectively.
The selectdata parameter expands as usual, uncovering other selection sub-parameters:
selectdata
timerange
uvrange
antenna
scan
msselect
=
=
=
=
=
=
True
’’
’’
’’
’’
’’
#
#
#
#
#
#
Other data selection parameters
time range: ’’==>all
uv range’’==>all
antenna/baselines: ’’==>all
scan numbers: Not yet implemented
Optional data selection (Specialized. but see help)
Note that if selectdata=False these parameters are not used when the task is executed, even if
set underneath.
The most common selectdata parameter to use is uvrange, which can be used to exclude longer
baselines if the calibrator is resolved, or short baselines of the calibrator contains extended flux not
accounted for in the model (e.g. § 4.3.4.1).
See § 2.6 for more on the selection parameters.
CHAPTER 4. SYNTHESIS CALIBRATION
4.4.1.3
143
Prior Calibration and Correction: parang, gaincurve and opacity
These parameters control the on-the-fly application of various calibration or effect-based corrections
prior to the solving process.
The parang parameter turns on the application of the antenna-based parallactic angle correction
(’P’) in the measurement equation. This is necessary for polarization calibration and imaging,
or for cases where the parallactic angles are different for geographically spaced antennas (e.g.
VLBI). For dealing with only the parallel-hand corrections (e.g. RR, LL, XX, YY) for a co-located
array (e.g. the VLA or ALMA), you can set parang=False and save some computational effort.
Otherwise, set parang=True to apply this correction.
There are two control parameters for applying Prior Calibration:
gaincurve
opacity
=
=
False
0.0
#
#
Apply VLA antenna gain curve correction
Opacity correction to apply (nepers)
See § 4.3 for more on Prior Calibration.
4.4.1.4
Previous Calibration: gaintable, gainfield, interp and spwmap
Calibration tables that have already been determined can also be applied before solving for the
new table:
gaintable
gainfield
interp
spwmap
=
=
=
=
’’
’’
’’
[]
#
#
#
#
Prior gain calibration table(s) to apply
Field selection on prior gaintable(s)
Interpolation mode (in time) for prior gaintable(s)
Spectral window mapping for each gaintable (see help)
This is controlled by the gaintable parameter, which takes a string or list of strings giving one or
more calibration tables to pre-apply. For example,
gaintable = [’ngc5921.bcal’,’ngc5921.gcal’]
specifies two tables, in this case bandpass and gain calibration tables respectively.
The other parameters key off gaintable, taking single values or lists, with an entry for each table
in gaintable. The order is given by that in gaintable.
The gainfield parameter specifies which fields from the respective gaintable to use to apply.
This is a list, with each entry a string or list of strings. The default ’’ for an entry means to use
all in that table. For example,
gaintable = [’ngc5921.bcal’,’ngc5921.gcal’]
gainfield = [ ’1331+305’, [’1331+305’,’1445+099’] ]
or using indices
CHAPTER 4. SYNTHESIS CALIBRATION
144
gainfield = [ ’0’, [’0’,’1’] ]
to specify the field ’1331+305’ from the table ’ngc5921.bcal’ and fields ’1331+305’ and ’1445+099’
from the second table ’ngc5921.gcal’. We could also have wildcarded the selection, e.g.
gainfield = [ ’0’, ’*’ ]
taking all fields from the second table. And of course we could have used the default
gainfield = [ ’0’, ’’ ]
or even
gainfield = [ ’0’ ]
which is to take all.
The interp parameter chooses the interpolation scheme to be used when pre-applying the solution
in the tables. This interpolation is (currently) only in time. The choices are currently ’nearest’,
’linear’, and ’aipslin’:
• ’nearest’ just picks the entry nearest in time to the visibility in question;
• ’linear’ interpolation calibrates each datum with calibration phases and amplitudes linearly
interpolated from neighboring time values. In the case of phase, this mode will assume that
phase jumps greater than 180◦ between neighboring points indicate a cycle slip, and the
interpolated value will follow this change in cycle accordingly;
• ’aipslin’ emulates the classic AIPS interpolation mode with linearly interpolated amplitudes and phases derived from interpolation of the complex calibration values. While this
method avoids having to track cycle slips (which is unstable for solutions with very low SNR),
it will yield a phase interpolation which becomes increasingly non-linear as the spanned phase
difference increases. The non-linearity mimics the behavior of interp=’nearest’ as the
spanned phase difference approaches 180◦ (the phase of the interpolated complex calibration
value initially changes very slowly, then rapidly jumps to the second value at the midpoint of
the interval).
If the uncalibrated phase is changing rapidly, a ’nearest’ interpolation is not desirable. Usually,
interp=’linear’ is the best choice. For example,
interp = [ ’nearest’, ’linear’ ]
uses nearest “interpolation” on the first table, and linear on the second.
The spwmap parameter sets the spectral window combinations to form for the gaintable(s). This
is a list, or a list of lists, of integers giving the spw IDs to map. There is one list for each table in
gaintable, with an entry for each ID in the MS. For example,
CHAPTER 4. SYNTHESIS CALIBRATION
spwmap=[0,0,1,1]
145
# apply from spw=0 to 0,1 and 1 to 2,3
for an MS with spw=0,1,2,3. For multiple gaintable, use lists of lists, e.g.
spwmap=[ [0,0,1,1], [0,1,0,1] ] # 2nd table spw=0 to 0,2 and 1 to 1,3
BETA ALERT: This scheme for mapping the pre-apply tables is not particularly elegant, particularly for spwmap. This may change in the future.
4.4.1.5
Solving: solint, combine, preavg, refant, minblperant, minsnr
The parameters controlling common aspects of the solution are:
solint
combine
preavg
refant
minblperant
minsnr
=
=
=
=
=
=
’inf’
’’
-1.0
’’
4
0.0
#
#
#
#
#
#
Solution interval: egs. ’inf’, ’60s’ (see help)
Data axes which to combine for solve (scan, spw, and/or field)
Pre-averaging interval (sec) (rarely needed)
Reference antenna name:’’=no explicit reference
Minimum baselines _per antenna_ required for solve
Reject solutions below this SNR: 0==>no rejection
The solution interval is given by solint. If given a number without a unit, this is in seconds. The
special values ’inf’ and -1 specify an “infinite” solution interval encompassing the entire dataset,
while ’int’ or zero specify a solution every integration. aYou can use time quanta in the string,
e.g. solint=’1m’ and solint=’60s’ both specify solution intervals of one minute. Note that
solint interacts with combine to determine whether the solutions cross scan or field boundaries.
The parameter controlling the scope of the solution is combine. For the default combine=’’
solutions will break at scan, field, and spw boundaries. Specification of any of these in combine
will extend the solutions over the boundaries (up to the solint). For example, combine=’spw’
will combine spectral windows together for solving, while combine=’scan’ will cross scans. Thus,
to do scan-based solutions (single solution for each scan), set
solint = ’inf’
combine = ’’
while
solint = ’inf’
combine = ’scan’
will make a single solution for the entire dataset (for a given field and spw). You can specify
multiple choices for combination:
combine = ’scan,spw’
CHAPTER 4. SYNTHESIS CALIBRATION
146
for example.
The reference antenna is specified by the refant parameter. This useful to “lock” the solutions
with time, effectively rotating (after solving) the phase of the gain solution for the reference antenna
to be zero (the exact effect depends on the type of solution). You can also run without a reference
antenna, but in this case the solutions will float with time, with a phase that rotates around with
the relative weights of the antennas in the solution (its more or less like setting the weighted sum
of the antenna phases to zero). It is usually prudent to select an antenna in the center of the
array that is known to be particularly stable, as any gain jumps or wanders in the refant will be
transferred to the other antenna solutions.
Although rarely needed, setting a preavg time will let you average data over periods shorter than
the solution interval first before solving on longer timescales.
The minimum signal-to-noise ratio allowed for an acceptable solution is specified in the minsnr
parameter. BETA ALERT: Not all calibration tasks have this parameter.
The minblperant parameter sets the minimum number of baselines to other antennas that must
be preset for a given antenna to get a solution.
4.4.1.6
Action: append and solnorm
The following parameters control some things that happen after solutions are obtained:
solnorm
append
=
=
False
False
#
#
Normalize solution amplitudes post-solve.
Append solutions to (existing) table. False will overwrite.
The solnorm parameter toggles on the option to normalize the solution amplitudes after the solutions are obtained. The exact effect of this depends upon the type of solution. Not all tasks include
this parameter.
One should be aware when using solnorm that if this is done in the last stage of a chain of
calibration, then the part of the calibration that is “normalized” away will be lost. It is best to
use this in early stages (for example in a first bandpass calibration) so that later stages (such as
final gain calibration) can absorb the lost normalization scaling. It is not strictly necessary to
use solnorm=True at all, but is sometimes helpful if you want to have a normalized bandpass for
example.
The append parameter, if set to True, will append the solutions from this run to existing solutions in
caltable. Of course, this only matters if the table already exists. If append=False and caltable
exists, it will overwrite.
4.4.2
Spectral Bandpass Calibration (bandpass)
For channelized data, it is often desirable to solve for the gain variations in frequency as well as in
time. Variation in frequency arises as a result of non-uniform filter passbands or other dispersive
effects in signal transmission. It is usually the case that these frequency-dependent effects vary
CHAPTER 4. SYNTHESIS CALIBRATION
147
on timescales much longer than the time-dependent effects handled by the gain types ’G’ and ’T’.
Thus, it makes sense to solve for them as a separate term: ’B’, using the bandpass task.
The inputs to bandpass are:
#
bandpass :: Calculate a bandpass solution
vis
caltable
field
spw
selectdata
solint
combine
refant
minblperant
solnorm
bandtype
fillgaps
append
gaintable
gainfield
interp
spwmap
gaincurve
opacity
parang
async
=
=
=
=
=
=
=
=
=
=
=
=
=
=
=
=
=
=
=
=
=
’’
’’
’’
’’
False
’inf’
’scan’
’’
4
False
’B’
0
False
[’’]
[’’]
[’’]
[]
False
0.0
False
False
#
#
#
#
#
#
#
#
#
#
#
#
#
#
#
#
#
#
#
#
#
Nome of input visibility file
Name of output gain calibration table
Select field using field id(s) or field name(s)
Select spectral window/channels
Other data selection parameters
Solution interval
Data axes which to combine for solve (scan, spw, and/or field)
Reference antenna name
Minimum baselines _per antenna_ required for solve
Normalize average solution amplitudes to 1.0
Type of bandpass solution (B or BPOLY)
Fill flagged solution channels by interpolation
Append solutions to the (existing) table
Gain calibration table(s) to apply on the fly
Select a subset of calibrators from gaintable(s)
Interpolation mode (in time) to use for each gaintable
Spectral windows combinations to form for gaintables(s)
Apply internal VLA antenna gain curve correction
Opacity correction to apply (nepers)
Apply parallactic angle correction
if True run in the background, prompt is freed
Many of these parameters are in common with the other calibration tasks and are described above
in § 4.4.1.
The bandtype parameter selects the type of solution used for the bandpass. The choices are ’B’
and ’BPOLY’. The former solves for a complex gain in each channel in the selected part of the
MS. See § 4.4.2.2 for more on ’B’. The latter uses a polynomial as a function of channel to fit
the bandpass, and expands further to reveal a number of sub-parameters See § 4.4.2.3 for more on
’BPOLY’.
It is usually best to solve for the bandpass in channel data before solving for the gain as a function
of time. However, if the gains of the bandpass calibrator observations are fluctuating over the
timerange of those observations, then it can be helpful to first solve for the gains of that source
with gaincal , and input these to bandpass via gaintable. See more below on this strategy.
We now describe the issue of bandpass normalization, followed by a description of the options
bandtype=’B’ and bandtype=’BPOLY’.
4.4.2.1
Bandpass Normalization
The solnorm parameter (§ 4.4.1.6) deserves more explanation in the context of the bandpass. Most
users are used to seeing a normalized bandpass, where the vector sum of the antenna-based channel
CHAPTER 4. SYNTHESIS CALIBRATION
148
gains sums to unity amplitude and zero phase. The toggle solnorm=True allows this. However, the
parts of the bandpass solution normalized away will be still left in the data, and thus you should
not use solnorm=True if the bandpass calibration is the end of your calibration sequence (e.g. you
have already done all the gain calibration you want to). Note that setting solnorm=True will NOT
rescale any previous calibration tables that the user may have supplied in gaintable.
You can safely use solnorm=True if you do the bandpass first (perhaps after a throw-away initial
gain calibration) as we suggest above in § 4.2, as later gain calibration stages will deal with this
remaining calibration term. This does have the benefit of isolating the overall (channel independent)
gains to the following gaincal stage. It is also recommended for the case where you have multiple
scans on possibly different bandpass calibrators. It may also be preferred when applying the
bandpass before doing gaincal and then fluxscale (§ 4.4.4), as significant variation of bandpass
among antennas could otherwise enter the gain solution and make (probably subtle) adjustments
to the flux scale.
We finally note that solnorm=False at the bandpass step in the calibration chain will in the end
produce the correct results. It only means that there will be a part of what we usually think of the
gain calibration inside the bandpass solution, particularly if bandpass is run as the first step.
4.4.2.2
B solutions
Calibration type ’B’ differs from ’G’ only in that it is determined for each channel in each spectral
window. It is possible to solve for it as a function of time, but it is most efficient to keep the ’B’
solving timescale as long as possible, and use ’G’ or ’T’ for rapid frequency-independent time-scale
variations.
The ’B’ solutions are limited by the signal-to-noise ratio available per channel, which may be quite
small. It is therefore important that the data be coherent over the time-range of the ’B’ solutions.
As a result, ’B’ solutions are almost always preceded by an initial ’G’ or ’T’ solve using gaincal
(§ 4.4.3). In turn, if the ’B’ solution improves the frequency domain coherence significantly, a ’G’
or ’T’ solution following it will be better than the original.
For example, to solve for a ’B’ bandpass using a single short scan on the calibrator, then
default(’bandpass’)
vis = ’n5921.ms’
caltable = ’n5921.bcal’
gaintable = ’’
gainfield = ’’
interp = ’’
field = ’0’
spw = ’’
selectdata = False
gaincurve = False
opacity = 0.0
bandtype = ’B’
solint = ’inf’
# No gain tables yet
#
#
#
#
#
#
#
Calibrator 1331+305 = 3C286 (FIELD_ID 0)
all channels
No other selection
No gaincurve at L-band
No troposphere
standard time-binned B (rather than BPOLY)
set solution interval arbitrarily long
CHAPTER 4. SYNTHESIS CALIBRATION
refant = ’15’
149
# ref antenna 15 (=VLA:N2) (ID 14)
bandpass()
On the other hand, we might have a number of scans on the bandpass calibrator spread over time,
but we want a single bandpass solution. In this case, we could solve for and then pre-apply an
initial gain calibration, and let the bandpass solution cross scans:
gaintable = ’n5921.init.gcal’
gainfield = ’0’
interp = ’linear’
solint = ’inf’
combine = ’scan’
# Our previously determined G table
# Do linear interpolation
# One interval over dataset
# Solution crosses scans
Note that we obtained a bandpass solution for all channels in the MS. If explicit channel selection
is desired, for example some channels are useless and can be avoided entirely (e.g. edge channels
or those dominated by Gibbs ringing), then spw can be set to select only these channels, e.g.
spw = ’0:4~59’
# channels 4-59 of spw 0
This is not so critical for ’B’ solutions as for ’BPOLY’, as each channel is solved for independently,
and poor solutions can be dropped.
If you have multiple time solutions, then these will be applied using whatever interpolation scheme
is specified in later tasks.
The combine parameter (§ 4.4.1.5) can be used to combine data across spectral windows, scans,
and fields.
4.4.2.3
BPOLY solutions
For some observations, it may be the case that the SNR per channel is insufficient to obtain a
usable per-channel ’B’ solution. In this case it is desirable to solve instead for a best-fit functional
form for each antenna using the bandtype=’BPOLY’ solver. The ’BPOLY’ solver naturally enough
fits (Chebychev) polynomials to the amplitude and phase of the calibrator visibilities as a function
of frequency. Unlike ordinary ’B’, a single common ’BPOLY’ solution will be determined for all
spectral windows specified (or implicit) in the selection. As such, it is usually most meaningful to
select individual spectral windows for ’BPOLY’ solves, unless groups of adjacent spectral windows
are known a priori to share a single continuous bandpass response over their combined frequency
range (e.g., PdBI data).
The ’BPOLY’ solver requires a number of unique sub-parameters:
bandtype
degamp
degphase
visnorm
maskcenter
maskedge
=
=
=
=
=
=
’BPOLY’
3
3
False
0
0
#
#
#
#
#
#
Type of bandpass solution (B or BPOLY)
Polynomial degree for BPOLY amplitude solution
Polynomial degree for BPOLY phase solution
Normalize data prior to BPOLY solution
Number of channels in BPOLY to avoid in center of band
Percent of channels in BPOLY to avoid at each band edge
CHAPTER 4. SYNTHESIS CALIBRATION
150
The degamp and degphase parameters indicate the polynomial degree desired for the amplitude
and phase solutions. The maskcenter parameter is used to indicate the number of channels in the
center of the band to avoid passing to the solution (e.g., to avoid Gibbs ringing in central channels
for PdBI data). The maskedge drops beginning and end channels. The visnorm parameter turns
on normalization before the solution is obtained (rather than after for solnorm).
The combine parameter (§ 4.4.1.5) can be used to combine data across spectral windows, scans,
and fields.
Note that bandpass will allow you to use multiple fields, and can determine a single solution for
all specified fields using combine=’field’. If you want to use more than one field in the solution
it is prudent to use an initial gaincal using proper flux densities for all sources (not just 1Jy) and
use this table as an input to bandpass because in general the phase towards two (widely separated)
sources will not be sufficiently similar to combine them, and you want the same amplitude scale.
If you do not include amplitude in the initial gaincal, you probably want to set visnorm=True
also to take out the amplitude normalization change. Note also in the case of multiple fields,
that the ’BPOLY’ solution will be labeled with the field ID of the first field used in the ’BPOLY’
solution, so if for example you point plotcal at the name or ID of one of the other fields used in
the solution, plotcal does not plot.
For example, to solve for a ’BPOLY’ (5th order in amplitude, 7th order in phase), using data from
field 2, with G corrections pre-applied:
bandpass(vis=’data.ms’,
caltable=’cal.BPOLY’,
spw=’0:2~56’,
field=’0’,
bandtype=’BPOLY’,
degamp=5,
degphase=7,
gaintable=’cal.G’,
refant=’14’)
4.4.3
#
#
#
#
#
#
#
#
#
input data set
Use channels 3-57 (avoid end channels)
Select bandpass calibrater (field 0)
Select bandpass polynomials
5th order amp
7th order phase
Pre-apply gain solutions derived previously
Complex Gain Calibration (gaincal)
The fundamental calibration to be done on your interferometer data is to calibrate the antennabased gains as a function of time in the various frequency channels and polarizations. Some of these
calibrations are known beforehand (“a priori”) and others must be determined from observations
of calibrators, or from observations of the target itself (“self-calibration”).
It is best to have removed a (slowly-varying) “bandpass” from the frequency channels by solving
for the bandpass (see above). Thus, the bandpass calibration table would be input to gaincal via
the gaintable parameter (see below).
The gaincal task has the following inputs:
#
gaincal :: Determine temporal gains from calibrator observations:
CHAPTER 4. SYNTHESIS CALIBRATION
vis
caltable
field
spw
selectdata
solint
combine
preavg
refant
minblperant
minsnr
solnorm
gaintype
calmode
append
gaintable
gainfield
interp
spwmap
gaincurve
opacity
parang
async
=
=
=
=
=
=
=
=
=
=
=
=
=
=
=
=
=
=
=
=
=
=
=
’’
’’
’’
’’
False
’inf’
’’
-1.0
’’
4
0.0
False
’G’
’ap’
False
[’’]
[’’]
[’’]
[]
False
0.0
False
False
#
#
#
#
#
#
#
#
#
#
#
#
#
#
#
#
#
#
#
#
#
#
151
Nome of input visibility file
Name of output gain calibration table
Select field using field id(s) or field name(s)
Select spectral window/channels
Other data selection parameters
Solution interval (see help)
Data axes which to combine for solve (scan, spw, and/or field)
Pre-averaging interval (sec)
Reference antenna name
Minimum baselines _per antenna_ required for solve
Reject solutions below this SNR
Normalize average solution amplitudes to 1.0 (G, T only)
Type of gain solution (G, T, or GSPLINE)
Type of solution" (’ap’, ’p’, ’a’)
Append solutions to the (existing) table
Gain calibration table(s) to apply on the fly
Select a subset of calibrators from gaintable(s)
Interpolation mode (in time) to use for each gaintable
Spectral windows combinations to form for gaintables(s)
Apply internal VLA antenna gain curve correction
Opacity correction to apply (nepers)
Apply parallactic angle correction
Data selection is done through the standard field, spw and selectdata expandable sub-parameters
(see § 2.6). The bulk of the other parameters are the standard solver parameters. See § 4.4.1 above
for a description of these.
The gaintype parameter selects the type of gain solution to compute. The choices are ’T’, ’G’,
and ’GSPLINE’. The ’G’ and ’T’ options solve for independent complex gains in each solution
interval (classic AIPS style), with ’T’ enforcing a single polarization-independent gain for each
co-polar correlation (e.g. RR and LL, or XX and YY) and ’G’ having independent gains for these.
See § 4.4.3.1 for a more detailed description of ’G’ solutions, and § 4.4.3.2 for more on ’T’. The
’GSPLINE’ fits cubic splines to the gain as a function of time. See § 4.4.3.3 for more on this option.
4.4.3.1
Polarization-dependent Gain (G)
Systematic time-dependent complex gain errors are almost always the dominant calibration effect,
and a solution for them is almost always necessary before proceeding with any other calibration.
Traditionally, this calibration type has been a catch-all for a variety of similar effects, including: the
relative amplitude and phase gain for each antenna, phase and amplitude drifts in the electronics
of each antenna, amplitude response as a function of elevation (gain curve), and tropospheric
amplitude and phase effects. In CASA, it is possible to handle many of these effects separately, as
available information and circumstances warrant, but it is still possible to solve for the net effect
using calibration type G.
Generally speaking, type G can represent any per-spectral window multiplicative polarization- and
time-dependent complex gain effect downstream of the polarizers. (Polarization independent effects
CHAPTER 4. SYNTHESIS CALIBRATION
152
upstream of the polarizers may also be treated with G.) Multi-channel data (per spectral window)
will be averaged in frequency before solving (use calibration type B to solve for frequency-dependent
effects within each spectral window).
To solve for G on, say, fields 1 & 2, on a 90s timescale, and apply, e.g., gain curve corrections:
gaincal(’data.ms’,
caltable=’cal.G’,
field=’0,1’,
solint=90.0,
gaincurve=True
refant=3)
#
#
#
#
#
plotcal(’cal.G’,’amp’)
# Inspect solutions
Write solutions to disk file ’cal.G’
Restrict field selection
Solve for phase and amp on a 90s timescale
Note: gaincurve=False by default
These G solution will be referenced to antenna 4. Choose a well-behaved antenna that is located
near the center of the array for the reference antenna. For non-polarization datasets, reference
antennas need not be specified although you can if you want. If no reference antenna is specified,
an effective phase reference that is an average over the data will be calculated and used. For data
that requires polarization calibration, you must choose a reference antenna that has a constant
phase difference between the right and left polarizations (e.g. no phase jumps or drifts). If no
reference antenna (or a poor one) is specified, the phase reference may have jumps in the R–L phase,
and the resulting polarization angle response will vary during the observation, thus corrupting the
polarization imaging.
To apply this solution to the calibrators and the target source (field 2, say):
applycal(’data.ms’,
field=’0,1,2’,
opacity=0.0,
gaintable=’cal.G’)
# Restrict field selection (cals + src)
# Don’t apply opacity correction
# Apply G solutions and correct data
# (written to the CORRECTED_DATA column)
# Note: calwt=True by default
plotxy(’data.ms’,xaxis=’channel’,datacolum=’data’,subplot=211)
plotxy(’data.ms’,xaxis=’channel’,datacolumn=’corrected’,subplot=212)
4.4.3.2
Polarization-independent Gain (T)
At high frequencies, it is often the case that the most rapid time-dependent gain errors are introduced by the troposphere, and are polarization-independent. It is therefore unnecessary to solve for
separate time-dependent solutions for both polarizations, as is the case for ’G’. Calibration type
’T’ is available to calibrate such tropospheric effects, differing from ’G’ only in that a single common solution for both polarizations is determined. In cases where only one polarization is observed,
type ’T’ is adequate to describe the time-dependent complex multiplicative gain calibration.
In the following example, we assume we have a ’G’ solution obtained on a longish timescale (longer
than a few minutes, say), and we want a residual ’T’ solution to track the polarization-independent
variations on a very short timescale:
CHAPTER 4. SYNTHESIS CALIBRATION
gaincal(’data.ms’,
caltable=’cal.T’,
gaintype=’T’,
field=’0,1’,
solint=3.0,
gaintable=’cal120.G’)
#
#
#
#
#
#
153
Visibility dataset
Specify output table name
Solve for T
Restrict data selection to calibrators
Obtain solutions on a 3s timescale
Pre-apply prior G solution
For dual-polarization observations, it will always be necessary to obtain a ’G’ solution to account for
differences and drifts between the polarizations (which traverse different electronics), but solutions
for rapidly varying polarization-independent effects such as those introduced by the troposphere
will be optimized by using ’T’. Note that ’T’ can be used in this way for self-calibration purposes,
too.
4.4.3.3
GSPLINE solutions
At high radio frequencies, where tropospheric phase fluctuates rapidly, it is often the case that
there is insufficient signal-to-noise ratio to obtain robust ’G’ or ’T’ solutions on timescales short
enough to track the variation. In this case it is desirable to solve for a best-fit functional form for
each antenna using the ’GSPLINE’ solver. This fits a time-series of cubic B-splines to the phase
and/or amplitude of the calibrator visibilities.
The combine parameter (§ 4.4.1.5) can be used to combine data across spectral windows, scans, and
fields. Note that if you want to use combine=’field’, then all fields used to obtain a ’GSPLINE’
amplitude solution must have models with accurate relative flux densities. Use of incorrect relative
flux densities will introduce spurious variations in the ’GSPLINE’ amplitude solution.
The ’GSPLINE’ solver requires a number of unique additional parameters, compared to ordinary
’G’ and ’T’ solving. The sub-parameters are:
gaintype
splinetime
npointaver
phasewrap
=
=
=
=
’GSPLINE’
3600.0
3
180
#
#
#
#
Type of solution (G, T, or GSPLINE)
Spline (smooth) timescale (sec), default=1 hours
Points to average for phase wrap (okay)
Wrap phase when greater than this (okay)
The duration of each spline segment is controlled by splinetime. The actual splinetime will be
adjusted such that an integral number of equal-length spline segments will fit within the overall
range of data.
Phase splines require that cycle ambiguities be resolved prior to the fit; this operation is controlled
by npointaver and phasewrap. The npointaver parameter controls how many contiguous points
in the time-series are used to predict the cycle ambiguity of the next point in the time-series, and
phasewrap sets the threshold phase jump (in degrees) that would indicate a cycle slip. Large values
of npointaver improve the SNR of the cycle estimate, but tend to frustrate ambiguity detection if
the phase rates are large. The phasewrap parameter may be adjusted to influence when cycles are
detected. Generally speaking, large values (> 180◦ ) are useful when SNR is high and phase rates
are low. Smaller values for phasewrap can force cycle slip detection when low SNR conspires to
CHAPTER 4. SYNTHESIS CALIBRATION
154
obscure the jump, but the algorithm becomes significantly less robust. More robust algorithms for
phase-tracking are under development (including fringe-fitting).
For example, to solve for ’GSPLINE’ phase and amplitudes, with splines of duration 600 seconds,
gaincal(’data.ms’,
caltable=’cal.spline.ap’,
gaintype=’GSPLINE’
#
calmode=’ap’
#
field=’0,1’,
#
splinetime=600.)
#
Solve for GSPLINE
Solve for amp & phase
Restrict data selection to calibrators
Set spline timescale to 10min
BETA ALERT’: The ’GSPLINE’ solutions can not yet be used in fluxscale. You should do at
least some ’G’ amplitude solutions to establish the flux scale, then do ’GSPLINE’ in phase before
or after to fix up the short timescale variations. Note that the “phase tracking” algorithm in
’GSPLINE’ needs some improvement.
4.4.4
Establishing the Flux Density Scale (fluxscale)
The ’G’ or ’T’ solutions obtained from calibrators for which the flux density was unknown and
assumed to be 1 Jansky are correct in a time- and antenna- relative sense, but are mis-scaled by a
factor equal to the inverse of the square root of the true flux density. This scaling can be corrected
by enforcing the constraint that mean gain amplitudes determined from calibrators of unknown flux
density should be the same as determined from those with known flux densities. The fluxscale
task exists for this purpose.
The inputs for fluxscale are:
# fluxscale :: Bootstrap the flux density scale from standard calibrators
vis
=
’’
#
Name of input visibility file
caltable
=
’’
#
Name of input calibration table
fluxtable
=
’’
#
Name of output, flux-scaled calibration table
reference
=
’’
#
Reference field name(s) (transfer flux scale FROM)
transfer
=
’’
#
Transfer field name(s) (transfer flux scale TO), ’’ -> all
append
=
False
#
Append solutions?
refspwmap
=
[-1]
#
Scale across spectral window boundaries. See help fluxscale
async
=
False
# If true the taskname must be started using fluxscale(...)
Before running fluxscale, one must have first run setjy for the reference sources and run a
gaincal on both reference and transfer fields. After running fluxscale the output fluxtable
caltable will have been scaled such that the correct scaling will be applied to the transfer sources.
For example, given a ’G’ table, e.g. ’cal.G’, containing solutions for a flux density calibrator (in
this case ’3C286’) and for one or more gain calibrator sources with unknown flux densities (in this
example ’0234+285’ and ’0323+022’):
fluxscale(vis=’data.ms’,
caltable=’cal.G’,
# Select input table
CHAPTER 4. SYNTHESIS CALIBRATION
fluxtable= ’cal.Gflx’,
reference=’3C286’,
transfer=’0234+258, 0323+022’)
155
# Write scaled solutions to cal.Gflx
# 3C286 = flux calibrator
# Select calibrators to scale
The output table, ’cal.Gflx’, contains solutions that are properly scaled for all calibrators.
Note that the assertion that the gain solutions are independent of the calibrator includes the assumption that the gain amplitudes are strictly not systematically time dependent. While synthesis
antennas are designed as much as possible to achieve this goal, in practice, a number of effects
conspire to frustrate it. When relevant, it is advisable to pre-apply gaincurve and opacity corrections when solving for the ’G’ solutions that will be flux-scaled (see § 4.3 and § 4.4.1.3). When
the ’G’ solutions are essentially constant for each calibrator separately, the fluxscale operation is
likely to be robust.
The fluxscale task can be executed on either ’G’ or ’T’ solutions, but it should only be used on
one of these types if solutions exist for both and one was solved relative to the other (use fluxscale
only on the first of the two).
BETA ALERT: The ’GSPLINE’ option is not yet supported in fluxscale (see § 4.4.3.3).
If the reference and transfer fields were observed in different spectral windows, the refspwmap
parameter may be used to achieve the scaling calculation across spectral window boundaries.
The refspwmap parameter functions similarly to the standard spwmap parameter (§ 4.4.1.4), and
takes a list of indices indicating the spectral window mapping for the reference fields, such that
refspwmap[i]=j means that reference field amplitudes from spectral window j will be used for
spectral window i.
Note: You should be careful when you have a dataset with spectral windows with different bandwidths, and you have observed the calibrators differently in the different spw. The flux-scaling will
probably be different in windows with different bandwidths.
For example,
fluxscale(vis=’data.ms’,
caltable=’cal.G’,
fluxtable= ’cal.Gflx’,
reference=’3C286’,
transfer=’0234+258,0323+022’
refspwmap=[0,0,0])
#
#
#
#
#
Select input table
Write scaled solutions to cal.Gflx
3C286 = flux calibrator
Select calibrators to scale
Use spwid 0 scaling for spwids 1 & 2
will use spw=0 to scale the others, while in
fluxscale(vis=’data.ms’,
caltable=’cal.G’,
fluxtable=’cal.Gflx’,
reference=’3C286’,
transfer=’0234+285, 0323+022’,
refspwmap=[0,0,1,1])
# Select input table
# Write scaled solutions to cal.Gflx
# 3C286 = flux calibrator,
# select calibrators to scale,
# select spwids for scaling,
the reference amplitudes from spectral window 0 will be used for spectral windows 0 and 1 and
reference amplitudes from spectral window 2 will be used for spectral windows 2 and 3.
CHAPTER 4. SYNTHESIS CALIBRATION
4.4.4.1
156
Using Resolved Calibrators
If the flux density calibrator is resolved, the assumption that it is a point source will cause solutions
on outlying antennas to be biased in amplitude. In turn, the fluxscale step will be biased on
these antennas as well. In general, it is best to use model for the calibrator, but if such a model is
not available, it is important to limit the solution on the flux density calibrator to only the subset
of antennas that have baselines short enough that the point-source assumption is valid. This can
be done by using antenna and uvrange selection when solving for the flux density calibrator. For
example, if antennas 1 through 8 are the antennas among which the baselines are short enough
that the point-source assumption is valid, and we want to be sure to limit the solutions to the use
of baselines shorter than 15000 wavelengths, then we can assemble properly scaled solutions for the
other calibrator as follows (note: specifying both an antenna and a uvrange constraint prevents
inclusion of antennas with only a small number of baselines within the specified uvrange from being
included in the solution; such antennas will have poorly constrained solutions):
As an example, we first solve for gain solutions for the flux density calibrator (3C286 observed in
field 0) using a subset of antennas
gaincal(vis=’data.ms’,
caltable=’cal.G’,
field=’0’
selectdata=True,
antenna=’0~7’,
uvrange=’0~15klambda’,
solint=90)
#
#
#
#
#
#
#
write solutions to cal.G
Select the flux density calibrator
Expand other selectors
antennas 0-7,
limit uvrange to 0-15klambda
on 90s timescales, write solutions
to table called cal.G
Now solve for other calibrator (0234+285 in field 1) using all antennas (implicitly) and append
these solutions to the same table
gaincal(vis=’data.ms’,
caltable=’cal.G’,
field=’1’,
solint=90,
append=T)
# write solutions to cal.G
# Set up to write to the same table
Finally, run fluxscale to adjust scaling
fluxscale(vis=’data.ms’,
caltable=’cal.G’,
fluxtable=’cal.Gflx’,
reference=’3C286’,
transfer=’0234+285’)
#
#
#
#
Input table with unscaled cal solutions
Write scaled solutions to cal.Gflx
Use 3c286 as ref with limited uvrange
Transfer scaling to 0234+285
The fluxscale calculation will be performed using only the antennas common to both fields, but
the result will be applied to all antennas on the transfer field. Note that one can nominally get by
only with the uvrange selection, but you may find that you get strange effects from some antennas
only having visibilities to a subset of the baselines and thus causing problems in the solving.
CHAPTER 4. SYNTHESIS CALIBRATION
4.4.5
157
Instrumental Polarization Calibration (D,X)
BETA ALERT: The polcal task is now available as of Beta Patch 1. It is still undergoing
extensive testing, and only basic capabilities are currently provided.
The inputs to polcal are:
# polcal :: Determine instrumental polarization from calibrator observations
vis
=
’’
# Nome of input visibility file
caltable
=
’’
# Name of output gain calibration table
field
=
’’
# Select field using field id(s) or field name(s)
spw
=
’’
# Select spectral window/channels
selectdata =
False
# Other data selection parameters
solint
=
’inf’
# Solution interval
combine
=
’scan’
# Data axes which to combine for solve (scan, spw, and/or field)
preavg
=
300.0
# Pre-averaging interval (sec)
refant
=
’’
# Reference antenna name
minblperant =
4
# Minimum baselines _per antenna_ required for solve
minsnr
=
0.0
# Reject solutions below this SNR
poltype
=
’D+QU’
# Type of instrumental polarization solution (see help)
append
=
False
# Append solutions to the (existing) table
gaintable
=
[’’]
# Gain calibration table(s) to apply
gainfield
=
[’’]
# Select a subset of calibrators from gaintable(s)
interp
=
[’’]
# Interpolation mode (in time) to use for each gaintable
spwmap
=
[]
# Spectral windows combinations to form for gaintables(s)
gaincurve
=
False
# Apply internal VLA antenna gain curve correction
opacity
=
0.0
# Opacity correction to apply (nepers)
async
=
False
The polcal task uses many of the standard calibration parameters as described above in § 4.4.1.
The key parameter controlling polcal is poltype. The choices are:
’D’ — Solve for instrumental polarization (leakage D-terms), using the transform of an IQU
model in MODEL DATA; requires no parallactic angle coverage, but if the source polarization is
non-zero, the gain calibration must have the correct R-L phase registration. (Note: this is
unlikely, so just use ’D+X’ to let the position angle registration float.) This will produce a
calibration table of type D.
’D+X’ — Solve for instrumental polarization D-terms and the polarization position angle correction, using the transform of an IQU model in MODEL DATA; this mode requires at least 2
distinct parallactic angles to separate the net instrumental polarization and the PA. This
will produce a calibration table of type ’D’. BETA ALERT: no table of type ’X’ will be
produced, so you must follow this by a run of polcal with polmode=’X’ (see below).
’D+QU’ — Solve for instrumental polarization and source Q + iU ; requires at least 3 distinct
parallactic angles to separate the net instrumental polarization from the source Q and U.
Effectively sets the polarization PA to the value if the R-L phase difference were 0◦ . This will
produce a calibration table of type ’D’.
CHAPTER 4. SYNTHESIS CALIBRATION
158
’X’ — Solve only for the position angle correction; best to use this after getting the D-terms from
one of the above modes. Requires the observation of a calibrator with known Q + iU (or at
least known U/Q). This will produce a calibration table of type ’X’.
There are channelized solution modes for the above options. For example, substitute ’Df’ for ’D’
in the ’D*’ modes described above to get a channelized D-term solution. BETA ALERT: ’X’
solutions are currently always frequency-independent.
BETA ALERT: polcal will obtain a separate D-term solution for each field supplied to it. This
limitation will be relaxed in the future, enabling more sensitive solutions, as well as flexibilities like
solving for ’D+X’ using a single scan each of two or more position angle calibrators.
4.4.5.1
Heuristics and Strategies for Polarization Calibration
Fundamentally, with good ordinary gain (and bandpass, if relevant) calibration already in hand,
good polarization calibration must deliver both the instrumental polarization and position angle
calibration. An unpolarized source can deliver only the first of these, but does not require parallactic angle coverage. A polarized source can only deliver the position angle calibration also if its
polarization is known a priori. Sources that are polarized, but with unknown polarization, must
always be observed with sufficient parallactic angle coverage, where ”sufficient” is determined by
SNR and the details of the solving mode.
These principles are stated assuming the instrumental polarization solution is solved using the
”linear approximation” where cross-terms in more than a single product of the instrumental or
source polarizations are ignored in the Measurement Equation (see § E). A general non-linearized
solution, with sufficient SNR, may enable some relaxation of the requirements indicated here.
For instrumental polarization calibration, there are 3 types of calibrator choice:
CASA Polarization Calibration Modes
Cal Polarization
unpolarized
known non-zero
unknown
Parallactic Angles
any
2+ scans
3+ scans
MODEL DATA
set Q = U = 0
set Q, U
ignored
polmode
’D’ or ’Df’
’D+X’ or ’Df+X’
’D+QU’ or ’Df+QU’
Result
D-terms only
D-terms and PA
D-terms and source
Note that the parallactic angle ranges spanned by the scans in the modes that require this should
be large enough to give good separation between the components of the solution. In practice, 60◦
is a good target.
Each of these solutions should be followed with a ’X’ solution on a source with known polarization
position angle (and correct Q + iU in MODEL DATA). BETA ALERT: polmode=’D+X’ will soon
deliver this automatically.
The polcal task will solve for the ’D’ or ’X’ terms using the model visibilities that are in the
MODEL DATA column of the MS. Calibration of the parallel hands must have already been carried
out using gaincal and/or bandpass in order to align the phases over time and frequency. This
CHAPTER 4. SYNTHESIS CALIBRATION
159
calibration need not have been applied and can be supplied through the gaintable parameters,
but any cal-tables to be used in polcal must agree (e.g. have been derived from) the data in the
DATA column and the model visibilities in the MODEL DATA column of the MS. Thus, for example,
one would not use the cal-table produced by fluxscale as the rescaled amplitudes would no longer
agree with the contents of MODEL DATA.
Be careful when using resolved calibrators for polarization calibration. A particular problem is if
the structure in Q and U is offset from that in I. Use of a point model, or a resolved model for I
but point models for Q and U, can lead to errors in the ’X’ calibration. Use of a uvrange will
help here. The use of a full-Stokes model with the correct polarization is the only way to ensure a
correct calibration if these offsets are large.
4.4.5.2
A Polarization Calibration Example
In the following example, we do a standard ’D+QU’ solution on the bright source BLLac (2202+422)
which has been tracked through a range in parallactic angle:
default(’polcal’)
vis
caltable
field
spw
solint
combine
preavg
refant
minsnr
poltype
gaintable
gainfield
polcal()
=
=
=
=
=
=
=
=
=
=
=
=
’polcal_20080224.cband.all.ms’
’polcal_20080224.cband.all.pcal’
’2202+422’
’’
’inf’
’scan’
300.0
’VA15’
3
’D+QU’
’polcal_20080224.cband.all.gcal’
[’’]
This assumes setjy and gaincal have already been run. Note that the original gain-calibration
table is used in gaintable so that what is in the MODEL DATA column is in agreement with what is
in the gaintable, rather than using the table resulting from fluxscale.
A bit later on, we need to set the R-L phase using a scan on 3C48 (0137+331):
default(’polcal’)
vis
= ’polcal_20080224.cband.all.ms’
caltable
= ’polcal_20080224.cband.all.polx’
field
= ’0137+331’
refant
=
’VA15’
minsnr
=
3
poltype
=
’X’
gaintable = [’polcal_20080224.cband.all.gcal’, ’polcal_20080224.cband.all.pcal’]
polcal()
CHAPTER 4. SYNTHESIS CALIBRATION
160
If, on the other hand, we had a scan on an unpolarized bright source, for example 3C84 (0319+415),
we could use this to calibrate the leakages:
default(’polcal’)
vis
caltable
field
refant
poltype
gaintable
polcal()
=
=
=
=
=
=
’polcal_20080224.cband.all.ms’
’polcal_20080224.cband.all_3c84.pcal’
’0319+415’
’VA15’
’D’
’polcal_20080224.cband.all.gcal’
We would then do the ’X’ calibration as before (but using this D-table in gaintable).
A full processing example for continuum polarimetry can be found in § F.2.
4.4.6
Baseline-based Calibration (blcal)
BETA ALERT: The blcal task has not had extensive testing, and is included as part of our
support for the ALMA and EVLA commissioning efforts.
You can use the blcal task to solve for baseline-dependent (non-closing) errors. WARNING:
this is in general a very dangerous thing to do, since baseline-dependent errors once introduced are
difficult to remove. You must be sure you have an excellent model for the source (better than the
magnitude of the baseline-dependent errors).
The inputs are:
# blcal :: Calculate a baseline-based calibration solution (gain or bandpass)
vis
=
’’
# Nome of input visibility file
caltable
=
’’
# Name of output gain calibration table
field
=
’’
# Select field using field id(s) or field name(s)
spw
=
’’
# Select spectral window/channels
selectdata
=
False
# Other data selection parameters
solint
=
’inf’
# Solution interval
combine
=
’’
# Data axes which to combine for solve (scan, spw, and/or field)
freqdep
=
False
# Solve for frequency dependent solutions
calmode
=
’ap’
# Type of solution" (’ap’, ’p’, ’a’)
solnorm
=
False
# Normalize average solution amplitudes to 1.0
gaintable
=
[’’]
# Gain calibration table(s) to apply on the fly
gainfield
=
[’’]
# Select a subset of calibrators from gaintable(s)
interp
=
[’’]
# Interpolation mode (in time) to use for each gaintable
spwmap
=
[]
# Spectral windows combinations to form for gaintables(s)
gaincurve
=
False
# Apply internal VLA antenna gain curve correction
opacity
=
0.0
# Opacity correction to apply (nepers)
parang
=
False
# Apply parallactic angle correction
async
=
False
# If true the taskname must be started using blcal(...)
CHAPTER 4. SYNTHESIS CALIBRATION
161
The freqdep parameter controls whether blcal solves for “gain” (freqdep=True) or “bandpass”
(freqdep=False) style calibration.
Other parameters are the same as in other calibration tasks. These common calibration parameters
are described in § 4.4.1.
4.4.7
EXPERIMENTAL: Fringe Fitting (fringecal)
BETA ALERT: The fringecal task has not had extensive testing, and is included as part of our
support for the ALMA commissioning effort.
The fringecal task provides the capability for solving for baseline-based phase, phase-delay, and
delay-rate terms in the gains (G-type). This is not full antenna-based “fringe-fitting” as is commonly
used in VLBI. The main use is to calibrate ALMA or EVLA commissioning data where the delays
may be improperly set, and to test “fringe” solutions as a way for dealing with non-dispersive
atmospheric terms.
The inputs are:
#
fringecal :: BL-based fringe-fitting solution:
vis
caltable
field
spw
selectdata
gaincurve
opacity
gaintable
gainfield
solint
refant
async
=
=
=
=
=
=
=
=
=
=
=
=
’’
’’
’’
’’
False
False
0.0
’’
’’
0.0
’’
False
#
#
#
#
#
#
#
#
Name of input visibility file (MS)
Name of output bandpass calibration table
Select data based on field name or index
Select data based on spectral window
Activate data selection details
Apply VLA antenna gain curve correction
Opacity correction to apply (nepers)
Gain calibration solutions to apply
#
#
#
Solution interval (sec)
Reference antenna
if True run in the background, prompt is freed
All of the fringecal parameters are common calibration parameters as described in § 4.4.1.
BETA ALERT: This task has not been updated to use the new standard solint and combine
syntax. Also note that plotcal cannot currently display ’delay’ or delayrate solutions from
fringecal.
4.5
Plotting and Manipulating Calibration Tables
At some point, the user should examine (plotting or listing) the calibration solutions. Calibration tables can also be manipulated in various ways, such as by interpolating between times (and
sources), smoothing of solutions, and accumulating various separate calibrations into a single table.
CHAPTER 4. SYNTHESIS CALIBRATION
4.5.1
162
Plotting Calibration Solutions (plotcal)
The plotcal task is available for examining solutions of all of the basic solvable types (G, T, B,
D, M, MF, K). The inputs are:
#
plotcal :: An all-purpose plotter for calibration results:
caltable
xaxis
yaxis
poln
field
antenna
spw
timerange
subplot
overplot
clearpanel
iteration
plotrange
showflags
plotsymbol
plotcolor
markersize
fontsize
showgui
figfile
=
=
=
=
=
=
=
=
=
=
=
=
=
=
=
=
=
=
=
=
’’
’’
’’
’’
’’
’’
’’
’’
111
False
’Auto’
’’
[]
False
’.’
’blue’
5.0
10.0
True
’’
#
#
#
#
#
#
#
#
#
#
#
#
#
#
#
#
#
#
#
#
Name of input calibration table
Value to plot along x axis (time,chan,amp,phase,real,imag,snr)
Value to plot along y axis (amp,phase,real,imag,snr)
Polarization to plot (RL,R,L,XY,X,Y,/)
Field names or index: ’’=all, ’3C286,P1321*’, ’0~3’
Antenna selection. E.g., antenna=’3~5’
Spectral window: ’’=all, ’0,1’ means spw 0 and 1
Time selection ’’=all
Panel number on display screen (yxn)
Overplot solutions on existing display
Specify if old plots are cleared or not
Iterate on antenna,time,spw,field
plot axes ranges: [xmin,xmax,ymin,ymax]
If true, show flags
pylab plot symbol
initial plotting color
size of plot symbols
size of label font
Show plot on gui
’’= no plot hardcopy, otherwise supply name
BETA ALERT: Currently, plotcal needs to know the MS from which caltable was derived
to get indexing information. It does this using the name stored inside the table, which does not
include the full path, but assumes the MS is in the cwd. Thus if you are using a MS in a directory
other than the current one, it will not find it. You need to change directories using cd in IPython
(or os.chdir() inside a script) to the MS location.
The controls for the plotcal window are the same as for plotxy (see § 3.4.1).
The xaxis and yaxis plot options available are:
• ’amp’ — amplitude,
• ’phase’ — phase,
• ’real’ – the real part,
• ’imag’ — the imaginary part,
• ’snr’ – the signal-to-noise ratio,
of the calibration solutions that are in the caltable. The xaxis choices also include ’time’ and
’channel’ which will be used as the sensible defaults (if xaxis=’’) for gain and bandpass solutions
respectively.
CHAPTER 4. SYNTHESIS CALIBRATION
163
The poln parameter determines what polarization or combination of polarization is being plotted.
The poln=’RL’ plots both R and L polarizations on the same plot. The respective XY options
do equivalent things. The poln=’/’ option plots amplitude ratios or phase differences between
whatever polarizations are in the MS (R and L. or X and Y).
The field, spw, and antenna selection parameters are available to obtain plots of subsets of
solutions. The syntax for selection is given in § 2.6.
The subplot parameter is particularly helpful in making multi-panel plots. The format is subplot=yxn
where yxn is an integer with digit y representing the number of plots in the y-axis, digit x the number of panels along the x-axis, and digit n giving the location of the plot in the panel array (where
n = 1, ..., xy, in order upper left to right, then down). See § 3.4.3.6 for more details on this
option.
The iteration parameter allows you to select an identifier to iterate over when producing multipanel plots. The choices for iteration are: ’antenna’, ’time’, ’spw’, ’field’. For example, if
per-antenna solution plots are desired, use iteration=’antenna’. You can then use subplot to
specify the number of plots to appear on each page. In this case, set the n to 1 for subplot=yxn.
Use the Next button on the plotcal window to advance to the next set of plots. Note that if there
is more than one timestamp in a ’B’ table, the user will be queried to interactively advance the
plot to each timestamp, or if multiplot=True, the antennas plots will be cycled through for each
timestamp in turn. Note that iteration can take more than one iteration choice (as a single string
containing a comma-separated list of the options). BETA ALERT: the iteration order is fixed
(independent of the order specified in the iteration string), for example:
iteration = ’antenna, time, field’
iteration = ’time, antenna, field’
will both iterate over each field (fastest) then time (next) and antenna (slowest). The order is:
iteration = ’antenna, time, field, spw’
from the slowest (outer loop) to fastest (inner loop).
The markersize and fontsize parameters are especially helpful in making the dot and label sizes
appropriate for the plot being made. The screen shots in this section used this feature to make the
plots more readable in the cookbook. Adjusting the fontsize can be tricky on multi-panel plots,
as the labels can run together if too large. You can also help yourself by manually resizing the
Plotter window to get better aspect ratios on the plots.
BETA ALERT: Unfortunately, plotcal has many of the same problems that plotxy does, as
they use similar code underneath. An overhaul is underway, so stay tuned.
4.5.1.1
Examples for plotcal
For example, to plot amplitude or phase as a function of time for ’G’ solutions (after rescaling by
fluxscale for the NGC5921 “demo” data (see Appendix F.1),
CHAPTER 4. SYNTHESIS CALIBRATION
default(’plotcal’)
fontsize = 14.0
markersize = 10.0
164
# Make labels larger
# Make dots bigger
caltable = ’ngc5921.usecase.fluxscale’
yaxis = ’amp’
subplot = 211
plotcal()
yaxis = ’phase’
subplot = 212
plotcal()
The results are shown in Figure 4.3. This makes use of the subplot option to make multi-panel
displays.
Figure 4.3: Display of the amplitude (upper) and phase (lower) gain solutions for all antennas and
polarizations in the ngc5921 post-fluxscale table.
CHAPTER 4. SYNTHESIS CALIBRATION
165
Similarly, to plot amplitude or phase as a function of channel for ’B’ solutions for NGC5921:
default(’plotcal’)
fontsize = 14.0
markersize = 10.0
# Make labels larger
# Make dots bigger
caltable = ’ngc5921.usecase.bcal’
antenna = ’1’
yaxis = ’amp’
subplot = 311
plotcal()
yaxis = ’phase’
subplot = 312
plotcal()
yaxis = ’snr’
subplot = 313
plotcal()
The results are shown in Figure 4.4. This stacks three panels with amplitude, phase, and signalto-noise ratio. We have picked antenna=’1’ to show.
For example, to show 6 plots per page of ’B’ amplitudes on a 3 × 2 grid:
default(’plotcal’)
fontsize = 12.0
markersize = 10.0
# Make labels just large enough
# Make dots bigger
caltable = ’ngc5921.usecase.bcal’
yaxis = ’amp’
subplot = 231
iteration = ’antenna’
plotcal()
See Figure 4.5 for this example. This uses the iteration parameter.
BETA ALERT: Note that plotcal cannot currently display ’delay’ or delayrate solutions
from fringecal.
4.5.2
Listing calibration solutions with (listcal)
The listcal task will list the solutions in a specified calibration table.
The inputs are:
#
listcal :: List data set summary in the logger:
CHAPTER 4. SYNTHESIS CALIBRATION
166
Figure 4.4: Display of the amplitude (upper), phase (middle), and signal-to-noise ratio (lower) of
the bandpass ’B’ solutions for antenna=’0’ and both polarizations for ngc5921. Note the falloff
of the SNR at the band edges in the lower panel.
vis
caltable
field
antenna
spw
listfile
pagerows
async
=
=
=
=
=
=
=
=
’’
’’
’’
’’
’’
’’
0
False
#
#
#
#
#
#
#
Name of input visibility file (MS)
Input calibration table to list
Select data based on field name or index
Select data based on antenna name or index
Spectral window, channel to list
Disk file to write, else to terminal
Rows listed per page
An example listing is:
Listing CalTable: jupiter6cm.usecase.split.ms.smoothcal2
(G Jones)
---------------------------------------------------------------
CHAPTER 4. SYNTHESIS CALIBRATION
167
Figure 4.5: Display of the amplitude of the bandpass ’B’ solutions. Iteration over antennas was
turned on using iteration=’antenna’. The first page is shown. The user would use the Next
button to advance to the next set of antennas.
SpwId = 0, channel =
Time
--------------------1999/04/16/14:10:43.5
0.
Field
Ant
---------- -------’JUPITER’ ’1’
’2’
’3’
’4’
’5’
’6’
’7’
’8’
’9’
’10’
’11’
:
:
:
:
:
:
:
:
:
:
:
:
Amp
Phase
--------------1.016
-11.5
1.013
-5.3
0.993
-0.8
0.997
-10.7
0.985
-2.7
1.005
-8.4
0.894
-8.7
1.001
-0.1
0.989
-12.4
1.000F
-4.2F
0.896
-0.0
Amp
Phase
--------------1.016
-9.2
0.993
-3.1
0.990
-5.1
0.999
-8.3
0.988
-4.0
1.009
-5.3
0.897
-6.8
0.992
-0.7
0.992
-13.5
1.000F
-3.2F
0.890
-0.0
CHAPTER 4. SYNTHESIS CALIBRATION
’12’
’13’
’14’
’15’
’16’
’17’
’18’
’19’
’20’
’21’
’22’
’23’
’24’
’25’
’26’
’27’
’28’
168
:
:
:
:
:
:
:
:
:
:
:
:
:
:
:
:
:
0.996
1.009
0.993
1.002
1.010
1.014
0.998
0.997
0.984
1.000F
1.003
1.007
1.000F
1.000F
0.992
0.994
0.993
-10.6
-8.4
-17.6
-0.8
-9.9
-8.0
-3.0
-39.1
-5.7
-4.2F
-11.8
-13.8
-4.2F
-4.2F
3.7
-5.6
-10.7
0.996
1.011
0.994
1.002
1.012
1.017
1.005
0.994
0.986
1.000F
1.004
1.009
1.000F
1.000F
1.000
0.991
0.997
-4.2
-6.1
-16.1
-1.1
-8.6
-7.1
-1.0
-38.9
3.0
-3.2F
-10.4
-11.7
-3.2F
-3.2F
-0.2
-4.3
-3.8
BETA ALERT: It is likely that the format of this listing will change to better present it to the
user.
4.5.3
Calibration Smoothing (smoothcal)
The smoothcal task will smooth calibration solutions (most usefully G or T ) over a longer time
interval to reduce noise and outliers. The inputs are:
#
smoothcal :: Smooth calibration solution(s) derived from one or more sources:
vis
tablein
caltable
field
smoothtype
smoothtime
async
=
=
=
=
=
=
=
’’
’’
’’
’’
’median’
60.0
False
#
#
#
#
#
#
#
Name of input visibility file
Input calibration table
Output calibration table
Field name list
Smoothing filter to use
Smoothing time (sec)
if True run in the background, prompt is freed
The smoothing will use the smoothtime and smoothtype parameters to determine the new data
points which will replace the previous points on the same time sampling grid as for the tablein
solutions. The currently supported smoothtype options:
• ’mean’ — use the mean of the points within the window defined by smoothtime (a “boxcar”
average),
• ’median’ — use the median of the points within the window defined by smoothtime (most
useful when many points lie in the interval).
CHAPTER 4. SYNTHESIS CALIBRATION
169
Note that smoothtime defines the width of the time window that is used for the smoothing.
BETA ALERT: Note that smoothcal currently smooths by field and spw, and thus you cannot
smooth solutions from different sources or bands together into one solution.
Figure 4.6: The ’amp’ of gain solutions for NGC4826 before (top) and after (bottom) smoothing
with a 7200 sec smoothtime and smoothtype=’mean’. Note that the first solution is in a different
spw and on a different source, and is not smoothed together with the subsequent solutions.
An example using the smoothcal task to smooth an existing table:
smoothcal(’n4826_16apr.ms’,
tablein=’n4826_16apr.gcal’,
caltable=’n4826_16apr.smoothcal’,
smoothtime=7200.,
smoothtype=’mean’)
# Plot up before and after tables
plotcal(’n4826_16apr.gcal’,’’,’amp’,antenna=’1’,subplot=211)
CHAPTER 4. SYNTHESIS CALIBRATION
170
plotcal(’n4826_16apr.smoothcal’,’’,’amp’,antenna=’1’,subplot=212)
This example uses 2 hours (7200 sec) for the smoothing time and smoothtype=’mean’. The plotcal
results are shown in Figure 4.6.
4.5.4
Calibration Interpolation and Accumulation (accum)
The accum task is used to interpolate calibration solutions onto a different time grid, and to
accumulate incremental calibrations into a cumulative calibration table.
Its inputs are:
#
accum :: Accumulate incremental calibration solutions
vis
tablein
accumtime
=
=
=
’’
’’
1.0
#
#
#
Name of input visibility file
Input (cumulative) calibration table; use ’’ on first run
Timescale on which to create cumulative table
incrtable
caltable
field
calfield
interp
spwmap
=
=
=
=
=
=
’’
’’
’’
’’
’linear’
[-1]
#
#
#
#
#
#
Input incremental calibration table to add
Output (cumulative) calibration table
List of field names to process from tablein.
List of field names to use from incrtable.
Interpolation mode to use for resampling incrtable solutions
Spectral window combinations to apply
The mapping implied here is
tablein + incrtable => caltable
(mathematically the cal solutions are multiplied as complex numbers as per the Measurement
Equation). The tablein is optional (see below). You must specify an incrtable and a caltable.
The tablein parameter is used to specify the existing cumulative calibration table to which an
incremental table is to be applied. Initially, no such table exists, and if tablein=’’ then accumulate will generate one from scratch (on-the-fly), using the timescale (in seconds) specified by
the sub-parameter accumtime. These nominal solutions will be unit-amplitude, zero-phase calibration, ready to be adjusted by accumulation according to the settings of other parameters. When
accumtime is negative (the default), the table name specified in tablein must exist and will be
used. If tablein is specified, then the entries in that table will be used.
The incrtable parameter is used to specify the incremental table that should be applied to
tablein. The calibration type of incrtable sets the type assumed in the operation, so tablein
(if specified) must be of the same type. If it is not, accum will exit with an error message. (Certain
combinations of types and subtypes will be supported by accum in the future.)
The caltable parameter is used to specify the name of the output table to write. If un-specified
(’’), then tablein will be overwritten. Use this feature with care, since an error here will require
building up the cumulative table from the most recent distinct version (if any).
CHAPTER 4. SYNTHESIS CALIBRATION
171
The field parameter specifies those field names in tablein to which the incremental solution
should be applied. The solutions for other fields will be passed to caltable unaltered. If the
cumulative table was created from scratch in this run of accumulate, then the solutions for these
other fields will be unit-amplitude, zero-phase, as described above.
The calfield parameter is used to specify the fields to select from incrtable to use when applying
to tablein. Together, use of field and calfield permit completely flexible combinations of
calibration accumulation with respect to fields. Multiple runs of accum can be used to generate a
single table with many combinations. In future, a ’self’ mode will be enabled that will simplify
the accumulation of field-specific solutions.
The spwmap parameter gives the mapping of the spectral windows in the incrtable onto those in
tablein and caltable. The syntax is described in § 4.4.1.4.
The interp parameter controls the method used for interpolation. The options are (currently):
’nearest’, ’linear’, and ’aipslin’. These are described in § 4.4.1.4. For most purposes, the
’linear’ option should suffice.
We now describe the two uses of accum.
4.5.4.1
Interpolation using (accum)
Calibration solutions (most notably G or T ) can be interpolated onto the timestamps of the science
target observations using accum.
The following example uses accum to interpolate an existing table onto a new time grid:
accum(vis=’n4826_16apr.ms’,
tablein=’’,
accumtime=20.0,
incrtable=’n4826_16apr.gcal’,
caltable=’n4826_16apr.20s.gcal’,
interp=’linear’,
spwmap=[0,1,1,1,1,1])
plotcal(’n4826_16apr.gcal’,’’,’phase’,antenna=’1’,subplot=211)
plotcal(’n4826_16apr.20s.gcal’,’’,’phase’,antenna=’1’,subplot=212)
See Figure 4.7 for the plotcal results. The data used in this example is BIMA data (single polarization YY) where the calibrators were observed in single continuum spectral windows (spw=’0,1’)
and the target NGC4826 was observed in 64-channel line windows (spw=’2,3,4,5’). Thus, it is
necessary to use spwmap=[0,1,1,1,1,1] to map the bandpass calibrator in spw=’0’ onto itself,
and the phase calibrator in spw=’1’ onto the target source in spw=’2,3,4,5’.
4.5.4.2
Incremental Calibration using (accum)
It is occasionally desirable to solve for and apply calibration incrementally. This is the case when
a calibration table of a certain type already exists (from a previous solve), a solution of the same
CHAPTER 4. SYNTHESIS CALIBRATION
172
Figure 4.7: The ’phase’ of gain solutions for NGC4826 before (top) and after (bottom) ’linear’
interpolation onto a 20 sec accumtime grid. The first scan was 3C273 in spw=’0’ while the calibrator
scans on 1331+305 were in spw=’1’. The use of spwmap was necessary to transfer the interpolation
correctly onto the NGC4826 scans.
type and incremental relative to the first is required, and it is not possible or convenient to recover
the cumulative solution by a single solve.
Much of the time, it is, in fact, possible to recover the cumulative solution. This is because the
equation describing the solution for the incremental solution (using the original solution), and that
describing the solution for their product are fundamentally the same equation—the cumulative
solution, if unique, must always be the same no matter what initial solution is. One circumstance
where an incremental solution is necessary is the case of phase-only self-calibration relative to a full
amplitude and phase calibration already obtained (from a different field).
For example, a phase-only ’G’ self-calibration on a target source may be desired to tweak the full
amplitude and phase ’G’ calibration already obtained from a calibrator. The initial calibration
(from the calibrator) contains amplitude information, and so must be carried forward, yet the
CHAPTER 4. SYNTHESIS CALIBRATION
173
phase-only solution itself cannot (by definition) recover this information, as a full amplitude and
phase self-calibration would. In this case, the initial solution must be applied while solving for the
phase-only solution, then the two solutions combined to form a cumulative calibration embodying
the net effect of both. In terms of the Measurement Equation, the net calibration is the product
of the initial and incremental solutions.
Cumulative calibration tables also provide a means of generating carefully interpolated calibration,
on variable user-defined timescales, that can be examined prior to application to the data with
applycal. The solutions for different fields and/or spectral windows can be interpolated in different
ways, with all solutions stored in the same table.
The only difference between incremental and cumulative
calibration tables is that incremental tables are generated directly from the calibration solving tasks (gaincal,
bandpass, etc), and cumulative tables are generated from
other cumulative and incremental tables via accum. In all
other respects (internal format, application to data with
applycal, plotting with plotcal, etc.), they are the same,
and therefore interchangeable. Thus, accumulate and cumulative calibration tables need only be used when circumstances require it.
Other Packages:
The analog of accum in classic AIPS
is the use of CLCAL to combine a series of (incremental) SN calibration
tables to form successive (cumulative) CL calibration tables. AIPS
SN/CL tables are the analog of ’G’
tables in CASA.
The accum task represents a generalization on the classic AIPS CLCAL (see sidebox) model of
cumulative calibration in that its application is not limited to accumulation of ’G’ solutions. In
principle, any basic calibration type can be accumulated (onto itself), as long as the result of the
accumulation (matrix product) is of the same type. This is true of all the basic types, except
’D’. Accumulation is currently supported for ’B’, ’G’, and ’T’, and, in future, ’F’ (ionospheric
Faraday rotation), delay-rate, and perhaps others. Accumulation of certain specialized types (e.g.,
’GSPLINE’, ’TOPAC’, etc.) onto the basic types will be supported in the near future. The treatment
of various calibration from ancillary data (e.g., system temperatures, weather data, WVR, etc.), as
they become available, will also make use of accumulate to achieve the net calibration.
Note that accumulation only makes sense if treatment of a uniquely incremental solution is required
(as described above), or if a careful interpolation or sampling of a solution is desired. In all other
cases, re-solving for the type in question will suffice to form the net calibration of that type. For
example, the product of an existing ’G’ solution and an amplitude and phase ’G’ self-cal (solved
with the existing solution applied), is equivalent to full amplitude and phase ’G’ self-cal (with no
prior solution applied), as long as the timescale of this solution is at least as short as that of the
existing solution.
One obvious application is to calibrate the amplitudes and phases on different timescales during
self-calibration. Here is an example, using the Jupiter VLA 6m continuum imaging example (see
Appendix F.2):
# Put clean model into MODEL_DATA column
ft(vis=’jupiter6cm.usecase.split.ms’,
model=’jupiter6cm.usecase.clean1.model’)
CHAPTER 4. SYNTHESIS CALIBRATION
174
# Phase only self-cal on 10s timescales
gaincal(vis=’jupiter6cm.usecase.split.ms’,
caltable=’jupiter6cm.usecase.phasecal1’,
gaintype=’G’,
calmode=’p’,
refant=’6’,
solint=10.0,
minsnr=1.0)
# Plot up solution phase and SNR
plotcal(’jupiter6cm.usecase.phasecal1’,’’,’phase’,antenna=’1’,subplot=211)
plotcal(’jupiter6cm.usecase.phasecal1’,’’,’snr’,antenna=’1’,subplot=212)
# Amplitude and phase self-cal on scans
gaincal(vis=’jupiter6cm.usecase.split.ms’,
caltable=’jupiter6cm.usecase.scancal1’,
gaintable=’jupiter6cm.usecase.phasecal1’,
gaintype=’G’,
calmode=’ap’,
refant=’6’,
solint=’inf’,
minsnr=1.0)
# Plot up solution amp and SNR
plotcal(’jupiter6cm.usecase.scancal1’,’’,’amp’,antenna=’1’,subplot=211)
plotcal(’jupiter6cm.usecase.scancal1’,’’,’snr’,antenna=’1’,subplot=212)
# Now accumulate these - they will be on the 10s grid
accum(vis=’jupiter6cm.usecase.split.ms’,
tablein=’jupiter6cm.usecase.phasecal1’,
incrtable=’jupiter6cm.usecase.scancal1’,
caltable=’jupiter6cm.usecase.selfcal1’,
interp=’linear’)
# Plot this up
plotcal(’jupiter6cm.usecase.selfcal1’,’’,’amp’,antenna=’1’,subplot=211)
plotcal(’jupiter6cm.usecase.selfcal1’,’’,’phase’,antenna=’1’,subplot=212)
The final plot is shown in Figure 4.8
BETA ALERT: Only interpolation is offered in accum, no smoothing (as in smoothcal).
4.6
Application of Calibration to the Data
After the calibration solutions are computed and written to one or more calibration tables, one
then needs to apply them to the data.
CHAPTER 4. SYNTHESIS CALIBRATION
175
Figure 4.8: The final ’amp’ (top) and ’phase’ (bottom) of the self-calibration gain solutions for
Jupiter. An initial phase calibration on 10s solint was followed by an incremental gain solution
on each scan. These were accumulated into the cumulative solution shown here.
4.6.1
Application of Calibration (applycal)
After all relevant calibration types have been determined, they must be applied to the target
source(s) before splitting off to a new MS or before imaging. This is currently done by explicitly
taking the data in the DATA column in the MAIN table of the MS, applying the relevant calibration
tables, and creating the CORRECTED DATA scratch column. The original DATA column is untouched.
The applycal task does this. The inputs are:
#
applycal :: Apply calibration solution(s) to data
vis
field
spw
=
=
=
’’
’’
’’
#
#
#
Name of input visibility file
Names or indices of data fields to apply calibration ’’==>all
spectral window:channels: ’’==>all
CHAPTER 4. SYNTHESIS CALIBRATION
selectdata
gaintable
gainfield
interp
spwmap
gaincurve
opacity
parang
calwt
async
=
=
=
=
=
=
=
=
=
=
False
’’
’’
’’
[]
False
0.0
False
True
False
#
#
#
#
#
#
#
#
#
#
176
Other data selection parameters
List of calibration table(s) to apply
Field selection for each gaintable
Interpolation mode (in time) for each gaintable
Spectral window mapping for each gaintable (see help)
Apply VLA antenna gain curve correction
Opacity correction to apply (nepers)
Apply the parallactic angle correction
Apply calibration also to the WEIGHTS
if True run in the background, prompt is freed
As in other tasks, setting selectdata=True will open up the other selection sub-parameters (see
§ 2.6). Many of the other parameters are the common calibration parameters that are described in
§ 4.4.1.
The single non-standard parameter is the calwt option to toggle the ability to scale the visibility
weights by the inverse of the products of the scale factors applied to the amplitude of the antenna
gains (for the pair of antennas of a given visibility). This should in almost all cases be set to its
default (True). The weights should reflect the inverse noise variance of the visibility, and errors in
amplitude are usually also in the weights.
For applycal, the list of final cumulative tables is given in gaintable. In this case you will have
run accum if you have done incremental calibration for any of the types, such as ’G’. You can also
feed gaintable the full sets and rely on use of gainfield, interp and spwmap to do the correct
interpolation and transfer. It is often more convenient to go through accumulation of each type
with accum as described above (see § 4.5.4.2), as this makes it easier to keep track of the sequence
of incremental calibration as it is solved and applied. You can also do any required smoothing of
tables using smoothcal (§ 4.5.3), as this is not yet available in accum or applycal.
If you are not doing polarization calibration or imaging, then you can set parang=False to make
the calculations faster. If you are applying polarization calibration, or wish to make polarization
images, then set parang=True so that the parallactic angle rotation is applied to the appropriate
correlations. Currently, you must do this in applycal as this cannot be done on-the-fly in clean
or mosaic. See § 4.4.1.3 for more on parang.
For example, to apply the final bandpass and flux-scaled gain calibration tables solutions to the
NGC5921 data:
default(’applycal’)
vis=’ngc5921.usecase.ms’
# We want to correct the calibrators using themselves
# and transfer from 1445+099 to itself and the target N5921
# Start with the fluxscale/gain and bandpass tables
gaintable=[’ngc5921.usecase.fluxscale’,’ngc5921.usecase.bcal’]
# pick the 1445+099 (field 1) out of the gain table for transfer
# use all of the bandpass table
CHAPTER 4. SYNTHESIS CALIBRATION
177
gainfield = [’1’,’*’]
# interpolation using linear for gain, nearest for bandpass
interp = [’linear’,’nearest’]
# only one spw, do not need mapping
spwmap = []
# all channels, no other selection
spw = ’’
selectdata = False
# no prior calibration
gaincurve = False
opacity = 0.0
# select the fields for 1445+099 and N5921 (fields 1 and 2)
field = ’1,2’
applycal()
# Now for completeness apply 1331+305 (field 0) to itself
field = ’0’
gainfield = [’0’,’*’]
applycal()
# The CORRECTED_DATA column now contains the calibrated visibilities
In another example, we apply the final cumulative self-calibration of the Jupiter continuum data
obtained in the example of § 4.5.4.2:
applycal(vis=’jupiter6cm.usecase.split.ms’,
gaintable=’jupiter6cm.usecase.selfcal1’,
selectdata=False)
Again, it is important to remember the relative nature of each calibration term. A term solved for
in the presence of others is, in effect, residual to the others, and so must be used in combination
with them (or new versions of them) in subsequent processing. At the same time, it is important
to avoid isolating the same calibration effects in more than one term, e.g., by solving for both ’G’
and ’T’ separately (without applying the other), and then using them together.
It is always a good idea to examine the corrected data after calibration (using plotxy to compare
the raw (’data’) and corrected (’corrected’) visibilities), as we describe next.
4.6.2
Examine the Calibrated Data
Once the source data is calibrated using applycal, you should examine the uv data and flag
anything that looks bad. If you find source data that has not been flanked by calibration scans,
CHAPTER 4. SYNTHESIS CALIBRATION
178
delete it (it will not be calibrated).
For example, to look at the calibrated Jupiter data in the last example given in the previous section:
plotxy(’jupiter6cm.usecase.split.ms’,’uvdist’,’amp’,’corrected’,
selectdata=True,correlation=’RR LL’,fontsize = 14.0)
will show the CORRECTED DATA column. See Figure 4.9.
Figure 4.9: The final ’amp’ versus ’uvdist’ plot of the self-calibrated Jupiter data, as shown in
plotxy. The ’RR LL’ correlations are selected. No outliers that need flagging are seen.
See § 3.4 for a description of how to display and edit data using plotxy, and § 7.4 for use of the
viewer to visualize and edit a Measurement Set.
CHAPTER 4. SYNTHESIS CALIBRATION
4.6.3
179
Resetting the Applied Calibration using (clearcal)
The applycal task will set the CORRECTED DATA column. The clearcal task will reset it to be the
same as the DATA column. This may or may not be what you really want to do — nominally you
will rerun applycal to get new calibration if you have changed the tables or want to apply them
differently.
There is only a single input to clearcal:
#
clearcal :: Re-initializes calibration for an ms
vis
=
’’
#
Name of input visibility file
Note: clearcal also resets the MODEL DATA column to (1,0) for all fields and spectral windows.
4.7
4.7.1
Other Calibration and UV-Plane Analysis Options
Splitting out Calibrated uv data (split)
The split task will apply calibration and output a new sub-MS containing a specified list of sources
(usually a single source). The inputs are:
# split :: Create a visibility subset from an existing visibility set:
vis
=
’’
# Name of input measurement set
outputvis
=
’’
# Name of output measurement set
datacolumn
= ’corrected’ # Which data column to split out
field
=
’’
# Select field using field id(s) or field name(s)
spw
=
’’
# Select spectral window/channels
width
=
1
# Number of channels to average to form one output channel
antenna
=
’’
# Select data based on antenna/baseline
timebin
=
’0s’
# Value for timeaveraging
timerange
=
’’
# Select data based on time range
scan
=
’’
# select data based on scan numbers
uvrange
=
’’
# select data based on uv distance range
async
=
False
# If true the taskname must be started using split(...)
Usually you will run split with datacolumn=’corrected’ as previous operations (e.g. applycal)
will have placed the calibrated data in the CORRECTED DATA column of the MS.
For example, to split out 46 channels (5-50) from spw 1 of our NGC5921 calibrated dataset:
split(vis=’ngc5921.usecase.ms’,
outputvis=’ngc5921.split.ms’,
field=’2’,
spw=’0:5~50’,
datacolumn=’corrected’)
# Output NGC5921 data (field 2)
# Select 46 chans from spw 0
# Take the calibrated data column
CHAPTER 4. SYNTHESIS CALIBRATION
4.7.1.1
180
Averaging in split (EXPERIMENTAL)
BETA ALERT: The averaging in split is still problematic. In some known cases the time averaging
produces incorrect results. Channel averaging seems to work, but needs more testing. User beware!
Time and channel averaging are now available using the timebin and width parameters.
The timebin parameter give the averaging time. It takes a quantity, e.g.
timebin = ’30s’
The width parameter defines the number of channels to average to form a given output channel.
This can be specified globally for all spw, e.g.
width = 5
or specified per spw, e.g.
width = [2,3]
to average 2 channels of 1st spectral window selected and 3 in the second one.
BETA ALERT: The ability to average channels in both time and channel simultaneously is not
yet available. Also, if you average time and channel through sequential runs of split, you must
average in time first.
4.7.2
Hanning smoothing of uv data (hanningsmooth)
The hanningsmooth task will apply Hanning smoothing to a spectral line uv data set. It will be
applied to the data in the DATA column of the input MS and it writes the Hanning smoothed data
into the CORRECTED DATA column of that same MS.
Hanning smoothing replaces the contents of channel i with a weighted sum of the contents of
a number of channels surrounding channel i. In its current form, only channels i-1, i, and i+1
participate, with weights 0.25, 0.50, and 0.25 respectively, but we intend to extend the kernel size
in future releases. A typical use for Hanning smoothing is to remove Gibbs ringing.
The inputs are:
# hanningsmooth :: Hanning smooth frequency channel data
vis
= ’ngc5921.split.ms’
# Name of input visibility file (MS)
async
=
False
In many cases the data to be smoothed are in the CORRECTED DATA column of the MS; in that case,
run split first to copy the contents of the CORRECTED DATA column of the input MS to the DATA
column of the output MS. Then run hanningsmooth on the newly created MS.
CHAPTER 4. SYNTHESIS CALIBRATION
181
After hanning smoothing, the contents of the first and last channel of each visibility are undefined;
hanningsmooth will therefore flag the first and last channel.
BETA ALERT: We intend to make the kernel size a user supplied parameter. In the longer term
we intend to offer other varieties of spectral smoothing as well.
4.7.3
Model subtraction from uv data (uvsub)
The uvsub task will subtract the value in the MODEL column from that in the CORRECTED DATA
column in the input MS and store the result in that same CORRECTED DATA column.
The reverse operation is achieved by specifying reverse = True: in that case uvsub will add the
value in the MODEL column to that in the CORRECTED DATA column in the input MS and store the
result in that same CORRECTED DATA column.
The inputs are:
#
uvsub :: Subtract/add model from/to the corrected visibility data.
vis
reverse
async
=
=
=
’’
False
False
#
#
Name of input visibility file (MS)
reverse the operation (add rather than subtract)
For example:
uvsub(’ngc5921.split.ms’)
BETA ALERT: Currently, uvsub operates on the scratch columns in the MS vis. Eventually we
will provide the option to handle these columns behind the scenes and to write out a new MS.
4.7.4
UV-Plane Continuum Subtraction (uvcontsub)
At this point, consider whether you are likely to need continuum subtraction. If there is significant
continuum emission present in what is intended as a spectral line observation, continuum subtraction may be desirable. You can estimate and subtract continuum emission in the uv-plane prior
to imaging or wait and subtract an estimate of it in the image-plane. Note that neither method is
ideal, and the choice depends primarily upon the distribution and strength of the continuum emission. Subtraction in the uv-plane is desirable if continuum emission dominates the source, since
deconvolution of the line emission will be more robust if not subject to errors in deconvolution of
the brighter continuum. There is also a performance benefit since the continuum is probably the
same in each channel of the observation, and it is desirable to avoid duplication of effort. However,
the main drawback of subtraction in the uv-plane is that it is only strictly correct for the phase
center, since without the Fourier transform, the visibilities only describe the phase center. Thus,
uv-plane continuum subtraction will be increasingly poor for emission distributed further from the
phase center. If the continuum emission is relatively weak, it is usually adequate to subtract it in
CHAPTER 4. SYNTHESIS CALIBRATION
182
the image plane; this is described in the Image Analysis section of this cookbook. Here, we describe
how to do continuum subtraction in the uv-plane.
The uv-plane continuum subtraction is performed by the uvcontsub task. First, determine which
channels in your data cube do not have line emission, perhaps by forming a preliminary image as
described in the next chapter. This image will also help you decide whether or not you need to
come back and do uv-plane continuum subtraction at all.
The inputs to uvcontsub are:
# uvcontsub :: Continuum fitting and subtraction in the uv plane
vis
=
’’
# Nome of input visibility file
field
=
’’
# Select field using field id(s) or field name(s)
fitspw
=
’’
# Spectral window/channel selection for fitting the continuum
spw
=
’’
# Spectral window selection for subtraction/export
solint
=
’int’
# Continuum fit timescale
fitorder
=
0
# Polynomial order for the fit
fitmode
= ’subtract’
# Use of continuum fit (subtract,replace,model)
splitdata
=
False
# Split out continuum, continuum-subtracted data
async
=
False
For each baseline, and over the timescale specified in solint, uvcontsub will provide a simple linear
fit to the real and imaginary parts of the (continuum-only) channels specified in fitspw (using the
standard spw selection syntax), and then subtract this model from all channels specified in spw, or
from all channels in spectral windows of fitspw if spw=’’. BETA ALERT: The fits are currently
done independently in the spectral windows specified in fitspw, and thus overlapping channels in
different spw will be corrected only with the fits from their respective fitspw.
Usually, one would set solint=’int’ which does no averaging and fits each integration. However,
if the continuum emission comes from a small region around the phase center, then you can set
solint larger (as long as it is shorter than the timescale for changes in the visibility function of
the continuum). If your scans are short enough you can also use scan averaging solint=’inf’. Be
warned, setting solint too large will introduce “time smearing” in the estimated continuum and
thus not properly subtracting emission not at the phase center.
Running uvcontsub with fitmode=’subtract’ will replace the CORRECTED DATA column in the MS
with continuum-subtracted line data and the MODEL DATA column with the continuum model. You
can use fitmode=’replace’ to replace the CORRECTED DATA column with the continuum model;
however, it is probably better to use fitmode=’subtract’ and then use split to select the
MODEL DATA and form a dataset appropriate for forming an image of the estimated continuum.
Note that a continuum image formed from this model will only be strictly correct near the phase
center, for the reasons described above.
The splitdata parameter can be used to have uvcontsub write out split MS for both the continuumsubtracted data and the continuum. It will leave the input MS in the state as if fitmode=’subtract’
was used. Note that the entire channel range of the MS will be written out (not just the channels
specified in spw that have had the subtraction), so follow up with a split if you want to further
restrict the output channel range. If splitdata=True, then uvcontsub will make two output MS
CHAPTER 4. SYNTHESIS CALIBRATION
183
with names <input msname>.contsub and <input msname>.cont. BETA ALERT: be sure to
run with fitmode=’subtract’ if setting splitdata=True.
Note that it is currently the case that uvcontsub will overwrite the CORRECTED DATA column.
Therefore, it is desirable to first split the relevant corrected data into a new Measurement Set. If
you run uvcontsub on the original dataset, you will have to re-apply the calibration as described
in the previous chapter.
So, the recommended procedure is as follows:
• Finish calibration as described in the previous chapter.
• Use split to form a separate dataset.
• Use the invert or clean task on the split result to form an exploratory image that is useful
for determining the line-free channels.
• Use uvcontsub with mode=’subtract’ to subtract the continuum from the CORRECTED DATA
in the MS, and write the continuum model in the MODEL DATA column. Set splitdata=True
to have it automatically split out continuum-subtracted and continuum datasets, else do this
manually.
• Image the line-only emission with the clean task.
• If an image of the estimated continuum is desired, and you did not use splitdata=True, then
run split again (on the uvcontsub’d dataset), and select the MODEL DATA; then run clean to
image it.
For example, we perform uv-plane continuum subtraction on our NGC5921 dataset:
# Want to use channels 4-6 and 50-59 for continuum
uvcontsub(vis=’ngc5921.usecase.ms’,
field=’N5921*’,
spw=’’,
# all spw (only 0 in this data)
fitspw=’0:4~7;50~59’
# channels 4-6 and 50-59
solint=’inf’,
# scans are short enough
fitorder=0
# mean only
fitmode=’subtract’
# uv-plane subtraction
splitdata=True)
# split the data for us
# You will see it made two new MS:
# ngc5921.usecase.ms.cont
# ngc5921.usecase.ms.contsub
4.7.5
UV-Plane Model Fitting (uvmodelfit)
It is often desirable to fit simple analytic source component models directly to visibility data. Such
fitting has its origins in early interferometry, especially VLBI, where arrays consisted of only a few
CHAPTER 4. SYNTHESIS CALIBRATION
184
antennas and the calibration and deconvolution problems were poorly constrained. These methods
overcame the calibration uncertainties by fitting the models to calibration-independent closure
quantities and the deconvolution problem by drastically limiting the number of free parameters
required to describe the visibilities. Today, even with larger and better calibrated arrays, it is still
desirable to use visibility model fitting in order to extract geometric properties such as the positions
and sizes of discrete components in radio sources. Fits for physically meaningful component shapes
such as disks, rings, and optically thin spheres, though idealized, enable connecting source geometry
directly to the physics of the emission regions.
Visibility model fitting is carried out by the uvmodelfit task. The inputs are:
#
uvmodelfit :: Fit a single component source model to the uv data:
vis
field
spw
selectdata
niter
comptype
sourcepar
varypar
outfile
async
=
=
=
=
=
=
=
=
=
=
’’
’’
’’
False
5
’P’
[1, 0, 0]
[]
’’
False
#
#
#
#
#
#
#
#
#
#
Name of input visibility file
field name or index
spectral window
Activate data selection details
Number of fitting iterations to execute
Component type (P=pt source,G=ell. gauss,D=ell. disk)
Starting guess (flux,xoff,yoff,bmajaxrat,bpa)
Which parameters can vary in fit
Optional output component list table
if True run in the background, prompt is freed
BETA ALERT: This task currently only fits a single component.
The user specifies the number of non-linear solution iterations (niter), the component type (comptype),
an initial guess for the component parameters (sourcepar), and optionally, a vector of Booleans selecting which component parameters should be allowed to vary (fixpar), and a filename in which to
store a CASA componentlist for use in other applications (file). Allowed comptypes are currently
point ’P’ or Gaussian ’G’.
The function returns a vector containing the resulting parameter list. This vector can be edited at
the command line, and specified as input (sourcepar) for another round of fitting.
The sourcepar parameter is currently the only way to specify the starting parameters for the fit.
For points, there are three parameters: I (total flux density), and relative direction (RA, Dec)
offsets (in arcsec) from the observation’s phase center. For Gaussians, there are three additional
parameters: the Gaussian’s semi-major axis width (arcsec), the aspect ratio, and position angle
(degrees). It should be understood that the quality of the result is very sensitive to the starting
parameters provided by the user. If this first guess is not sufficiently close to the global χ2 minimum, the algorithm will happily converge to an incorrect local minimum. In fact, the χ2 surface,
as a function of the component’s relative direction parameters, has a shape very much like the
inverse of the absolute value of the dirty image of the field. Any peak in this image (positive or
negative) corresponds to a local χ2 minimum that could conceivable capture the fit. It is the user’s
responsibility to ensure that the correct minimum does the capturing.
Currently, uvmodelfit relies on the likelihood that the source is very near the phase center (within
a beamwidth) and/or the user’s savvy in specifying the starting parameters. This fairly serious
CHAPTER 4. SYNTHESIS CALIBRATION
185
constraint will soon be relieved somewhat by enabling a rudimentary form of uv-plane weighting
to increase the likelihood that the starting guess is on a slope in the correct χ2 valley.
Improvements in the works for visibility model fitting include:
• User-specifiable uv-plane weighting
• Additional component shapes, including elliptical disks, rings, and optically thin spheroids.
• Optional calibration pre-application
• Multiple components. The handling of more than one component depends mostly on efficient
means of managing the list itself (not easy in command line options), which are currently
under development.
• Combined component and calibration fitting.
Example (see Figure 4.10):
#
# Note: It’s best to channel average the data if many channels
# before running a modelfit
#
split(’ngc5921.ms’,’1445+099_avg.ms’,
datacolumn=’corrected’,field=’1445*’,width=’63’)
# Initial guess is that it’s close to the phase center
# and has a flux of 2.0 (a priori we know it’s 2.47)
uvmodelfit(’1445+099_avg.ms’,
# use averaged data
niter=5,
# Do 5 iterations
comptype=’P’,
# P=Point source, G=Gaussian, D=Disk
sourcepar=[2.0,.1,.1], # Source parameters for a point source
spw=’0’,
#
outfile=’gcal.cl’)
# Output component list file
# Output looks like:
There are 19656 - 3 = 19653 degrees of freedom.
iter=0:
reduced chi2=0.0418509: I=2, dir=[0.1, 0.1] arcsec
iter=1:
reduced chi2=0.003382: I=2.48562, dir=[-0.020069, -0.0268826] arcsec
iter=2:
reduced chi2=0.00338012: I=2.48614, dir=[0.00323428, -0.00232235] arcsec
iter=3:
reduced chi2=0.00338012: I=2.48614, dir=[0.00325324, -0.00228963] arcsec
iter=4:
reduced chi2=0.00338012: I=2.48614, dir=[0.00325324, -0.00228963] arcsec
iter=5:
reduced chi2=0.00338012: I=2.48614, dir=[0.00325324, -0.00228963] arcsec
If data weights are arbitrarily scaled, the following formal errors
will be underestimated by at least a factor sqrt(reduced chi2). If
the fit is systematically poor, the errors are much worse.
I = 2.48614 +/- 0.0176859
x = 0.00325324 +/- 0.163019 arcsec
y = -0.00228963 +/- 0.174458 arcsec
Writing componentlist to file: /home/sandrock/smyers/Testing/Patch2/N5921/gcal.cl
CHAPTER 4. SYNTHESIS CALIBRATION
186
# Fourier transform the component list into MODEL_DATA column of the MS
ft(’1445+099_avg.ms’, complist=’gcal.cl’)
# Plot data versus uv distance
plotxy(’1445+099_avg.ms’, xaxis=’uvdist’, datacolumn=’corrected’)
# Specify green circles for model data (overplotted)
plotxy(’1445+099_avg.ms’, xaxis=’uvdist’, datacolumn=’model’,
overplot=True, plotsymbol=’go’)
Figure 4.10: Use of plotxy to display corrected data (red and blue points) and uv model fit data
(green circles).
4.8
Examples of Calibration
See the scripts provied in Appendix F for examples of calibration. In particular, we refer the
interested user to the demonstrations for:
CHAPTER 4. SYNTHESIS CALIBRATION
• NGC5921 (VLA HI) — a quick demo of basic CASA spectral line calibration (F.1)
• Jupiter (VLA 6cm continuum polarimetry) — polarization calibration (F.2)
187
Chapter 5
Synthesis Imaging
This chapter describes how to make and deconvolve images
starting from calibrated interferometric data, possibly supInside the Toolkit:
plemented with single-dish data or an image made from The im tool handles synthesis imagsingle-dish data. This data must be available in CASA ing operations.
(see § 2 on importing data). See § 4 for information on
calibrating synthesis data. In the following sections, the
user will learn how to make various types of images from synthesis data, reconstruct images of the
sky using the available deconvolution techniques, include single-dish information in the imaging
process, and to prepare to use the results of imaging for improvement of the calibration process
(“self-calibration”).
5.1
Imaging Tasks Overview
The current imaging and deconvolution tasks are:
• clean — calculate a deconvolved image with a selected clean algorithm, including mosaicing,
or make a dirty image (§ 5.3)
• feather — combine a single dish and synthesis image in the Fourier plane (§ 5.5)
• deconvolve — image-plane only deconvolution based on the dirty image and beam, using
one of several algorithms (§ 5.8)
• widefield — a prototype task to create and deconvolve a wide-field image using w-projection
and/or faceting (§ 5.4)
There are also tasks that help you set up the imaging or interface imaging with calibration:
• makemask - create “cleanbox” deconvolution regions (§ 5.6)
188
CHAPTER 5. SYNTHESIS IMAGING
189
• ft - Fourier transform the specified model (or component list) and insert the source model
into the MODEL column of a visibility set (§ 5.7)
The full “tool kit” that allows expert-level imaging must still be used if you do not find enough
functionality within the tasks above.
Information on other useful tasks and parameter setting can be found in:
• listobs — list whats in a MS (§ 2.3),
• split— Write out new MS containing calibrated data from a subset of the original MS
(§ section:cal.split),
• data selection — general data selection syntax (§ 2.6).
• viewer — image display including region statistics and image cube slice and profile capabilities (§ 7)
5.2
Common Imaging Task Parameters
We now describe some parameters are are common to the
imaging tasks. These should behave the same way in any
imaging task that they are found in. These are in alphabetical order.
Inside the Toolkit:
The im.setimage method is used to
set many of the common image parameters. used
The inim.advise
method
BETA ALERT: There are still a subset of data selection parameters
the imaging
tasks:
gives
helpful
advice
for
setting
up
field, spw, timerange. In a later patch, we will use the standard data selection set (§ 2.6). for
imaging.
5.2.1
Parameter cell
The cell parameter defines the pixel size in the x and y
axes for the output image. If given as floats or integers,
this is the cell size in arc seconds, e.g.
cell=[0.5,0.5]
make 0.500 pixels. You can also give the cell size in quantities, e.g.
cell=[’1arcmin’, ’1arcmin’]
If a single value is given, then square pixels of that size are assumed.
CHAPTER 5. SYNTHESIS IMAGING
5.2.2
190
Parameter field
The field parameter selects the field indexes or names to be used in imaging. Unless you are
making a mosaic, this is usually a single index or name:
field = ’0’
field = ’1331+305’
field = ’*’
#
#
#
First field (index 0)
3c286
all fields in dataset
The syntax for field selection is given in § 2.6.2.
5.2.3
Parameter imagename
The value of the imagename parameter is used as the root name of the output image. Depending
on the particular task and the options chosen, one or more images with names built from that root
will be created. For example, the clean task run with imagename=’ngc5921 a series of output
images will be created with the names ngc5921.clean, ngc5921.residual, ngc5921.model, etc.
If an image with that name already exists, it will in general be overwritten. Beware using names
of existing images however. If the clean is run using an imagename where <imagename>.residual
and <imagename>.model already exist then clean will continue starting from these (effectively
restarting from the end of the previous clean). Thus, if multiple runs of clean are run consecutively
with the same imagename, then the cleaning is incremental (as in the difmap package).
5.2.4
Parameter imsize
The image size in numbers of pixels on the x and y axes is set by imsize. For example,
imsize = [288, 288]
makes a square image 288 pixels on a side. If a single value is given, then a square image of that
dimension is made. This need not be a power of two, but for optimal performance should be a
“composite” number divisible only by 2 and also 3 and/or 5. Note that in the example above
288 = 25 · 32 .
BETA ALERT: You will be warned if you give a non-composite imsize and it will suggest the
nearest appropriate value. But it will continue cleaning so you may have to abort if you want to
make use of this suggestion. This restriction will be lifted in the future when we migrate to a better
FFTW engine.
5.2.5
Parameter mode
The mode parameter defines how the frequency channels in the synthesis MS are mapped onto
the image. The allowed values are: mfs, channel, velocity, frequency. The mode parameter is
expandable, with some options uncovering a number of sub-parameters, depending upon its value.
CHAPTER 5. SYNTHESIS IMAGING
5.2.5.1
191
Mode mfs
The default mode=’mfs’ emulates multi-frequency synthesis in that each visibility-channel datum
k with baseline vector B k at wavelength λk is gridded into the uv-plane at uk = B k /λk . The result
is a single image plane, regardless of how many channels are in the input dataset. This image plane
is at the frequency given by the midpoint between the highest and lowest frequency channels in the
input spw(s). Currently, there is no way to choose the center frequency of the output image plane
independently.
5.2.5.2
Mode channel
If mode=’channel’ is chosen, then an image cube will be created. This is an expandable parameter,
with dependent parameters:
mode
nchan
start
width
interpolation
=
=
=
=
=
’channel’
1
0
1
’nearest’
#
#
#
#
#
Type of selection (mfs, channel, velocity, frequency)
Number of channels (planes) in output image
first input channel to use
Number of input channels to average
Type of spectral interpolation of visibilities (nearest, linear, cubi
The channelization of the resulting image is determined by the channelization in the first MS of
vis of the first spw specified (the “reference spw”). The actual channels to be gridded and used in
the clean are selected via the spw parameter as usual. The resulting image cube will have nchan
channels spaced evenly in frequency. The first output channel will be located at the frequency
of channel start in the (first) reference spw. If width> 1, then input MS channels with centers
within a frequency range given by (width + 1)/2 times the reference spw spacing will be gridded
together (as in mode = ’mfs’ above) into the channels of the output image cube. The output
channel spacing is thus given by width channels in the reference spw of the MS.
The interpolation sub-parameter (§ 5.2.5.5) sets how channels are gridded into the image cube
planes. For ’nearest’, the channels in spw beyond the first are mapped into the nearest output
image channel within half a channel (if any). Otherwise, the chosen interpolation scheme will be
used. Image channels that lie outside the MS frequency range or have no data mapped to them
will be blank in the output image, but will be in the cube.
See the example in § F.1 for using the ’channel’ mode to image a spectral-line cube. In this case,
we use:
mode
nchan
start
width
= ’channel’
=
46
=
5
=
1
which will produce a 46-channel cube starting with channel 5 of the MS with the same channel
width as the MS.
CHAPTER 5. SYNTHESIS IMAGING
5.2.5.3
192
Mode frequency
For mode=’frequency’, an output image cube is created with nchan channels spaced evenly in
frequency.
mode
nchan
start
width
interpolation
= ’frequency’ # Type of selection (mfs, channel, velocity, frequency)
=
1 # Number of channels (planes) in output image
=
’1.4GHz’ # Frequency of first image channel: e.q. ’1.4GHz’
=
’10kHz’ # Image channel width in frequency units: e.g ’1.0kHz’
= ’nearest’ # Type of spectral interpolation of visibilities (nearest, linear, cubic)
The frequency of the first output channel is given by start and spacing by width. The sign of
width determines whether the output channels ascend or descend in frequency. Output channels
have a width also given by width. Data from the input MS with centers that lie within one-half
an input channel overlap of the frequency range of ±width/2 centered on the output channels are
gridded together. The interpolation sub-parameter (§ 5.2.5.5) sets how channels are gridded into
the image cube planes.
Using the NGC5921 dataset as an example:
mode
nchan
start
width
= ’frequency’
=
21
= ’1412.830MHz’
=
’50kHz’
would produce a 21-channel output cube with 50 kHz wide channels rather than the default channelization of the MS (24.4 kHz).
5.2.5.4
Mode velocity
If mode=’velocity’ is chosen, then an output image cube with nchan channels will be created,
with channels spaced evenly in velocity. Parameters are:
mode
nchan
start
width
interpolation
= ’velocity’ # Type of selection (mfs, channel, velocity, frequency)
=
1 # Number of channels (planes) in output image
= ’0.0km/s’ # Velocity of first image channel: e.g ’0.0km/s’
=
’1km/s’ # image channel width in velocity units: e.g ’-1.0km/s’
= ’nearest’ # Type of spectral interpolation of visibilities (nearest, linear, cubic)
The velocity of the first output channel is given by start and spacing by width. Note that the
velocity frame is given by the rest frequency in the MS header, which can be overridden by the
restfreq parameter. Averaging is as in mode=’frequency’. The interpolation sub-parameter
(§ 5.2.5.5) sets how channels are gridded into the image cube planes.
Again, using the NGC5921 dataset as an example:
CHAPTER 5. SYNTHESIS IMAGING
mode
nchan
start
width
193
= ’velocity’
=
21
= ’1383.0km/s’
=
’10km/s’
Note that in this case the velocity axis runs forward, as opposed to the default channelization for
’channel’ or ’frequency’.
BETA ALERT: Note that the velocities are expressed in the LSRK frame. This is not currently
selectable, but in the future will be through restfreq (§ 5.2.7).
5.2.5.5
Sub-parameter interpolation
The interpolation sub-parameter controls how spectral channels in the MS are gridded into the
output image cube. This is available in all modes except ’mfs’. The options are: ’nearest’,
’linear’, ’cubic’.
For ’nearest’, the channels in spw beyond the first are mapped into the nearest output image
channel within half a channel (if any).
For ’linear’, the channels are gridded into the planes using weights given by a linear function of
the frequency of the MS channel versus the plane. Each input channel will be mapped to 1 or 2
output planes. For most users, this is the best choice.
For ’cubic’, the channels are gridded using a cubic interpolation function.
5.2.6
Parameter phasecenter
The phasecenter parameter indicates which of the field IDs should be used to define the phase
center of the mosaic image, or what that phase center is in RA and Dec. The default action is to
use the first one given in the field list.
For example:
phasecenter=’5’
# field 5 in multi-src ms
phasecenter=’J2000 19h30m00 -40d00m00’ # specify position
Note that the format for angles prefers to use hm for RA/time units and dm for Dec/Angle units as
separators. The colon :: separator is interpreted as RA/time even if its used for the Dec, so be
careful not to copy/paste from other sources.
5.2.7
Parameter restfreq
The value of the restfreq parameter, if set, will over-ride the rest frequency in the header of the
first input MS to define the velocity frame of the output image.
CHAPTER 5. SYNTHESIS IMAGING
194
BETA ALERT: The restfreq parameter takes the options of transitions and frequencies as
in the corresponding plotxy parameter (§ 3.4.7), but does not currently expand to allow frame
information (is hardwired into LSRK).
For example:
restfreq=’115.2712GHz’,
will set the rest frequency to that of the CO 1-0 line.
BETA ALERT: Setting restfreq explicitly here in clean is good practice, and may be necessary
if your MS has been concatenated from different files for different spectral windows (§ 2.5).
5.2.8
Parameter spw
The spw parameter selects the spectral windows that will be used to form the image, and possibly
a subset of channels within these windows.
The spw parameter is a string with an integer, list of integers, or a range, e.g.
spw = ’1’
spw = ’0,1,2,3’
spw = ’0~3’
#
#
#
select spw 1
select spw 0,1,2,3
same thing using ranges
You can select channels in the same string with a : separator, for example
spw = ’1:10~30’
spw = ’0:5~55,3:5;6;7’
#
#
select channels 10-30 of spw 1
chans 5-55 of spw 0 and 5,6,7 of spw 3
This uses the standard syntax for spw selection is given in § 2.6.3. See that section for more options.
Note that the order in which multiple spws are given is important for mode = ’channel’, as this
defines the origin for the channelization of the resulting image.
5.2.9
Parameter stokes
The stokes parameter specifies the Stokes parameters for the resulting images. Note that forming
Stokes Q and U images requires the presence of cross-hand polarizations (e.g. RL and LR for circularly
polarized systems such as the VLA) in the data. Stokes V requires both parallel hands (RR and
:LL) for circularly polarized systems or the cross-hands (XY and YX) for linearly polarized systems
such as ALMA and ATCA.
This parameter is specified as a string of up to four letters (IQUV). For example,
stokes
stokes
stokes
stokes
=
=
=
=
’I’
’IQU’
’IV’
’IQUV’
#
#
#
#
Intensity only
Intensity and linear polarization
Intensity and circular polarization
All Stokes imaging
CHAPTER 5. SYNTHESIS IMAGING
195
are common choices. () The output image will have planes (along the “polarization axis”) corresponding to the chosen Stokes parameters.
If as input to deconvolution tasks such as clean, the stokes parameter includes polarization planes
other than I, then choosing psfmode=’hogbom’ (§ 5.3.1.2) or psfmode=’clarkstokes’ (§ 5.3.1.3)
will clean (search for components) each plane sequentially, while psfmode=’clark’ (§ 5.3.1.1) will
deconvolve jointly.
5.2.10
Parameter uvtaper
This controls the radial weighting of visibilities in the uv-plane (see § 5.2.11 below) through the
multiplication of the visibilities by the Fourier transform of an elliptical Gaussian. This is itself a
Gaussian, and thus the visibilities are “tapered” with weights decreasing as a function of uv-radius.
The uvtaper parameter expands the menu upon setting uvtaper=True to reveal the following
sub-parameters:
uvtaper
outertaper
innertaper
=
=
=
True
[]
[]
#
#
#
Apply additional uv tapering of visibilities.
uv-taper on outer baselines in uv-plane
uv-taper in center of uv-plane (not implemented)
The sub-parameters specify the size and optionally shape and orientation of this Gaussian in the
uv-plane or optionally the sky plane. The outertaper refers to a Gaussian centered on the origin
of the uv-plane.
Some examples:
outertaper=[]
outertaper=[’5klambda’]
outertaper=[’5klambda’,’3klambda’,’45.0deg’]
outertaper=[’10arcsec’]
outertaper=[’300.0’]
#
#
#
#
#
no outer taper applied
circular uv taper FWHM=5 kilo-lambda
elliptical Gaussian
on-sky FWHM 10"
300m in aperture plane
Note that if no units are given on the taper, then the default units are assumed to be meters in
aperture plane.
BETA ALERT: The innertaper option is not yet implemented.
5.2.11
Parameter weighting
In order to image your data, we must have a map from
the visibilities to the image. Part of that map, which is
effectively a convolution, is the weights by which each visibility is multiplied before gridding. The first factor in the
weighting is the “noise” in that visibility, represented by
the data weights in the MS (which is calibrated along with
Inside the Toolkit:
The im.weight method has more
weighting options than available in
the imaging tasks. See the User
Reference Manual for more information on imaging weights.
CHAPTER 5. SYNTHESIS IMAGING
196
the visibility data). The weighting function can also depend upon the uv locus of that visibility (e.g. a “taper”
to change resolution). This is actually controlled by the
uvtaper parameter (see § 5.2.10). The weighting matrix also includes the convolution kernel that
distributes that visibility onto the uv-plane during gridding before Fourier transforming to make
the image of the sky. This depends upon the density of visibilities in the uv-plane (e.g. “natural”,
“uniform”, “robust” weighting).
The user has control over all of these.
BETA ALERT: You can find a weighting description in the online User Reference Manual at:
http://casa.nrao.edu/docs/casaref/imager.weight.html
The weighting parameter expands the menu to include various sub-parameters depending upon
the mode chosen:
5.2.11.1
’natural’ weighting
For weighting=’natural’, visibilities are weighted only by the data weights, which are calculated
during filling and calibration and should be equal to the inverse noise variance on that visibility.
Imaging weight wi of sample i is given by
wi = ωi =
1
σk2
(5.1)
where the data weight ωi is determined from σi is the rms noise on visibility i. When data is
gridded into the same uv-cell for imaging, the weights are summed, and thus a higher uv density
results in higher imaging weights. No sub-parameters are linked to this mode choice. It is the
default imaging weight mode, and it should produce “optimum” image with with the lowest noise
(highest signal-to-noise ratio). Note that this generally produces images with the poorest angular
resolution, since the density of visibilities falls radially in the uv-plane
5.2.11.2
’uniform’ weighting
For weighting = ’uniform’, the data weights are calculated as in ’natural’ weighting. The
data is then gridded to a number of cells in the uv-plane, and after all data is gridded the uv-cells
are re-weighted to have “uniform” imaging weights. This pumps up the influence on the image of
data with low weights (they are multiplied up to be the same as for the highest weighted data),
which sharpens resolution and reduces the sidelobe level in the field-of-view, but increases the rms
image noise. No sub-parameters are linked to this mode choice.
For uniform weighting, we first grid the inverse variance ωi for all selected data onto a grid with
uv cell-size given by 2/F OV where F OV is the specified field of view (defaults to the image field
of view). This forms the gridded weights Wk . The weight of the i-th sample is then:
wi =
ωi
.
Wk
(5.2)
CHAPTER 5. SYNTHESIS IMAGING
5.2.11.3
197
’superuniform’ weighting
The weighting = ’superuniform’ mode is similar to the ’uniform’ weighting mode but there is
now an additional npixels sub-parameter that specifies a change to the number of cells on a side
(with respect to uniform weighting) to define a uv-plane patch for the weighting renormalization.
If npixels=0 you get uniform weighting.
5.2.11.4
’radial’ weighting
The weighting = ’radial’ mode is a seldom-used option that increases the weight by the radius
in the uv-plane, ie.
q
(5.3)
wi = ωi · u2i + vi2 .
Technically, I would call that an inverse uv-taper since it depends on uv-coordinates and not on the
data per-se. Its effect is to reduce the rms sidelobes for an east-west synthesis array. This option
has limited utility.
5.2.11.5
’briggs’ weighting
The weighting = ’briggs’ mode is an implementation of the flexible weighting scheme developed
by Dan Briggs in his PhD thesis. See:
http://www.aoc.nrao.edu/dissertations/dbriggs/
This choice brings up the sub-parameters:
weighting
robust
npixels
=
=
=
’briggs’
0.0
0
#
#
#
Weighting to apply to visibilities
Briggs robustness parameter
number of pixels to determine uv-cell size 0=> field of view
The actual weighting scheme used is:
wi =
ωi
1 + Wk f 2
(5.4)
where Wk is defined as in uniform and superuniform weighting, and
f2 =
(5 ∗ 10−R )2
P
2
Pk Wk
i
(5.5)
ωi
and R is the robust parameter.
The key parameter is the robust parameter, which sets R in the Briggs equations. The scaling of
R is such that R = 0 gives a good trade-off between resolution and sensitivity. The robust R takes
value between −2.0 (close to uniform weighting) to 2.0 (close to natural).
Superuniform weighting can be combined with Briggs weighting using the npixels sub-parameter.
This works as in ’superuniform’ weighting (§ 5.2.11.3).
CHAPTER 5. SYNTHESIS IMAGING
5.2.11.6
198
’briggsabs’ weighting
For weighting=’briggsabs’, a slightly different Briggs weighting is used, with
wi =
ωi
2
Wk R2 + 2σR
(5.6)
where R is the robust parameter and σR is the noise parameter.
This choice brings up the sub-parameters:
weighting
robust
noise
npixels
= ’briggsabs’
=
0.0
= ’0.0Jy’
=
0
#
#
#
#
Weighting to apply to visibilities
Briggs robustness parameter
noise parameter for briggs weighting when rmode=’abs’
number of pixels to determine uv-cell size 0=> field of view
Otherwise, this works as weighting=’briggs’ above (§ 5.2.11.5).
5.2.12
Parameter vis
The value of the vis parameter is either the name of a single MS, or a list of strings containing the names of multiple
MSs, that should be processed to produce the image. The
MS referred to by the first name in the list (if more than
one) is used to determine properties of the image such as
channelization and rest frequency.
Beta Alert!
Multi-MS handling is not percolated
to the tasks yet, as we are still working on this. Use single MS only.
For example,
vis = ’ngc5921.ms’
set a single input MS, while
vis = [’ngc5921_day1.ms’, ’ngc5921_day2.ms’, ’ngc5921_day3.ms’]
points to three separate measurement sets that will be gridded together to form the image. This
means that you do not have to concatenate datasets, for example from different configurations,
before imaging.
5.2.13
Primary beams in imaging
The CASA imaging task and tools use primary beams based on models for each observatory’s
antenna types. In addition to different antenna diameters, different functions may be used.
The voltage patterns are based on the following antenna primary beams, based on the TELESCOPE NAME
keyword in the OBSERVATION table:
CHAPTER 5. SYNTHESIS IMAGING
199
VLA — Airy disk fitted to measurement. Note that a R/L beam squint is also included with feed
dependent angle;
ALMA — Airy disk for 12m dish with a blockage of 1m;
ATA — Airy disk for 6m dish;
ATCA — polynomial fitted to measurement of main lobe;
BIMA, HATCREEK — Gaussian with halfwidth of λ/2D;
CARMA — Airy patterns for the BIMA or OVRO dish sizes as appropriate;
GBT — polynomial fitted to measurement of main lobe;
GMRT — VLA Airy disk scaled to 45.0m;
IRAMPDB — Airy disk for dish of 15m with a blockage of 1m;
NRAO12M — VLA beam scaled to 12m;
OVRO — VLA Airy disk scaled to 10.4m;
SMA — Spheroidal function fit to FWHM;
WSRT — polynomial fitted to measurement of main lobe;
If the telescope name is unknown, or is CARMA or ALMA, then the DISH DIAMETER in the ANTENNA
table is used with a scaled VLA pattern.
Note that for the purposes of mosaicing in clean, the primary beams that are Airy or spheroidal
are best-behaved (see § 5.3.14).
5.3
Deconvolution using CLEAN (clean)
To create an image and then deconvolve it with the CLEAN algorithm, use the clean task. This
task will work for single-field data, or for multi-field mosaics (§ 5.3.14). BETA ALERT: There is
now an experimental feature to image data taken with “heterogeneous” arrays with non-identical
dish sizes (§ 5.3.15).
The clean task uses many of the common imaging parameters. These are described above in § 5.2.
There are also a number of parameters specific to clean. These are listed and described below.
The default inputs to clean are:
#
clean :: Calculates a deconvolved image with a selected clean algorithm
vis
imagename
field
=
=
=
’’
’’
’’
#
#
#
name of input visibility file (MS)
Pre-name of output images
Field Name
CHAPTER 5. SYNTHESIS IMAGING
spw
selectdata
mode
niter
gain
threshold
psfmode
imagermode
multiscale
interactive
mask
imsize
cell
phasecenter
restfreq
stokes
weighting
uvtaper
modelimage
restoringbeam
pbcor
minpb
async
200
=
’’
# Spectral windows:channels: ’’ is all
=
False
# Other data selection parameters
=
’mfs’
# Type of selection (mfs, channel, velocity, frequency)
=
500
# Maximum number of iterations
=
0.1
# Loop gain for cleaning
=
’0.0mJy’
# Flux level to stop cleaning. Must include units
=
’clark’
# method of PSF calculation to use during minor cycles
=
’’
#
Use csclean or mosaic. If ’’, use psfmode
=
[]
# set deconvolution scales (pixels)
=
False
# use interactive clean (with GUI viewer)
=
[]
# cleanbox(es), mask image(s), and/or region(s)
= [256, 256]
# x and y image size in pixels
= [’1.0arcsec’, ’1.0arcsec’] # x and y cell size. default unit arcsec
=
’’
# Image phase center: position or field index
=
’’
# rest frequency to assign to image (see help)
=
’I’
# Stokes params to image (eg I,IV, QU,IQUV)
= ’natural’
# Weighting to apply to visibilities
=
False
# Apply additional uv tapering of visibilities.
=
’’
# Name of model image(s) to initialize cleaning
=
[’’]
# Output Gaussian restoring beam for CLEAN image
=
False
# Output primary beam-corrected image
=
0.1
# Minimum PB level to use
=
False
The clean task will produce a number of output images based on the root name given in imagename.
These include:
<imagename>.clean.image
<imagename>.clean.flux
<imagename>.clean.flux.pbcoverage
<imagename>.clean.model
<imagename>.clean.residual
<imagename>.clean.psf
#
#
#
#
#
#
the
the
the
the
the
the
restored image
effective response (e.g. for pbcor)
PB coverage (ftmachine=’mosaic’ only)
model image
residual image
synthesized (dirty) beam
BETA ALERT: The <imagename>.clean.flux.pbcoverage image is new in Patch 4 version
2.4.0 and reflects the unweighted primary beam coverage (without weighting or gridding kernel
factors) used for the minpb cutoff (§ 5.3.7). This is produced only for imagermode=’mosaic’ with
ftmachine=’mosaic’.
The mode, psfmode, imagermode, and weighting parameters open up other sub-parameters. These
are detailed in the common imaging task parameters section (§ 5.2).
A typical setup for clean on the NGC5921 dataset, after setting parameter values, might look like:
vis
imagename
field
spw
selectdata
mode
= ’ngc5921.usecase.ms.contsub’ # Name of input
= ’ngc5921.usecase.clean’ # Pre-name of output
=
’0’ # Field Name
=
’’ # Spectral windows:channels: ’’ is
=
False # Other data selection parameters
= ’channel’ # Type of selection (mfs, channel,
visibility file
images
all
velocity, frequency)
CHAPTER 5. SYNTHESIS IMAGING
nchan
start
width
interpolation
=
=
=
=
46
5
1
’nearest’
#
#
#
#
201
Number of channels (planes) in output image
first input channel to use
Number of input channels to average
Spectral interpolation (nearest, linear, cubic)
niter
gain
threshold
psfmode
imagermode
multiscale
interactive
mask
imsize
cell
phasecenter
restfreq
stokes
weighting
robust
npixels
=
6000 # Maximum number of iterations
=
0.1 # Loop gain for cleaning
=
8.0 # Flux level to stop cleaning. Must include units
=
’clark’ # method of PSF calculation to use during minor cycles
=
’’ # Use csclean or mosaic, or image-plane only if ’’
=
[] # set deconvolution scales (pixels)
=
False # use interactive clean (with GUI viewer)
= [108, 108, 148, 148] # cleanbox(es), mask image(s), and/or region(s)
= [256, 256]
# x and y image size in pixels
= [15.0, 15.0] # x and y cell size. default unit arcsec
=
’’ # Image phase center: position or field index
=
’’ # rest frequency to assign to image (see help)
=
’I’ # Stokes params to image (eg I,IV, QU,IQUV)
=
’briggs’ # Weighting to apply to visibilities
=
0.5 # Briggs robustness parameter
=
0 # uv-cell size in pixels 0=> field of view
uvtaper
modelimage
restoringbeam
pbcor
minpb
async
=
=
=
=
=
=
False
’’
[’’]
False
0.1
False
#
#
#
#
#
Apply additional uv tapering of visibilities.
Name of model image(s) to initialize cleaning
Output Gaussian restoring beam for CLEAN image
Output primary beam-corrected image
Minimum PB level to use
An example of the clean task to create a continuum image from many channels is given below:
clean(vis=’ggtau.1mm.split.ms’,
imagename=’ggtau.1mm’,
psfmode=’clark’,
imagermode=’’,
mask=’’,
niter=500, gain=0.1,
mode=’mfs’,
spw=’0~2:2~57’,
field=’0’,
stokes=’I’,
weighting=’briggs’,
rmode=’norm’,robust=0.5,
cell=[0.1,0.1],
imsize=[256,256])
#
#
#
#
#
#
#
#
#
#
#
#
#
#
Use data in ggtau.1mm.split.ms
Name output images ’ggtau.1mm.*’ on disk
Use the Clark CLEAN algorithm
Do not mosaic or use csclean
Do not use clean box or mask
Iterate 500 times using gain of 0.1
multi-frequency synthesis (combine channels)
Combine channels from 3 spectral windows
Image stokes I polarization
Use Briggs robust weighting
with robustness parameter of 0.5
Using 0.1 arcsec pixels
Set image size = 256x256 pixels
This example will clean the entire inner quarter of the primary beam. However, if you want to
limit the region over which you allow the algorithm to find clean components then you can make a
deconvolution region (or mask). To create a deconvolution mask, use the makemask task and input
that mask as a keyword into the task above.
CHAPTER 5. SYNTHESIS IMAGING
Or you can set up a simple cleanbox region. To do this,
make a first cut at the image and clean the inner quarter.
Then use the viewer to look at the image and get an idea
of where the emission is located. You can use the viewer
adjustment panel to view the image in pixel coordinates
and read out the pixel locations of your cursor.
202
Inside the Toolkit:
The im.clean method is used for
CLEANing data. There are a number of methods used to set up the
clean, including im.setoptions.
Then, you can use those pixel read-outs you just go to
define a clean box region where you specify the bottom-left-corner (blc) x & y and top-right-corner
x& y locations. For example, say you have a continuum source near the center of your image
between blcx, blcy, trcx, trcy = 80, 80, 120, 120. Then to use this region:
cleanbox=[80,80,120,120]
# Set the deconvolution region as a simple box in the center.
The following are the clean specific parameters and their allowed values, followed by a description
of carrying out interactive cleaning.
5.3.1
Parameter psfmode
The psfmode parameter chooses the “algorithm” that will be used to calculate the synthesized
beam for use during the minor cycles in the image plane. The value types are strings. Allowed
choices are ’clark’ (default) and ’hogbom’.
5.3.1.1
The clark algorithm
In the ’clark’ algorithm, the cleaning is split into minor and major cycles. In the minor cycles only
the brightest points are cleaned, using a subset of the point spread function. In the major cycle,
the points thus found are subtracted correctly by using an FFT-based convolution. This algorithm
is reasonably fast. Also, for polarization imaging, Clark searches for the peak in I 2 + Q2 + U 2 + V 2 .
5.3.1.2
The hogbom algorithm
The hogbom algorithm is the “Classic” image-plane CLEAN, where model pixels are found iteratively by searching for the peak. Each point is subtracted from the full residual image using the
shifted and scaled point spread function. In general, this is not a good choice for most imaging
problems (clark or csclean are preferred) as it does not calculate the residuals accurately. But in
some cases, with poor uv-coverage and/or a PSF with bad sidelobes, the Hogbom algorithm will
do better as it uses a smaller beam patch. For polarization cleaning, Hogbom searches for clean
peak in I, Q, U , and V independently.
5.3.1.3
The clarkstokes algorithm
In the ’clarkstokes’ algorithm, the Clark psf (§ 5.3.1.1) is used, but for polarization imaging the
Stokes planes are cleaned sequentially for components instead of jointly as in ’clark’. This means
CHAPTER 5. SYNTHESIS IMAGING
203
that this is the same as ’clark’ for Stokes I imaging only. This option can also be combined with
imagermode=’csclean’ (§ 5.3.4).
5.3.2
The multiscale parameter
BETA ALERT: The multiscale option is currently under development and should be used with
caution and be considered as an “experimental” algorithm. The multi-scale CLEAN method is
known to need careful tuning in order to properly converge. However, currently the only control
for multiscale in the clean task is the setting of the scales.
To activate multi-scale mode, specify a non-blank list of
scales in the multiscale parameter. e.g.
Inside the Toolkit:
The sources
im.setscales method sets the
multiscale = [0,3,10,30]
# Four scales including point
multi-scale Gaussian widths. In adThese are given in numbers of pixels, and specify FWHM dition to choosing a list of sizes in
pixels, you can just pick a number of
of the Gaussians used to compute the filtered images.
scales and get a geometric series of
Setting the multiscale parameter to a non-empty list
sizes.
opens up the sub-parameter:
multiscale
negcomponent
= [0, 3, 10, 30]
=
-1
#
#
set deconvolution scales (pixels)
Stop if largest scale finds this many neg components
The negcomponent sub-parameter is here to set the point
at which the clean terminates because of negative components. For negcomponent > 0, component search will
cease when this number of negative components are found at the largest scale. If negcomponent =
-1 then component search will continue even if the largest component is negative.
The CASA multi-scale algorithm uses “Multi-scale CLEAN” to deconvolve using delta-functions
and circular Gaussians as the basis functions for the model, instead of just delta-functions or pixels
as in the other clean algorithms. This algorithm is still in the experimental stage, mostly because
we are working on better algorithms for setting the scales for the Gaussians. The sizes of the
Gaussians are set using the scales sub-parameter.
We are working on defining a better algorithm for scale setting. In the toolkit, there is an nscale
argument which sets scales
θi = θbmin 10(i−N/2)/2
(5.7)
where N =nscales and θbmin is the fitted FWHM of the minor axis of the CLEAN beam.
5.3.3
Parameter gain
The gain parameter sets the fraction of the flux density in the residual image that is removed and
placed into the clean model at each minor cycle iteration. The default value is gain = 0.1 and is
suitable for a wide-range of imaging problems. Setting it to a smaller gain per cycle, such as gain
= 0.05, can sometimes help when cleaning images with lots of diffuse emission. Larger values, up
to gain=1, are probably too aggressive and are not recommended.
CHAPTER 5. SYNTHESIS IMAGING
204
Figure 5.1: Close-up of the top of the interactive clean window. Note the boxes at the left (where
the iterations, cycles, and threshold can be changed), the buttons that control add/erase, the
application of mask to channels, and whether to stop, complete, or continue cleaning, and the row
of Mouse-button tool assignment icons.
5.3.4
Parameter imagermode
This choose the mode of operation of clean, either as single-field deconvolution using image-plane
major and minor cycles only (imagermode=’’), single-field deconvolution using Cotton-Schwab
(CS) residual visibilities for major cycles (imagermode=’csclean’), or multi-field mosaics using
CS major cycles (imagermode=’mosaic’).
In the default mode (imagermode=’’), the major and minor clean cycles work off of the gridded
FFT dirty image, with residuals updated using the PSF calculation algorithm set by the psfmode
parameter (§ 5.3.1). This method is not recommended for high dynamic range or high fidelity
imaging applications, but can be significantly faster than CS clean. Note that for this option only,
if mask=’’ (no mask or box set) then it will clean the inner quarter of the image by default.
The csclean choice specifies the Cotton-Schwab algorithm. This opens up the sub-parameters
imagermode
cyclefactor
cyclespeedup
=
=
=
’csclean’
1.5
-1
#
#
#
Use csclean or mosaic. If ’’, use psfmode
Change depth in between of csclean cycle
Cycle threshold doubles in this number of iterations
These options are explained below. In the CS mode, cleaning is split into minor and major cycles.
For each field, a minor cycle is performed using the PSF algorithm specified in psfmode (§ 5.3.1).
At major-cycle breakpoints, the points thus found are subtracted from the original visibilities. A
fast variant does a convolution using a FFT. This will be faster for large numbers of visibilities. If
you want to be extra careful, double the image size from that used for the Clark clean and set a
CHAPTER 5. SYNTHESIS IMAGING
205
mask to clean only the inner quarter or less (this is not done by default). This is probably the best
choice for high-fidelity deconvolution of images without lots of large-scale structure.
Note that when using the Cotton-Schwab algorithm with a threshold (§ 5.3.12), there may be
strange behavior when you hit the threshold with a major cycle. In particular, it may be above
threshold again at the start of the next major cycle. This is particularly noticeable when cleaning
a cube, where different channels will hit the threshold at different times.
BETA ALERT: You will see a warning message in the logger, similar to this:
Zero Pixels selected with a Flux limit of 0.000551377 and a maximum Residual of 0.00751239
whenever it find 0 pixels above the threshold. This is normal, and not a problem, if you’ve specified
a non-zero threshold. On the other hand, if you get this warning with the threshold set to the default
of ’0Jy’, then you should look carefully at your inputs or your data, since this usually means that
the masking is bad.
The option imagermode=’mosaic’ is for multi-field mosaics.
parameters
imagermode
mosweight
ftmachine
scaletype
cyclefactor
cyclespeedup
=
=
=
=
=
=
’mosaic’
False
’mosaic’
’SAULT’
1.5
-1
#
#
#
#
#
#
This choice opens up the sub-
Use csclean or mosaic. If ’’, use psfmode
Individually weight the fields of the mosaic
Gridding method for the image
Controls scaling of pixels in the image plane.
change depth in between of csclean cycle
Cycle threshold doubles in this number of iteration
These options are explained below.
5.3.4.1
Sub-parameter cyclefactor
This sub-parameter is activated for imagermode=’csclean’
and ’mosaic’.
The cyclefactor parameter allows the user to change the
threshold at which the deconvolution cycle will stop and
then degrid and subtract the model from the visibilities
to form the residual. This is with respect to the breaks
between minor and major cycles that the clean part would
normally force. Larger values force a major cycle more
often.
Inside the Toolkit:
The im.setmfcontrol method sets
the parameters that control the cycles and primary beam used in mosaicing.
This parameter in effect controls the threshold used by CLEAN to test whether a major cycle break
and reconciliation occurs:
cycle threshold = cyclefactor * max sidelobe * max residual
CHAPTER 5. SYNTHESIS IMAGING
206
If your uv-coverage results in a poor PSF, then you should reconcile often (a cyclefactor of 4 or
5); For reasonable PSFs, use cyclefactor in the range 1.5 to 2.0. For good PSFs, or for faster
cleaning at the expense of some fidelity, we recommend trying a lower value, e.g. cyclefactor =
0.25, which at least in some of our mosaicing tests led to a speedup of around a factor of two with
little change in residuals.
5.3.4.2
Sub-parameter cyclespeedup
This sub-parameter is activated for imagermode=’csclean’ and ’mosaic’.
The cyclespeedup parameter allows the user to let clean to raise the threshold at which a major
cycle is forced if it is not converging to that threshold. To do this, set cyclespeedup to an integer
number of iterations at which if the threshold is not reached, the threshold will be doubled. See
cyclefactor above for more details. By default this is turned off (cyclespeedup = -1). In our
tests, a value like cyclespeedup = 50 has been used successfully.
5.3.4.3
Sub-parameter ftmachine
This sub-parameter is activated for imagermode=’mosaic’.
The ftmachine parameter controls the gridding method and kernel to be used to make the image.
A string value type is expected. Choices are: ’ft’, ’sd’, ’both’, or ’mosaic’ (the default).
The ’ft’ option uses the standard gridding kernel (as used in clean).
The ’sd’ option forces gridding as in single-dish data.
For combining single-dish and interferometer MS in the imaging, the ’both’ option will allow
clean to choose the ‘ft’ or ’sd’ machines as appropriate for the data.
The ’mosaic’ option (the default) uses the Fourier transform of the primary beam (the aperture cross-correlation
Inside the Toolkit:
function in the uv-plane) as the gridding kernel. This al- The im.setoptions method sets the
lows the data from the multiple fields to be gridded down parameters relevant to mosaic imagto a single uv-plane, with a significant speed-up in per- ing, such as the ftmachine.
formance in most (non-memory limited) cases. The effect
of this extra convolution is an additional multiplication
(apodization) by the primary beam in the image plane. This can be corrected for, but does result
in an image with optimal signal to noise ratio across it.
The primary beams used in CASA are described in § 5.2.13.
BETA ALERT: Note that making a non-square image (e.g. using unequal values in imsize) for
ftmachine=’mosaic’ will grid the data into a uv-plane with correspondingly non-square cells.
This has not been extensively tested, and may results in undesired image artifacts. We recommend
that the user make square mosaic images when possible, but in principle non-square images should
work.
CHAPTER 5. SYNTHESIS IMAGING
5.3.4.4
207
Sub-parameter mosweight
If mosweight=True then individual mosaic fields will receive independent weights, which will give
optimum signal to noise ratio.
If mosweight=False then the data will be weighted so that the signal-to-noise ratio is as uniform
as possible across the mosaic image.
5.3.4.5
Sub-parameter scaletype
The scaletype parameter controls weighting of pixels in
the image plane. This sub-parameter is activated for
imagermode=’mosaic’.
Inside the Toolkit:
The im.setmfcontrol method gives
more options for controlling the primary beam and noise across the image.
The default scaletype=’PBCOR’ scales the image to have
the correct flux scale across it (out to the beam level cutoff
minpb). This means that the noise level will vary across
the image, being increased by the inverse of the weighted
primary beam responses that are used to rescale the fluxes.
This option should be used with care, particularly if your data has very different exposure times
(and hence intrinsic noise levels) between the mosaic fields.
If scaletype=’SAULT’ then the image will be scaled so as to have constant noise across it. This
means that the point source response function varies across the image attenuated by the weighted
primary beam(s). However, this response is output in the .flux image and can be later used to
correct this.
Note that this scaling as a function of position in the image occurs after the weighting of mosaic
fields specified by mosweight and implied by the gridding weights (ftmachine and weighting).
5.3.4.6
The threshold revisited
For mosaics, the specification of the threshold is not straightforward, as it is in the single field case.
This is because the different fields can be observed to different depths, and get different weights in
the mosaic. For efficiency, clean does its component search on a weighted and scales version of the
sky.
For ftmachine=’ft’, the minor cycles of the deconvolution are performed on an image that has
been weighted to have constant noise, as in ’SAULT’ weighting (see § 5.3.4.5). This is equivalent
to making a dirty mosaic by coadding dirty images made from the individual pointings with a
sum of the mosaic contributions to a given pixel weighted by so as to give constant noise across
the image. This means that the flux scale can vary across the mosaic depending on the effective
noise (higher weighted regions have lower noise, and thus will have higher “fluxes” in the ’SAULT’
map). Effectively, the flux scale that threshold applies to is that at the center of the highestweighted mosaic field, with higher-noise regions down-scaled accordingly. Compared to the true
CHAPTER 5. SYNTHESIS IMAGING
208
sky, this image has a factor of the PB, plus a scaling map (returned in the .flux image). You will
preferentially find components in the low-noise regions near mosaic centers.
When ftmachine=’mosaic’, the underlying deconvolution is performed on a constant signal-tonoise image. This is equivalent to a dirty mosaic that is formed by coadding dirty images made
from the individual fields after apodizing each by the PB function. Thus compared to the true sky,
this has a factor of the PB2 in it. You will thus preferentially find components in the centers of the
mosaic fields (even more so than in the ’ft’ mosaics).
Both these cases should have the same flux scale in the centers of the lowest-noise pointings in the
mosaic. This is where the threshold units match those in the image being used in the minor cycle.
BETA ALERT: This is fairly complicated, and we are working on explaining this better and
possibly making this more straightforward to specify.
5.3.5
Parameter interactive
If interactive=True is set, then an interactive window will appear at various “cycle” stages while
you clean, so you can set and change mask regions. These breakpoints are controlled by the
npercycle sub-parameter which sets the number of iterations of clean before stopping.
interactive
npercycle
=
=
True
100
#
#
use interactive clean (with GUI viewer)
Number of iterations before interactive prompt
BETA ALERT: npercycle is currently the only way to control the breakpoints in interactive
clean.
See the example of interactive cleaning in § 5.3.13.
5.3.6
Parameter mask
The mask parameter takes a list of elements, each of which can be a list of coordinates specifying a
box, or a string pointing to the name of a cleanbox file, mask image, or region file. These are used
by CLEAN to define a region to search for components.
Note that for imagermode=’’ (§ 5.3.4) the default with mask=’’ is to restrict clean to the inner
quarter of the image.
5.3.6.1
Setting clean boxes
If mask is given a list, these are taken to be pixel coordinates for the blc and trc (bottom-left and
top-right corners) of one or more rectangular boxes. Each box is a four element list. For example,
mask = [ [110,110,150,145], [180,70,190,80] ]
defines two boxes.
CHAPTER 5. SYNTHESIS IMAGING
5.3.6.2
209
Using clean box files
You can provide mask a string with the name of an ASCII file containing the BLC, TRC of the
boxes with one box per line. Each line should contain five numbers
<fieldindex> <blc-x> <blc-y> <trc-x> <trc-y>
with whitespace separators. Currently the <fieldindex> is ignored.
Here is an example cleanbox file:
CASA <21>: !cat mycleanbox.txt
IPython system call: cat mycleanbox.txt
1 108 108 148 148
2 160 160 180 180
NOTE: In future patches we will include options for the specification of circular and polygonal
regions in the cleanbox file, as well as the use of world coordinates (not just pixel) and control
of plane ranges for the boxes. For now, use the mask mechanism for more complicated CLEAN
regions.
5.3.6.3
Using clean mask images
You can give the mask parameter a string containing the name of a mask image to be used for
CLEAN to search for components. You can use the makemask task to construct this mask, or use
one made using interactive=True (§ 5.3.5).
5.3.6.4
Using region files
You can give the mask parameter a string pointing to a file that describes a region. This region file
can be generated in the viewer (§ 7).
5.3.7
Parameter minpb
The minpb parameter sets the level down to which the primary beam (or more correctly the voltage
patterns in the array) can go and have a given pixel included in the image. This is important as
it defines where the edge of the visible image or mosaic is. The default is 0.1 or equivalent to the
10% response level. If there is alot of emission near the edge, then set this lower if you want to be
able to clean it out.
NOTE: The minpb parameter is the level in the “primary beam” (PB) at which the cut is made. If
you are using ftmachine=’mosaic’ (§ 5.3.4.3), this will show up in the .flux.pbcoverage image
(new in version 2.4.0). See the discussion of threshold (§ 5.3.4.6) for related issues.
CHAPTER 5. SYNTHESIS IMAGING
5.3.8
210
Parameter modelimage
The modelimage parameter specifies the name(s) of one or more input starting image(s) to use to
calculate the first residual before cleaning. These are used in addition to any image with a name
defaulting from the imagename root (e.g. on a restart). The output model will contain this model
plus clean components found during deconvolution.
If the units of the image are Jy/pixel, then this is treated as a model image.
If the units of the image are Jy/beam or Jy per solid angle, then this is treated as a “single-dish”
image and rescaled by the resolution (in the ’beam’ image header keyword). Inclusion of the SD
image here is superior to feathering it in later. See § 5.5 for more information on feathering.
5.3.9
Parameter niter
The niter parameter sets the maximum total number of minor-cycle CLEAN iterations to be
performed during this run of clean. If restarting from a previous state, it will carry on from where
it was. Note that the threshold parameter can cause the CLEAN to be terminated before the
requested number of iterations is reached.
5.3.10
Parameter pbcor
The pbcor parameter controls whether the final .image is scaled to correct for the Primary Beam
of the array or not.
If pbcor=False (the default), then no such scaling is done and the image is in whatever “raw” scaling
used by the imagermode algorithm underneath. For single-field cleaning with imagermode=’’ or
’csclean’, this is the standard constant-noise image. If imagermode=’mosaic’, then this is the
’SAULT’ scaled image (regardless of what scaletype is set to).
If pbcor=True, the at the end of deconvolution and imaging the “raw” image is rescaled by dividing
by the noise and PB correction image. This is what is output by clean as the .flux image.
Note that regardless of what you set pbcor to, you can recover the other option using immath
(§ 6.5) to either multiply or divide by the .flux image.
5.3.11
Parameter restoringbeam
The restoringbeam parameter allows the user to set a specific Gaussian restoring beam to make
the final restored .image from the final .model and residuals.
If restoringbeam=’’ (the default), then the restoring beam is calculated by fitting to the PSF
(e.g. the .psf image). For a mosaic, this is at the center of the field closest to the phasecenter.
To specify a restoring beam, provide restoringbeam a list of [bmaj, bmin, bpa] which are the parameters of an elliptical Gaussian. The default units are in arc-seconds for bmaj, bmin components
and degrees for the bpa component.
CHAPTER 5. SYNTHESIS IMAGING
211
For example,
restoringbeam=[’10arcsec’]
restoringbeam=[’10.0’,’5.0’,’45.0deg’]
5.3.12
# circular Gaussian FWHM 10"
# 10"x5" at PA=45 degrees
Parameter threshold
The threshold parameter instructs clean to terminate when the maximum (absolute?) residual
reaches this level or below. Note that it may not reach this residual level due to the value of the
niter parameter which may cause it to terminate early.
If threshold is given a floating-point number, then this is the threshold in milli-Jansky.
You can also supply a flux density quanta to threshold, e.g.
threshold = ’8.0mJy’
threshold = ’0.008Jy’
(these do the same thing).
5.3.13
Interactive Cleaning — Example
If interactive=True is set, then an interactive window will appear at various “cycle” stages while
you clean, so you can set and change mask regions. These breakpoints are controlled by the
npercycle sub-parameter which sets the number of iterations of clean before stopping.
The window controls are fairly self-explanatory. It is basically a form of the viewer. A close-up of
the controls are shown in Figure 5.1, and an example can be found in Figures 5.2–5.4. You assign
one of the drawing functions (rectangle or polygon, default is rectangle) to the right-mouse button
(usually), then use it to mark out regions on the image. Zoom in if necessary (standard with the
left-mouse button assignment). Double-click inside the marked region to add it to the mask. If you
want to reduce the mask, click the Erase radio button (rather than Add), then mark and select as
normal. When finished setting or changing your mask, click the green clockwise arrow “Continue
Cleaning” Next Action button. If you want to finish your clean with no more changes to the mask,
hit the blue right arrow “Apply mask edits and proceed with non-interactive clean” button. If you
want to terminate the clean, click the red X “Stop deconvolving now” button.
While stopped in an interactive step, you can change a number of control parameters in the boxes
provided at the left of the menu bar. The main use of this is to control how many iterations
before the next breakpoint (initially set to npercycle), how many cycles before completion (initially
equal to niter/npercycle), and to change the threshold for ending cleaning. Typically, the user
would start with a relatively small number of iterations (50 or 100) to clean the bright emission
in tight mask regions, and then increase this as you get deeper and the masking covers more of
the emission region. For extended sources, you may end up needing to clean a large number of
components (10000 or more) and thus it is useful to set niter to a large number to begin with
— you can always terminate the clean interactively when you think it is done. Note that if you
CHAPTER 5. SYNTHESIS IMAGING
212
Figure 5.2: Screen-shots of the interactive clean window during deconvolution of the VLA 6m
Jupiter dataset. We start from the calibrated data, but before any self-calibration. In the initial
stage (left), the window pops up and you can see it dominated by a bright source in the center.
Next (right), we zoom in and draw a box around this emission. We have also at this stage dismissed
the tape deck and Position Tracking parts of the display (§ 7.2.1) as they are not used here. We
have also changed the iterations to 30 for this boxed clean. We will now hit the Next Action
Continue Cleaning button (the green clockwise arrow) to start cleaning.
change iterations you may also want to change cycles or your clean may terminate before you
expect it to.
For strangely shaped emission regions, you may find using the polygon region marking tool (the
second from the right in the button assignment toolbar) the most useful.
See the example of cleaning and self-calibrating the Jupiter 6cm continuum data given below in
Appendix F.2. The sequence of cleaning starting with the “raw” externally calibrated data is shown
in Figures 5.2 – 5.4.
The final result of all this cleaning for Jupiter is shown in Figure 5.5. The viewer (§ 7) was used
to overplot the polarized intensity contours and linear polarization vectors calculated using immath
(§ 6.5) on the total intensity. See the following chapters on how to make the most of your imaging
results.
CHAPTER 5. SYNTHESIS IMAGING
213
Figure 5.3: We continue in our interactive cleaning of Jupiter from where Figure 5.2 left off. In the
first (left) panel, we have cleaned 30 iterations in the region previously marked, and are zoomed in
again ready to extend the mask to pick up the newly revealed emission. Next (right), we have used
the Polygon tool to redraw the mask around the emission, and are ready to Continue Cleaning
for another 100 iterations.
For spectral cube images you can use the tapedeck to move through the channels. You also use the
panel with radio buttons for choosing whether the mask you draw applies to the Diplayed Plane
or to All Channels. See Figure 5.6 for an example. Note that currently the Displayed Plane
option is set by default. This toggle is unimportant for single-channel images or mode=’mfs’.
Advanced Tip: Note that while in interactive clean, you are using the viewer. Thus, you have
the ability to open and register other images in order to help you set up the clean mask. For
example, if you have a previously cleaned image of a complex source or mosaic that you wish to
use to guide the placement of boxes or polygons, just use the Open button or menu item to bring
in that image, which will be visible and registered on top of your dirty residual image that you are
cleaning on. You can then draw masks as usual, which will be stored in the mask layer as before.
Note you can blink between the new and dirty image, change the colormap and/or contrast, and
carry out other standard viewer operations. See § 7 for more on the use of the viewer.
BETA ALERT: Currently, interactive spectral line cleaning is done globally over the cube, with
halts for interaction after searching all channels for the requested npercycle total iterations. It is
CHAPTER 5. SYNTHESIS IMAGING
214
Figure 5.4: We continue in our interactive cleaning of Jupiter from where Figure 5.3 left off. In
the first (left) panel, it has cleaned deeper, and we come back and zoom in to see that our current
mask is good and we should clean further. We change npercycle to 500 (from 100) in the box
at upper right of the window. In the final panel (right), we see the results after this clean. The
residuals are such that we should terminate the clean using the red X button and use our model
for self-calibration.
more convenient for the user to treat the channels in order, cleaning each in turn before moving
on. This will be implemented in an upcoming update.
5.3.14
Mosaic imaging
The clean task contains the capability to image multiple pointing centers together into a single
“mosaic” image. This ability is controlled by setting imagermode=’mosaic’ (§ 5.3.4).
The key parameter that controls how clean produces the mosaic is the ftmachine sub-parameter
(§ 5.3.4.3). For ftmachine=’ft’, clean will perform a weighted combination of the images produced by transforming each mosaic pointing separately. This can be slow, as the individual subimages must be recombined in the image plane. NOTE: this option is preferred for data taken
with sub-optimal mosaic sampling (e.g. fields too far apart, on a sparse irregular pattern, etc.).
CHAPTER 5. SYNTHESIS IMAGING
215
Figure 5.5: After clean and self-calibration using the intensity image, we arrive at the final polarization image of Jupiter. Shown in the viewer superimposed on the intensity raster is the linear
polarization intensity (green contours) and linear polarization B-vectors (vectors). The color of the
contours and the sampling and rotation by 90 degrees of the vectors was set in the Display Options
panel. A LEL expression was used in the Load Data panel to mask the vectors on the polarized
intensity.
The primary beams used in CASA are described in § 5.2.13.
If ftmachine=’mosaic’, then the data are gridded onto a single uv-plane which is then transformed to produce the single output image. This is accomplished by using a gridding kernel
that approximates the transform of the primary beam pattern. Note that for this mode the
<imagename>.flux image includes this convolution kernel in its effective weighted response pattern (needed to “primary-beam correct” the output image). For this mode only, an additional
image <imagename>.flux.pbcoverage is produced that is the primary-beam coverage only used
to compute the minpb cutoff (§ 5.3.7).
BETA ALERT: In order to avoid aliasing artifacts for ftmachine=’mosaic’ in the mosaic image,
due to the discrete sampling of the mosaic pattern on the sky, you should make an image in which
CHAPTER 5. SYNTHESIS IMAGING
216
Figure 5.6: Screen-shot of the interactive clean window during deconvolution of the NGC5921
spectral line dataset. Note where we have selected the mask to apply to the Displayed Plane
rather than All Channels. We have just used the Polygon tool to draw a mask region around the
emission in this channel, which will apply to this channel only.
the desired unmasked part of the image (above minpb) lies within the inner quarter. In other words,
make an image twice as big as necessary to encompass the mosaic.
It is also important to choose an appropriate phasecenter for your output mosaic image (§ section:im.pars.phasecenter).
An example of a simple mosaic clean call is shown below:
CHAPTER 5. SYNTHESIS IMAGING
clean(vis=’n4826_tboth.ms’,
imagename=’tmosaic’,
mode=’channel’,
nchan=30,start=46,
width=4,
spw=’0~2’,
field=’0~6’,
cell=[1.,1.],
imsize=[256,256],
stokes=’I’,
psfmode=’clark’,
niter=500,
imagermode=’mosaic’,
scaletype=’SAULT’,
cyclefactor=0.1)
217
# Make the output cube 30 chan
# start with 46 of spw 0, avg by 4 chans
Another example of mosaic imaging, this time using 3mm BIMA data, is given in Appendix F.3.
5.3.15
Heterogeneous imaging
The clean task and underlying tools can now handle cases where there are multiple dish sizes,
and thus voltage patterns and primary beams, in the array. This is effected by using the dish sizes
stored in the ANTENNA sub-table of the MS. Depending on how the data was written and imported
into CASA, the user may have to manually edit this table to insert the correct dish sizes (e.g. using
browsetable or the tb table tool).
BETA ALERT: This feature is new in Patch 3, and has not been extensively tested. Currently,
this works only for an MS where the OBSERVATORY keyword is CARMA, ALMA, or is unknown.
You must set imagermode=’mosaic’ with ftmachine=’mosaic’, even when imaging a single field,
to use this feature. This will be improved, and made easier to set and use, in future releases.
5.3.16
Polarization imaging
The clean task handles full and partial Stokes polarization imaging through the setting of the
stokes parameter (§ 5.2.9). The subsequent deconvolution of the polarization planes of the image
and the search for clean components is controlled by the psfmode parameter (§ 5.3.1). If the stokes
parameter includes polarization planes other than I, then choosing psfmode=’hogbom’ (§ 5.3.1.2)
or psfmode=’clarkstokes’ (§ 5.3.1.3) will clean (search for components) each plane sequentially,
while psfmode=’clark’ (§ 5.3.1.1) will deconvolve jointly.
The interactive clean example given above (§ 5.3.13) shows a case of polarization imaging. You
can also find the script for this example in Appendix F.2.
CHAPTER 5. SYNTHESIS IMAGING
5.4
218
Wide-field imaging and deconvolution (widefield)
When imaging sufficiently large angular regions, the sky can no longer be treated as a twodimensional plane and the use of the standard clean task will produce distortions around sources
that become increasingly severe with increasing distance from the phase center. In this case, one
must use a “wide-field” imaging algorithm such as w-projection or faceting.
When is wide-field imaging needed? It depends on the expected dynamic range the image. In order
to keep the phase error associated with the sky/array curvature less than about 5◦ (good to about
500:1 dynamic range), use the following table, suitably scaled, for guidance:
Maximum Radius of Image Before widefield is Needed
Assuming 5 deg phase error and 35-km Baseline
Wavelength
6 cm
20 cm
90 cm
Radius
1.4
2.6
5.3
of image
arcmin
arcmin
arcmin
Radius of image ~ SQRT (Wavelength * phase error / Maximum baseline)
(arcmin)
(cm)
(deg)
(km)
If a relatively small image is being made, but there are outliers sources beyond the above limits,
then widefield should also be used.
The task widefield has been introduced for this purpose. This is currently a prototype task that
can be used to make and deconvolve a wide-field image (e.g. from low frequency data). It contains
most, but not all, of the flexibility of clean. The w-term is handled using a combination of wprojection and faceting. Besides making large area undistorted images, widefield can be used to
outlying fields to image isolated regions (e.g. containing bright confusing sources) distant from the
field center.
The inputs for widefield are:
# widefield :: Wide-field imaging
vis
=
[’’]
#
imagename
=
#
outlierfile
=
’’
#
field
=
’’
#
spw
=
’’
#
selectdata
=
False
#
mode
=
’mfs’
#
niter
=
500
#
gain
=
0.1
#
threshold
=
’0.0Jy’
#
psfmode
=
’clark’
#
ftmachine
= ’wproject’
#
wprojplanes =
256
#
facets
=
1
#
and deconvolution with selected algorithm
name of input visibility file
Pre-name of output images
Text file with image names, sizes, centers
Field Name
Spectral windows:channels: ’’ is all
Other data selection parameters
Type of selection (mfs, channel, velocity, frequency)
Maximum number of iterations
Loop gain for cleaning
Flux level to stop cleaning. Must include units
Algorithm to use (clark, hogbom)
Gridding method for the image (wproject, ft)
Number of planes to use in w-convolution function
Number of facets along each axis in main image only
CHAPTER 5. SYNTHESIS IMAGING
multiscale
interactive
mask
imsize
cell
phasecenter
restfreq
stokes
weighting
cyclefactor
219
=
[]
# set deconvolution scales (pixels), default: single scale
=
False
# use interactive clean (with GUI viewer)
=
[]
# cleanbox(es), mask image(s), and/or region(s)
= [256, 256]
# Image size in pixels (nx,ny), symmetric for single value
= [’1.0arcsec’, ’1.0arcsec’] # The image cell size in arcseconds [x,y].
=
’’
# Field Identififier or direction of the image phase center
=
’’
# rest frequency to assign to image (see help)
=
’I’
# Stokes params to image (I,IV,QU,IQUV,RR,LL,XX,YY,RRLL,XXYY)
= ’natural’
# Weighting to apply to visibilities
=
1.5
# Change the threshold at which the deconvolution cycle will stop,
#
degrid, and subtract from the visiblities.
=
-1
# Cycle threshold doubles in this number of iterations
=
False
# Apply additional uv tapering of visibilities.
=
[’’]
# Output Gaussian restoring beam for CLEAN image
=
False
# If true the taskname must be started using widefield(...)
cyclespeedup
uvtaper
restoringbeam
async
Most of the parameters are similar to clean and should be reviewed there. Specialized parameters
for widefield are as follows:
The task widefield can be used in two major modes: First, the w-projection mode as chosen with
ftmachine deals with the w-term (the phase associated with the sky/array curvature) internally.
Secondly, the image can be broken into many facets, each small enough so that the w-term is not
significant. These two basic methods can be combined, and are discussed below in § 5.4.1.
When using widefield, the position and image size of each image must be specified. This can be
done in two ways. The first method uses input from a text file outlierfile. For example:
vis
imagename
outlierfile
imsize
cell
phasecenter
=
=
=
=
=
=
’wfield.ms’
’wf’
’setup.txt’
[256, 256]
’1.0arcsec’
’’
#
#
#
#
#
#
name of input visibility file
Pre-name of output images
Text file with image names, sizes, centers
Image size in pixels (nx,ny), symmetric for single value
The image cell size in arcseconds [x,y].
Field Identififier or direction of the image phase center
The cell is identical for all fields, and imsize and phasecenter are not used. The output image
names will be wf.main, wf.out1, etc.
The file outlierfile="setup.txt" is an AIPS-style field file used to locate outlier fields. For
example:
C
C
main 2048 2048
out1 128 128
13 27 20.98
13 30 52.158
etc
43 26 28.0
43 23 08.00
# Main field with image size and phase center
# First outlier field specification
will make a big main image with outliers. The C in column 1 must be present, although it not
presently used.
The alternative input, needing no additional outlier file, versus imsize plus phasecenter: is:
CHAPTER 5. SYNTHESIS IMAGING
vis
imagename
outlierfile
imsize
cell
phasecenter
=
=
=
=
=
=
220
’wfield.ms’
# name of input visibility file
’wf’
# Pre-name of output images
’image_setup.txt’ # Text file with image names, sizes, centers
[2048, 2048, 128, 128] # Image size in pixels (nx,ny)
’1.0arcsec’
# The image cell size in arcseconds [x,y].
[’J2000 13h27m20.98 43d26m28.0’, ’J2000 13h30m52.158 43d23m08.00’]
The other parameters are described in clean, and multi-scale cleaning in available. Mosaicing and
MEM is not yet included in widefield.
5.4.1
ftmachine modes for widefield
The crucial part of widefield is the parameters under ftmachine. The three types of use are: (1)
w-projection only; (2) facets only; (3) w-projection with facets.
5.4.1.1
pure w-projection
The “pure” w-projection mode is invoked using ftmachine=’wproject’:
ftmachine
= ’wproject’
wprojplanes =
64
facets
=
1
#
#
#
Gridding method for the image (wproject, ft)
Number of planes to use in wprojection convolutiuon function
Number of facets along each axis in main image only
A reasonable value for wprojplanes is equal to nw = Bmax (inkλ) × imagewidth(inarcmin2 )/600,
with a minimum value of nw = 16. The w-projection algorithm is much faster than using faceting,
but it does consume a lot of memory. On most 32-bit machines with 1 or 2 Mbytes of memory,
images larger than about 4000 × 4000 cannot be made.
5.4.1.2
faceting only
Faceting only mode will break the image into many small parts. This is invoked using ftmachine=’ft’:
ftmachine
facets
=
=
’ft’
7
#
#
Gridding method for the image (wproject, ft)
Number of facets along each axis in main image only
In this example the image is broken into 49 (7 × 7) facets.
A reasonable value of facets is such that the image width of each facet does not need the w-term
correction. The computation method with pure faceting is slow, so that wprojection is recommended
CHAPTER 5. SYNTHESIS IMAGING
5.4.1.3
221
combination of w-projection and faceting
You can also use a combination of wprojection and faceting with ftmachine=’wproject’:
ftmachine
= ’wproject’
wprojplanes =
32
facets
=
3
#
#
#
Gridding method for the image (wproject, ft)
Number of planes to use in wprojection convolutiuon function
Number of facets along each axis in main image only
This hybrid method allows for a smaller number of wprojplanes in order to try to conserve memory
if the image size approached the memory limit of the computer. However, there is a large penalty
in execution time.
5.5
Combined Single Dish and Interferometric Imaging (feather)
The term “feathering” is used in radio imaging to describe how to combine or “feather” two
images together by forming a weighted sum of their Fourier transforms in the (gridded) uv-plane.
Intermediate size scales are down-weighted to give interferometer resolution while preserving singledish total flux density.
The feathering technique does the following:
1. The single-dish and interferometer images are Fourier transformed.
2. The beam from the single-dish image is Fourier transformed (F T SDB(u, v)).
3. The Fourier transform of the interferometer image is multiplied by (1 − F T SDB(u, v)). This
basically down weights the shorter spacing data from the interferometer image.
4. The Fourier transform of the single-dish image is scaled by the volume ratio of the interferometer restoring beam to the single dish beam.
5. The results from 3 and 4 are added and Fourier transformed back to the image plane.
The term feathering derives from the tapering or downweighting of the data in this technique; the overlapping,
shorter spacing data from the deconvolved interferometer
image is weighted down compared to the single dish image while the overlapping, longer spacing data from the
single-dish are weighted down compared to the interferometer image.
Other Packages:
The feather task is analogous
to the AIPS IMERG task and the
MIRIAD immerge task with option
’feather’.
The tapering uses the transform of the low resolution point spread function. This can be specified
as an input image or the appropriate telescope beam for the single-dish. The point spread function
for a single dish image may also be calculated using clean.
CHAPTER 5. SYNTHESIS IMAGING
222
Advice: Note that if you are feathering large images, be advised to have the number of pixels along
the X and Y axes to be composite numbers and definitely not prime numbers. In general FFTs
work much faster on even and composite numbers. You may use subimage function of the image
tool to trim the number of pixels to something desirable.
The inputs for feather are:
imagename
highres
lowres
async
=
=
=
=
’’
’’
’’
False
#
#
#
#
Name of output feathered image
Name of high resolution (synthesis) image
Name of low resolution (single dish) image
If true the taskname must be started using feather(...)
Note that the only inputs are for images. Note that feather does not do any deconvolution but
combines presumably deconvolved images after the fact.
Starting with a cleaned synthesis image and a low resolution image from a single dish telescope,
the following example shows how they can be feathered:
feather(imagename=’feather.im’,
highres=’synth.im’,
owres=’single_dish.im’
)
# Create an image called feather.im
# The synthesis image is called synth.im
# The SD image is called single_dish.im
Note that the single dish image must have a well-defined beam shape and the correct flux units for
a model image (Jy/beam instead of Jy/pixel) so use the tasks imhead and immath first to convert
if needed.
5.6
Making Deconvolution Masks (makemask)
For most careful imaging, you will want to restrict the region over which you allow CLEAN components to be found. To do this, you can create a ’deconvolution region’ or ’mask’ image using the
makemask task. This is useful if you have a complicated region over which you want to clean and
it will take many clean boxes to specify.
The parameter inputs for makemask are:
#
makemask :: Derive a mask image from a cleanbox and set of imaging parameters:
cleanbox
vis
imagename
mode
imsize
cell
phasecenter
stokes
field
spw
=
[]
=
’’
=
’’
=
’mfs’
= [256, 256]
=
[1, 1]
=
’’
=
’I’
=
’0’
=
’0’
#
#
#
#
#
#
#
#
#
#
Clean box file or regions
Name of input visibility file (if no input image)
Name of output mask images
Type of selection (mfs, channel, velocity)
Image size in spatial pixels [x,y]
Cell size in arcseconds
Field identifier or direction of the phase center
Stokes parameter to image (I,IV,IQU,IQUV)
Field ids list to use in mosaic
Spectral window identifier (0-based)
CHAPTER 5. SYNTHESIS IMAGING
223
The majority of the parameters are the standard imaging parameters (§ 5.2). The cleanbox
parameter uses the syntax for cleanboxes as in the clean parameter mask (see § 5.3.6), with the
option for ’interactive’ also. The imagename parameter specifies the name for the output mask
image.
You can use the viewer to figure out the cleanbox blc-trc x-y settings, make the mask image, and
then bring it into the viewer as a contour image over your deconvolved image to compare exactly
where your mask regions are relative to the actual emission. In this example, create a mask from
many cleanbox regions specified in a file on disk (cleanboxes.txt) containing
1 80 80 120 120
2 20 40 24 38
3 70 42 75 66
where each line specifies the field index and the blc x-y and trc x-y positions of that cleanbox. For
example, in casapy, you can do this easily:
CASA <29>: !cat > cleanboxes.txt
IPython system call: cat > cleanboxes.txt
1 80 80 120 120
2 20 40 24 38
3 70 42 75 66
<CNTL-D>
CASA <30>: !cat cleanboxes.txt
IPython system call: cat cleanboxes.txt
1 80 80 120 120
2 20 40 24 38
3 70 42 75 66
Then, in CASA,
makemask(vis=’source.ms’,
imagename=’source.mask’,
cleanbox=’cleanboxes.txt’,
mode=’mfs’,
imsize=[200,200])
cell=[0.1,0.1],
spw=’0,1,2’,
field=’0’,
stokes=’I’)
#
#
#
#
#
#
make a multi-frequency synthesis map (combine channels)
Set image size = 200x200 pixels
Using 0.1 arcsec pixels
Combine channels from 3 spectral windows
Use the first field in this split dataset
Image stokes I polarization
This task will then create a mask image that has the 3 cleanboxes specified in the cleanboxes.txt
file.
You can also specify the cleanbox as a list (of lists) of blc,trc pairs (4 veritices), e.g.
cleanbox = [[80, 80, 120, 120], [20, 40, 24, 38], [70, 42, 75, 66]]
is equivalent to the cleanboxes.txt given above. Likewise,
CHAPTER 5. SYNTHESIS IMAGING
224
cleanbox = [80, 80, 120, 120]
puts in a single cleanbox.
Note that you must specify a visibility dataset and create the image properties so the mask image
will have the same dimensions as the image you want to actually clean.
BETA ALERT: Eventually we will add functionality to deal with the creation of non-rectangular
regions and with multi-plane masks. There is also no cleanbox=’interactive’ version currently
available. You have to run clean with cleanbox=’interactive’ to generate a mask graphically.
5.7
Transforming an Image Model (ft)
The ft task will Fourier transform an image and insert the
resulting model into the MODEL DATA column of a Measurement Set. You can also convert a CLEAN component list
to a model and insert that into the MODEL DATA column.
The MS MODEL DATA column is used, for example, to hold
the model for calibration purposes in the tasks and toolkit.
This is especially useful if you have a resolved calibrator
and you want to start with a model of the source before
you derive accurate gain solutions. This is also helpful for
self-calibration (see § 5.9 below).
Inside the Toolkit:
The im.ft method does what the ft
task does. Its main use is setting
the MODEL DATA column in the MS so
that the cb tool can use it for subsequent calibration.
The inputs for ft are:
vis
fieldid
field
model
complist
incremental
=
=
=
=
=
=
’’
0
’’
’’
’’
False
#
#
#
#
#
#
Name of input visibility file
Field index identifier
Field name list
Name of input model image
Name of component list
Add to the existing MODEL_DATA column?
An example of how to do this:
ft(vis=’n75.ms’,
field=’1328’,
model=’1328.model.image’)
# Start with the visibility dataset n75.ms
# Select field name ’1328+307’ (minimum match)
# Name of the model image you have already
This task will Fourier transform the model image and insert the resulting model in the MODEL DATA
column of the rows of the MS corresponding to the source 1328+307.
Note that after clean, the transform of the final model is left in the MODEL DATA column so you
can go directly to a self-calibration step without explicitly using ft.
CHAPTER 5. SYNTHESIS IMAGING
5.8
225
Image-plane deconvolution (deconvolve)
If you have only an image (obtained from some telescope) and an image of its point spread function,
then you can attempt a simple image-plane deconvolution. Note that for interferometer data, full
uv-plane deconvolution using clean or similar algorithm is superior!
The default inputs for deconvolve are:
#
deconvolve :: Deconvoving a point spread function from an image
imagename
model
psf
alg
niter
gain
threshold
mask
async
=
=
=
=
=
=
=
=
=
’’
’’
’’
’clark’
10
0.1
’0.0Jy’
’’
False
#
#
#
#
#
#
#
#
#
Name of image to decolvolve
Name of output image to which deconvolved components are stored
Name of psf or gaussian parameters if psf is assumed gaussian
Deconvolution alorithm to use
number of iteration to use in deconvolution process
CLEAN gain parameter
level below which sources will not be deconvolved
Name of image that has mask to limit region of deconvolution
if True run in the background, prompt is freed
The algorithm (alg) options are: ’clark’, ’hogbom’, ’multiscale’ or ’mem’. The ’multiscale’
and ’mem’ options will open the usual set of sub-parameters for these methods.
5.9
Self-Calibration
Once you have a model image or set of model components reconstructed from your data using one
of the deconvolution techniques described above, you can use it to refine your calibration. This is
called self-calibration as it uses the data to determine its own calibration (rather than observations
of special calibration sources).
In principle, self-calibration is no different than the calibration process we described earlier (§ 4).
In effect, you alternate between calibration and imaging cycles, refining the calibration and the
model as you go. The trick is you have to be careful, as defects in early stages of the calibration
can get into the model, and thus prevent the calibration from improving. In practice, it is best to
not clean very deeply early on, so that the CLEAN model contains correct components only.
One important thing to keep in mind is that the self-calibration relies upon having the most recent
Fourier transform of the model in the MODEL DATA column of the MS. This is indeed the case if
you follow the imaging (using clean) directly by the self-calibration. If you have done something
strange in between and have lost or overwritten the MODEL DATA column (for example done some
extra cleaning that you do not want to keep), then use the ft task (see § 5.7 above), which fills the
MODEL DATA column with the Fourier transform of the specified model or model image.
Likewise, during self-calibration (once you have a new calibration solution) the imaging part relies
upon having the CORRECTED DATA column contain the self-calibrated data. This is done with the
applycal task (§ 4.6.1).
CHAPTER 5. SYNTHESIS IMAGING
226
The clearcal command can be used during the self-calibration if you need to clear the CORRECTED DATA
column and revert to the original DATA. If you need to restore the CORRECTED DATA to any previous
stage in the self-calibration, use applycal again with the appropriate calibration tables.
BETA ALERT: In later patches we will change the tasks so that users need not worry what is
contained in the MS scratch columns and how to fill them. CASA will handle that underneath for
you!
For now, we refer the user back to the calibration chapter for a reminder on how to run the
calibration tasks.
See the example of cleaning and self-calibrating the Jupiter 6cm continuum data given below in
Appendix F.2.
5.10
Examples of Imaging
See the scripts provied in Appendix F for examples of imaging. In particular, we refer the interested
user to the demonstrations for:
• NGC5921 (VLA HI) — a quick demo of basic CASA spectral line cube imaging and analysis
(F.1)
• Jupiter (VLA 6cm continuum polarimetry) — polarization imaging and analysis (F.2)
• NGC4826 (BIMA 3mm CO) — mosaic imaging of spectral line data (F.3)
Chapter 6
Image Analysis
Once data has been calibrated (and imaged in the case of
synthesis data), the resulting image or image cube must be
displayed or analyzed in order to extract quantitative information, such as statistics or moment images. In addition,
there need to be facilities for the coordinate conversion of
images for direct comparison. We have assembled a skeleton of image analysis tasks for this release. Many more are
still under development.
Inside the Toolkit:
Image analysis is handled in the ia
tool. Many options exist there, including region statistics and image
math. See § 6.12 below for more information.
The image analysis tasks are:
• imhead — summarize and manipulate the “header” information in a CASA image (§ 6.2)
• imcontsub — perform continuum subtraction on a spectral-line image cube (§ 6.3)
• imfit — image plane Gaussian component fitting (§ 6.4)
• immath — perform mathematical operations on or between images (§ 6.5)
• immoments — compute the moments of an image cube (§ 6.6)
• imstat — calculate statistics on an image or part of an image (§ 6.7)
• imval — extract the data and mask values from a pixel or region of an image (§ 6.8)
• imregrid — regrid an image onto the coordinate system of another image (§ 6.9)
• imsmooth — smooth images in the spectral and angular directions (§ 6.10)
• importfits — import a FITS image into a CASA image format table (§ 6.11.2)
• exportfits — write out an image in FITS format (§ 6.11.1)
There are other tasks which are useful during image analysis. These include:
227
CHAPTER 6. IMAGE ANALYSIS
228
• viewer — there are useful region statistics and image cube slice and profile capabilities in
the viewer (§ 7)
We also give some examples of using the CASA Toolkit to aid in image analysis (§ 6.12).
6.1
Common Image Analysis Task Parameters
We now describe some sets of parameters are are common to the image analysis. These should
behave the same way in any of the tasks described in this section that they are found in.
6.1.1
Region Selection (box)
Area selection in the image analysis tasks is controlled by the box parameter or through the regions
parameter (§ 6.1.5).
The box parameter selects rectangular areas:
box
=
’’
#
Select one or more box regions
#
string containing blcx,blcy,trcx,trcy
#
#
#
#
#
#
#
#
#
A box selection in the directional portion of an image.
The directional portion of an image are the axes for right
ascension and declination, for example. Boxes are specified
by there bottom-left corner (blc) and top-right corner (trc)
as follows: blcx, blcy, trcx, trcy;
ONLY pixel values acceptable at this time.
Default: none (all);
Example: box=’0,0,50,50’
Example: box=’[10,20,30,40];[100,100,150,150]’
To get help on box, see the in-line help
help(par.box)
6.1.2
Plane Selection (chans, stokes)
The channel, frequency, or velocity plane(s) of the image is chosen using the chans parameter:
chans
=
’’
#
Select the channel(spectral) range
#
string containing channel range
#
immath, imstat, and imcontsub - takes a string listing
CHAPTER 6. IMAGE ANALYSIS
#
#
#
#
#
#
#
229
of channel numbers, velocity, and/or frequency
numbers, much like the spw paramter
Only channel numbers acceptable at this time.
Default: none (all);
Example: chans=’3~20’
chans="0,3,4,8"
chans="3~20,50,51"
The polarization plane(s) of the image is chosen with the stokes parameter:
stokes
=
’’
#
Stokes params to image (I,IV,IQU,IQUV)
#
string containing Stokes selections
#
#
#
#
#
#
#
Stokes parameters to image, may or may not be separated
by commas but best if you use commas.
Default: none (all); Example: stokes=’IQUV’;
Example:stokes=’I,Q’
Options: ’I’,’Q’,’U’,’V’,
’RR’,’RL’,’LR’,’LL’,
’XX’,’YX’,’XY’,’YY’,...
To get help on these parameters, see the in-line help
help(par.chans)
help(par.stokes)
Sometimes, as in the immoments task, the channel/plane selection is generalized to work on more
than one axis type. In this case, the planes parameter is used. This behaves like chans in syntax.
6.1.3
Lattice Expressions (expr)
Lattice expressions are strings that describe operations on a set of input images to form an output
image. These strings use the Lattice Expression Language (LEL). LEL syntax is described in detail
in AIPS++ Note 223
http://aips2.nrao.edu/docs/notes/223/223.html
BETA ALERT: This document was written in the context of glish-based AIPS++ and is not yet
updated to CASA syntax (see below).
The expr string contains the LEL expression:
expr
=
’’
#
Mathematical expression using images
#
string containing LEL expression
CHAPTER 6. IMAGE ANALYSIS
#
#
#
#
#
#
#
#
#
#
#
230
A mathematical expression, with image file names.
image file names must be enclosed in double quotes (")
Default: none
Example: expr=’min("image2.im")+(2*max("image1.im"))’
Available functions in the expr and mask paramters:
PI(), E(), SIN(), SINH(), ASIN(), COS(), COSH(), TAN(), TANH(),
ATAN(), EXP(), LOG(), LOG10(), POW(), SQRT(), COMPLEX(), CONJ()
REAL(), IMAG(), ABS(), ARG(), PHASE(), AMPLITUDE(), MIN(), MAX()
ROUND(), ISGN(), FLOOR(), CEIL(), REBIN(), SPECTRALINDEX(), PA(),
IIF(), INDEXIN(), REPLACE(), ...
For examples using LEL expr, see § 6.5.1 below.
BETA ALERT: As of Patch 2, LEL expressions use 0-based indices.
6.1.4
Masks (mask)
The mask string contains a LEL expression (see § 6.1.3 above). This string can be an on-the-fly
(OTF) mask expression or refer to an image pixel mask.
mask
=
’’
#
Mask to be applied to the images
#
string containing LEL expression
#
#
#
#
Name of mask applied to each image in the calculation
Default ’’ means no mask;
Example: mask=’"ngc5921.clean.cleanbox.mask">0.5’
mask=’mask(ngc5921.clean.cleanbox.mask)’
Note that the mask file supplied in the mask parameter must have the same shape, same number
of axes and same axes length, as the images supplied in the expr parameter, with one exception.
The mask may be missing some of the axes — if this is the case then the mask will be expanded
along these axes to become the same shape.
For examples using mask, see § 6.5.2 below.
6.1.5
Regions (region)
The region parameter points to an ImageRegion file. An ImageRegion file can be created with the
CASA viewer’s region manager (§ 7.3.5). Typically ImageRegion files will have the suffix ’.rgn’.
If a region file is given then the box, chans, and stokes parameters will be ignored.
For example:
region=’myimage.im.rgn’
CHAPTER 6. IMAGE ANALYSIS
6.2
231
Image Header Manipulation (imhead)
To summarize and change keywords and values in the “header” of your image, use the imhead task.
Its inputs are:
# imhead :: Lists, gets and puts image header parameters
imagename
=
’’
#
Name of input image file
mode
= ’summary’
#
Options: get, put, summary, list, stats
async
=
False
The mode parameter controls the operation of imhead.
Setting mode=’summary’ will print out a summary of the image properties and the header to the
logger.
Setting mode=’list’ prints out a list of the header keywords and values to the terminal.
The mode=’get’ allows the user to retrieve the current value for a specified keyword hditem:
mode
hditem
=
=
’get’
’’
#
#
imhead options: get, put, summary, and list
Header item to get or set
Note that to catch this value, you need to assign it to a Python variable:
# Using the functional call method
myvalue = imhead(’ngc5921.clean.image’,mode=’get’,hditem=’beam’)
# Using globals
default(’imhead’)
imagename = ’ngc5921.clean.image’
mode = ’get’
hditem = ’beam’
myvalue = imhead()
See § 1.3.3 for more on return values.
BETA ALERT: This has changed in Patch 2.0. In previous versions hdvalue was an output
variable for mode=’get’.
The mode=’put’ allows the user to replace the current value for a given keyword hditem with that
specified in hdvalue. There are two sub-parameters that are opened by this option:
mode
hditem
hdvalue
=
=
=
’put’
’’
’’
#
#
#
imhead options: get, put, summary, and list
Header item to get or set
Value to set Header Item (hditem) to
WARNING: Be careful when using mode=’put’. This task does no checking on whether the
values you specify (e.g. for the axes types) are valid, and you can render your image invalid. Make
sure you know what you are doing when using this option!
CHAPTER 6. IMAGE ANALYSIS
6.2.1
232
Examples for imhead
For example,
CASA <1>: imhead(’ngc5921.usecase.clean.image’,’summary’)
Summary information is listed in logger
prints in the logger:
Opened image ngc5921.usecase.clean.image
Image name
Object name
Image type
Image quantity
Pixel mask(s)
Region(s)
Image units
Restoring Beam
:
:
:
:
:
:
:
:
ngc5921.usecase.clean.image
PagedImage
Intensity
None
None
Jy/beam
51.5254 arcsec, 45.5987 arcsec, 14.6417 deg
Direction reference
Spectral reference
Velocity type
Rest frequency
Pointing center
Telescope
Observer
Date observation
:
:
:
:
:
:
:
:
J2000
LSRK
RADIO
1.42041e+09 Hz
15:22:00.000000 +05.04.00.000000
VLA
TEST
1995/04/13/00:00:00
Axis Coord Type
Name
Proj Shape Tile
Coord value at pixel
Coord incr Units
-----------------------------------------------------------------------------------------------0
0
Direction Right Ascension
SIN
256
64 15:22:00.000
128.00 -1.500000e+01 arcsec
1
0
Direction Declination
SIN
256
64 +05.04.00.000
128.00 1.500000e+01 arcsec
2
1
Stokes
Stokes
1
1
I
3
2
Spectral Frequency
46
8
1.41281e+09
0.00 2.441406e+04 Hz
Velocity
1603.56
0.00 -5.152860e+00 km/s
If you choose mode=’list’, you get the summary in the logger and a listing of keywords and values
to the terminal:
CASA <2>: imhead(’ngc5921.usecase.clean.image’,mode=’list’)
Available header items to modify:
General --- object N5921_2
-- telescope VLA
-- observer TEST
-- epoch "1995/04/13/00:00:00"
Retrieving restfrequncy
CHAPTER 6. IMAGE ANALYSIS
233
-------
restfrequency "1420405752.0Hz"
projection "SIN"
bunit Jy/beam
beam 51.5204238892arcsec, 45.598236084arcsec, 14.6546726227deg
min -0.0104833962396
max 0.0523551553488
-----
ctype1
ctype2
ctype3
ctype4
Right Ascension
Declination
Stokes
Frequency
-----
crpix1
crpix2
crpix3
crpix4
128.0
128.0
0.0
0.0
-----
crval1
crval2
crval3
crval4
4.02298392585 rad
0.0884300154344 rad
1.0
1412808153.26 Hz
-----
cdelt1
cdelt2
cdelt3
cdelt4
-7.27220521664e-05 rad
7.27220521664e-05 rad
1.0
24414.0625 Hz
-----
cunit1 rad
cunit2 rad
cunit3
cunit4 Hz
axes --
crpix --
crval --
cdelt --
units --
The values for these keywords can be queried using mode=’get’. This opens sub-parameters
mode
hditem
=
=
’get’
’’
#
#
Options: get, put, summary, list, stats
header item to get or put
Note that the mode=’get’ option returns a Python dictionary containing the current value of
the hditem. This dictionary can be manipulated in Python in the usual manner. For example,
continuing the above example:
CASA <3>: imagename = ’ngc5921.usecase.clean.image’
CASA <4>: mode = ’get’
CASA <5>: hditem = ’observer’
CASA <6>: hdvalue = imhead()
***
observer :: TEST
CASA <7>: print hdvalue
TEST
CHAPTER 6. IMAGE ANALYSIS
234
You can set the values for these keywords using mode=’put’. This opens sub-parameters
mode
hditem
hdvalue
=
=
=
’put’
’’
’’
#
#
#
Options: get, put, summary, list, stats
header item to get or put
header value to set (for mode=put)
Continuing the example further:
CASA <8>: mode = ’put’
CASA <9>: hdvalue = ’CASA’
CASA <10>: imhead()
CASA <11>: mode = ’list’
CASA <12>: imhead()
Available header items to modify:
General --- object
-- telescope VLA
-- observer CASA
...
6.3
Continuum Subtraction on an Image Cube (imcontsub)
One method to separate line and continuum emission in an image cube is to specify a number of
line-free channels in that cube, make a linear fit to the visibilities in those channels, and subtract
the fit from the whole cube. Note that the task uvcontsub serves a similar purpose; see § 4.7.4 for
a synopsis of the pros and cons of either method.
The imcontsub task will subtract a polynomial baseline fit to the specified channels from an image
cube.
The default inputs are:
# imcontsub :: Continuum
imagename =
’’
#
linefile
=
’’
#
contfile
=
’’
#
fitorder
=
0
#
region
=
’’
#
box
=
’’
#
chans
=
’’
#
stokes
=
’’
#
async
=
False
subtraction on images
Name of the input image
Output line image file name
Output continuum image file name
Polynomial order for the continuum estimation
Image region or name to process see viewer
Select one or more box regions
Select the channel(spectral) range
Stokes params to image (I,IV,IQU,IQUV)
Area selection using box and region is detailed in § 6.1.1 and § 6.1.5 respectively.
Image cube plane selection using chans and stokes are described in § 6.1.2.
CHAPTER 6. IMAGE ANALYSIS
235
BETA ALERT: imcontsub has issues when the image does not contain a spectral or stokes axis.
Errors are generated when run on an image missing one or both of these axes. You will need to
use the Toolkit (e.g. the ia.adddegaxes method) to add degenerate missing axes to the image.
6.3.1
Examples for imcontsub)
For example, in a cube named cube2403 with 97 spectral line channels it has been determined that
channels 0 through 17 and channels 79 through 96 are line-free. Then:
default(’imcontsub’)
imagename
linefile
contfile
fitorder
chan
stokes
=
=
=
=
=
=
’cube2403’
’line2403’
’cont2403’
1
’0~17, 79~96’
’I’
imcontsub()
will fit a first order polynomial to the visibilities in channels 0 through 17 and 79 through 96,
subtract that fit from the input cube cube2403 and write the result to the cube line2403. The
fitted continuum itself is written to the cube cont2403 and, if so desired, can be averaged to create
a single high signal-to-noise continuum image.
6.4
Image-plane Component Fitting (imfit)
The inputs are:
# imfit :: Fit 2-dimentional
imagename
=
’’
#
box
=
’’
#
region
=
’’
#
mask
=
’’
#
fixed
=
’’
#
usecleanbeam
=
False
#
estfile
=
’’
#
residfile
=
’’
#
async
=
False
#
Gaussian(s) on image region(s)
Name of the input image
Specify one or more box regions for the fit.
Image Region or name. Use viewer
Mask to be applied to the image
Pparameters to hold fixed (not implemented).
Estimate the true source size.
Initial estimate of parameters (Not yet implemented).
Residual image removing fit. (Not yet implemented)
If true, run asynchronously
BETA ALERT: This task is new to Patch 2.0 and has not been as extensively tested as the other
tasks. Currently, it can fit only a single Gaussian component. This restriction will be lifted in
future patches.
CHAPTER 6. IMAGE ANALYSIS
6.5
236
Mathematical Operations on an Image (immath)
The inputs are:
# immath :: Perform math operations on images
outfile =
’’
# File where the output is saved
mode
= ’evalexpr’
# mode for math operation (evalexpr, spix, pola, poli)
exp =
’’
# Mathematical expression using images
mask
region
box
chans
stokes
async
=
=
=
=
=
=
’’
’’
’’
’’
’’
False
#
#
#
#
#
#
Mask to be applied to the images
File path which contains an Image Region
Select one or more box regions in the input images
Select the channel(spectral) range
Stokes params to image (I,IV,IQU,IQUV)
If true run asynchronously
In all cases, outfile must be supplied with the name of the new output file to create.
The mode parameter selects what immath is to do.
The default mode=’evalexpr’ lets the user specify a mathematical operation to carry out on one
or more input images. The sub-parameter expr contains the Lattice Expression Language (LEL)
string describing the image operations. See § 6.1.3 for more on LEL strings and the expr parameter.
Mask specification is done using the mask parameter. This can optionally contain an on-the-fly
mask expression (in LEL) or point to an image with a pixel mask. See § 6.1.4 for more on the use
of the mask parameter. See also § 6.1.3 for more on LEL strings.
Region selection is carried out through the region and box parameters. See § 6.1.1 and § 6.1.5 for
more on area selection.
Image plane selection is controlled by chans and stokes. See § 6.1.2 for details on plane selction.
BETA ALERT: As of Patch 2, LEL expressions (as in expr) use 0-based array indices.
6.5.1
Examples for immath
The following are examples using immath. Note that the image names in the expr are assumed to
refer to existing image files in the current working directory.
6.5.1.1
Simple math
Double all values in an image:
immath( expr=’"myimage.im"*2’, outfile=’double.im’ )
Take the sine of an image and add it to another:
CHAPTER 6. IMAGE ANALYSIS
237
immath(expr=’SIN("image2.im")+"image1.im"’,outfile=’newImage.im’)
Note that the two input images used in expr need to be the same size.
Add only the plane associated with the ’V’ Stokes value and the first channel together in two
images:
immath(expr=’"image1"+"image2"’,chans=’1’,stokes=’V’)
Select a single plane (the 5th channel) of the 3-D cube and subtract it from the original image:
default(’immath’)
outfile=’ngc5921.chan5.image’
expr=’"ngc5921.clean.image"’
chans=’5’
go
default(’immath’)
outfile=’ngc5921.clean.sub5.image’
expr=’"ngc5921.clean.image"-"ngc5921.chan5.image"’
go
Note that in this example the 2-D plane gets expanded out and the values are applied to each plane
in the 3-D cube.
Select and save the inner 1/4 of an image for channels 40,42,44 as well as channels 10 and below:
default(’immath’)
expr=’"ngc5921.clean.image"’
box=’64,64,192,192’
chans=’<10;40,42,44’
outfile=’ngc5921.clean.inner’
go
BETA ALERT: Note that if chan selects more than one channel then the output image has a
number of channels given by the span from the lowest and highest channel selected in chan. In the
example above, it will have 45 channels. The ones not selected will be masked in the output cube.
If we had set
chans = ’40,42,44’
then there would be 5 output channels corresponding to channels 40,41,42,43,44 of the MS with
41,43 masked. Also, the chans=’<10’ selects channels 0–9.
Note that the chans syntax allows the operators ’<’, ’<=’, ’>’, ’>’. For example,
chans = ’<17,>79’
chans = ’<=16,>=80’
CHAPTER 6. IMAGE ANALYSIS
238
do the same thing.
Divide an image by another, making sure we are not dividing by zero:
default(’immath’)
expr=’"orion.image"/iif("my.image"==0,1.0,"my.image")’
outfile=’my_orion.image’
go
Note that this will put 1.0 in the output image where the divisor image is zero. You can also just
mask below a certain level in the divisor image, e.g.
default(’immath’)
expr=’"orion.image"/"my.image"["my.image">0.1]’
outfile=’my_orion.image’
go
6.5.1.2
Polarization manipulation
Create a polarized intensity image from a IQUV image:
default( ’immath’)
outfile=’I.im’; expr=’"3C138_pcal"’; stokes=’I’; go();
outfile=’Q.im’; expr=’"3C138_pcal"’; stokes=’Q’; go();
outfile=’U.im’; expr=’"3C138_pcal"’; stokes=’U’; go();
outfile=’V.im’; expr=’"3C138_pcal"’; stokes=’V’; go();
outfile=’pol_intensity’
stokes=’’
expr=’sqrt("I.im"*"I.im" + "Q.im"*"Q.im" + "U.im"*"U.im" + "V.im"*"V.im" )’
go
6.5.1.3
Primary beam correction/uncorrection
In a script using mode=’evalexpr’, you might want to assemble the string for expr using string
variables that contain the names of files. Since you need to include quotes inside the expr string,
use a different quote outside (or escape the string, e.g. ’´
’. For example, to do a primary beam
correction on the NGC5921 cube,
imname = ’ngc5921.usecase.clean’
imagename = imname
...
clean()
default(’immath’)
clnimage = imname + ’.image’
pbimage = imname + ’.flux’
pbcorimage = imname + ’.pbcor’
CHAPTER 6. IMAGE ANALYSIS
239
outfile = pbcorimage
expr="’"+clnimage+"’/’"+pbimage+"’[’"+pbimage+"’>0.1]"
immath()
Note that we did not use a minpb when we cleaned, so we use the trick above to effectively set a
cutoff in the primary beam .flux image of 0.1.
For more on LEL strings, see AIPS++ Note 223
http://aips2.nrao.edu/docs/notes/223/223.html
or in § 6.1.3 above.
6.5.1.4
Spectral analysis
One can make an integrated 1-d spectrum over the whole image by rebinning (integrating) over the
two coordinate axes in a specified region. For example, using the NGC5921 image cube (with 46
channels):
immath(outfile="ngc5921.demo.spectrum.all",mode="evalexpr",
expr="rebin(’ngc5921.demo.clean.image’,[256,256,1,1])")
The resulting image has shape [1,1,1,46] as desired. You can view this with the viewer and will
see a 1-D spectrum.
One can also do this with a box:
immath(outfile="ngc5921.demo.spectrum.box",mode="evalexpr",
expr="rebin(’ngc5921.demo.clean.image’,[256,256,1,1])",box="118,118,141,141")
BETA ALERT: One cannot specify a region without it collapsing the channel axis (even when
told to use all axes or channels).
BETA ALERT: The following uses the toolkit (§ 6.12). You can make an ascii file containing
only the values (no other info though):
ia.open(’ngc5921.demo.spectrum.all’)
ia.toASCII(’ngc5921.demo.spectrum.all.ascii’)
You can also extract to a record inside Python:
myspec = ia.torecord()
which you can then manipulate in Python.
CHAPTER 6. IMAGE ANALYSIS
6.5.2
240
Using masks in immath
The mask parameter is used inside immath to apply a mask to all the images used in expr before
calculations are done (if you are curious, it uses the ia.subimage tool method to make virtual
images that are then input in the LEL to the ia.imagecalc method).
For example, lets assume that we have made a single channel image using clean for the NGC5921
data (see Appendix F.1).
default(’clean’)
vis = ’ngc5921.ms.contsub’
imagename = ’ngc5921.chan21.clean’
mode = ’channel’
nchan = 1
start = 21
step = 1
field = ’0’
spw = ’’
imsize = [256,256]
cell = [15.,15.]
alg = ’clark’
gain = 0.1
niter = 6000
threshold=8.0
weighting = ’briggs’
rmode = ’norm’
robust = 0.5
mask = ’’
cleanbox = [108,108,148,148]
clean()
There is now a file ’ngc5921.chan21.clean.cleanbox.mask’ that is an image with values 1.0
inside the cleanbox region and 0.0 outside.
We can use this to mask the clean image:
default(’immath’)
expr=’"ngc5921.chan21.clean.image"’
mask=’"ngc5921.chan21.clean.cleanbox.mask">0.5’
outfile=’ngc5921.chan21.clean.imasked’
go
Note that there are also pixel masks that can be contained in each image. These are Boolean masks,
and are implicitly used in the calculation for each image in expr. If you want to use the mask in a
different image not in expr, try it in mask:
CHAPTER 6. IMAGE ANALYSIS
241
# First make a pixel mask inside ngc5921.chan21.clean.cleanbox.mask
ia.open(’ngc5921.chan21.clean.cleanbox.mask’)
ia.calcmask(’"ngc5921.chan21.clean.cleanbox.mask">0.5’)
ia.summary()
ia.close()
# There is now a ’mask0’ mask in this image as reported by the summary
# Now apply this pixel mask in immath
default(’immath’)
expr=’("ngc5921.chan21.clean.image"’
mask=’mask(ngc5921.chan21.clean.cleanbox.mask)’
outfile=’ngc5921.chan21.clean.imasked1’
go
Note that nominally the axes of the mask must be congruent to the axes of the images in expr.
However, one exception is that the image in mask can have fewer axes (but not axes that exist but
are of the wrong lengths). In this case immath will extend the missing axes to cover the range in
the images in expr. Thus, you can apply a mask made from a single channel to a whole cube.
# drop degenerate stokes and freq axes from
#
ngc5921.chan21.clean.cleanbox.mask
ia.open(’ngc5921.chan21.clean.cleanbox.mask’)
im2 = ia.subimage(outfile=’ngc5921.chan21.mymask’,dropdeg=True)
im2.summary()
im2.close()
ia.close()
# ngc5921.chan21.mymask has only RA and Dec axes
# Now apply this mask to the whole cube
default(’immath’)
expr=’("ngc5921.clean.image"’
mask=’"ngc5921.chan21.mymask">0.5’
outfile=’ngc5921.cube.imasked’
go
For more on masks as used in LEL, see
http://aips2.nrao.edu/docs/notes/223/223.html
or in § 6.1.4 above.
6.6
Computing the Moments of an Image Cube (immoments)
For spectral line datasets, the output of the imaging process is an image cube, with a frequency or
velocity channel axis in addition to the two sky coordinate axes. This can be most easily thought
of as a series of image planes stacked along the spectral dimension.
CHAPTER 6. IMAGE ANALYSIS
242
A useful product to compute is to collapse the cube into a moment image by taking a linear
combination of the individual planes:
Mm (xi , yi ) =
N
X
wm (xi , yi , vk ) I(xi , yi , vk )
(6.1)
k
for pixel i and channel k in the cube I. There are a number of choices to form the m moment,
usually approximating some polynomial expansion of the intensity distribution over velocity mean
or sum, gradient, dispersion, skew, kurtosis, etc.). There are other possibilities (other than a
weighted sum) for calculating the image, such as median filtering, finding minima or maxima along
the spectral axis, or absolute mean deviations. And the axis along which to do these calculation
need not be the spectral axis (ie. do moments along Dec for a RA-Velocity image). We will treat
all of these as generalized instances of a “moment” map.
The immoments task will compute basic moment images from a cube. The default inputs are:
# immoments
imagename
moments
axis
region
box
chans
stokes
mask
includepix
excludepix
outfile
async
:: Compute moments of an image cube:
=
’’
#
Input image name
=
[0]
# List of moments you would like to compute
= ’spectral’
# The momement axis: ra, dec, lat, long, spectral, or stokes
=
’’
# Image Region. Use viewer
=
’’
# Select one or more box regions
=
’’
# Select the channel(spectral) range
=
’’
# Stokes params to image (I,IV,IQU,IQUV)
=
’’
# mask used for selecting the area of the image to calculate the moments on
=
-1
# Range of pixel values to include
=
-1
# Range of pixel values to exclude
=
’’
# Output image file name (or root for multiple moments)
=
False
# If true the taskname must be started using immoments(...)
This task will operate on the input file given by imagename and produce a new image or set of
images based on the name given in outfile.
The moments parameter chooses which moments are calculated. The choices for the operation mode
are:
moments=-1
moments=0
moments=1
moments=2
moments=3
moments=4
moments=5
moments=6
moments=7
moments=8
moments=9
moments=10
moments=11
- mean value of the spectrum
- integrated value of the spectrum
- intensity weighted coordinate;traditionally used to get
’velocity fields’
- intensity weighted dispersion of the coordinate; traditionally
used to get ’velocity dispersion’
- median of I
- median coordinate
- standard deviation about the mean of the spectrum
- root mean square of the spectrum
- absolute mean deviation of the spectrum
- maximum value of the spectrum
- coordinate of the maximum value of the spectrum
- minimum value of the spectrum
- coordinate of the minimum value of the spectrum
CHAPTER 6. IMAGE ANALYSIS
243
The meaning of these is described in the CASA Reference Manual:
http://casa.nrao.edu/docs/casaref/image.moments.html
If a single moment is chosen, the outfile specifies the exact name of the output image. If multiple
moments are chosen, then outfile will be used as the root of the output filenames, which will get different suffixes for each moment. For example, if moments=[0,1] and outfile=’ngc5921.usecase.moments’
then the output image names will be ’ngc5921.usecase.moments.integrated’ and ’ngc5921.usecase.moments.w
respectively.
The axis parameter sets the axis along which the moment is “collapsed” or calculated. Choices are:
’ra’, ’dec’, ’lat’, ’long’, ’spectral’, or ’stokes’. A standard moment-0 or moment-1 image
of a spectral cube would use the default choice ’spectral’. One could make a position-velocity
map by setting ’ra’ or ’dec’.
The includepix and excludepix parameters are used to set ranges for the inclusion and exclusion
of pixels based on values. For example, includepix=[0.05,100.0] will include pixels with values
from 50 mJy to 1000 Jy, and excludepix=[100.0,1000.0] will exclude pixels with values from
100 to 1000 Jy.
6.6.1
Hints for using (immoments)
In order to make an unbiased moment-0 image, do not put in any thresholding using includepix
or excludepix. This is so that the (presumably) zero-mean noise fluctuations in off-line parts of
the image cube will cancel out. If you image has large biases, like a pronounced clean bowl due
to missing large-scale flux, then your moment-0 image will be biased also. It will be difficult to
alleviate this with a threshold, but you can try.
To make a usable moment-1 (or higher) image, on the other hand, it is critical to set a reasonable
threshold to exclude noise from being added to the moment maps. Something like a few times the
rms noise level in the usable planes seems to work (put into includepix or excludepix as needed.
Also use chans to ignore channels with bad data.
6.6.2
Examples using (immoments)
For example, using the NGC5921 example (§ F.1):
default(’immoments’)
imagename = ’ngc5921.demo.cleanimg.image’
# Do first and second moments
moments = [0,1]
# Need to mask out noisy pixels, currently done
# using hard global limits
CHAPTER 6. IMAGE ANALYSIS
244
excludepix = [-100,0.009]
# Include all channels
chans = ’’
# Output root name
outfile = ’ngc5921.demo.moments’
immoments()
#
#
#
#
It will have made the images:
-------------------------------------ngc5921.demo.moments.integrated
ngc5921.demo.moments.weighted_coord
Other examples of NGC2403 (a moment zero image of a VLA line dataset) and NGC4826 (a
moment one image of a BIMA CO line dataset) are shown in Figure 6.1.
Figure 6.1: NGC2403 VLA moment zero (left) and NGC4826 BIMA moment one (right) images
as shown in the viewer.
BETA ALERT: We are working on improving the thresholding of planes beyond the global cutoffs
in includepix and excludepix.
6.7
Computing image statistics (imstat)
The imstat task will calculate statistics on a region of an image, and return the results as a return
value in a Python dictionary.
CHAPTER 6. IMAGE ANALYSIS
245
The inputs are:
# imstat :: Displays statistical information on an image or image region
imagename =
’’
# Name of the input image
region
=
’’
# Image Region or name. Use Viewer
box
=
’’
# Select one or more box regions
chans
=
’’
# Select the channel(spectral) range
stokes
=
’’
# Stokes params to image (I,IV,IQU,IQUV)
async
=
False
Area selection using box and region is detailed in § 6.1.1 and § 6.1.5 respectively.
Plane selection is controlled by chans and stokes. See § 6.1.2 for details on plane selction.
BETA ALERT: As with imcontsub, if the image is missing one or more of the stokes and spectral
axes, then imstat will fail. See the discussion of the workaround for this in § 6.3.
6.7.1
Using the task return value
The contents of the return value of imstat are in a Python dictionary of key-value sets. For
example,
xstat = imstat()
will assign this to the Python variable xstat. BETA ALERT: The return of the statistics as a
return value (and not a global variable) is new to Patch 2.0.
The keys for xstat are then:
KEYS
blc
blcf
trc
trcf
flux
npts
max
min
maxpos
maxposf
minpos
minposf
sum
sumsq
mean
- absolute PIXEL coordinate of the bottom left corner of
the bounding box surrounding the selected region
- Same as blc, but uses WORLD coordinates instead of pixels
- the absolute PIXEL coordinate of the top right corner
of the bounding box surrounding the selected region
- Same as trc, but uses WORLD coordinates instead of pixels
- the integrated flux density if the beam is defined and
the if brightness units are $Jy/beam$
- the number of unmasked points used
- the maximum pixel value
- minimum pixel value
- absolute PIXEL coordinate of maximum pixel value
- Same as maxpos, but uses WORLD coordinates instead of pixels
- absolute pixel coordinate of minimum pixel value
- Same as minpos, but uses WORLD coordinates instead of pixels
- the sum of the pixel values: $\sum I_i$
- the sum of the squares of the pixel values: $\sum I_i^2$
- the mean of pixel values:
ar{I} = \sum I_i / n$
CHAPTER 6. IMAGE ANALYSIS
246
sigma
- the standard deviation about the mean:
$\sigma^2 = (\sum I_i -ar{I})^2 / (n-1)$
rms
- the root mean square:
$\sqrt {\sum I_i^2 / n}$
median
- the median pixel value (if robust=T)
medabsdevmed - the median of the absolute deviations from the
median (if robust=T)
quartile
- the inter-quartile range (if robust=T). Find the points
which are 25% largest and 75% largest (the median is
50% largest), find their difference and divide that
difference by 2.
For example, an imstat call might be
default(’imstat’)
imagename = ’ngc5921.usecase.clean.image’
box
= ’108,108,148,148’
chans
= ’21’
#
#
#
The NGC5921 image cube
20 pixels around the center
channel 21
xstat = imstat()
In the terminal window, imstat reports:
Statistics on
ngc5921.usecase.clean.image
Region ---- bottom-left corner (pixel) [blc]: [108, 108, 0, 21]
-- top-right corner (pixel) [trc]:
[148, 148, 0, 21]
-- bottom-left corner (world) [blcf]: 15:22:20.076, +04.58.59.981, I, 1.41332e+09Hz
-- top-right corner( world) [trcf]: 15:21:39.919, +05.08.59.981, I, 1.41332e+09Hz
Values --- flux [flux]:
0.111799236126
-- number of points [npts]: 1681.0
-- maximum value [max]:
0.029451508075
-- minimum value [min]:
-0.00612453464419
-- position of max value (pixel) [maxpos]: [124, 131, 0,
-- position of min value (pixel) [minpos]: [142, 110, 0,
-- position of max value (world) [maxposf]: 15:22:04.016,
-- position of min value (world) [minposf]: 15:21:45.947,
-- Sum of pixel values [sum]: 1.32267159822
-- Sum of squared pixel values [sumsq]: 0.0284534543692
21]
21]
+05.04.44.999, I, 1.41332e+09Hz
+04.59.29.990, I, 1.41332e+09Hz
Statistics ---- Mean of the pixel values [mean]:
0.000786836167885
-- Standard deviation of the Mean [sigma]: 0.00403944306904
-- Root mean square [rms]:
0.00411418313161
-- Median of the pixel values [median]:
0.000137259965413
-- Median of the deviations [medabsdevmed]:
0.00152346317191
-- Quartile [quartile]:
0.00305395200849
CHAPTER 6. IMAGE ANALYSIS
247
The return value in xstat is
CASA <152>: xstat
Out[152]:
{’blc’: array([108, 108,
0, 21]),
’blcf’: ’15:22:20.076, +04.58.59.981, I,
’flux’: array([ 0.11179924]),
’max’: array([ 0.02945151]),
’maxpos’: array([124, 131,
0, 21]),
’maxposf’: ’15:22:04.016, +05.04.44.999,
’mean’: array([ 0.00078684]),
’medabsdevmed’: array([ 0.00152346]),
’median’: array([ 0.00013726]),
’min’: array([-0.00612453]),
’minpos’: array([142, 110,
0, 21]),
’minposf’: ’15:21:45.947, +04.59.29.990,
’npts’: array([ 1681.]),
’quartile’: array([ 0.00305395]),
’rms’: array([ 0.00411418]),
’sigma’: array([ 0.00403944]),
’sum’: array([ 1.3226716]),
’sumsq’: array([ 0.02845345]),
’trc’: array([148, 148,
0, 21]),
’trcf’: ’15:21:39.919, +05.08.59.981, I,
1.41332e+09Hz’,
I, 1.41332e+09Hz’,
I, 1.41332e+09Hz’,
1.41332e+09Hz’}
BETA ALERT: The return dictionary currently includes NumPy array values, which have to be
accessed by an array index to get the array value.
To access these dictionary elements, use the standard Python dictionary syntax, e.g.
xstat[<key string>][<array index>]
For example, to extract the standard deviation as a number
mystddev = xstat[’sigma’][0]
6.7.2
Examples using imstat
We give a few examples of the use of imstat, in particular to extact the information from the
return value.
Select a two box region:
# box 1, bottom-left coord is 2,3 and top-right coord is 14,15
# box 2, bottom-left coord is 30,31 and top-right coord is 42,43
xstat = imstat( ’myImage’, box=’2,3,14,15;30,31,42,43’ )
Select the same two box regions but only channels 4 and 5:
CHAPTER 6. IMAGE ANALYSIS
248
xstat = imstat( ’myImage’, box=’2,3,14,15;30,31,42,43’, chan=’4~5’ )
Select all channels greater the 20 as well as channel 0, and the print the mean and standard
deviation:
xstat = imstat( ’myImage’, chans=’>20;0’ )
print "Mean is: ", xstat[’mean’][0], " s.d. ", xstat[’sigma’][0]
Find statistical information for the Q stokes value only then the I stokes values only, and print out
the statistical values that we are interested in:
xstat = imstat( ’myimage’, stokes=’Q’ )
s1=xstat
imstat( ’myimage’, stokes=’I’ )
s2=xstat
print "
| MIN |
MAX | MEAN"
print " Q
| ",s1[’min’][0]," | ",s1[’max’][0],"
print " I
| ",s2[’min’][0]," | ",s2[’max’][0],"
6.8
|
|
",,"
",,"
|
|
",s1[’mean’][0]
",s2[’mean’][0]
Extracting data from an image (imval)
The imval task will extract the values of the data and mask from a specified region of an image
and place in the task return value as a Python dictionary.
The inputs are:
# imval :: Get the data value(s) and/or mask value in an image.
imagename =
’’
# Name of the input image
region
=
’’
# Image Region. Use viewer
box
=
’’
# Select one or more box regions
chans
=
’’
# Select the channel(spectral) range
stokes
=
’’
# Stokes params to image (I,IV,IQU,IQUV)
async
=
False
Area selection using box and region is detailed in § 6.1.1 and § 6.1.5 respectively. By default,
box=’’ will extract the image information at the reference pixel on the direction axes.
Plane selection is controlled by chans and stokes. See § 6.1.2 for details on plane selction. By
default, chans=’’ and stokes=’’ will extract the image information in all channels and Stokes
planes.
For instance,
xval = imval(’myimage’, box=’144,144’, stokes=’I’ )
will extract the Stokes I value or spectrum at pixel 144,144, while
CHAPTER 6. IMAGE ANALYSIS
249
xval = imval(’myimage’, box=’134,134.154,154’, stokes=’I’ )
will extract a 21 by 21 pixel region.
Extractions are returned in NumPy arrays in the return value dicionary, plus some extra elements
describing the axes and selection:
CASA <2>: xval = imval(’ngc5921.demo.moments.integrated’)
CASA <3>: xval
Out[3]:
{’axes’: [[0, ’Right Ascension’],
[1, ’Declination’],
[3, ’Frequency’],
[2, ’Stokes’]],
’blc’: [128, 128, 0, 0],
’data’: array([ 0.89667124]),
’mask’: array([ True], dtype=bool),
’trc’: [128, 128, 0, 0],
’unit’: ’Jy/beam.km/s’}
extracts the reference pixel value in this 1-plane image. Note that the ’data’ and ’mask’ elements
are NumPy arrays, not Python lists.
To extract a spectrum from a cube:
CASA <8>: xval = imval(’ngc5921.demo.clean.image’,box=’125,125’)
CASA <9>: xval
Out[9]:
{’axes’: [[0, ’Right Ascension’],
[1, ’Declination’],
[3, ’Frequency’],
[2, ’Stokes’]],
’blc’: [125, 125, 0, 0],
’data’: array([ 8.45717848e-04,
1.93370355e-03,
1.53750915e-03,
2.88399984e-03,
2.38683447e-03,
2.89159478e-04,
3.16268904e-03,
9.93389636e-03,
1.88773088e-02,
3.01138610e-02,
3.14478502e-02,
4.03211266e-02,
3.82498614e-02,
3.06552909e-02,
2.80734301e-02,
1.72479432e-02,
1.20884273e-02,
6.13593217e-03,
9.04005766e-03,
1.71429547e-03,
5.22095338e-03,
2.49114982e-03,
5.30831399e-04,
4.80734324e-03,
1.19265869e-05,
1.29435991e-03,
3.75700940e-04,
2.34788167e-03,
2.72604497e-03,
1.78467855e-03,
9.74952069e-04,
2.24676146e-03,
1.82263291e-04,
1.98463408e-06,
2.02975096e-03,
9.65532148e-04,
1.68218743e-03,
2.92119570e-03,
1.29359076e-03,
-5.11484570e-04,
1.54162932e-03,
4.68662125e-04,
-8.50282842e-04, -7.91683051e-05,
2.95954203e-04,
CHAPTER 6. IMAGE ANALYSIS
250
-1.30133145e-03]),
’mask’: array([ True, True, True, True, True, True, True, True, True,
True, True, True, True, True, True, True, True, True,
True, True, True, True, True, True, True, True, True,
True, True, True, True, True, True, True, True, True,
True, True, True, True, True, True, True, True, True, True], dtype=bool),
’trc’: [125, 125, 0, 45],
’unit’: ’Jy/beam’}
To extract a region from the plane of a cube:
CASA <13>: xval = imval(’ngc5921.demo.clean.image’,box=’126,128,130,129’,chans=’23’)
CASA <14>: xval
Out[14]:
{’axes’: [[0, ’Right Ascension’],
[1, ’Declination’],
[3, ’Frequency’],
[2, ’Stokes’]],
’blc’: [126, 128, 0, 23],
’data’: array([[ 0.00938627, 0.01487772],
[ 0.00955847, 0.01688832],
[ 0.00696965, 0.01501907],
[ 0.00460964, 0.01220793],
[ 0.00358087, 0.00990202]]),
’mask’: array([[ True, True],
[ True, True],
[ True, True],
[ True, True],
[ True, True]], dtype=bool),
’trc’: [130, 129, 0, 23],
’unit’: ’Jy/beam’}
CASA <15>: print xval[’data’][0][1]
0.0148777160794
In this example, a rectangular box was extracted, and you can see the order in the array and how
to address specific elements.
6.9
Regridding an Image (imregrid)
It is occasionally necessary to regrid an image onto a new
coordinate system. The imregrid task will regrid one image onto the coordinate system of another, creating an output image. In this task, the user need only specify the
names of the input, template, and output images.
Inside the Toolkit:
More complex coordinate system
and image regridding operation can
be carried out in the toolkit.
The coordsys (cs) tool and the
ia.regrid method are the relevant
components.
CHAPTER 6. IMAGE ANALYSIS
251
If the user needs to do more complex operations, such as
regridding an image onto an arbitrary (but known) coordinate system, changing from Equatorial to Galactic coordinates, or precessing Equinoxes, the CASA toolkit can be
used (see sidebox). Some of these facilities will eventually
be provided in task form.
The default inputs are:
# imregrid :: regrid an image onto a template image
imagename
=
’’
# Name of input image
template
=
’’
# Name of reference image
output
=
’’
# Name of output regridded image
async
=
False
#
The output image will have the data in imagename regridded onto the coordinate system of
template image.
BETA ALERT: The imregrid task is currently under test againt similar AIPS tasks and we are
looking to improve its performance. Future releases will enable regridding without the need for a
template image.
6.10
Image Convolution(imsmooth)
The default inputs are:
# imsmooth
imagename
kernel
region
box
chans
stokes
mask
outfile
async
6.11
:: Smooth an
=
’’
= ’boxcar’
=
’’
=
’’
=
’’
=
’’
=
’’
=
’’
=
False
image or portion of an image
# Name of the input image
# Type of kernel to use: gaussian or boxcar.
# Image Region or name. Use viewer
# Select one or more box regions
# Select the channel(spectral) range
# Stokes params to image (I,IV,IQU,IQUV)
# mask used for selecting the area of the image to smooth
# Output, smoothed, image file name
#
Image Import/Export to FITS
These tasks will allow you to write your CASA image to a FITS file that other packages can read,
and to import existing FITS files into CASA as an image.
CHAPTER 6. IMAGE ANALYSIS
6.11.1
252
FITS Image Export (exportfits)
To export your images to fits format use the exportfits task. The inputs are:
# exportfits :: Convert a CASA image to a FITS file
imagename
=
’’
# Name of input CASA image
fitsimage
=
’’
# Name of output image FITS file
velocity
=
False
# Use velocity (rather than frequency) as spectral axis
optical
=
False
# Use the optical (rather than radio) velocity convention
bitpix
=
-32
# Bits per pixel
minpix
=
0
# Minimum pixel value
maxpix
=
0
# Maximum pixel value
overwrite
=
False
# Overwrite pre-existing imagename
dropstokes
=
False
# Drop the Stokes axis?
stokeslast
=
True
# Put Stokes axis last in header?
async
=
True
# If true the taskname must be started using exportfits(...)
The dropstokes or stokeslast parameter may be needed to make the FITS image compatible
with an external application.
For example,
exportfits(’ngc5921.usecase.clean.image’,’ngc5921.usecase.image.fits’)
BETA ALERT: Setting async=True is recommended because there is a flaw in the Beta version
of the FITS classes that will cause subsequent FITS import (importfits or importuvfits) after
an export to fail. Using asynchronous export will circumvent this by forcing the creation and use
of a new tool object rather than using default one.
6.11.2
FITS Image Import (importfits)
You can also use the importfits task to import a FITS image into CASA image table format.
Note, the CASA viewer can read fits images so you don’t need to do this if you just want to look
a the image. The inputs for importfits are:
#
importfits :: Convert an image FITS file into a CASA image:
fitsimage
imagename
whichrep
whichhdu
zeroblanks
overwrite
async
=
=
=
=
=
=
=
’’
’’
0
0
True
False
False
#
#
#
#
#
#
#
Name of input image FITS file
Name of output CASA image
Which coordinate representation (if multiple)
Which image (if multiple)
If blanked fill with zeros (not NaNs)
Overwrite pre-existing imagename
if True run in the background, prompt is freed
For example, we can read the above image back in
importfits(’ngc5921.usecase.image.fits’,’ngc5921.usecase.image.im’)
CHAPTER 6. IMAGE ANALYSIS
6.12
253
Using the CASA Toolkit for Image Analysis
Although this cookbook is aimed at general users employing the tasks, we include here a more detailed description of
doing image analysis in the CASA toolkit. This is because
there are currently only a few tasks geared towards image
analysis, as well as due to the breadth of possible manipulations that the toolkit allows that more sophisticated users
will appreciate.
To see a list of the ia methods available, use the CASA
help command:
Inside the Toolkit:
The image analysis tool (ia) is
the workhorse here. It appears in
the User Reference Manual as the
image tool. Other relevant tools
for analysis and manipulation include measures (me), quanta (qa)
and coordsys (cs).
CASA <1>: help ia
--------> help(ia)
Help on image object:
class image(__builtin__.object)
| image object
|
| Methods defined here:
|
| __init__(...)
|
x.__init__(...) initializes x; see x.__class__.__doc__ for signature
|
| __str__(...)
|
x.__str__() <==> str(x)
|
| adddegaxes(...)
|
Add degenerate axes of the specified type to the image‘ :
|
outfile
|
direction = false
|
spectral = false
|
stokes
|
linear
= false
|
tabular
= false
|
overwrite = false
|
---------------------------------------|
| addnoise(...)
...
|
|
|
|
|
|
|
unlock(...)
Release any lock on the image‘ :
------------------------------------------------------------------------------------------------------------Data and other attributes defined here:
CHAPTER 6. IMAGE ANALYSIS
|
|
|
254
__new__ = <built-in method __new__ of type object at 0x55d0f20>
T.__new__(S, ...) -> a new object with type S, a subtype of T
or for a compact listing use <TAB> completion on ia., e.g.
CASA <2>: ia.
Display all 101 possibilities? (y or n)
ia.__class__
ia.fitsky
ia.__delattr__
ia.fromarray
ia.__doc__
ia.fromascii
ia.__getattribute__
ia.fromfits
ia.__hash__
ia.fromforeign
ia.__init__
ia.fromimage
ia.__new__
ia.fromshape
ia.__reduce__
ia.getchunk
ia.__reduce_ex__
ia.getregion
ia.__repr__
ia.getslice
ia.__setattr__
ia.hanning
ia.__str__
ia.haslock
ia.adddegaxes
ia.histograms
ia.addnoise
ia.history
ia.boundingbox
ia.imagecalc
ia.brightnessunit
ia.imageconcat
ia.calc
ia.insert
ia.calcmask
ia.isopen
ia.close
ia.ispersistent
ia.continuumsub
ia.lock
ia.convertflux
ia.makearray
ia.convolve
ia.makecomplex
ia.convolve2d
ia.maketestimage
ia.coordmeasures
ia.maskhandler
ia.coordsys
ia.maxfit
ia.decompose
ia.miscinfo
ia.deconvolvecomponentlist ia.modify
ia.done
ia.moments
ia.echo
ia.name
ia.fft
ia.newimage
ia.findsources
ia.newimagefromarray
ia.fitallprofiles
ia.newimagefromfile
ia.fitpolynomial
ia.newimagefromfits
ia.fitprofile
ia.newimagefromimage
ia.newimagefromshape
ia.open
ia.outputvariant
ia.pixelvalue
ia.putchunk
ia.putregion
ia.rebin
ia.regrid
ia.remove
ia.removefile
ia.rename
ia.replacemaskedpixels
ia.restoringbeam
ia.rotate
ia.sepconvolve
ia.set
ia.setboxregion
ia.setbrightnessunit
ia.setcoordsys
ia.sethistory
ia.setmiscinfo
ia.setrestoringbeam
ia.shape
ia.statistics
ia.subimage
ia.summary
ia.toASCII
ia.tofits
ia.topixel
ia.toworld
ia.twopointcorrelation
ia.type
ia.unlock
A common use of the ia tool is to do region statistics on an image. The imhead task has
mode=’stats’ to do this quickly over the entire image cube. The tool can do this on specific
planes or sub-regions. For example, in the Jupiter 6cm example script (§ F.2), the ia tool is used
to get on-source and off-source statistics for regression:
# The variable clnimage points to the clean image name
CHAPTER 6. IMAGE ANALYSIS
255
# Pull the max and rms from the clean image
ia.open(clnimage)
on_statistics=ia.statistics()
thistest_immax=on_statistics[’max’][0]
oldtest_immax = 1.07732224464
print ’ Clean image ON-SRC max should be ’,oldtest_immax
print ’ Found : Max in image = ’,thistest_immax
diff_immax = abs((oldtest_immax-thistest_immax)/oldtest_immax)
print ’ Difference (fractional) = ’,diff_immax
print ’’
# Now do stats in the lower right corner of the image
box = ia.setboxregion([0.75,0.00],[1.00,0.25],frac=true)
off_statistics=ia.statistics(region=box)
thistest_imrms=off_statistics[’rms’][0]
oldtest_imrms = 0.0010449
print ’ Clean image OFF-SRC rms should be ’,oldtest_imrms
print ’ Found : rms in image = ’,thistest_imrms
diff_imrms = abs((oldtest_imrms-thistest_imrms)/oldtest_imrms)
print ’ Difference (fractional) = ’,diff_imrms
print
print
print
print
’’
’ Final Clean image Dynamic Range = ’,thistest_immax/thistest_imrms
’’
’ =============== ’
ia.close()
BETA ALERT: Bad things can happen if you open some tools, like ia, in the Python command
line on files and forget to close them before running scripts that use the os.system(’rm -rf
<filename>) call to clean up. We are in the process of cleaning up cases like this where there can
be stale handles on files that have been manually deleted, but for the meantime be warned that you
might get exceptions (usually of the “SimpleOrderedMap-remove” flavor, or even Segmentation
Faults and core-dumps!
6.13
Examples of CASA Image Analysis
See the scripts provied in Appendix F for examples of data and image analysis. In particular, we
refer the interested user to the demonstrations for:
• NGC5921 (VLA HI) — a quick demo of basic CASA spectral line analyis (F.1)
• Jupiter (VLA 6cm continuum polarimetry) — polarization image analysis (F.2)
Chapter 7
Visualization With The CASA Viewer
This chapter describes how to display data with the casaviewer either as a stand-alone or through
the viewer task. You can display both images and Measurement Sets.
7.1
Starting the viewer
Within the casapy environment, the viewer task can be used to display an image or MS. The
inputs are:
#
viewer :: View an image or visibility data set.
infile
displaytype
=
=
’’
’raster’
#
#
#
#
#
(Optional) Name of file to visualize.
(Optional) Type of visual rendering
(raster, contour, vector or marker).
lel if an lel expression is given
for infile (advanced).
Examples of starting the viewer:
CASA <1>: viewer()
CASA <2>: viewer(’ngc5921.usecase.ms’)
CASA <3>: viewer(’ngc5921.usecase.clean.image’)
CASA <4>: viewer(’ngc5921.usecase.clean.image.rstr’)
CASA <5>: viewer(’ngc5921.usecase.clean.image’, ’contour’)
CASA <6>: viewer(’"ngc5921.usecase.clean.image"^2’, ’lel’)
256
CHAPTER 7. VISUALIZATION WITH THE CASA VIEWER
257
Figure 7.1:
The Viewer Display Panel (left) and Data Display Options (right)
panels that appear when the viewer is called with the image cube from NGC5921
(viewer(’ngc5921.usecase.clean.image’)). The initial display is of the first channel of the
cube.
The first of these creates an empty Viewer Display Panel (§ 7.2.1) and a Load Data window
(§ 7.2.4) . The second starts the viewer loaded with a Measurement Set. The third example starts
the viewer with an image cube (see Figure 7.1).
Example four brings up a display panel as it was when its state was saved to the given ’restore’ file
(ngc5921.usecase.clean.image.rstr). This includes the data displayed as well as options and
viewer settings. (See § 7.2.2, Saving and Restoring Viewer State).
Examples five and six are less common cases, which make use of the second parameter (displaytype).
Example five displays the image in contour form. Example six uses ’Lattice (Image) Expression
Language’ to display the square of the image data.
NOTE: the viewer task now determines file types (images, MSs, restore files) automatically. It is
no longer necessary to specify filetype=’ms’ explicitly.
CHAPTER 7. VISUALIZATION WITH THE CASA VIEWER
258
Figure 7.2:
The Viewer Display Panel (left) and Data Display Options (right)
panels that appear when the viewer is called with the NGC5921 Measurement Set
(viewer(’ngc5921.usecase.ms’)).
7.1.1
Running the CASA viewer outside casapy
casaviewer is the name of the stand-alone viewer application that is available with a CASA
installation. From the operating system prompt, the following commands are equivalent to the
casapy task commands given previously:
casaviewer &
casaviewer ms_filename &
casaviewer image_filename &
casaviewer restore_filename &
CHAPTER 7. VISUALIZATION WITH THE CASA VIEWER
259
casaviewer image_filename contour &
casaviewer ’"image_filename"^2’ lel &
7.2
The viewer GUI
The CASA viewer application consists of a number of graphical user interface (GUI) windows that
respond to mouse and keyboard input. Here we describe the Viewer Display Panel (§ 7.2.1)
and the Load Data window (§ 7.2.4). They are used for both image and MS viewing. Several
other windows are context-specific and are described in the sections on viewing images (§ 7.3) and
Measurement Sets (§ 7.4).
7.2.1
The Viewer Display Panel
The Viewer Display Panel is the the window that actually displays the image or MS. This is shown
in the left panels of Figures 7.1 and 7.2. Note that this panel is the same whether an image or MS
is being displayed.
At the top of the Viewer Display Panel are the menus:
• Data
– Open — choose a data file to load and display
– Register — select/de-select the (previously-loaded) data file(s) which should display
right now (menu expands to the right showing all loaded data)
– Close — close (unload) selected data file (menu expands to the right)
– Adjust — open the Data Display Options (’Adjust’) panel
– Print — print the displayed image
– Save Panel State — to a ’restore’ file (xml format)
– Restore Panel State — from a restore file
– Close Panel — close the Viewer Display Panel (will exit if this is the last display panel
open)
– Quit Viewer — close all display panels and exit
• Display Panel
– New Panel — create another Viewer Display Panel (cleared)
– Panel Options — open the Display Panel’s options window
– Save Panel State
– Restore Panel State
– Print — print displayed image
CHAPTER 7. VISUALIZATION WITH THE CASA VIEWER
260
– Close Panel — close the Viewer Display Panel (will exit if this is the last display panel
open)
• Tools
– Annotations — not yet available (greyed out)
– Spectral Profile — plot frequency/velocity profile of point or region of image
– Region Manager — save regions and control their extent
• View
– Main Toolbar — show/hide top row of icons
– Mouse Toolbar — show/hide second row of mouse-button action selection icons
– Animator — show/hide tapedeck control panel
– Position Tracking — show/hide bottom position tracking report box
Below this is the Main Toolbar (Figure 7.3), the top row of icons for fast access to some of these
menu items:
• folder (Data:Open shortcut) — show the Load Data panel
• wrench (Data:Adjust shortcut) — show the Data Display Options (’Adjust’) panel
• panels (Data:Register shortcut) — show the menu of loaded data
• delete (Data:Close shortcut) — closes/unloads selected data
• new panel (Display Panel:New Panel)
• panel wrench (Display Panel:Panel Options) — show the Display Panel’s options window
• save – save panel state to a ’restore’ file
• restore – restore panel state from a restore file
• region save (Tools:Region Manager) — save/control regions.
(Note: some of these newer buttons do not appear in older figures of this document).
• print (Display Panel:Print) — print data
• magnifier box — Zoom out all the way
• magnifier plus — Zoom in (by a factor of 2)
• magnifier minus — Zoom out (by a factor of 2)
CHAPTER 7. VISUALIZATION WITH THE CASA VIEWER
261
Figure 7.3: The display panel’s Main Toolbar appears directly below the menus and contains
’shortcut’ buttons for most of the frequently-used menu items.
Figure 7.4: The ’Mouse Tool’ Bar allows you to assign separate mouse buttons to tools you
control with the mouse within the image display area. Initially, zooming, color adjustment, and
rectangular regions are assigned to the left, middle and right mouse buttons, respectively.
Below this are the eight Mouse Tool buttons (Figure 7.4). These allow assignment of each of
the three mouse buttons to a different operation on the display area. Clicking a mouse tool icon
will [re-]assign the mouse button that was clicked to that tool. The icons show which mouse
button is currently assigned to which tool.
The ’escape’ key can be used to cancel any mouse tool operation that was begun but not completed,
and to erase any tool showing in the display area.
• Zooming (magnifying glass icon): To zoom into a selected area, press the Zoom tool’s
mouse button (the left button by default) on one corner of the desired rectangle and drag
to the desired opposite corner. Once the button is released, the zoom rectangle can still
be moved or resized by dragging. To complete the zoom, double-click inside the selected
rectangle (double-clicking outside it will zoom out instead).
• Panning (hand icon): Press the tool’s mouse button on a point you wish to move, drag it
to the position where you want it moved, and release. Note: The arrow keys, Page Up, Page
Down, Home and End keys can also be used to scroll through your data any time you are
zoomed in. (Click on the main display area first, to be sure the keyboard is ’focused’ there).
• Stretch-shift colormap fiddling (crossed arrows): This is usually the handiest color
adjustment; it is assigned to the middle mouse button by default.
• Brightness-contrast colormap fiddling (light/dark sun)
• Positioning (bombsight): This tool can place a ’crosshair’ marker on the display to select
a position. It is used to flag Measurement Set data or to select an image position for spectral
profiles. Click on the desired position with the tool’s mouse button to place the crosshair;
once placed you can drag it to other locations. Double-click is not needed for this tool. See
§ 7.2.3 for more detail.
CHAPTER 7. VISUALIZATION WITH THE CASA VIEWER
262
• Rectangle and Polygon region drawing: The rectangle region tool is assigned to the
right mouse button by default. As with the zoom tool, a rectangle region is generated
by dragging with the assigned mouse button; the selection is confirmed by double-clicking
within the rectangle. Polygon regions are created by clicking the assigned mouse button
at the desired vertices, clicking the final location twice to finish. Once created, a polygon
can be moved by dragging from inside, or reshaped by dragging the handles at the vertices.
Double-click inside to confirm region selection. See § 7.2.3 for the uses of this tool.
• Polyline drawing: A polyline can be created by selecting this tool. It is manipulated
similarly to the polygon region tool: create segments by clicking at the desired positions and
then double-click to finish the line. [Uses for this tool are still to be implemented].
The main Display Area lies below the toolbars.
Underneath the display area is an Animator panel. The most prominent feature is the “tape deck”
which provides movement between image planes along a selected third dimension of an image cube.
This set of buttons is only enabled when a registered image reports that it has more than one plane
along its ’Z axis’. In the most common case, the animator selects the frequency channel. From left
to right, the tape deck controls allow the user to:
• rewind to the start of the sequence (i.e., the first plane)
• step backwards by one plane
• play backwards, or repetitively step backwards
• stop any current play
• play forward, or repetitively step forward
• step forward by one plane
• fast forward to the end of the sequence
To the right of the tape deck is an editable text box indicating the current frame (channel) number
and a label showing the total number of frames. Below that is a slider for controlling the (nominal)
animation speed. To the right is a ’Full/Compact’ toggle. In ’Full’ mode (the default), a slider
controlling frame number and a ’Blink mode’ control are also available.
’Blink’ mode is useful when more than one raster image is registered. In that mode, the tapedeck
controls which image is displayed at the moment rather than the particular image plane (set that
in ’Normal’ mode first). The registered images must cover the same portion of the sky and use the
same coordinate projection.
Note: In ’Normal’ mode, it is advisable to have only ONE raster image registered at a time, to
avoid confusion. Unregister (or close) the others).
At the bottom of the Display Panel is the Position Tracking panel. As the mouse moves over the
main display, this panel shows information such as flux density, position (e.g. RA and Dec), Stokes,
CHAPTER 7. VISUALIZATION WITH THE CASA VIEWER
263
and frequency (or velocity), for the point currently under the cursor. Each registered image/MS
displays its own tracking information. Tracking can be ’frozen’ (and unfrozen again) with the space
bar. (Click on the main display area first, to be sure the keyboard is ’focused’ there).
The Animator or Tracking panels can be hidden or detached (and later re-attached) by using the
boxes at upper right of the panels; this is useful for increasing the size of the display area. (Use the
’View’ menu to show a hidden panel again). The individual tracking areas (one for each registered
image) can be hidden using the checkbox at upper left of each area.
7.2.2
Saving and Restoring Display Panel State
It is straightforward to save a display panel’s current state (what data is on display along with data
and panel settings). Select ’Save’ (the unadorned floppy toolbutton) and confirm the filename. It
is usually advisable (but not required) to retain the file’s ’.rstr’ extension.
Press ’Restore’ (the button to the right of Save) to choose a previously-created restore file. You
can also select restore files from the Load Data window.
It is possible to restore MSs or images, multiple layers such as contour-over-raster, and LEL displays.
You can also the save the panel state with no data loaded, to restore preferred initial settings such
as overall panel size. Animation and zoom state should likewise restore themselves.
Restore is fairly forgiving about data location, and will find files located:
• in the original location recorded in the restore file
• in the current working directory (where you started the viewer)
• in the restore file’s directory
• in the original location relative to the restore file
This means that restore files will generally work if moved together with data files. The process is
less forgiving if you save the display of an LEL (image) expression, however; the files must be in the
locations specified in the original LEL expression. If a data file is not found, restore will attempt
to proceed but results will vary.
Restore files are in ascii (xml) format, and some obvious manual edits are possible. However, these
files are longer and more complex than you might imagine. Use caution, and back up restore files
you want to preserve. If you make a mistake, the viewer may not recognize the file as a restore file;
other unexpected results could also occur. It is usually easier and safer to make changes on the
display panel and then save the restore file again.
7.2.3
Region Selection and Positioning
You can draw regions or select positions on the display with the mouse, once you have selected the
appropriate tool(s) on the Mouse Toolbar (see above).
The Rectangle Region drawing tool currently works for the following:
CHAPTER 7. VISUALIZATION WITH THE CASA VIEWER
264
• Region statistics reporting for images,
• Region spectral profiles for images, via the Tools:Spectral Profile menu,
• Flagging of Measurement Sets
• Creating and Saving an image region for various types of analysis (§ 7.3.5)
• Selecting Clean regions interactively (§ 5.3.5)
The Polygon Region drawing has the same uses, except that polygon region flagging of an MS is
not supported.
The Positioning crosshair tool works for the last two of the above.
The Spectral Profile display (see § 7.3.4), when active, updates on each change of the rectangle,
polygon, or crosshair. Flagging with the crosshair also responds to single click or drag.
Region statistics are printed in the terminal window (not the logger) by double-clicking the completed region. The Rectangle Region tool’s mouse button must also be double-clicked to confirm
an MS flagging edit.
Here is an example of region statistics from the viewer:
ngc5921.usecase.clean.image-contour
(Jy/beam)
n
52
Std Dev
0.01067
RMS
0.02412
Mean
0.02168
Variance
0.0001139
Sum
1.127
Flux
0.09526
Med |Dev|
0.009185
IntQtlRng
0.01875
Median
0.02076
Min
0.003584
Max
0.04181
7.2.4
The Load Data Panel
You can use the Load Data - Viewer GUI to interactively choose images or MS to load into
the viewer. An example of this panel is shown in Figure 7.5. This panel is accessed through the
Data:Open menu or Open icon of the Viewer Display Panel. It also appears if you open the
viewer without any infile specified.
Selecting a file on disk in the Load Data panel will provide options for how to display the data.
Images can be displayed as:
1. Raster Image,
2. Contour Map,
3. Vector map, or
4. Marker Map.
CHAPTER 7. VISUALIZATION WITH THE CASA VIEWER
265
Figure 7.5: The Load Data - Viewer panel that appears if you open the viewer without any
infile specified, or if you use the Data:Open menu or Open icon. You can see the images and MS
available in your current directory, and the options for loading them.
You can also enter a ’Lattice (image) Expression’ in the box provided (§ 6.1.3). For example, you
might enter:
’my.clean.im’ - ’my.dirty.im’
to display the difference between the two images. (The images should have the same coordinates
and extents).
A MS can only be displayed as a raster.
CHAPTER 7. VISUALIZATION WITH THE CASA VIEWER
7.2.4.1
266
Registered vs. Open Datasets
When you ’load’ data as described above, it is first opened, and then registered on all existing
Display Panels. The distinction is subtle. An ’open’ dataset has been prepared in memory from
disk; it may be registered (enabled for drawing) on one Display Panel and not on another. All
open datasets will have a tab in the Data Options window, whether currently registered or not.
On the other hand, only those datasets registered on a particular panel will show in its Tracking
area.
At present, it is useful to have more than one image registered on a panel only if you are displaying a
contour image over a raster image (§ 7.3.3) or ’blinking’ between images (see Animator in § 7.2.1).
(In future we also hope to provide transparent overlay of raster images).
It is the user’s responsibility – and highly advisable – to unregister (or close) datasets that are no
longer in use, using the Register or Close toolbutton or menu. In future the viewer will attempt
to aid in unregistering datasets which are not ’compatible’ with a newly-loaded one (different sky
area, e.g., or MS vs. image).
If you close a dataset, you must reload it from disk as described above to see it again. That can
take a little time for MSs, especially. If you unregister a dataset, it is set to draw immediately
when you re-register it, with its options as you have previously set them. In general, close unneeded
datasets but unregister those you’ll be working with again.
7.3
Viewing Images
You have several options for viewing an image. These are seen at the right of the Load Data Viewer panel described in § 7.2.4 and shown in Figure 7.6 when an image is selected. They are:
• Raster Image — a greyscale or color image,
• Contour Map — contours of intensity as a line plot,
• Vector Map — vectors (as in polarization) as a line plot,
• Marker Map — a line plot with symbols to mark positions.
The Raster Image is the default image display, and is what you get if you invoke the viewer from
casapy with an image file name. In this case, you will need to use the Open menu to bring up the
Load Data panel to choose a different display.
7.3.1
Viewing a raster map
A raster map of an image shows pixel intensities in a two-dimensional cross-section of gridded data
with colors selected from a finite set of (normally) smooth and continuous colors, i.e., a colormap.
CHAPTER 7. VISUALIZATION WITH THE CASA VIEWER
267
Figure 7.6: The Load Data - Viewer panel as it appears if you select an image. You can see all
options are available to load the image as a Raster Image, Contour Map, Vector Map, or Marker
Map. In this example, clicking on the Raster Image button would bring up the displays shown in
Figure 7.1.
Starting the casaviewer with an image as a raster map will look something like the example in
Figure 7.1.
You will see the GUI which consists of two main windows, entitled ”Viewer Display Panel” and
”Load Data”. In the ”Load Data” panel, you will see all of the viewable files in the current working
directory along with their type (Image, Measurement Set, etc). After selecting a file, you are
presented with the available display types (raster, contour, vector, marker) for these data. Clicking
on the button Raster Map will create a display as above.
The data display can be adjusted by the user as needed. This is done through the Data Display
Options panel. This window appears when you choose the Data:Adjust menu or use the wrench
icon from the Main Toolbar. This also comes up by default along with the Viewer Display
Panel when the data is loaded.
The Data Display Options window is shown in the right panel of Figure 7.1. It consists of a tab
for each image or MS loaded, under which are a cascading series of expandable categories. For an
CHAPTER 7. VISUALIZATION WITH THE CASA VIEWER
268
image, these are:
• Display axes
• Hidden axes
• Basic Settings
• Position tracking
• Axis labels
• Axis label properties
• Beam Ellipse
• Color Wedge
The Basic Settings category is expanded by default. To expand a category to show its options,
click on it with the left mouse button.
7.3.1.1
Raster Image — Basic Settings
This roll-up is open by default. It has some commonly-used parameters that alter the way the
image is displayed; three of these affect the colors used. An example of this part of the panel is
shown in Figure 7.7.
Figure 7.7: The Basic Settings category of the Data Display Options panel as it appears if
you load the image as a Raster Image. This is a zoom-in for the data displayed in Figure 7.1.
The options available are:
CHAPTER 7. VISUALIZATION WITH THE CASA VIEWER
269
• Basic Settings:Aspect ratio
This option controls the horizontal-vertical size ratio of data pixels on screen. Fixed world
(the default) means that the aspect ratio of the pixels is set according to the coordinate system
of the image (i.e., true to the projected sky). Fixed lattice means that data pixels will
always be square on the screen. Selecting flexible allows the map to stretch independently
in each direction to fill as much of the display area as possible.
• Basic Settings:Pixel treatment
This option controls the precise alignment of the edge of the current ’zoom window’ with
the data lattice. edge (the default) means that whole data pixels are always drawn, even on
the edges of the display. For most purposes, edge is recommended. center means that data
pixels on the edge of the display are drawn only from their centers inwards. (Note that a
data pixel’s center is considered its ’definitive’ position, and corresponds to a whole number
in ’data pixel’ or ’lattice’ coordinates).
• Basic Settings:
Resampling mode
This setting controls how the data are resampled to the resolution of the screen. nearest (the
default) means that screen pixels are colored according to the intensity of the nearest data
point, so that each data pixel is shown in a single color. bilinear applies a bilinear interpolation between data pixels to produce smoother looking images when data pixels are large on
the screen. bicubic applies an even higher-order (and somewhat slower) interpolation.
• Basic Settings:
Data Range
You can use the entry box provided to set the minimum and maximum data values mapped
to the available range of colors as a list [min, max]. For very high dynamic range images,
you will probably want to enter a max less than the data maximum in order to see detail in
lower brightness-level pixels. The next setting also helps very much with high dynamic range
data.
• Basic settings:
Scaling power cycles
This option allows logarithmic scaling of data values to colormap cells.
The color for a data value is determined as follows: first, the value is clipped to lie within the
data range specified above, then mapped to an index into the available colors, as described
in the next paragraph. The color corresponding to this index is determined finally by the
current colormap and its ’fiddling’ (shift/slope) and brightness/contrast settings (see Mouse
Toolbar, above). Adding a Color Wedge to your image can help clarify the effect of the
various color controls.
The Scaling power cycles option controls the mapping of clipped data values to colormap
indices. Set to zero (the default), a straight linear relation is used. For negative scaling
values, a logarithmic mapping assigns an larger fraction of the available colors to lower data
values (this is usually what you want). Setting dataMin to something around the noise level
is often useful/appropriate in conjunction with a negative ’Power cycles’ setting.
For positive values, an larger fraction of the colormap is used for the high data values.
1
The actual functions are computed as follows:
1
CHAPTER 7. VISUALIZATION WITH THE CASA VIEWER
270
See Figure 7.8 for sample curves.
Figure 7.8: Example curves for scaling power cycles.
• Basic settings:
Colormap
You can select from a variety of colormaps here. Hot Metal, Rainbow and Greyscale colormaps are the ones most commonly used.
7.3.1.2
Raster Image — Other Settings
Many of the other settings on the Data Options panel for raster images are self-explanatory, such
as those which affect Beam ellipse drawing (only available if your image provides beam data),
or the form of the Axis labeling and Position tracking information. You can also give your
image a Color wedge, a key to the current mapping from data values to colors.
You can control which of your image’s axes are on the vertical and horizontal display axes and
which on the animation or ’movie’ axis, within the Display axes drop-down. You must set the
X, Y and Z (animation) axes so that each shows a different image axis, in order for your choice to
take effect.
If your image has a fourth axis (typically Stokes), it can be controlled by a slider within the Hidden
axes drop-down.
For negative scaling values (say −p), the data is scaled linearly from the range (dataMin – dataMax) to the range
(1 – 10p ). Then the program takes the log (base 10) of that value (arriving at a number from 0 to p) and scales that
linearly to the number of available colors. Thus the data is treated as if it had p decades of range, with an equal
number of colors assigned to each decade.
For positive scaling values, the inverse (exponential) functions are used. If p is the (positive) value chosen, The
data value is scaled linearly to lie between 0 and p, and 10 is raised to this power, yielding a value in the range (1 –
10p ). Finally, that value is scaled linearly to the number of available colors.
CHAPTER 7. VISUALIZATION WITH THE CASA VIEWER
7.3.2
271
Viewing a contour map
Viewing a contour image is similar to the process above. A contour map shows lines of equal data
value (e.g., flux density) for the selected plane of gridded data (Figure 7.9). Contour maps are
particularly useful for overlaying on raster images so that two different measurements of the same
part of the sky can be shown simultaneously (§ 7.3.3).
Several Basic Settings options control the contour levels used. The contours themselves are
specified by a list in the RelativeContourLevels box. These are defined relative to the two other
parameters, the BaseContourLevel (which sets what 0 in the relative contour list corresponds to in
the image), and the UnitContourLevel (which sets what 1 in the relative contour list corresponds
to in the image). Note that negative contours are usually dashed. BETA ALERT: This scheme
was adopted in 2.4.0 and is slightly different to that used in previous versions.
Figure 7.9: The Viewer Display Panel (left) and Data Display Options panel (right) after
choosing Contour Map from the Load Data panel. The image shown is for channel 11 of the
NGC5921 cube, selected using the Animator tape deck, and zoomed in using the tool bar icon.
Note the different options in the open Basic Settings category of the Data Display Options
panel.
For example, it is relatively straightforward to set fractional contours (e.g. “percent levels”), e.g.:
CHAPTER 7. VISUALIZATION WITH THE CASA VIEWER
272
RelativeContourLevels = [0.2, 0.4, 0.6, 0.8]
BaseContourLevel = 0.0
UnitContourLevel = <image max>
This maps the maximum to 1 and thus our contours are fractions of the peak.
Another example shows how to set absolute values so that the contours are given in flux density
units (Jy):
RelativeContourLevels = [0.010, 0.0.020, 0.040, 0.080, 0.160, 0.320]
BaseContourLevel = 0.0
UnitContourLevel = 1.0
Here we have contours starting at 10mJy and doubling every contour.
We can also set contours in multiples of the image rms (“sigma”):
RelativeContourLevels = [-3,3,5,10,15,20]
BaseContourLevel = 0.0
UnitContourLevel = <image rms>
Here we have first contours at negative and positive 3-sigma. You can get the image rms using the
imstat task (§ 6.7) or using the Viewer statistics tool on a region of the image (§ 7.2.3).
As a final example, not all images are of intensity, for example a moment-1 image (§ 6.6) has units of
velocity. In this case, absolute contours will work fine, but by default the viewer will set fractional
contours but referred to the min and max velocity:
RelativeContourLevels = [0.2, 0.4, 0.6, 0.8]
BaseContourLevel = <image min>
UnitContourLevel = <image max>
Here we have contours spaced evenly from min to max, and this is what you get by default if you
load a non-intensity image (like the moment-1 image). See Figure 7.10 for an example of this.
7.3.3
Overlay contours on a raster map
Contours of either a second data set or the same data set can be used for comparison or to enhance
visualization of the data. The Data Options Panel will have multiple tabs which allow adjusting
each overlay individually (Note tabs along the top). Beware: it’s easy to forget which tab is active!
Also note that axis labeling is controlled by the first-registered image overlay that has labeling
turned on (whether raster or contour), so make label adjustments within that tab.
To add a Contour overlay, open the Load Data panel (Use the Data menu or click on the Folder
icon), select the data set and select Contour. See Figure 7.10 for an example using NGC5921.
CHAPTER 7. VISUALIZATION WITH THE CASA VIEWER
273
Figure 7.10: The Viewer Display Panel (left) and Data Display Options panel (right) after
overlaying a Contour Map of velocity on a Raster Image of intensity. The image shown is for the
moments of the NGC5921 cube, zoomed in using the tool bar icon. The tab for the contour plot is
open in the Data Display Options panel.
7.3.4
Spectral Profile Plotting
From the Tools menu, the Spectral Profile plotting tool can be selected. This will pop up a
new Image Profile window containing an x-y plot of the intensity versus spectral axis (usually
velocity). You can then select a region with the Rectangle or Polygon Region drawing tools, or
pinpoint a position using the Crosshair tool. The profile for the region or position selected will
then appear in the Image Profile window. This profile will update in real time to track changes
to the region or crosshair, which can be moved by click-dragging the mouse. See Figure 7.11.
7.3.5
Managing and Saving Regions
To save a region of an image you have on display, first open the Region Manager window (the
Tools:Region Manager menu item, or the corresponding toolbutton). A window will appear as in
Figure 7.12.
CHAPTER 7. VISUALIZATION WITH THE CASA VIEWER
274
Figure 7.11: The Image Profile panel that appears if you use the Tools:Spectral Profile
menu, and then use the rectangle or polygon tool to select a region in the image. You can also use
the crosshair to get the profile at a single position in the image. The profile will change to track
movements of the region or crosshair if moved by dragging with the mouse.
Under Region Extent, choose whether you want your region to be confined to the viewed plane
only, or to extend over all channels or all image planes.
Then trace out your region on the display panel using the rectangle or polygon region mouse tools
(§ 7.2.1, § 7.2.3), and confirm by double-clicking inside the region. Figure 7.13 shows an image
region selected with the polygon tool.
Note: The extent of the region is determined by the extent button in effect when the region is
defined, not when it is saved. Therefore it is important to select the extent before double-clicking
the region with the mouse. If you neglected to do this, you can just double-click again within the
region after you select the extent and before saving.
Make any desired adjustments to the offered pathname and press Save Last region to save the
region to a file. The example Casa commands below illustrate usage of such files.
CHAPTER 7. VISUALIZATION WITH THE CASA VIEWER
275
Figure 7.12: The Region Manager panel that appears if you select the Tools:Region Manager
menu item.
reg = rg.fromfiletorecord( "my.im.rgn" )
ia.open( "my.im" )
ia.statistics( region=reg )
BETA ALERT: Visual region management is incomplete. Very soon, the region will be placed inside the image file rather than stored separately. Compound regions with iterative additions/deletions
and better visual feedback will also be provided.
Note that the current Region Extent choice also affects the image points used in computing statistics
(§ 7.2.3).
7.3.6
Adjusting Canvas Parameters/Multi-panel displays
The display area can also be manipulated with the following controls in the Panel Options (or
’Viewer Canvas Manager’) window. Use the wrench icon with a ’P’ (or the ’Display Panel’ menu)
to show this window.
• Margins - specify the spacing for the left, right, top, and bottom margins
• Number of panels - specify the number of panels in x and y and the spacing between those
panels.
• Background Color - white or black (more choices to come)
CHAPTER 7. VISUALIZATION WITH THE CASA VIEWER
Figure 7.13: Selecting an image region with the polygon tool.
276
CHAPTER 7. VISUALIZATION WITH THE CASA VIEWER
7.3.6.1
277
Setting up multi-panel displays
Figure 7.14 illustrates a multi-panel display along with the Viewer Canvas Manager settings which
created it.
Figure 7.14: A multi-panel display set up through the Viewer Canvas Manager.
7.3.6.2
Background Color
The Background Color selection can be used to change the background color from its default
of black. Currently, the only other choice is white, which is more appropriate for printing or
inclusion in documents.
7.4
Viewing Measurement Sets
Visibility data can also be displayed and flagged directly from the viewer. For Measurement Set
files the only option for display is ’Raster’ (similar to AIPS task TVFLG). An example of MS display
is shown in Figure 7.2; loading of an MS is shown in Figure 7.15.
CHAPTER 7. VISUALIZATION WITH THE CASA VIEWER
278
Figure 7.15: The Load Data - Viewer panel as it appears if you select an MS. The only option
available is to load this as a Raster Image. In this example, clicking on the Raster Image button
would bring up the displays shown in Figure 7.2.
Warning: Only one MS should be registered at a time on a Display Panel. Only one MS can be
shown in any case. You do not have to close other images/MSs, but you should at least ’unregister’
them from the Display Panel used for viewing the MS. If you wish to see other images or MSs at
the same time, create multiple Display Panel windows.
7.4.1
Data Display Options Panel for Measurement Sets
The Data Display Options panel provides adjustments for MSs similar to those for images,
and also includes flagging options. As with images, this window appears when you choose the
Data:Adjust menu or use the wrench icon from the Main Toolbar. It is also shown by default
when an MS is loaded. The right panel of Figure 7.2 shows a Data Options window. It has a tab
for each open MS, containing a set of categories. The options within each category can be either
’rolled up’ or expanded by clicking the category label.
For a Measurement Set, the categories are:
CHAPTER 7. VISUALIZATION WITH THE CASA VIEWER
279
• Advanced
• MS and Visibility Selection
• Display Axes
• Flagging Options
• Basic Settings
• Axis Drawing and Labels
• Color Wedge
7.4.1.1
MS Options — Basic Settings
The Basic Settings roll-up is expanded by default. It contains entries similar to those for a raster
image (§ 7.3.1.1). Together with the brightness/contrast and colormap adjustment icons on the
Mouse Toolbar of the Display Panel, they are especially important for adjusting the color display
of your MS.
The available Basic options are:
• Data minimum/maximum
This has the same usage as for raster images. Lowering the data maximum will help brighten
weaker data values.
• Scaling power cycles
This has exactly the same usage as for raster images (see § 7.3.1.1). Again, lowering this value
often helps make weaker data visible. If you want to view several fields with very different
amplitudes simultaneously, this is typically one of the best adjustments to make early, together
with the Colormap fiddling mouse tool, which is on the middle mouse button by default.
• Colormap
Greyscale or Hot Metal colormaps are generally good choices for MS data.
7.4.1.2
MS Options— MS and Visibility Selections
• Visibility Type
• Visibility Component
• Moving Average Size
CHAPTER 7. VISUALIZATION WITH THE CASA VIEWER
280
Figure 7.16: The MS for NGC4826 BIMA observations has been loaded into the viewer. We see
the first of the spw in the Display Panel, and have opened up MS and Visibility Selections in
the Data Display Options panel. The display panel raster is not full of visibiltiies because spw
0 is continuum and was only observed for the first few scans. This is a case where the different
spectral windows have different numbers of channels also.
This roll-up provides choice boxes for Visibility Type (Observed, Corrected, Model, Residual) and
Component (Amplitude, Phase, Real, or Imaginary).
Changes to Visibility Type or Component (changing from Phase to Amplitude, for example) require
the data to be retrieved again from the disk into memory, which can be a lengthy process. When
a large MS is first selected for viewing, the user must trigger this retrieval manually by pressing
the Apply button (located below all the options), after selecting the data to be viewed (see Field
IDs and Spectral Windows, below).
Tip: Changing visibility type between ’Observed’ and ’Corrected’ can also be used to assure that
data and flags are reloaded from disk. You should do this if you’re using another flagging tool
such as autoflag simultaneously, so that the viewer sees the other tool’s new edits and doesn’t
overwrite them with obsolete flags. The Apply button alone won’t reload unless something within
the viewer itself requires it; in the future, a button will be provided to reload flags from the disk
unconditionally.
You can also choose to view the difference from a running mean or the local RMS deviation of
either Phase or Amplitude. There is a slider for choosing the nominal number of time slots in the
’local neighborhood’ for these displays.
CHAPTER 7. VISUALIZATION WITH THE CASA VIEWER
281
(Note: Insufficient Data is shown in the tracking area during these displays when there is no
other unflagged data in the local neighborhood to compare to the point in question. The moving
time windows will not extend across changes in either field ID or scan number boundaries, so you
may see this message if your scan numbers change with every time stamp. An option will be added
later to ignore scan boundaries).
• Field IDs
• Spectral Windows
You can retrieve and edit a selected portion of the MS data by entering the desired Spectral
Window and Field ID numbers into these boxes. Important: Especially with large MSs, often
the first thing you’ll want to do is to select spectral windows which all have the same number
of channels and the same polarization setup. It also makes sense to edit only a few fields at a
time. Doing this will also greatly reduce data retrieval times and memory requirements.
You can separate the ID numbers with spaces or commas; you do not need to enter enclosing
brackets. Changes to either entry box will cause the selected MS data to be reloaded from disk.
If you select, say, spectral windows 7, 8, 23, and 24, the animator, slice position sliders, and axis
labeling will show these as 0, 1, 2, and 3 (the ’slice positions’ or ’pixel coordinates’ of the chosen
spectral windows). Looking at the position tracking display is the best way to avoid confusion in
such cases. It will show something like: Sp Win 23 (s 2) when you are viewing spectral window
23 (plane 2 of the selected spectral windows).
Changes to MS selections will not be allowed until you have saved (or discarded) any previous
edits you have made (see Flagging Options -- Save Edits, below). A warning is printed on the
console (not the logger).
Initially, all fields and spectral windows are selected. To revert to this ’unselected’ state, choose
’Original’ under the wrench icons next to the entry boxes.
See Figure 7.16 for an example showing the use of the MS and Visibility Selections controls
when viewing an MS.
7.4.1.3
MS Options — Display Axes
This roll-up is very similar to that for images: it allows the user to choose which axes (from Time,
Baseline, Polarization, Channel, and Spectral Window) are are on the display and the animator.
There are also sliders here for choosing positions on the remaining axes. (It’s useful to note that
the data is actually stored internally in memory as an array with these five axes).
For MSs, changing the choice of axis on one control will automatically swap axes, maintaining
different axes on each control. Changing axes or slider/animator positions does not normally
require pressing Apply — the new slice is shown immediately. However, the display may be
partially or completely grey in areas if the required data is not currently in memory, either because
no data has been loaded yet, or because not all the selected data will fit into the allowed memory.
CHAPTER 7. VISUALIZATION WITH THE CASA VIEWER
282
Figure 7.17: The MS for NGC4826 from Figure 7.16, now with the Display Axes open in the
Data Display Options panel. By default, channels are on the Animation Axis and thus in
the tapedeck, while spectral window and polarization are on the Display Axes sliders.
Press the Apply button in this case to load the data (see § 7.4.1.6 and Max.
at the end of § 7.4.1.5).
Visibility Memory
Within the Display Axes rollup you may also select whether to order the baseline axis by antenna1antenna2 (the default) or by (unprojected) baseline length.
See Figures 7.17–7.18 showing the use of the Display Axes controls to change the axes on the
animation and sliders.
7.4.1.4
MS Options — Flagging Options
These options allow you to edit (flag or unflag) MS data. The Crosshair and Rectangle Region
Mouse Tools (§ 7.2.3) are used on the display to select the area to edit. When using the Rectangle
Region tool, double-click inside the selected rectangle to confirm the edit.
The options below determine how edits will be applied.
• Show Flagged Regions...
CHAPTER 7. VISUALIZATION WITH THE CASA VIEWER
283
Figure 7.18: The MS for NGC4826, continuing from Figure 7.17. We have now put spectral
window on the Animation Axis and used the tapedeck to step to spw 2, where we see the data
from the rest of the scans. Now channels is on a Display Axes slider, which has been dragged to
show Channel 33.
You have the option to display flagged regions in the background color (as in TVFLG) or to
highlight them with color. In the former case, flagged regions look just like regions of no
data. With the (default) color option, flags are shown in shades of blue: darker blue for flags
already saved to disk, lighter blue for new flags not yet saved; regions with no data will be
shown in black.
• Flag or Unflag
This setting determines whether selected regions will be flagged or unflagged. This does not
affect previous edits; it only determines the effect which later edits will have. Both flagging
and unflagging edits can be accumulated and then saved in one pass through the MS.
• Flag/Unflag All...
These flagging extent checkboxes allow you to extend your edit over any of the five data axes.
For example, to flag all the data in a given time range, you would check all the axes except
Time, and then select the desired time range with the Rectangle Region mouse tool. Such
edits will extend along the corresponding axes over the entire selected MS (whether loaded
into memory or not) and optionally over unselected portions of the MS as well (Use Entire
CHAPTER 7. VISUALIZATION WITH THE CASA VIEWER
284
MS, below). Use care in selecting edit extents to assure that you’re editing all the data you
wish to edit.
• Flag/Unflag Entire Antenna?
This control can be used to extend subsequent edits to all baselines which include the desired
antenna[s]. For example, if you set this item to ’Yes’ and then click the crosshair on a visibility
point with baseline 3-19, the edit would extend over baselines 0-3, 1-3, 2-3, 3-3, 3-4, ... 3nAntennas-1. Note that the second antenna of the selection (19) is irrelevant here – you can
click anywhere within the ’Antenna 3 block’, i.e., where the first antenna number is 3, to
select all baselines which include antenna 3.
This item controls the edit extent only along the baseline axis. If you wish to flag all the data
for a given antenna, you must still check the boxes to flag all Times, Channels, Polarizations
and Spectral Windows. There would be no point, however, in activating both this item and
the ’Flag All Baselines’ checkbox. You can flag an antenna in a limited range of times, etc.,
by using the appropriate checkboxes and selecting a rectangular region of visibilities with the
mouse.
Note: You do not need to include the entire ’antenna block’ in your rectangle (and you
may stray into the next antenna if you try). Anywhere within the block will work. To flag
higher-numbered antennas, it often helps to zoom in.
• Undo Last Edit
• Undo All Edits
The ’Undo’ buttons do the expected thing: completely undo the effect of the last edit (or all
unsaved edits). Please note, however, that only unsaved edits can be undone here; there is no
ability to revert to the flagging state at the start of the session once flags have been saved to
disk (unless you have previously saved a ’flag version’. The flag version tool is not available
through the viewer directly).
• Use Entire MS When Saving Edits?
”Yes” means that saving the edits will flag/unflag over the entire MS, including fields (and
possibly spectral windows) which are not currently selected for viewing. Specifically, data
within time range(s) you swept out with the mouse (even for unselected fields) will be edited.
In addition, if ”Flag/Unflag All...” boxes were checked, such edits will extend throughout the
MS. Note that only unselected times (fields) can be edited without checking extent boxes for
the edits as well. Unselected spectral windows, e.g., will not be edited unless the edit also
has ”Flag/Unflag All Spectral Windows” checked.
Warning: Beware of checking ”All Spectral Windows” unless you have also checked ”All
Channels” or turned ”Entire MS” off; channel edits appropriate to the selected spectral
windows may not be appropriate to unselected ones. Set ”Use Entire MS” to”No” if your
edits need to apply only to the portion of the MS you have selected for viewing. Edits can
often be saved significantly faster this way as well.
Also note that checkboxes apply to individual edits, and must be checked before making the
edit with the mouse. ”Use Entire MS”, on the other hand, applies to all the edits saved at
one time, and must be set as desired before pressing ”Save Edits”.
CHAPTER 7. VISUALIZATION WITH THE CASA VIEWER
285
• Save Edits
MS editing works like a text editor in that you see all of your edits immediately, but nothing
is committed to disk until you press ’Save Edits’. Feel free to experiment with all the other
controls; nothing but ’Save Edits’ will alter your MS on disk. As mentioned previously,
however, there is no way to undo your edits once they are saved, except by manually entering
the reverse edits (or restoring a previously-saved ’flag version’).
Also, you must save (or discard) your edits before changing the MS selections. If edits are
pending, the selection change will not be allowed, and a warning will appear on the console.
If you close the MS in the viewer, unsaved edits are simply discarded, without prior warning.
It’s important, therefore, to remember to save them yourself. You can distinguish unsaved
flags (when using the ’Flags In Color’ option), because they are in a lighter shade of blue.
The program must make a pass through the MS on disk to save the edits. This can take a
little time; progress is shown in the console window.
7.4.1.5
MS Options— Advanced
These settings can help optimize your memory usage, especially for large MSs. A rule of thumb
is that they can be increased until response becomes sluggish, when they should be backed down
again.
You can run the unix ’top’ program and hit ’M’ in it (to sort by memory usage) in order to examine
the effects of these settings. Look at the amount of RSS (main memory) and SWAP used by the X
server and ’casaviewer’ processes. If that sounds familiar and easy, then fiddling with these settings
is for you. Otherwise, the default settings should provide reasonable performance in most cases.
• Cache size
The value of this option specifies the maximum number of different views of the data to
save so that they can be redrawn quickly. If you run an animation or scroll around zoomed
data, you will notice that the data displays noticeably faster the second time through because
of this feature. Often, setting this value to the number of animation frames is ideal Note,
however, that on multi-panel displays, each panel counts as one cached image.
Large images naturally take more room than small ones. The memory used for these images
will show up in the X server process. If you need more Visibility Memory (below) for a really
large ms, it is usually better to forgo caching a large number of views.
• Max.
Visibility Memory
This option specifies how many megabytes of memory may be used to store visibility data from
the measurement set internally. Even if you do not adjust this entry, it is useful to look at it
to see how many megabytes are required to store your entire (selected) MS in memory. If the
slider setting is above this, the whole selected MS will fit into the memory buffer. Otherwise,
some data planes will be ’greyed out’ (see Apply Button, § 7.4.1.6 below), and the selected
data will have to be viewed one buffer at a time, which is somewhat less convenient. In most
cases, this means you should select fewer fields or spectral windows – see § 7.4.1.2.
CHAPTER 7. VISUALIZATION WITH THE CASA VIEWER
286
The ’casaviewer’ process contains this buffer memory (it contains the entire viewer, but the
memory buffer can take most of the space).
7.4.1.6
MS Options — Apply Button
When viewing large MSs the display may be partially or completely grey in areas where the required
data is not currently in memory, either because no data has been loaded yet, or because not all the
selected data will fit into the allowed memory (see Max. Visibility Memory above). When the
cursor is over such an area, the following message shows in the position tracking area:
press ’Apply’ on Adjust panel to load data
Pressing the Apply button (which lies below all the options) will reload the memory buffer so that
it includes the slice you are trying to view.
The message No Data has a different meaning; in that case, there simply is no data in the selected
MS at the indicated position.
For large measurement sets, loading visibility data into memory is the most time-consuming step.
Progress feedback is provided in the console window. Again, careful selection of the data to be
viewed can greatly speed up retrieval.
7.5
Printing from the Viewer
You can use the Data:Print menu or the Print button to bring up the Viewer Print Manager.
From this panel, you can print a hardcopy of what is in the Display Panel, or save it in a variety
of formats.
Figure 7.19 shows an example of printing to a file. The key to making acceptable hardcopies
(particularly for printing or inclusion in documents) is to set the background color and line widths
to appropriate values so the plot and labels show up in the limited resolution of the hardcopy.
Use the Viewer Canvas Manager (§ 7.3.6) to change the Background Color from its default
of black to white if you are making plots for printing or inclusion in a document. You might also
want to change the colormap accordingly.
Adjust the Line Width of the Axis Label Properties options in the Data Display Options
panel so that the labels will be visible when printed. Increasing from the default of 1.4 to a value
around 2 seems to work well.
You can choose an output file name in the panel. Be sure to make it a new name, otherwise it will
not overwrite a previous file (and will not say anything about it).
If you will be printing to a postscript printer or to a PS or EPS file, dial up the [PS] Resolution
(dpi) to its maximum of 600. This will increase the size of the PS file somewhat, but will make
a much better plot. Use gzip to compress the PS file if necessary. Be sure to choose the desired
Output Media and Orientation for PS also.
CHAPTER 7. VISUALIZATION WITH THE CASA VIEWER
287
Figure 7.19: Setting up to print to a file. The background color has been set to white, the line
width to 2, and the print resolution to 600 dpi (for an postscript plot). To make the plot, use the
Save button on the Viewer Print Manager panel (positioned in the figure in the upper right)
and select a format with the drop-down, or use the Print button to send directly to a printer.
BETA ALERT: The postscript printing capabilities of the casaviewer are currently limited due
to some issues with the way we use Qt and do axis labels. Significant improvements have been
made in Patch 3. This will be further upgraded in the future, but for now you will need to follow
the suggestions above to get a useable plot. Note that ghostview may show a poorer version of
the PS than you will get when you print.
Appendix A
Single Dish Data Processing
BETA ALERT: The single-dish analysis package within CASA is still experimental. It is included
in the Beta release for the use of the ALMA computing and commissioning groups, and is not
intended for general users. Therefore, this is included in this Cookbook as an appendix.
For single-dish spectral calibration and analysis, CASA uses the ATNF Spectral Analysis Package
(ASAP). This is imported as the sd tool, and forms the basis for a series of tasks (the “SDtasks”)
that encapsulate the functionality within the standard CASA task framework. ASAP was developed
to support the Australian telescopes such as Mopra, Parkes, and Tidbinbilla, and we have adapted
it for use within CASA for GBT and eventually ALMA data also [Note: some support for the
ALMA data are now available)]. For Patch 4, ASAP included in CASA was updated to
Version 2.2. For details on ASAP, see the ASAP home page at ATNF:
• http://www.atnf.csiro.au/computing/software/asap/
You can also download the ASAP User Guide and Reference Manual at this web site. There is
also a brief tutorial. Note that within CASA, the ASAP tools are prefaced with sd., e.g. where it
says in the ASAP User Guide to use scantable you will use sd.scantable in CASA. See § A.3
for more information on the tools.
All of the ASAP functionality is available with a CASA installation. In the following, we outline
how to access ASAP functionality within CASA with the tasks and tools, and the data flow for
standard use cases.
If you run into trouble, be sure to check the list of known issues and features of ASAP and the
SDtasks presented in § A.5 first.
A.1
A.1.1
Guidelines for Use of ASAP and SDtasks in CASA
Environment Variables
There are a number of environment variables that the ASAP tools (and thus the SDtasks) use to
help control their operation. These are described in the ASAP User Guide as being in the .asaprc
288
APPENDIX A. APPENDIX: SINGLE DISH DATA PROCESSING
289
file. Within CASA, these are contained in the Python dictionary sd.rcParams and are accessible
through its keys and values. For SDtask users, the most important are the verbose parameter
controlling the display of detailed messages from the tools. By default
sd.rcParams[’verbose’] = True
and you get lots of messages. Also, the scantable.storage parameter controlling whether scantable operations are done in memory or on disk. The default
sd.rcParams[’scantable.storage’] = ’memory’
does it in memory (best choice if you have enough), while to force the scantables to disk use
sd.rcParams[’scantable.storage’] = ’disk’
which might be necessary to allow processing of large datasets. See § A.3.1 for more details on the
ASAP environment variables.
A.1.2
Assignment
Some ASAP methods and function require you to assign that method to a variable which you
can then manipulate. This includes sd.scantable and sd.selector, which make objects. For
example,
s = sd.scantable(’OrionS_rawACSmod’, average=False)
A.1.3
Lists
For lists of scans or IFs, such as in scanlist and iflist in the SDtasks, the tasks and functions
want a comma-separated Python list, e.g.
scanlist = [241, 242, 243, 244, 245, 246]
You can use the Python range function to generate a list of consecutive numbers, e.g.
scanlist = range(241,247)
giving the same list as above, e.g.
CASA <3>: scanlist=range(241,247)
CASA <4>: print scanlist
[241, 242, 243, 244, 245, 246]
You can also combine multiple ranges by summing lists
APPENDIX A. APPENDIX: SINGLE DISH DATA PROCESSING
290
CASA <5>: scanlist=range(241,247) + range(251,255)
CASA <6>: print scanlist
[241, 242, 243, 244, 245, 246, 251, 252, 253, 254]
Note that in the future, the sd tools and SDtasks will use the same selection language as in the
synthesis part of the package.
Spectral regions, such as those for setting masks, are pairs of min and max values for whatever
spectral axis unit is currently chosen. These are fed into the tasks and tools as a list of lists, with
each list element a list with the [min,max] for that sub-region, e.g.
masklist=[[1000,3000], [5000,7000]].
A.1.4
Dictionaries
Currently, the SDtasks return the Python dictionary for the results of line fitting (in sdfit) and
region statistics (in sdstat). If you invoke these tasks by assigning variable for the return, you can
then access the elements of these through the keywords, e.g.
CASA <10>: line_stat=sdstat()
Current fluxunit = K
No need to convert fluxunits
Using current frequency frame
Using current doppler convention
CASA <11>: line_stat
Out[11]:
{’eqw’: 70.861755476162784,
’max’: 1.2750182151794434,
’mean’: 0.35996028780937195,
’median’: 0.23074722290039062,
’min’: -0.20840644836425781,
’rms’: 0.53090775012969971,
’stddev’: 0.39102539420127869,
’sum’: 90.350028991699219}
You can then use these values in scripts by accessing this dictionary, e.g.
CASA <12>: print "Line max = %5.3f K" % (line_stat[’max’])
Line max = 1.275 K
for example.
A.1.5
Line Formatting
The SDtasks trap leading and trailing whitespace on string parameters (such as infile and
sdfile), but ASAP does not, so be careful with setting string parameters. ASAP is also casesensitive, with most parameters being upper-case, such as ASAP for the sd.scantable.save file
format. The SDtasks are generally more forgiving.
APPENDIX A. APPENDIX: SINGLE DISH DATA PROCESSING
291
Also, beware Python’s sensitivity to indenting.
A.2
Single Dish Analysis Tasks
A set of single dish tasks is available for simplifying basic reduction activities. Currently the list
includes:
• sdaverage — select, calibrate, and average SD data
• sdsmooth — smooth SD spectra
• sdbaseline — fit/remove spectral baselines from SD data
• sdcal — combined the three tasks above to perform standard single dish processing all at
once
• sdcoadd — merge/co-add multiple SD data
• sdflag — channel flagging of SD spectra
• sdfit — line fitting to SD spectra
• sdlist — print a summary of a SD dataset
• sdmath — do simple arithmetic for SD spectra
• sdplot — plotting of SD spectra, including overlay of line catalog data
• sdsave — save SD data to different format
• sdscale — scale SD data
• sdstat — compute statistics of regions of SD spectra
• sdtpimaging — do a simple calibration and create an image from the total power raster
scans
All of the SDtasks work from a file on disk rather than from a scantable in memory as the ASAP
toolkit does (see § A.3. Inside the tasks we invoke a call to sd.scantable to read in the data. The
scantable objects do not persist within CASA after completion of the tasks, and are destroyed to
free up memory.
Three tasks sdaverage, sdsmooth, and sdbaseline are the workhorse for the calibration, selection,
averaging, baseline fitting, and smoothing. The output datasets for each task are written to a file on
disk. Alternatively, one can use the task sdcal to perform all the steps in the three tasks described
above in a single task invocation. It is comparable to run sdaverage, sdsmooth, and sdbaseline,
in that order, since sdcal internally calls these three tasks. Its operation is controlled by three
main ”mode” parameters: calmode (which selects the type of calibration, if any, to be applied),
APPENDIX A. APPENDIX: SINGLE DISH DATA PROCESSING
292
kernel (which selects the smoothing), and blmode (which selects baseline fitting). There are also
parameters controlling the selection such as scanlist, iflist, field, scanaverage, timeaverage,
and polaverage. Note that sdcal can be run with calmode=’none’ to allow re-selection or writing
out of data that is already calibrated.
There is a ”wiring diagram” of the dataflow and control inputs for sdcal shown in Figure A.1.
This might help you chart your course through the calibration.
The SDtasks support the import and export file formats supported by ASAP itself. For import, this
includes: ASAP (scantables), MS (CASA measurement set), RPFITS and SDFITS. For export, this
includes: ASAP (scantables), MS (CASA measurement set), ASCII (text file), SDFITS (a flavor of
SD FITS). The sdsave task is available exclusively for exporting with data selection options.
The sdcoadd task is available to merge data in separate data files into one.
You can get a brief summary of the data in a file using the sdlist task.
Plotting of spectra is handled in the sdplot task. It also offers some selection, averaging and
smoothing options in case you are working from a dataset that has not been split or averaged.
Note that there is some rudimentary plotting capability in many of SD tasks, controlled through
the plotlevel parameter, to aid in the assessment of the performance of these tasks.
Scaling of the spectra and Tsys is available in the sdscale. For arithmetic operations of spectra
in separate scantables, a new task, sdmath is added.
Calculation of statistics on spectral regions is available in the sdstat task. Results are passed in
a Python dictionary return variable.
Basic Gaussian line-fitting is handled by the sdfit task. It can deal with the simpler cases, and
offers some automation as well as interactive selection of fitting region, but more complicated fitting
is best accomplished through the toolkit (sd.fitter).
Basic non-interactive channel flagging is available in the sdflag task. By default or by specifying
outfile parameter, a new file is created containing dataset with the flag information. To update
flags in the input data, outfile=’none’ must be set.
Limited total power data analysis functionality is available through the task, sdtpimaging. This
task directly access the Measurement Set without converting it to scantable format.
APPENDIX A. APPENDIX: SINGLE DISH DATA PROCESSING
293
Figure A.1: Wiring diagram for the SDtask sdcal. The stages of processing within the task are
shown, along with the parameters that control them.
APPENDIX A. APPENDIX: SINGLE DISH DATA PROCESSING
A.2.1
294
SDtask Summaries
The following are the list of parameters and brief descriptions of each of the SDtasks. These
descriptions are also contained in the information produced by help <taskname>, once asap init
has been invoked. Note that you can use inp <taskname> on these as for other tasks.
A.2.1.1
sdaverage
Keyword arguments:
sdfile -- name of input SD dataset
fluxunit -- units for line flux
options: ’K’,’Jy’,’’
default: ’’ (keep current fluxunit)
WARNING: For GBT data, see description below.
>>> fluxunit expandable parameter
telescopeparm -- the telescope characteristics
options: (str) name or (list) list of gain info
default: ’’ (none set)
example: if telescopeparm=’’, it tries to get the telescope
name from the data.
Full antenna parameters (diameter,ap.eff.) known
to ASAP are
’ATPKSMB’, ’ATPKSHOH’, ’ATMOPRA’, ’DSS-43’,
’CEDUNA’,’HOBART’. For GBT, it fixes default fluxunit
to ’K’ first then convert to a new fluxunit.
telescopeparm=[104.9,0.43] diameter(m), ap.eff.
telescopeparm=[0.743] gain in Jy/K
telescopeparm=’FIX’ to change default fluxunit
see description below
specunit -- units for spectral axis
options: (str) ’channel’,’km/s’,’GHz’,’MHz’,’kHz’,’Hz’
default: ’’ (=current)
example: this will be the units for masklist
frame -- frequency frame for spectral axis
options: (str) ’LSRK’,’REST’,’TOPO’,’LSRD’,’BARY’,
’GEO’,’GALACTO’,’LGROUP’,’CMB’
default: currently set frame in scantable
WARNING: frame=’REST’ not yet implemented
doppler -- doppler mode
options: (str) ’RADIO’,’OPTICAL’,’Z’,’BETA’,’GAMMA’
default: currently set doppler in scantable
calmode -- calibration mode
options: ’ps’,’nod’,’fs’,’fsotf’,’quotient’,’none’
APPENDIX A. APPENDIX: SINGLE DISH DATA PROCESSING
default: ’none’
example: choose mode ’none’ if you have
already calibrated and want to
try averaging
scanlist -- list of scan numbers to process
default: [] (use all scans)
example: [21,22,23,24]
this selection is in addition to field,
iflist, and pollist
field -- selection string for selecting scans by name
default: ’’ (no name selection)
example: ’FLS3a*’
this selection is in addition to scanlist,
iflist, and pollist
iflist -- list of IF id numbers to select
default: [] (use all IFs)
example: [15]
this selection is in addition to scanlist,
field, and pollist
pollist -- list of polarization id numbers to select
default: [] (use all polarizations)
example: [1]
this selection is in addition to scanlist,
field, and iflist
channelrange -- channel range selection
default: [] (use all channel)
example: [0,5000]
Note that specified values are recognized as
’channel’ regardless of the value of specunit
scanaverage -- average integrations within scans
options: (bool) True,False
default: False
example: if True, this happens in read-in
For GBT, set False!
timeaverage -- average times for multiple scan cycles
options: (bool) True,False
default: False
example: if True, this happens after calibration
>>>timeaverage expandable parameter
tweight -- weighting for time average
options: ’none’
’var’
(1/var(spec) weighted)
’tsys’ (1/Tsys**2 weighted)
’tint’ (integration time weighted)
’tintsys’ (Tint/Tsys**2)
295
APPENDIX A. APPENDIX: SINGLE DISH DATA PROCESSING
296
’median’ ( median averaging)
default: ’none’
averageall -- average multi-resolution spectra
spectra are averaged by referring
their frequency coverage
default: False
polaverage -- average polarizations
options: (bool) True,False
default: False
>>>polaverage expandable parameter
pweight -- weighting for polarization average
options: ’none’
’var’ (1/var(spec) weighted)
’tsys’ (1/Tsys**2 weighted)
default: ’none’
tau -- atmospheric optical depth
default: 0.0 (no correction)
outfile -- Name of output file
default: ’’ (<sdfile>_cal)
outform -- format of output file
options: ’ASCII’,’SDFITS’,’MS’,’ASAP’
default: ’ASAP’
example: the ASAP format is easiest for further sd
processing; use MS for CASA imaging.
If ASCII, then will append some stuff to
the outfile name
overwrite -- overwrite the output file if already exists
options: (bool) True,False
default: False
WARNING: if outform=’ASCII’, this parameter is ignored
plotlevel -- control for plotting of results
options: (int) 0=none, 1=some, 2=more, <0=hardcopy
default: 0 (no plotting)
example: plotlevel<0 as abs(plotlevel), e.g.
-1 => hardcopy of final plot (will be named
<outfile>_calspec.eps)
WARNING: be careful plotting in fsotf mode!
DESCRIPTION:
Task sdaverage performs data selection, calibration for single-dish spectra. By setting calmode=’none’
one can run sdaverage on already calibrated data, for further selection , averaging and atmospheric
optical depth correction.
APPENDIX A. APPENDIX: SINGLE DISH DATA PROCESSING
297
If you give multiple IFs in iflist, then your scantable will have multiple IFs. This can be handled,
but there can be funny interactions later on. We recommend you split each IF out into separate
files by re-running sdaverage with each IF in turn unless you want to averaging of multi-resolution
spectra (see below).
To save the output spectra in a certain range of channels, you set the range in channelrange.
Averaging of multi-resolution spectra can be achieved by setting the sub-parameter in timeaverage,
averageall to True. It generally handles multi-IFs by selecting overlaps in IFs and assigning new
IFs in the output spectra.
ASAP recognizes the data of the ”AT” telescopes, but currently does not know about the GBT or
any other telescope. This task does know about GBT. Telescope name is obtained from the data.
If you wish to change the fluxunit (see below), by leaving the sub-parameter telescopeparm
unset (telescopeparm=’’), it will use internal telescope parameters for flux conversion for the
data from AT telescopes and it will use an approximate aperture efficiency conversion for the GBT
data. If you give telescopeparm a list, then if the list has a single float it is assumed to be the
gain in Jy/K, if two or more elements they are assumed to be telescope diameter (m) and aperture
efficiency respectively.
Note that sdaverage assumes that the fluxunit is set correctly in the data already. If not, then set
telescopeparm=’FIX’ and it will set the default units to fluxunit without conversion. NOTE: If
the data in sdfile is an ms from GBT and the default flux unit is missing, this task automatically
fixes the default fluxunit to ’K’ before the conversion.
A.2.1.2
sdsmooth
Keyword arguments:
sdfile -- name of input SD dataset
scanaverage -- average integrations within scans
options: (bool) True,False
default: False
example: if True, this happens in read-in
For GBT, set False!
scanlist -- list of scan numbers to process
default: [] (use all scans)
example: [21,22,23,24]
this selection is in addition to field,
iflist, and pollist
field -- selection string for selecting scans by name
default: ’’ (no name selection)
example: ’FLS3a*’
this selection is in addition to scanlist,
iflist,pollist
iflist -- list of IF id numbers to select
default: [] (use all IFs)
example: [15]
APPENDIX A. APPENDIX: SINGLE DISH DATA PROCESSING
298
this selection is in addition to scanlist,
field, and pollist
pollist -- list of polarization id numbers to select
default: [] (use all polarizations)
example: [1]
this selection is in addition to scanlist,
field, and iflist
kernel -- type of spectral smoothing
options: ’hanning’,’gaussian’,’boxcar’
default: ’hanning’
>>>kernel expandable parameter
kwidth -- width of spectral smoothing kernel
options: (int) in channels
default: 5
example: 5 or 10 seem to be popular for boxcar
ignored for hanning (fixed at 5 chans)
(0 will turn off gaussian or boxcar)
outfile -- Name of output ASAP format(scantable) file
default: ’’ (<sdfile>_sm)
outform -- format of output file
options: ’ASCII’,’SDFITS’,’MS’,’ASAP’
default: ’ASAP’
example: the ASAP format is easiest for further sd
processing; use MS for CASA imaging.
If ASCII, then will append some stuff to
the outfile name
overwrite -- overwrite the output file if already exists
options: (bool) True,False
default: False
WARNING: if outform=’ASCII’, this parameter is ignored
plotlevel -- control for plotting of results
options: (int) 0=none, 1=some, 2=more, <0=hardcopy
default: 0 (no plotting)
example: plotlevel<0 as abs(plotlevel), e.g.
-1 => hardcopy of final plot (will be named
<outfile>_smspec.eps)
DESCRIPTION:
Task sdsmooth performs smoothing of the single-dish spectra. Set plotlevel <= 1 to plot spectrum before and after smoothing.
A.2.1.3
sdbaseline
Keyword arguments:
APPENDIX A. APPENDIX: SINGLE DISH DATA PROCESSING
299
sdfile -- name of input SD dataset
fluxunit -- units for line flux
options: ’K’,’Jy’,’’
default: ’’ (keep current fluxunit)
WARNING: For GBT data, see description below.
>>> fluxunit expandable parameter
telescopeparm -- the telescope characteristics
options: (str) name or (list) list of gain info
default: ’’ (none set)
example: if telescopeparm=’’, it tries to get the telescope
name from the data.
Full antenna parameters (diameter,ap.eff.) known
to ASAP are
’ATPKSMB’, ’ATPKSHOH’, ’ATMOPRA’, ’DSS-43’,
’CEDUNA’,’HOBART’. For GBT, it fixes default fluxunit
to ’K’ first then convert to a new fluxunit.
telescopeparm=[104.9,0.43] diameter(m), ap.eff.
telescopeparm=[0.743] gain in Jy/K
telescopeparm=’FIX’ to change default fluxunit
see description below
specunit -- units for spectral axis
options: (str) ’channel’,’km/s’,’GHz’,’MHz’,’kHz’,’Hz’
default: ’’ (=current)
example: this will be the units for masklist
frame -- frequency frame for spectral axis
options: (str) ’LSRK’,’REST’,’TOPO’,’LSRD’,’BARY’,
’GEO’,’GALACTO’,’LGROUP’,’CMB’
default: currently set frame in scantable
WARNING: frame=’REST’ not yet implemented
doppler -- doppler mode
options: (str) ’RADIO’,’OPTICAL’,’Z’,’BETA’,’GAMMA’
default: currently set doppler in scantable
scanlist -- list of scan numbers to process
default: [] (use all scans)
example: [21,22,23,24]
this selection is in addition to field,
iflist, and pollist
field -- selection string for selecting scans by name
default: ’’ (no name selection)
example: ’FLS3a*’
this selection is in addition to scanlist,
iflist, and pollist
iflist -- list of IF id numbers to select
default: [] (use all IFs)
APPENDIX A. APPENDIX: SINGLE DISH DATA PROCESSING
300
example: [15]
this selection is in addition to scanlist,
field, and pollist
pollist -- list of polarization id numbers to select
default: [] (use all polarizations)
example: [1]
this selection is in addition to scanlist,
field, and iflist
tau -- atmospheric optical depth
default: 0.0 (no correction)
blmode -- mode for baseline fitting
options: (str) ’auto’,’list’,’interact’
default: ’auto’
example: blmode=’auto’ uses expandable parameters
in addition to blpoly to run linefinder
to determine line-free regions
USE WITH CARE! May need to tweak the parameters,
thresh, avg_limit, and edge.
blmode=’interact’ allows adding and deleting mask
regions by drawing rectangles on the plot with mouse.
Draw a rectangle with LEFT-mouse to ADD the region to
the mask and with RIGHT-mouse to DELETE the region.
>>> blmode expandable parameters
thresh -- S/N threshold for linefinder
default: 5
example: a single channel S/N ratio above which the channel is
considered to be a detection
avg_limit -- channel averaging for broad lines
default: 4
example: a number of consecutive channels not greater than
this parameter can be averaged to search for broad lines
edge -- channels to drop at beginning and end of spectrum
default: 0
example: [1000] drops 1000 channels at beginning AND end
[1000,500] drops 1000 from beginning and 500 from end
Note: For bad baselines threshold should be increased,
and avg_limit decreased (or even switched off completely by
setting this parameter to 1) to avoid detecting baseline
undulations instead of real lines.
blpoly -- order of baseline polynomial
options: (int) (<0 turns off baseline fitting)
default: 5
APPENDIX A. APPENDIX: SINGLE DISH DATA PROCESSING
301
example: typically in range 2-9 (higher values
seem to be needed for GBT)
verify -- verify the results of baseline fitting
options: (bool) True,False
default: False
WARNING: Currently this just asks whether you accept
the displayed fit and if not, continues
without doing any baseline fit.
masklist -- list of mask regions to INCLUDE in BASELINE fit
default: [] (entire spectrum)
example: [[1000,3000],[5000,7000]]
if blmode=’auto’ then this mask will be applied
before fitting
outfile -- Name of output file
default: ’’ (<sdfile>_bs)
outform -- format of output file
options: ’ASCII’,’SDFITS’,’MS’,’ASAP’
default: ’ASAP’
example: the ASAP format is easiest for further sd
processing; use MS for CASA imaging.
If ASCII, then will append some stuff to
the outfile name
overwrite -- overwrite the output file if already exists
options: (bool) True,False
default: False
WARNING: if outform=’ASCII’, this parameter is ignored
plotlevel -- control for plotting of results
options: (int) 0=none, 1=some, 2=more, <0=hardcopy
default: 0 (no plotting)
example: plotlevel<0 as abs(plotlevel), e.g.
-1 => hardcopy of final plot (will be named
<outfile>_bspec.eps)
WARNING: be careful plotting in fsotf mode!
DESCRIPTION:
Task sdbaseline performs baseline fitting/removal for single-dish spectra. The fit parameters,
terms and rms of base-line are saved to an ASCII file, <outfile> blparam.txt.
Also, see the notes on fluxunit and telescopeparm in the section for sdaverage. See the
sdaverage description for information on fluxunit conversion and the telescopeparm parameter.
By setting blmode=’interact’, you can set/unset mask regions interactively using mouse buttons.
Current mask regions will be shown in yellow shade in the plot. Baseline fit parameters and rms
of fitted spectra are automatically saved to an ASCII file, <outfile> blparam.txt.
APPENDIX A. APPENDIX: SINGLE DISH DATA PROCESSING
Beta Patch 4 New Features: The parameter, interactive, is renamed to verify.
A.2.1.4
sdcal
Keyword arguments:
sdfile -- name of input SD dataset
fluxunit -- units for line flux
options: ’K’,’Jy’,’’
default: ’’ (keep current fluxunit)
WARNING: For GBT data, see description below.
>>> fluxunit expandable parameter
telescopeparm -- the telescope characteristics
options: (str) name or (list) list of gain info
default: ’’ (none set)
example: if telescopeparm=’’, it tries to get the telescope
name from the data.
Full antenna parameters (diameter,ap.eff.) known
to ASAP are
’ATPKSMB’, ’ATPKSHOH’, ’ATMOPRA’, ’DSS-43’,
’CEDUNA’,’HOBART’. For GBT, it fixes default fluxunit
to ’K’ first then convert to a new fluxunit.
telescopeparm=[104.9,0.43] diameter(m), ap.eff.
telescopeparm=[0.743] gain in Jy/K
telescopeparm=’FIX’ to change default fluxunit
see description below
specunit -- units for spectral axis
options: (str) ’channel’,’km/s’,’GHz’,’MHz’,’kHz’,’Hz’,’’
default: ’’ (=current)
example: this will be the units for masklist
frame -- frequency frame for spectral axis
options: (str) ’LSRK’,’REST’,’TOPO’,’LSRD’,’BARY’,
’GEO’,’GALACTO’,’LGROUP’,’CMB’
default: currently set frame in scantable
WARNING: frame=’REST’ not yet implemented
doppler -- doppler mode
options: (str) ’RADIO’,’OPTICAL’,’Z’,’BETA’,’GAMMA’
default: currently set doppler in scantable
calmode -- calibration mode
options: ’ps’,’nod’,’fs’,’fsotf’,’quotient’,’none’
default: ’none’
example: choose mode ’none’ if you have
already calibrated and want to
try baselines or averaging
302
APPENDIX A. APPENDIX: SINGLE DISH DATA PROCESSING
scanlist -- list of scan numbers to process
default: [] (use all scans)
example: [21,22,23,24]
this selection is in addition to field,
iflist, and pollist
field -- selection string for selecting scans by name
default: ’’ (no name selection)
example: ’FLS3a*’
this selection is in addition to scanlist,
iflist, and pollist
iflist -- list of IF id numbers to select
default: [] (use all IFs)
example: [15]
this selection is in addition to scanlist,
field, and pollist
pollist -- list of polarization id numbers to select
default: [] (use all polarizations)
example: [1]
this selection is in addition to scanlist,
field, and iflist
channelrange -- channel range selection
default: [] (use all channel)
example: [0,5000]
Note that specified values are recognized as
’channel’ regardless of the value of specunit
average -- averaging on spectral data
options: (bool) True,False
default: False
>>>average expandable parameter
scanaverage -- average integrations within scans
options: (bool) True,False
default: False
example: if True, this happens in read-in
For GBT, set False!
timeaverage -- average times for multiple scan cycles
options: (bool) True,False
default: False
example: if True, this happens after calibration
tweight -- weighting for time average
options: ’none’
’var’
(1/var(spec) weighted)
’tsys’ (1/Tsys**2 weighted)
’tint’ (integration time weighted)
’tintsys’ (Tint/Tsys**2)
’median’ ( median averaging)
303
APPENDIX A. APPENDIX: SINGLE DISH DATA PROCESSING
304
default: ’none’
averageall -- average multi-resolution spectra
spectra are averaged by referring
their frequency coverage
default: False
polaverage -- average polarizations
options: (bool) True,False
default: False
pweight -- weighting for polarization average
options: ’none’
’var’ (1/var(spec) weighted)
’tsys’ (1/Tsys**2 weighted)
tau -- atmospheric optical depth
default: 0.0 (no correction)
kernel -- type of spectral smoothing
options: ’none’,’hanning’,’gaussian’,’boxcar’
default: ’none’
>>>kernel expandable parameter
kwidth -- width of spectral smoothing kernel
options: (int) in channels
default: 5
example: 5 or 10 seem to be popular for boxcar
ignored for hanning (fixed at 5 chans)
(0 will turn off gaussian or boxcar)
blmode -- mode for baseline fitting
options: (str) ’none’,’auto’,’list’,’interact’
default: ’none’
example: blmode=’auto’ uses expandable parameters
in addition to blpoly to run linefinder
to determine line-free regions
USE WITH CARE! May need to tweak the parameters,
thresh, avg_limit, and edge.
blmode=’interact’ allows adding and deleting mask
regions by drawing rectangles on the plot with mouse.
Draw a rectangle with LEFT-mouse to ADD the region to
the mask and with RIGHT-mouse to DELETE the region.
>>> blmode expandable parameters
thresh -- S/N threshold for linefinder
default: 5
example: a single channel S/N ratio above which the channel is
considered to be a detection
avg_limit -- channel averaging for broad lines
default: 4
example: a number of consecutive channels not greater than
APPENDIX A. APPENDIX: SINGLE DISH DATA PROCESSING
305
this parameter can be averaged to search for broad lines
edge -- channels to drop at beginning and end of spectrum
default: 0
example: [1000] drops 1000 channels at beginning AND end
[1000,500] drops 1000 from beginning and 500 from end
Note: For bad baselines threshold should be increased,
and avg_limit decreased (or even switched off completely by
setting this parameter to 1) to avoid detecting baseline
undulations instead of real lines.
blpoly -- order of baseline polynomial
options: (int) (<0 turns off baseline fitting)
default: 5
example: typically in range 2-9 (higher values
seem to be needed for GBT)
verify -- verify the results of baseline fitting
options: (bool) True,False
default: False
WARNING: Currently this just asks whether you accept
the displayed fit and if not, continues
without doing any baseline fit.
masklist -- list of mask regions to INCLUDE in BASELINE fit
default: [] (entire spectrum)
example: [[1000,3000],[5000,7000]]
if blmode=’auto’ then this mask will be applied
before fitting
outfile -- Name of output file
default: ’’ (<sdfile>_cal)
outform -- format of output file
options: ’ASCII’,’SDFITS’,’MS’,’ASAP’
default: ’ASAP’
example: the ASAP format is easiest for further sd
processing; use MS for CASA imaging.
If ASCII, then will append some stuff to
the outfile name
overwrite -- overwrite the output file if already exists
options: (bool) True,False
default: False
WARNING: if outform=’ASCII’, this parameter is ignored
plotlevel -- control for plotting of results
options: (int) 0=none, 1=some, 2=more, <0=hardcopy
default: 0 (no plotting)
example: plotlevel<0 as abs(plotlevel), e.g.
-1 => hardcopy of final plot (will be named
APPENDIX A. APPENDIX: SINGLE DISH DATA PROCESSING
306
<outfile>_calspec.eps)
WARNING: be careful plotting in fsotf mode!
DESCRIPTION:
Task sdcal performs data selection, calibration, and/or spectral baseline fitting for single-dish
spectra. This task internally calls the tasks, sdaverage, sdsmooth, and sdbaseline and it can
be used to run all the three steps in one task execution. By setting calmode=’none’ one can
run sdcal on already calibrated data, for further selection , averaging and atmospheric optical
depth correction. See the sdaverage description for information on fluxunit conversion and the
telescopeparm parameter. To save the output spectra in a certain range of channels, you set the
range in channelrange. Averaging of multi-resolution spectra can be achieved by setting the subparameter of average, averageall to True. It generally handles multi-IFs by selecting overlaps in
IFs and assigning new IFs in the output spectra.
Beta Patch 4 New Features:
1. Interactive mask selection for baseline fitting is enabled with blmode=’interact’
2. The parameter interactive is renamed as verify
A.2.1.5
sdcoadd
Keyword arguments:
sdfilelist -- list of names of input SD dataset
fluxunit -- units for line flux
options: ’K’,’Jy’,’’
default: ’’ (keep current fluxunit)
WARNING: For GBT data, see description below.
>>> fluxunit expandable parameter
telescopeparm -- the telescope characteristics
options: (str) name or (list) list of gain info
default: ’’ (none set)
example: if telescopeparm=’’, it tries to get the telescope
name from the data.
Full antenna parameters (diameter,ap.eff.) known
to ASAP are
’ATPKSMB’, ’ATPKSHOH’, ’ATMOPRA’, ’DSS-43’,
’CEDUNA’,’HOBART’. For GBT, it fixes default fluxunit
to ’K’ first then convert to a new fluxunit.
telescopeparm=[104.9,0.43] diameter(m), ap.eff.
telescopeparm=[0.743] gain in Jy/K
telescopeparm=’FIX’ to change default fluxunit
see description below
APPENDIX A. APPENDIX: SINGLE DISH DATA PROCESSING
307
specunit -- units for spectral axis
options: (str) ’channel’,’km/s’,’GHz’,’MHz’,’kHz’,’Hz’
default: ’’ (=current)
example: this will be the units for masklist
frame -- frequency frame for spectral axis
options: (str) ’LSRK’,’REST’,’TOPO’,’LSRD’,’BARY’,
’GEO’,’GALACTO’,’LGROUP’,’CMB’
default: currently set frame in scantable
WARNING: frame=’REST’ not yet implemented
doppler -- doppler mode
options: (str) ’RADIO’,’OPTICAL’,’Z’,’BETA’,’GAMMA’
default: currently set doppler in scantable
scanaverage -- average integrations within scans
options: (bool) True,False
default: False
example: if True, this happens in read-in
For GBT, set False!
timeaverage -- average times for multiple scan cycles
options: (bool) True,False
default: False
example: if True, this happens after calibration
polaverage -- average polarizations
options: (bool) True,False
default: False
outfile -- Name of output file
default: ’’ (scantable)
example:
outform -- format of output file
options: ’ASCII’,’SDFITS’,’MS’,’ASAP’
default: ’ASAP’
example: the ASAP format is easiest for further sd
processing; use MS for CASA imaging.
If ASCII, then will append some stuff to
the outfile name
overwrite -- overwrite the output file if already exists
options: (bool) True,False
default: False
WARNING: if outform=’ASCII’, this parameter is ignored
DESCRIPTION:
Task sdcoadd merges multiple single dish spectral data given by a list of spectral data file names in
any of the following formats, ASAP, MS2, and SDFITS. The units of line flux, the units of spectral
axis, frame, and doppler are assumed to be those of the first one in the sdfilelist if not specified.
The timaverage and polaverage are used to perform time and polarization averaging over scans
on the merged scantable to obtained co-added spectra before saving to a file on disk.
APPENDIX A. APPENDIX: SINGLE DISH DATA PROCESSING
A.2.1.6
sdflag
Keyword arguments:
sdfile -- name of input SD dataset
scanlist -- list of scan numbers to process
default: [] (use all scans)
example: [21,22,23,24]
this selection is in addition to field
and iflist
field -- selection string for selecting scans by name
default: ’’ (no name selection)
example: ’FLS3a*’
this selection is in addition to scanlist
and iflist
iflist -- list of IF id numbers to select
default: [] (use all IFs)
example: [15]
this selection is in addition to scanlist
and field
pollist -- list of polarization id numbers to select
default: [] (use all polarizations)
example: [1]
this selection is in addition to scanlist,
field, and iflist
maskflag -- list of mask regions to apply flag/unflag
default: [] (entire spectrum)
example: [[1000,3000],[5000,7000]]
flagmode -- flag mode
default: ’flag’
options: ’flag’,’unflag’,’restore’
in ’restore’ mode, a history of flagging is
displayed and current flag state is returned
outfile -- Name of output file
default: ’’ (<sdfile>_f)
outform -- format of output file
options: ’ASCII’,’SDFITS’,’MS’,’ASAP’
default: ’ASAP’
example: the ASAP format is easiest for further sd
processing; use MS for CASA imaging.
overwrite -- overwrite the output file if already exists
options: (bool) True,False
default: False
WARNING: if outform=’ASCII’, this parameter is ignored
plotlevel -- control for plotting of results
options: (int) 0=none, 1=some, 2=more, <0=hardcopy
308
APPENDIX A. APPENDIX: SINGLE DISH DATA PROCESSING
309
default: 0 (no plotting)
example: plotlevel<0 as abs(plotlevel), e.g.
-1 => hardcopy of final plot (will be named
<outfile>_flag.eps)
WARNING: be careful plotting in fsotf mode!
------------------------------------------------------------------Returns: Current values of maskflag for each spectrum as a list,
only if flagmode is set to ’restore’. Note that the
’restore’ mode refers scanlist, iflist, and pollist.
DESCRIPTION:
Task sdflag performs simple channel based flagging on spectra. The flag regions in channels
can be specified in maskflag. This is not interactive flagging. If plotlevel>=1, the task asks
you if you really apply the flags before it is actually written to the data with a plot indicating
flagged regions. The flags are not written to the current (input) datasets unless outfile=’none’.
Flagged regions (or values of flag masks already applied) of the input data can be listed by setting
flagmode=’restore’. It will print out a summary on the screen and returns maskflag values for
each spectrum as a list. Please note that this task is still experimental.
A.2.1.7
sdfit
Keyword arguments:
sdfile -- name of input SD dataset
default: none - must input file name
example: ’mysd.asap’
See sdcal for allowed formats.
fluxunit -- units for line flux
options: (str) ’K’,’Jy’,’’
default: ’’ (keep current fluxunit)
WARNING: For GBT data, see description below.
>>> fluxunit expandable parameter
telescopeparm -- the telescope characteristics
options: (str) name or (list) list of gain info
default: ’’ (none set)
example: if telescopeparm=’’, it tries to get the telescope
name from the data.
Full antenna parameters (diameter,ap.eff.) known
to ASAP are
’ATPKSMB’, ’ATPKSHOH’, ’ATMOPRA’, ’DSS-43’,
’CEDUNA’,’HOBART’. For GBT, it fixes default fluxunit
to ’K’ first then convert to a new fluxunit.
telescopeparm=[104.9,0.43] diameter(m), ap.eff.
APPENDIX A. APPENDIX: SINGLE DISH DATA PROCESSING
310
telescopeparm=[0.743] gain in Jy/K
telescopeparm=’FIX’ to change default fluxunit
see description below
specunit -- units for spectral axis
options: (str) ’channel’,’km/s’,’GHz’,’MHz’,’kHz’,’Hz’,’’
default: ’’ (=current)
frame -- frequency frame for spectral axis
options: (str) ’LSRK’,’REST’,’TOPO’,’LSRD’,’BARY’,
’GEO’,’GALACTO’,’LGROUP’,’CMB’
default: currently set frame in scantable
WARNING: frame=’REST’ not yet implemented
doppler -- doppler mode
options: (str) ’RADIO’,’OPTICAL’,’Z’,’BETA’,’GAMMA’
default: currently set doppler in scantable
scanlist -- list of scan numbers to process
default: [] (use all scans)
example: [21,22,23,24]
field -- selection string for selecting scans by name
default: ’’ (no name selection)
example: ’FLS3a*’
this selection is in addition to scanlist
and iflist
iflist -- list of IF id numbers to select
default: [] (use all IFs)
example: [15]
pollist -- list of polarization id numbers to select
default: [] (use all polarizations)
example: [1]
fitmode -- mode for fitting
options: (str) ’list’,’auto’
default: ’auto’
example: ’list’ will use maskline to define regions to
fit for lines with nfit in each
’auto’ will use the linefinder to fit for lines
using the following parameters
>>> fitmode expandable parameters
thresh -- S/N threshold for linefinder
default: 5
example: a single channel S/N ratio above which the channel
is considered to be a detection
min_nchan -- minimum number of consecutive channels for linefinder
default: 3
example: minimum number of consecutive channels required to
pass threshold
APPENDIX A. APPENDIX: SINGLE DISH DATA PROCESSING
311
avg_limit -- channel averaging for broad lines
default: 4
example: a number of consecutive channels not greater than
this parameter can be averaged to search for broad
lines
box_size -- running mean box size
default: 0.2
example: a running mean box size specified as a fraction
of the total spectrum length
edge -- channels to drop at beginning and end of spectrum
default: 0
example: [1000] drops 1000 channels at beginning AND end
[1000,500] drops 1000 from beginning and 500 from
end
Note: For bad baselines threshold should be increased,
and avg_limit decreased (or even switched off completely by
setting this parameter to 1) to avoid detecting baseline
undulations instead of real lines.
maskline -- list of mask regions to INCLUDE in LINE fitting
default: all
example: maskline=[[3900,4300]] for a single region, or
maskline=[[3900,4300],[5000,5400]] for two, etc.
invertmask -- invert mask (EXCLUDE masklist instead)
options: (bool) True, False
default: False
example: invertmask=True, then will make one region that is
the exclusion of the maskline regions
nfit -- list of number of gaussian lines to fit in in maskline region
default: 0 (no fitting)
example: nfit=[1] for single line in single region,
nfit=[2] for two lines in single region,
nfit=[1,1] for single lines in each of two regions, etc.
fitfile -- name of output file for fit results
default: no output fit file
example: ’mysd.fit’
overwrite -- overwrite the fitfile if already exists
options: (bool) True, False
default: False
plotlevel -- control for plotting of results
options: (int) 0=none, 1=some, 2=more
default: 0 (no plotting)
example: plotlevel=1 plots fit
plotlevel=2 plots fit and residual
APPENDIX A. APPENDIX: SINGLE DISH DATA PROCESSING
312
no hardcopy available for fitter
WARNING: be careful plotting OTF data with lots of fields
------------------------------------------------------------------Returns a Python dictionary of line statistics
keys:
’peak’,’cent’,’fwhm’,’nfit’
example: each value is a list of lists with one list of
2 entries [fitvalue,error] per component.
e.g. xstat[’peak’]=[[234.9, 4.8],[234.2, 5.3]]
for 2 components.
DESCRIPTION:
Task sdfit is a basic line-fitter for single-dish spectra. It assumes that the spectra have been
calibrated in sdaverage or sdcal.
Furthermore, it assumes that any selection of scans, IFs, polarizations, and time and channel
averaging/smoothing has also already been done (in other sd tasks) as there are no controls for
these. Note that you can use sdsave to do selection, writing out a new scantable.
Note that multiple scans and IFs can in principle be handled, but we recommend that you use
scanlist, field, and iflist to give a single selection for each fit.
For complicated spectra, sdfit does not do a good job of ”auto-guessing” the starting model for
the fit. We recommend you use sd.fitter in the toolkit which has more options, such as fixing
components in the fit and supplying starting guesses by hand.
See the sdaverage description for information on fluxunit conversion and the telescopeparm
parameter.
Beta Patch 4 New Features: The parameter overwirte is added to allow overwirte of output
fitfile.
A.2.1.8
sdlist
Keyword arguments:
sdfile -- name of input SD dataset
scanaverage -- average integrations within scans
options: (bool) True,False
default: False
example: if True, this happens in read-in
For GBT, set False!
listfile -- Name of output file for summary list
default: ’’ (no output file)
example: ’mysd_summary.txt’
overwrite -- overwrite the output file if already exists
options: (bool) True,False
default: False
APPENDIX A. APPENDIX: SINGLE DISH DATA PROCESSING
313
DESCRIPTION:
Task sdlist lists the scan summary of the dataset after importing as a scantable into ASAP. It
will optionally output this summary as file.
Note that if your PAGER environment variable is set to ’less’ and you have set the ’verbose’ ASAP
environment variable to True (the default), then the screen version of the summary will page. You
can disable this for sdlist by setting sd.rcParams[’verbose’]=False before running sdlist. Set
it back afterward if you want lots of information.
A.2.1.9
sdmath
Keyword arguments:
expr -- Mathematical expression using scantables
fluxunit -- units for line flux
options: ’K’,’Jy’,’’
default: ’’ (keep current fluxunit)
WARNING: For GBT data, see description below.
>>> fluxunit expandable parameter
telescopeparm -- the telescope characteristics
options: (str) name or (list) list of gain info
default: ’’ (none set)
example: if telescopeparm=’’, it tries to get the telescope
name from the data.
Full antenna parameters (diameter,ap.eff.) known
to ASAP are
’ATPKSMB’, ’ATPKSHOH’, ’ATMOPRA’, ’DSS-43’,
’CEDUNA’,’HOBART’. For GBT, it fixes default fluxunit
to ’K’ first then convert to a new fluxunit.
telescopeparm=[104.9,0.43] diameter(m), ap.eff.
telescopeparm=[0.743] gain in Jy/K
telescopeparm=’FIX’ to change default fluxunit
see description below
specunit -- units for spectral axis
options: (str) ’channel’,’km/s’,’GHz’,’MHz’,’kHz’,’Hz’
default: ’’ (=current)
example: this will be the units for masklist
frame -- frequency frame for spectral axis
options: (str) ’LSRK’,’REST’,’TOPO’,’LSRD’,’BARY’,
’GEO’,’GALACTO’,’LGROUP’,’CMB’
default: currently set frame in scantable
WARNING: frame=’REST’ not yet implemented
doppler -- doppler mode
options: (str) ’RADIO’,’OPTICAL’,’Z’,’BETA’,’GAMMA’
APPENDIX A. APPENDIX: SINGLE DISH DATA PROCESSING
314
default:
scanlist -- list
default:
example:
currently set doppler in scantable
of scan numbers to process
[] (use all scans)
[21,22,23,24]
this selection is in addition to field,
iflist, and pollist
field -- selection string for selecting scans by name
default: ’’ (no name selection)
example: ’FLS3a*’
this selection is in addition to scanlist,
iflist, and pollist
iflist -- list of IF id numbers to select
default: [] (use all IFs)
example: [15]
this selection is in addition to scanlist,
field, and pollist
pollist -- list of polarization id numbers to select
default: [] (use all polarizations)
example: [1]
this selection is in addition to scanlist,
field, and iflist
outfile -- Name of output file
default: ’’ (<sdfile>_cal)
outform -- format of output file
options: ’ASCII’,’SDFITS’,’MS’,’ASAP’
default: ’ASAP’
example: the ASAP format is easiest for further sd
processing; use MS for CASA imaging.
If ASCII, then will append some stuff to
the outfile name
overwrite -- overwrite the output file if already exists
options: (bool) True,False
default: False
WARNING: if outform=’ASCII’, this parameter is ignored
DESCRIPTION:
Task sdmath execute a mathematical expression for single dish spectra. The spectral data file can
be any of the formats supported by ASAP (scantable, MS, rpfits, and SDFITS). In the expression,
these file names should be put inside of single or double quotes.
The fluxunit, specunit, and frame can be set, otherwise, the current settings of the first spectral
data in the expression are used. Other selections (e.g. scan No, . IF, Pol) also apply to all the
spectral data in the expression, so if any of the data does not contains selection, the task will
produce no output.
Example:
APPENDIX A. APPENDIX: SINGLE DISH DATA PROCESSING
315
# do on-off/off calculation
expr=’("orion_on_data.asap"-"orion_off_data.asap")/"orion_off_data.asap"
outfile=’orion_cal.asap’
sdmath()
A.2.1.10
sdplot
Keyword arguments:
sdfile -- name of input SD dataset
fluxunit -- units for line flux
options: ’K’,’Jy’,’’
default: ’’ (keep current fluxunit)
WARNING: For GBT data, see description below.
>>> fluxunit expandable parameter
telescopeparm -- the telescope characteristics
options: (str) name or (list) list of gain info
default: ’’ (none set)
example: if telescopeparm=’’, it tries to get the telescope
name from the data.
Full antenna parameters (diameter,ap.eff.) known
to ASAP are
’ATPKSMB’, ’ATPKSHOH’, ’ATMOPRA’, ’DSS-43’,
’CEDUNA’,’HOBART’. For GBT, it fixes default fluxunit
to ’K’ first then convert to a new fluxunit.
telescopeparm=[104.9,0.43] diameter(m), ap.eff.
telescopeparm=[0.743] gain in Jy/K
telescopeparm=’FIX’ to change default fluxunit
see description below
specunit -- units for spectral axis
options: (str) ’channel’,’km/s’,’GHz’,’MHz’,’kHz’,’Hz’
default: ’’ (=current)
example: this will be the units for masklist
restfreq -- rest frequency used for specunit=’km/s’
default: ’’ (use current setting)
example: 4.6e10 (float value), ’46GHz’ (string with unit)
Allowed units are ’THz’, ’GHz’, ’MHz’, ’kHz’, and ’Hz’
frame -- frequency frame for spectral axis
options: (str) ’LSRK’,’REST’,’TOPO’,’LSRD’,’BARY’,
’GEO’,’GALACTO’,’LGROUP’,’CMB’
default: currently set frame in scantable
WARNING: frame=’REST’ not yet implemented
doppler -- doppler mode
options: (str) ’RADIO’,’OPTICAL’,’Z’,’BETA’,’GAMMA’
APPENDIX A. APPENDIX: SINGLE DISH DATA PROCESSING
default:
scanlist -- list
default:
example:
currently set doppler in scantable
of scan numbers to process
[] (use all scans)
[21,22,23,24]
this selection is in addition to field
iflist and pollist
field -- selection string for selecting scans by name
default: ’’ (no name selection)
example: ’FLS3a*’
this selection is in addition to scanlist
iflist and pollist
iflist -- list of IF id numbers to select
default: [] (use all IFs)
example: [15]
this selection is in addition to scanlist
field and pollist
pollist -- list of polarization id numbers to select
default: [] (use all polarizations)
example: [1]
this selection is in addition to scanlist,
field, and iflist
scanaverage -- average integs within scans
options: (bool) True,False
default: False
timeaverage -- average times for multiple scan cycles
options: (bool) True,False
default: False
example: if True, this happens after calibration
>>>timeaverage expandable parameter
tweight -- weighting for time average
options: ’none’
’var’
(1/var(spec) weighted)
’tsys’ (1/Tsys**2 weighted)
’tint’ (integration time weighted)
’tintsys’ (Tint/Tsys**2)
’median’ ( median averaging)
default: ’none’
polaverage -- average polarizations
options: (bool) True,False
default: False
>>>polaverage expandable parameter
pweight -- weighting for polarization average
options: ’none’
’var’ (1/var(spec) weighted)
’tsys’ (1/Tsys**2 weighted)
316
APPENDIX A. APPENDIX: SINGLE DISH DATA PROCESSING
kernel -- type of spectral smoothing
options: ’hanning’,’gaussian’,’boxcar’, ’none’
default: ’none’
>>>kernel expandable parameter
kwidth -- width of spectral smoothing kernel
options: (int) in channels
default: 5
example: 5 or 10 seem to be popular for boxcar
ignored for hanning (fixed at 5 chans)
(0 will turn off gaussian or boxcar)
plottype -- type of plot
options: ’spectra’,’totalpower’,’pointing’,’azel’
default: ’spectra’
stack -- code for stacking on single plot for spectral plotting
options: ’p’,’b’,’i’,’t’,’s’ or
’pol’, ’beam’, ’if’, ’time’, ’scan’
default: ’p’
example: maximum of 25 stacked spectra
stack by pol, beam, if, time, scan
panel -- code for splitting into multiple panels for spectral plotting
options: ’p’,’b’,’i’,’t’,’s’ or
’pol’, ’beam’, ’if’, ’time’, ’scan’
default: ’i’
example: maximum of 25 panels
panel by pol, beam, if, time, scan
flrange -- range for flux axis of plot for spectral plotting
options: (list) [min,max]
default: [] (full range)
example: flrange=[-0.1,2.0] if ’K’
assumes current fluxunit
sprange -- range for spectral axis of plot
options: (list) [min,max]
default: [] (full range)
example: sprange=[42.1,42.5] if ’GHz’
assumes current specunit
linecat -- control for line catalog plotting for spectral plotting
options: (str) ’all’,’none’ or by molecule
default: ’none’ (no lines plotted)
example: linecat=’SiO’ for SiO lines
linecat=’*OH’ for alcohols
uses sprange to limit catalog
WARNING: specunit must be in frequency (*Hz)
to plot from the line catalog!
and must be ’GHz’ or ’MHz’ to use
sprange to limit catalog
317
APPENDIX A. APPENDIX: SINGLE DISH DATA PROCESSING
318
linedop -- doppler offset for line catalog plotting (spectral plotting)
options: (float) doppler velocity (km/s)
default: 0.0
example: linedop=-30.0
colormap -- the colours to be used for plot lines.
default: None
example: colormap="green red black cyan magenta" (html standard)
colormap="g r k c m" (abbreviation)
colormap="#008000 #00FFFF #FF0090" (RGB tuple)
The plotter will cycle through these colours
when lines are overlaid (stacking mode).
linestyles -- the linestyles to be used for plot lines.
default: None
example: linestyles="line dashed dotted dashdot dashdotdot dashdashdot".
The plotter will cycle through these linestyles
when lines are overlaid (stacking mode).
WARNING: Linestyles can be specified only one color has been set.
linewidth -- width of plotted lines.
default: None
example: linewidth=1 (integer)
linewidth=0.75 (double)
histogram -- plot histogram
options: (bool) True, False
default: False
plotfile -- file name for hardcopy output
options: (str) filename.eps,.ps,.png
default: ’’ (no hardcopy)
example: ’specplot.eps’,’specplot.png’
Note this autodetects the format from
the suffix (.eps,.ps,.png).
overwrite -- overwrite the output file if already exists
options: (bool) True,False
default: False
DESCRIPTION:
Task sdplot displays single-dish spectra. It assumes that the spectra have been calibrated in sdcal.
It does allow selection of scans, IFs, polarizations, and some time and channel averaging/smoothing
options also, but does not write out this data.
*** Only apply to ’spectra’ plottype ***
Some header information of the data are plotted at top. Note that colormap and linestyles
cannot be controlled at a time. The ’linestyles’ is ignored if both of them are specified. Some
plot options, like annotation and changing titles, legends, fonts, and the like are not supported in
this task. You should use sd.plotter from the ASAP toolkit directly for this.
APPENDIX A. APPENDIX: SINGLE DISH DATA PROCESSING
319
This task uses the JPL line catalog as supplied by ASAP. If you wish to use a different catalog,
or have it plot the line IDs from top or bottom (rather than alternating), then you will need to
explore the sd toolkit also. See § A.3.9 for more information.
Note that multiple scans and IFs can in principle be handled through stacking and paneling, but
this is fairly rudimentary at present and you have little control of what happens in individual
panels. We recommend that you use scanlist, field, and iflist to give a single selection for
each run.
After plotting, you can display a spectral value on a pop-up window along with mouse movement.
Click the LEFT-mouse button over a spectrum to select it, and drag mouse in the panel to output
its value at the x-position of mouse cursor. The selection is released when you release the mouse
button.
The task sdplot adds an additional toolbar to ASAP plotter which has three buttons, ’spec value’,
’statistics’, and ’Quit’. When the ’spec value’ button is pressed and activated, you can display a
spectral value on the toolbar along with mouse movement. Click the LEFT-mouse button over a
spectrum to select it, and drag mouse in the panel to output its value at the x-position of mouse
cursor. The selection is released when you release the mouse button. When ’statistic’ button is
pressed and activated, you can get statistic values of a channel region selected by mouse. Select a
rectangle region with LEFT/RIGHT-mouse to SELECT/EXCLUDE the channel region to calculate
statistics for the all spectra plotted. The results are printed on the casapy console. Press ’Quit’
button to close the plotter.
*** other plottype options ***
plottype=’totalpower’ is used to plot the total power data. and only plot option is amplitude
versus data row number. plottype=’azel’ plots azimuth and elevation tracks of the source.
plottype=’pointing’ plots antenna pointing. Currently most of the plotting parameters are
ignored these modes.
See the sdaverage description for information on fluxunit conversion and the telescopeparm
parameter.
WARNING: be careful plotting OTF (on-the-fly) mosaic data with lots of fields!
Beta Patch 4 New Features:
• The parameter, restfreq is added to set rest frequency when specunit=’km/s is chosen
• Improvement on spectral value display feature is made
• Now you can specify the region interactively on the plot to get statistics of the region of the
spectrum without launching sdstat
A.2.1.11
sdsave
Keyword arguments:
sdfile -- name of input SD dataset
APPENDIX A. APPENDIX: SINGLE DISH DATA PROCESSING
scanlist -- list of to process
default: [] (use all scans)
example: [21,22,23,24]
this selection is in addition to field,
iflist, and pollist
field -- selection string for selecting scans by name
default: ’’ (no name selection)
example: ’FLS3a*’
this selection is in addition to scanlist,
iflist, and pollist
iflist -- list of IF id numbers to select
default: [] (use all IFs)
example: [15]
this selection is in addition to scanlist,
field, and pollist
pollist -- list of polarization id numbers to select
default: [] (use all polarizations)
example: [1]
this selection is in addition to scanlist,
field, and iflist
scanaverage -- average integrations within scans
options: (bool) True,False
default: False
example: if True, average integrations before it is saved
timeaverage -- average times for multiple scan cycles
options: (bool) True,False
default: False
>>>timeaverage expandable parameter
tweight -- weighting for time average
options: ’none’
’var’
(1/var(spec) weighted)
’tsys’ (1/Tsys**2 weighted)
’tint’ (integration time weighted)
’tintsys’ (Tint/Tsys**2)
’median’ ( median averaging)
default: ’none’
polaverage -- average polarizations
options: (bool) True,False
default: False
>>>polaverage expandable parameter
pweight -- weighting for polarization average
options: ’none’
’var’ (1/var(spec) weighted)
’tsys’ (1/Tsys**2 weighted)
320
APPENDIX A. APPENDIX: SINGLE DISH DATA PROCESSING
321
outfile -- name of output dataset
default: ’’
outform -- output data format
default: ’ASAP’
Options: ’ASAP’, ’MS2’, ’SDFITS’, ’ASCII’
overwrite -- overwrite the output file if already exists
options: (bool) True,False
default: False
WARNING: if outform=’ASCII’, this parameter is ignored
DESCRIPTION:
Task sdsave writes the single dish data to a disk file in specified format (ASAP, MS2, SDFITS,
ASCII). It is possible to save the subset of the data by selecting scan numbers, IF ids and field
names. The ASAP (scantable) format is recommended for further analysis using sd tool. For
further imaging using imager, save the data to the Measurement Set (MS2).
A.2.1.12
sdscale
Keyword arguments:
sdfile -- name of input SD dataset
factor -- scaling factor
default: 1 (no scaling)
scaletsys -- scaling of associated Tsys
default: False
outfile -- output file name
outfile=’’ will write the data to a file named,
<sdfile>_scaled<factor>
default: ’’
overwrite -- overwrite the output file if already exists
options: (bool) True,False
default: False
DESCRIPTION:
Task sdscale performs scaling of single-dish spectra. By setting scaletsys = True, associated
Tsys is also scaled. Tsys information are written into the file ’sdscale.log’ as well as they are
displayed in the terminal window. The infile can be any of ASAP, MS, SDFITS, or RPFITS
format. If outfile name is given or outfile=’’(default), the scaled data is written to a new file
with the same format as the input data (Note: in case of the RPFITS format input data, it will be
written to SDFITS format).
A.2.1.13
sdstat
Keyword arguments:
APPENDIX A. APPENDIX: SINGLE DISH DATA PROCESSING
sdfile -- name of input SD dataset
default: none - must input file name
example: ’mysd.asap’
See sdcal for allowed formats.
fluxunit -- units for line flux
options: (str) ’K’,’Jy’,’’
default: ’’ (keep current fluxunit)
WARNING: For GBT data, see description below.
>>> fluxunit expandable parameter
telescopeparm -- the telescope characteristics
options: (str) name or (list) list of gain info
default: ’’ (none set)
example: if telescopeparm=’’, it tries to get the telescope
name from the data.
Full antenna parameters (diameter,ap.eff.) known
to ASAP are
’ATPKSMB’, ’ATPKSHOH’, ’ATMOPRA’, ’DSS-43’,
’CEDUNA’,’HOBART’. For GBT, it fixes default fluxunit
to ’K’ first then convert to a new fluxunit.
telescopeparm=[104.9,0.43] diameter(m), ap.eff.
telescopeparm=[0.743] gain in Jy/K
telescopeparm=’FIX’ to change default fluxunit
see description below
specunit -- units for spectral axis
options: (str) ’channel’,’km/s’,’GHz’,’MHz’,’kHz’,’Hz’,’’
default: ’’ (=current)
frame -- frequency frame for spectral axis
options: (str) ’LSRK’,’REST’,’TOPO’,’LSRD’,’BARY’,
’GEO’,’GALACTO’,’LGROUP’,’CMB’
default: currently set frame in scantable
WARNING: frame=’REST’ not yet implemented
doppler -- doppler mode
options: (str) ’RADIO’,’OPTICAL’,’Z’,’BETA’,’GAMMA’
default: currently set doppler in scantable
scanlist -- list of scan numbers to process
default: [] (use all scans)
example: [21,22,23,24]
field -- selection string for selecting scans by name
default: ’’ (no name selection)
example: ’FLS3a*’
this selection is in addition to scanlist
iflist, and pollist
iflist -- list of IF id numbers to select
default: [] (use all IFs)
322
APPENDIX A. APPENDIX: SINGLE DISH DATA PROCESSING
example: [15]
this selection is in addition to field, scanlist
and pollist
pollist -- list of polarization id numbers to select
default: [] (use all pols)
example: [1]
this selection is in addition to field, scanlist
and iflist
masklist -- list of mask regions to INCLUDE in stats
default: [] (whole spectrum)
example: [4000,4500] for one region
[[1000,3000],[5000,7000]]
these must be pairs of [lo,hi] boundaries
invertmask -- invert mask (EXCLUDE masklist instead)
options: (bool) True,False
default: false
interactive -- determines interactive masking
options: (bool) True,False
default: False
example: interactive=True allows adding and deleting mask
regions by drawing rectangles on the plot with mouse.
Draw a rectangle with LEFT-mouse to ADD the region to
the mask and with RIGHT-mouse to DELETE the region.
statfile -- name of output file for line statistics
default: ’’ (no output statistics file)
example: ’stat.txt’
overwrite -- overwrite the statistics file if already exists
options: (bool) True,False
default: False
------------------------------------------------------------------Returns: a Python dictionary of line statistics
keys: ’rms’,’stddev’,’max’,’max_abscissa’, ’min’,
’min_abscissa’, ’sum’,’median’,’mean’,
’totint’,’eqw’,
example: xstat=sdstat(); print "rms = ",xstat[’rms’]
these can be used for testing in scripts or
for regression
’totint’ is the integrated intensity (sum*dx)
where dx is the abscissa interval in ’specunit’.
’eqw’ is equivalent width (totint/mag) where mag
is either max or min depending on which has
greater magnitude.
Note that both ’totint’ and ’eqw’ are quantities
(dictionaries) with ’unit’ and ’value’.
323
APPENDIX A. APPENDIX: SINGLE DISH DATA PROCESSING
324
DESCRIPTION:
Task sdstat computes basic statistics (rms,mean,median,sum) for single-dish spectra. It assumes
that the spectra have been calibrated. Furthermore, it assumes that any time and channel averaging/smoothing has also already been done as there are no controls for these. Note that you can
run sdcal with calmode=’none’ and do selection, writing out a new scantable. The calculated
statistics are written into a file specified by statfile. Interactive mask specification is possible
with interactive=True. Integrated intensity will be shown on the screen and will be included in
the saved statfile (but not yet available in the returned dictionary).
Note that multiple scans and IFs can in principle be handled, but we recommend that you use
scanlist, field, iflist, and pollist to give a single selection for each run.
See the sdcal description for information on fluxunit conversion and the telescopeparm parameter.
WARNING: If you do have multiple scantable rows, then xstat values will be lists.
Beta Patch 4 New Features:
• The total intensity of spectrum and the abscissa (channel, frequency, or velocity) of maximum
and minimum intensities are calculated and returned with their units. You can refer to the
total intensities with key ’totint’ in the returned dictionary, while the key ’max abscissa’ and
’min abscissa’ refer to the abscissa of maximum and minimum, respectively.
• The equivalent width is also returned with it’s unit in returned dictionary
• The overwrite is added to allow overwrite of statfile.
A.2.1.14
sdtpimaging
Keyword arguments:
sdfile -- name of input SD (MS) dataset
calmode -- calibration mode (currently only baseline subtraction)
options: ’baseline’,’none’
default: ’none’
example: choose mode ’none’ if you have
already calibrated and want to do
plotting nd/or imaging
>>> calmode=’baseline’ expandable parameters
masklist -- mask in numbers of rows from each edge of each scan to
be included for baseline fitting
default: none
example: [30,30] or [30]
APPENDIX A. APPENDIX: SINGLE DISH DATA PROCESSING
325
used first 30 rows and last 30 rows of each scan for
the baseline
blpoly -- polynomial order for the baseline fit
default: 1
flaglist -- list of scan numbers to flag (ranges can be accepted)
default: [] (use all scans)
example: [[0,3],80]
flag the scan range [0,3] = [0,1,2,3] and scan 80
antenna -- select data based on antenna name(s) or id(s) in string
default: ’’ (use all antennas)
example: ’0,1’, ’DV01’
WARNING: currently baseline subtraction properly
only one of the antennas.
stokes -- select data based on stokes or polarization type
default: ’’ (use all polarizations)
example: ’XX’
createimage -- do imaging?
default: False
>>> createimage=True expandable parameters
imagename -- output image name
default: none
example: ’mySDimage.im’
imsize -- x and y image size in pixels, symmetric for single value
default: [256,256]
example: imsize=200 (equivalent to [200,200])
cell -- x and y cell size. default unit arcmin
default: ’1.0arcmin’
example: cell=[’0.2arcmin, 0.2arcmin’]
cell=’0.2arcmin’ (equivalent to example above)
phasecenter -- image phase center: direction measure or fieldid
default: 0
example: ’J2000 13h44m00 -17d02m00’, ’AZEL -123d48m29 15d41m41’
ephemsrcname -- ephemeris source name to proper shifting to center on
the moving source for imaging
default: ’’
if the source name in the data matches one of the known
solar objects by the system, this task automatically set
the source name.
example: ’moon’
plotlevel -- control for plotting of results
options: (int) 0=none, 1=some, 2=more, <0=hardcopy
default: 0 (no plotting)
example: plotlevel<0 as abs(plotlevel), e.g.
-1: hardcopy plot (will be named <sdfile>_scans.eps)
1: plot raw data, calibrated data (for calmode=’baseline)
APPENDIX A. APPENDIX: SINGLE DISH DATA PROCESSING
326
plot raw or if exist calibrated data (for calmode=’none’)
2: plot raw data, progressively display baseline fitting for each
scan, and final calibrated data (for calmode=’baseline’)
DESCRIPTION:
Task sdtpimaging performs data selection, calibration, and imaging for single-dish totalpower
raster scan data. This is a still experimental task made to work for the data taken at the ALMA
Testing Facility (ATF) and OSF. Currently, this task directly accesses the Measurement Set data
because of the data access efficiency. So it differs from other single-dish tasks that mostly operate
on the ASAP scantable data format. By setting calmode=’none’, one can run sdtpimaging to
plot the data (raw or calibrated, if exists) and further imaging by setting createimage=True. The
calibration available at this moment is just a simple baseline subtraction for each scan. The fitted
regions set by masklist are the common for all the scans. Selection of the antennas can be made
by setting antenna ID(s) or antenna name(s) in string (e.g. ’0’, ’0,1’, ’DV01’,etc.). For baseline
subtraction, it currently works properly for a single antenna selection. So a separate sdtpimaging
task needs to be run for each antenna. It currently assumes that the data has a single spw(=0) and
fieldid(=0). By setting flaglist, one can set flag by scan numbers to be excluded from imaging.
(Note: ’scan numbers’ are determined from state id and related to SUB SCAN column in STATE
subtable and they are typically different from SCAN NUMBER in MS.)
Beta Patch 4 New Feature: The parameter, stokes is added for selecting polarization.
A.2.2
A.2.2.1
Single Dish Analysis Use Cases With SDTasks
GBT Position Switched Data Analysis
As an example, the following illustrates the use of the SDtasks for the Orion data set, which contains
the HCCCN line in one of its IFs. This walk-through contains comments about setting parameter
values and some options during processing.
#####################################
#
# ORION-S SDtasks Use Case
# Position-Switched data
# Version TT 2008-10-14 (updated)
# Version STM 2007-03-04
#
# This is a detailed walk-through
# for using the SDtasks on a
# test dataset.
#
#####################################
import time
APPENDIX A. APPENDIX: SINGLE DISH DATA PROCESSING
import os
#
#
#
#
NOTE: you should have already run
asap_init()
to import the ASAP tools as sd.<tool>
and the SDtasks
#
# This is the environment variable
# pointing to the head of the CASA
# tree that you are running
casapath=os.environ[’AIPSPATH’]
#
# This bit removes old versions of the output files
os.system(’rm -rf sdusecase_orions* ’)
#
# This is the path to the OrionS GBT ms in the data repository
datapath=casapath+’/data/regression/ATST5/OrionS/OrionS_rawACSmod’
#
# The following will remove old versions of the data and
# copy the data from the repository to your
# current directory. Comment this out if you already have it
# and don’t want to recopy
os.system(’rm -rf OrionS_rawACSmod’)
copystring=’cp -r ’+datapath+’ .’
os.system(copystring)
# Now is the time to set some of the more useful
# ASAP environment parameters (the ones that the
# ASAP User Manual claims are in the .asaprc file).
# These are in the Python dictionary sd.rcParams
# You can see whats in it by typing:
#sd.rcParams
# One of them is the ’verbose’ parameter which tells
# ASAP whether to spew lots of verbiage during processing
# or to keep quiet. The default is
#sd.rcParams[’verbose’]=True
# You can make ASAP run quietly (with only task output) with
#sd.rcParams[’verbose’]=False
# Another key one is to tell ASAP to save memory by
# going off the disk instead. The default is
#sd.rcParams[’scantable.storage’]=’memory’
# but if you are on a machine with small memory, do
327
APPENDIX A. APPENDIX: SINGLE DISH DATA PROCESSING
328
#sd.rcParams[’scantable.storage’]=’disk’
# You can reset back to defaults with
#sd.rcdefaults
##########################
#
# ORION-S HC3N
# Position-Switched data
#
##########################
startTime=time.time()
startProc=time.clock()
##########################
# List data
##########################
# List the contents of the dataset
# First reset parameter defaults (safe)
default(’sdlist’)
# You can see its inputs with
#inp(’sdlist’)
# or just
#inp
# now that the defaults(’sdlist’) set the
# taskname=’sdlist’
#
# Set the name of the GBT ms file
sdfile = ’OrionS_rawACSmod’
# Set an output file in case we want to
# refer back to it
listfile = ’sdusecase_orions_summary.txt’
sdlist()
# You could also just type
#go
# You should see something like:
#
#-------------------------------------------------------------------------------# Scan Table Summary
#-------------------------------------------------------------------------------#Beams:
1
APPENDIX A. APPENDIX: SINGLE DISH DATA PROCESSING
329
#IFs:
26
#Polarisations: 2
(linear)
#Channels:
8192
#
#Observer:
Joseph McMullin
#Obs Date:
2006/01/19/01:45:58
#Project:
AGBT06A_018_01
#Obs. Type:
OffOn:PSWITCHOFF:TPWCAL
#Antenna Name: GBT
#Flux Unit:
Jy
#Rest Freqs:
[4.5490258e+10] [Hz]
#Abcissa:
Channel
#Selection:
none
#
#Scan Source
Time
Integration
#
Beam
Position (J2000)
#
IF
Frame
RefVal
RefPix
Increment
#-------------------------------------------------------------------------------# 20 OrionS_psr
01:45:58
4 x
30.0s
#
0
05:15:13.5 -05.24.08.2
#
0
LSRK
4.5489354e+10
4096
6104.233
#
1
LSRK
4.5300785e+10
4096
6104.233
#
2
LSRK
4.4074929e+10
4096
6104.233
#
3
LSRK
4.4166215e+10
4096
6104.233
# 21 OrionS_ps
01:48:38
4 x
30.0s
#
0
05:35:13.5 -05.24.08.2
#
0
LSRK
4.5489354e+10
4096
6104.233
#
1
LSRK
4.5300785e+10
4096
6104.233
#
2
LSRK
4.4074929e+10
4096
6104.233
#
3
LSRK
4.4166215e+10
4096
6104.233
# 22 OrionS_psr
01:51:21
4 x
30.0s
#
0
05:15:13.5 -05.24.08.2
#
0
LSRK
4.5489354e+10
4096
6104.233
#
1
LSRK
4.5300785e+10
4096
6104.233
#
2
LSRK
4.4074929e+10
4096
6104.233
#
3
LSRK
4.4166215e+10
4096
6104.233
# 23 OrionS_ps
01:54:01
4 x
30.0s
#
0
05:35:13.5 -05.24.08.2
#
0
LSRK
4.5489354e+10
4096
6104.233
#
1
LSRK
4.5300785e+10
4096
6104.233
#
2
LSRK
4.4074929e+10
4096
6104.233
#
3
LSRK
4.4166215e+10
4096
6104.233
# 24 OrionS_psr
02:01:47
4 x
30.0s
#
0
05:15:13.5 -05.24.08.2
#
12
LSRK
4.3962126e+10
4096
6104.2336
APPENDIX A. APPENDIX: SINGLE DISH DATA PROCESSING
#
#
#
#
#
#
#
#
#
#
#
#
#
#
#
#
#
#
#
#
#
13
LSRK
4.264542e+10
14
LSRK
4.159498e+10
15
LSRK
4.3422823e+10
25 OrionS_ps
02:04:27
4 x
0
05:35:13.5 -05.24.08.2
12
LSRK
4.3962126e+10
13
LSRK
4.264542e+10
14
LSRK
4.159498e+10
15
LSRK
4.3422823e+10
26 OrionS_psr
02:07:10
4 x
0
05:15:13.5 -05.24.08.2
12
LSRK
4.3962126e+10
13
LSRK
4.264542e+10
14
LSRK
4.159498e+10
15
LSRK
4.3422823e+10
27 OrionS_ps
02:09:51
4 x
0
05:35:13.5 -05.24.08.2
12
LSRK
4.3962126e+10
13
LSRK
4.264542e+10
14
LSRK
4.159498e+10
15
LSRK
4.3422823e+10
4096
4096
4096
30.0s
6104.2336
6104.2336
6104.2336
4096
4096
4096
4096
30.0s
6104.2336
6104.2336
6104.2336
6104.2336
4096
4096
4096
4096
30.0s
6104.2336
6104.2336
6104.2336
6104.2336
4096
4096
4096
4096
6104.2336
6104.2336
6104.2336
6104.2336
# The HC3N and CH3OH lines are in IFs 0 and 2 respectively
# of scans 20,21,22,23. We will pull these out in our
# calibration.
##########################
# Calibrate data
##########################
# We will use the sdcal task to calibrate the data.
# Set the defaults
default(’sdcal’)
# You can see the inputs with
#inp
# Set our sdfile (which would have been set from our run of
# sdlist if we were not cautious and reset defaults).
sdfile = ’OrionS_rawACSmod’
fluxunit = ’K’
# Lets leave the spectral axis in channels for now
specunit = ’channel’
# This is position-switched data so we tell sdcal this
330
APPENDIX A. APPENDIX: SINGLE DISH DATA PROCESSING
calmode = ’ps’
# For GBT data, it is safest to not have scantable pre-average
# integrations within scans.
average = True
scanaverage = False
# We do want sdcal to average up scans and polarization after
# calibration however. The averaging of scans are weighted by
# integration time and Tsys, and the averaging of polarization
# by Tsys.
timeaverage = True
tweight = ’tintsys’
polaverage = True
pweight = ’tsys’
# Do an atmospheric optical depth (attenuation) correction
# Input the zenith optical depth at 43 GHz
tau = 0.09
# Select our scans and IFs (for HC3N)
scanlist = [20,21,22,23]
iflist = [0]
# We do not require selection by field name (they are all
# the same except for on and off)
field = ’’
# We will do some spectral smoothing
# For this demo we will use boxcar smoothing rather than
# the default
#kernel=’hanning’
# We will set the width of the kernel to 5 channels
kernel = ’boxcar’
kwidth = 5
# We wish to fit out a baseline from the spectrum
# The GBT has particularly nasty baselines :(
# We will let ASAP use auto_poly_baseline mode
# but tell it to drop the 1000 edge channels from
# the beginning and end of the spectrum.
# A 2nd-order polynomial will suffice for this test.
# You might try higher orders for fun.
blmode = ’auto’
blpoly = 2
edge = [1000]
331
APPENDIX A. APPENDIX: SINGLE DISH DATA PROCESSING
# We will not give it regions as an input mask
# though you could, with something like
#masklist=[[1000,3000],[5000,7000]]
masklist = []
# By default, we will not get plots in sdcal (but
# can make them using sdplot).
plotlevel = 0
# But if you wish to see a final spectrum, set
#plotlevel = 1
# or even
#plotlevel = 2
# to see intermediate plots and baselining output.
# Now we give the name for the output file
outfile = ’sdusecase_orions_hc3n.asap’
# We will write it out in ASAP scantable format
outform = ’asap’
# You can look at the inputs with
#inp
# Before running, lets save the inputs in case we want
# to come back and re-run the calibration.
saveinputs(’sdcal’,’sdcal.orions.save’)
# These can be recovered by
#execfile ’sdcal.orions.save’
# We are ready to calibrate
sdcal()
# Note that after the task ran,
# sdcal.last which contains the
# run of the task (all tasks do
# this (anytime before sdcal is
#execfile ’sdcal.last’
it produced a file
inputs from the last
this). You can recover
run again) with
##########################
# List data
##########################
# List the contents of the calibrated dataset
# Set the input to the just created file
sdfile = outfile
332
APPENDIX A. APPENDIX: SINGLE DISH DATA PROCESSING
333
listfile = ’’
sdlist()
# You should see:
#
#-------------------------------------------------------------------------------# Scan Table Summary
#-------------------------------------------------------------------------------#Beams:
1
#IFs:
26
#Polarisations: 1
(linear)
#Channels:
8192
#
#Observer:
Joseph McMullin
#Obs Date:
2006/01/19/01:45:58
#Project:
AGBT06A_018_01
#Obs. Type:
OffOn:PSWITCHOFF:TPWCAL
#Antenna Name: GBT
#Flux Unit:
K
#Rest Freqs:
[4.5490258e+10] [Hz]
#Abcissa:
Channel
#Selection:
none
#
#Scan Source
Time
Integration
#
Beam
Position (J2000)
#
IF
Frame
RefVal
RefPix
Increment
#-------------------------------------------------------------------------------#
0 OrionS_ps
01:52:05
1 x
08:00.5
#
0
05:35:13.5 -05.24.08.2
#
0
LSRK
4.5489354e+10
4096
6104.233
#
# Note that our scans are now collapsed (timeaverage=True) but
# we still have our IF 0
##########################
# Plot data
##########################
default(’sdplot’)
# The file we produced after calibration
# (if we hadn’t reset defaults it would have
# been set - note that sdplot,sdfit,sdstat use
# sdfile as the input file, which is the output
# file of sdcal).
sdfile = ’sdusecase_orions_hc3n.asap’
APPENDIX A. APPENDIX: SINGLE DISH DATA PROCESSING
# Lets just go ahead and plot it up as-is
sdplot()
# Looks ok. Plot with x-axis in GHz
specunit=’GHz’
sdplot()
# Note that the rest frequency in the scantable
# is set correctly to the HCCCN line at 45.490 GHz.
# So you can plot the spectrum in km/s
specunit=’km/s’
sdplot()
# Zoom in
sprange=[-100,50]
sdplot()
# Lets plot up the lines to be sure
# We have to go back to GHz for this
# (known deficiency in ASAP)
specunit=’GHz’
sprange=[45.48,45.51]
linecat=’all’
sdplot()
# Too many lines! Focus on the HC3N ones
linecat=’HCCCN’
sdplot()
# Finally, we can convert from K to Jy
# using the aperture efficiencies we have
# coded into the sdtasks
# For GBT data, do not set telescopeparm
fluxunit=’Jy’
telescopeparm=’’
sdplot()
# Lets save this plot
plotfile=’sdusecase_orions_hc3n.eps’
sdplot()
##########################
# Off-line Statistics
##########################
334
APPENDIX A. APPENDIX: SINGLE DISH DATA PROCESSING
# Now do some region statistics
# First the line-free region
# Set parameters
default(’sdstat’)
sdfile = ’sdusecase_orions_hc3n.asap’
# Keep the default spectrum and flux units
# K and channel
fluxunit = ’’
specunit = ’’
# Pick out a line-free region
# You can bring up a default sdplot again
# to check this
masklist = [[5000,7000]]
# This is a line-free region so we don’t need
# to invert the mask
invertmask = False
# You can check with
#inp
# sdstat returns some results in
# the Python dictionary. You can assign
# this to a variable
off_stat=sdstat()
# and look at it
off_stat
# which should give
# {’eqw’: 38.563105620704945,
# ’max’: 0.15543246269226074,
# ’mean’: -0.0030361821409314871,
# ’median’: -0.0032975673675537109,
# ’min’: -0.15754437446594238,
# ’rms’: 0.047580458223819733,
# ’stddev’: 0.047495327889919281,
# ’sum’: -6.0754003524780273}
#You see it has some keywords for the various
#stats. We want the standard deviation about
#the mean, or ’stddev’
print "The off-line std. deviation = ",off_stat[’stddev’]
335
APPENDIX A. APPENDIX: SINGLE DISH DATA PROCESSING
# which should give
# The off-line std. deviation =
0.0474953278899
# or better formatted (using Python I/O formatting)
print "The off-line std. deviation = %5.3f K" %\
(off_stat[’stddev’])
# which should give
# The off-line std. deviation = 0.047 K
##########################
# On-line Statistics
##########################
# Now do the line region
# Continue setting or resetting parameters
masklist = [[3900,4200]]
line_stat = sdstat()
# look at these
line_stat
# which gives
# {’eqw’: 73.335154614280981,
# ’max’: 0.92909121513366699,
# ’mean’: 0.22636228799819946,
# ’median’: 0.10317134857177734,
# ’min’: -0.13283586502075195,
# ’rms’: 0.35585442185401917,
# ’stddev’: 0.27503398060798645,
# ’sum’: 68.135047912597656}
# of particular interest are the max value
print "The on-line maximum = %5.3f K" % (line_stat[’max’])
# which gives
# The on-line maximum = 0.929 K
# and the estimated equivalent width (in channels)
# which is the sum/max
print "The estimated equivalent width = %5.1f channels" %\
(line_stat[’eqw’])
# which gives
# The estimated equivalent width = 73.3 channels
##########################
# Line Fitting
##########################
336
APPENDIX A. APPENDIX: SINGLE DISH DATA PROCESSING
# Now we are ready to do some line fitting
# Default the parameters
default(’sdfit’)
# Set our input file
sdfile = ’sdusecase_orions_hc3n.asap’
# Stick to
# fluxunit
fluxunit =
specunit =
defaults
= ’K’, specunit = ’channel’
’’
’’
# We will try auto-fitting first
fitmode = ’auto’
# A single Gaussian
nfit = [1]
# Leave the auto-parameters to their defaults for
# now, except ignore the edge channels
edge = [1000]
# Lets see a plot while doing this
plotlevel = 1
# Save the fit output in a file
fitfile = ’sdusecase_orions_hc3n.fit’
# Go ahead and do the fit
fit_stat=sdfit()
# If you had verbose mode on, you probably saw something
# like:
#
# 0: peak = 0.811 K , centre = 4091.041 channel, FWHM = 72.900 channel
#
area = 62.918 K channel
#
# The fit is output in the dictionary
fit_stat
#
# {’cent’:
# ’fwhm’:
# ’nfit’:
# ’peak’:
#
[[4091.04052734375, 0.72398632764816284]],
[[72.899894714355469, 1.7048574686050415]],
1,
[[0.81080442667007446, 0.016420882195234299]]}
337
APPENDIX A. APPENDIX: SINGLE DISH DATA PROCESSING
# So you can write them out or test them:
print "The line-fit parameters were:"
print "
maximum = %6.3f +/- %6.3f K" %\
(fit_stat[’peak’][0][0],fit_stat[’peak’][0][1])
print "
center = %6.1f +/- %6.1f channels" %\
(fit_stat[’cent’][0][0],fit_stat[’cent’][0][1])
print "
FWHM = %6.2f +/- %6.2f channels" %\
(fit_stat[’fwhm’][0][0],fit_stat[’fwhm’][0][1])
#
# Which gives:
# The line-fit parameters were:
#
maximum = 0.811 +/- 0.016 K
#
center = 4091.0 +/0.7 channels
#
FWHM = 72.90 +/1.70 channels
# We can do the fit in km/s also
specunit = ’km/s’
# For some reason we need to help it along with a mask
maskline = [-50,0]
fitfile = ’sdusecase_orions_hc3n_kms.fit’
fit_stat_kms = sdfit()
# Should give (if in verbose mode)
#
0: peak = 0.811 K , centre = -27.134 km/s, FWHM = 2.933 km/s
#
area = 2.531 K km/s
#
# with
fit_stat_kms
# giving
# {’cent’: [[-27.133651733398438, 0.016480101272463799]],
# ’fwhm’: [[2.93294358253479, 0.038807671517133713]],
# ’nfit’: 1,
# ’peak’: [[0.81080895662307739, 0.0092909494414925575]]}
print "The line-fit parameters were:"
print "
maximum = %6.3f +/- %6.3f K" %\
(fit_stat_kms[’peak’][0][0],fit_stat_kms[’peak’][0][1])
print "
center = %6.2f +/- %6.2f km/s" %\
(fit_stat_kms[’cent’][0][0],fit_stat_kms[’cent’][0][1])
print "
FWHM = %6.4f +/- %6.4f km/s" %\
(fit_stat_kms[’fwhm’][0][0],fit_stat_kms[’fwhm’][0][1])
338
APPENDIX A. APPENDIX: SINGLE DISH DATA PROCESSING
339
# The line-fit parameters were:
#
maximum = 0.811 +/- 0.009 K
#
center = -27.13 +/0.02 km/s
#
FWHM = 2.9329 +/- 0.0388 km/s
##########################
#
# End ORION-S Use Case
#
##########################
A.2.2.2
Imaging of Total Power Raster Scans
This example illustrates the use of sdtpimaging for the total power raster scans of the Moon taken
at ATF.
# load single dish module
# asap_init()
# The data used here (uid___X1e1_X3197_X1.ms) is the total power
# raster scans of the Moon taken at ATF (with both antennas).
# It is in MS format which was converted from the ASDM format.
# Do data plotting only
default(sdtpimaging)
inp()
plotlevel=2
# select antenna 1 (Vertex antenna)
antenna=’1’
sdfile=’uid___X1e1_X3197_X1.ms’
sdtpimaging()
# Now, rerun sdtpimaging to do actual data reduction (applying
# baseline subtraction from each scan, and then do imaging).
#
# Do baseline subtraction
calmode=’baseline’
masklist=[30] # use 30 data points from each end of scan for fitting
# Do imaging
createimage=True
imagename=’moon.im’
imagesize=[200,200]
cell=[0.2] # in arcmin
phasecenter=’AZEL 187d54m22s 41d03m0s’
APPENDIX A. APPENDIX: SINGLE DISH DATA PROCESSING
340
Figure A.2: Total power data display using sdtpimaging, with calmode=’baseline’. The top
panel shows uncalibrated data versus row numbers.The middle panel shows baseline fitting of each
scan (only shown here the last scan). The bottom panel shows the calibrated (baseline subtracted)
data.
ephemsrcname=’moon’ # specify ephemeris source name (can be omitted)
plotlevel=1
#plotlevel=2 to see progress of each fitting
sdtpimaging()
A.3
Using The ASAP Toolkit Within CASA
ASAP is included with the CASA installation/build. It is not loaded upon start-up, however, and
must be imported as a standard Python package. A convenience function exists for importing
APPENDIX A. APPENDIX: SINGLE DISH DATA PROCESSING
341
ASAP along with a set of prototype tasks for single dish analysis:
CASA <1>: asap_init
Once this is done, all of the ASAP functionality is now under the Python ’sd’ tool. Note: This
means that if you are following the ASAP cookbook or documentation, all of the commands should
be invoked with a ’sd.’ before the native ASAP command.
The ASAP interface is essentially the same as that of the CASA toolkit, that is, there are groups
of functionality (aka tools) which have the ability to operate on your data. Type:
CASA <4>: sd.<TAB>
sd.__builtins__
sd.__class__
sd.__date__
sd.__delattr__
sd.__dict__
sd.__doc__
sd.__file__
sd.__getattribute__
sd.__hash__
sd.__init__
sd.__name__
sd.__new__
sd.__path__
sd.__reduce__
sd.__reduce_ex__
sd.__repr__
sd.__revision__
sd.__setattr__
sd.__str__
sd.__version__
sd._asap
sd._asap_fname
sd._asaplog
sd._is_sequence_or_number
sd._n_bools
sd._validate_bool
sd._validate_int
sd.asapfitter
sd.asaplinefind
sd.asaplog
sd.asaplotbase
sd.asaplotgui
sd.asapmath
sd.asapplotter
sd.asapreader
sd.average_time
sd.calfs
sd.calnod
sd.calps
sd.casapath
sd.commands
sd.defaultParams
sd.dosigref
sd.dototalpower
sd.fitter
sd.interactivemask
sd.is_ipython
sd.linecatalog
sd.linefinder
sd.list_files
sd.list_scans
sd.mask_and
sd.mask_not
sd.mask_or
sd.merge
sd.os
sd.plf
sd.plotter
sd.print_log
sd.quotient
sd.rc
sd.rcParams
sd.rcParamsDefault
sd.rc_params
sd.rcdefaults
sd.reader
sd.revinfo
sd.scantable
sd.selector
sd.simple_math
sd.sys
sd.unique
sd.version
sd.welcome
sd.xyplotter
...to see the list of tools.
In particular, the following are essential for most reduction sessions:
• sd.scantable - the data structure for ASAP and the core methods for manipulating the
data; allows importing data, making data selections, basic operations (averaging, baselines,
etc) and setting data characteristics (e.g., frequencies, etc).
• sd.selector - selects a subset of data for subsequent operations
• sd.fitter - fit data
APPENDIX A. APPENDIX: SINGLE DISH DATA PROCESSING
342
• sd.plotter - plotting facilities (uses matplotlib)
The scantable functions are used most often and can be applied to both the initial scantable and
to any spectrum from that scan table. Type
sd.scantable.<TAB>
(using TAB completion) to see the full list.
A.3.1
Environment Variables
The asaprc environment variables are stored in the Python dictionary sd.rcParams in CASA.
This contains a number of parameters that control how ASAP runs, for both tools and tasks. You
can see what these are set to by typing at the CASA prompt:
CASA <2>: sd.rcParams
Out[2]:
{’insitu’: True,
’plotter.colours’: ’’,
’plotter.decimate’: False,
’plotter.ganged’: True,
’plotter.gui’: True,
’plotter.histogram’: False,
’plotter.linestyles’: ’’,
’plotter.panelling’: ’s’,
’plotter.papertype’: ’A4’,
’plotter.stacking’: ’p’,
’scantable.autoaverage’: True,
’scantable.freqframe’: ’LSRK’,
’scantable.save’: ’ASAP’,
’scantable.storage’: ’memory’,
’scantable.verbosesummary’: False,
’useplotter’: True,
’verbose’: True}
The use of these parameters is described in detail in the ASAP Users Guide.
You can also change these parameters through the sd.rc function. The use of this is described in
help sd.rc:
CASA <3>: help(sd.rc)
Help on function rc in module asap:
rc(group, **kwargs)
Set the current rc params. Group is the grouping for the rc, eg
for scantable.save the group is ’scantable’, for plotter.stacking, the
group is ’plotter’, and so on. kwargs is a list of attribute
APPENDIX A. APPENDIX: SINGLE DISH DATA PROCESSING
343
name/value pairs, eg
rc(’scantable’, save=’SDFITS’)
sets the current rc params and is equivalent to
rcParams[’scantable.save’] = ’SDFITS’
Use rcdefaults to restore the default rc params after changes.
A.3.2
Import
Data can be loaded into ASAP by using the scantable function which will read a variety of
recognized formats (RPFITS, varieties of SDFITS, the CASA Measurement Set, and NRO OTF
data format). For example:
CASA <1>: scans = sd.scantable(’OrionS_rawACSmod’, average=False)
Importing OrionS_rawACSmod...
The following are some cautions when using this import feature.
• It is important to use the average=False parameter setting as the calibration routines supporting GBT data require all of the individual times and phases.
• GBT data may need some pre-processing prior to using ASAP. In particular, the program
which converts GBT raw data into CASA Measurement Sets tends to proliferate the number
of spectral windows due to shifts in the tracking frequency; this is being worked on by GBT
staff. In addition, GBT SDFITS is currently not readable by ASAP (in progress).
• The Measurement Set to scantable conversion is able to deduce the reference and source data
and assigns an ’ r’ to the reference data to comply with the ASAP conventions.
• GBT observing modes are identifiable in scantable in the name assignment: position switched
(’ ps’), Nod (’ nod’), and frequency switched (’ fs’). These are combined with the reference
data assignment. (For example, the reference data taken in position switched mode observation are assigned as ’ psr’.)
• It is possible to read the ATF interferometric data as a single dish data to further examine it
using ASAP Toolkit and the SD tasks. The usage is the same as importing single dish data
(e.g. s=sd.scantable(your ATF synthesis ms, ’False’) ). It is still experimental and limited
to the data obtained with the two-element synthesis data.
• Importing of Nobeyama Radio Observatory (NRO) OTF data is now available. However, it
is still experimental and only tested to work from toolkit level.
Use the summary function to examine the data and get basic information:
APPENDIX A. APPENDIX: SINGLE DISH DATA PROCESSING
CASA <8>: scans.summary()
-------------------------------------------------------------------------------Scan Table Summary
-------------------------------------------------------------------------------Beams:
1
IFs:
26
Polarisations: 2
(linear)
Channels:
8192
Observer:
Obs Date:
Project:
Obs. Type:
Antenna Name:
Flux Unit:
Rest Freqs:
Abcissa:
Selection:
Joseph McMullin
2006/01/19/01:45:58
AGBT06A_018_01
OffOn:PSWITCHOFF:TPWCAL
GBT
Jy
[4.5490258e+10] [Hz]
Channel
none
Scan Source
Time
Integration
Beam
Position (J2000)
IF
Frame
RefVal
RefPix
Increment
-------------------------------------------------------------------------------20 OrionS_psr
01:45:58
4 x
30.0s
0
05:15:13.5 -05.24.08.2
0
LSRK
4.5489354e+10
4096
6104.233
1
LSRK
4.5300785e+10
4096
6104.233
2
LSRK
4.4074929e+10
4096
6104.233
3
LSRK
4.4166215e+10
4096
6104.233
21 OrionS_ps
01:48:38
4 x
30.0s
0
05:35:13.5 -05.24.08.2
0
LSRK
4.5489354e+10
4096
6104.233
1
LSRK
4.5300785e+10
4096
6104.233
2
LSRK
4.4074929e+10
4096
6104.233
3
LSRK
4.4166215e+10
4096
6104.233
22 OrionS_psr
01:51:21
4 x
30.0s
0
05:15:13.5 -05.24.08.2
0
LSRK
4.5489354e+10
4096
6104.233
1
LSRK
4.5300785e+10
4096
6104.233
2
LSRK
4.4074929e+10
4096
6104.233
3
LSRK
4.4166215e+10
4096
6104.233
23 OrionS_ps
01:54:01
4 x
30.0s
0
05:35:13.5 -05.24.08.2
0
LSRK
4.5489354e+10
4096
6104.233
1
LSRK
4.5300785e+10
4096
6104.233
2
LSRK
4.4074929e+10
4096
6104.233
3
LSRK
4.4166215e+10
4096
6104.233
24 OrionS_psr
02:01:47
4 x
30.0s
0
05:15:13.5 -05.24.08.2
12
LSRK
4.3962126e+10
4096
6104.2336
13
LSRK
4.264542e+10
4096
6104.2336
344
APPENDIX A. APPENDIX: SINGLE DISH DATA PROCESSING
14
LSRK
4.159498e+10
15
LSRK
4.3422823e+10
25 OrionS_ps
02:04:27
4 x
0
05:35:13.5 -05.24.08.2
12
LSRK
4.3962126e+10
13
LSRK
4.264542e+10
14
LSRK
4.159498e+10
15
LSRK
4.3422823e+10
26 OrionS_psr
02:07:10
4 x
0
05:15:13.5 -05.24.08.2
12
LSRK
4.3962126e+10
13
LSRK
4.264542e+10
14
LSRK
4.159498e+10
15
LSRK
4.3422823e+10
27 OrionS_ps
02:09:51
4 x
0
05:35:13.5 -05.24.08.2
12
LSRK
4.3962126e+10
13
LSRK
4.264542e+10
14
LSRK
4.159498e+10
15
LSRK
4.3422823e+10
A.3.3
4096
4096
30.0s
6104.2336
6104.2336
4096
4096
4096
4096
30.0s
6104.2336
6104.2336
6104.2336
6104.2336
4096
4096
4096
4096
30.0s
6104.2336
6104.2336
6104.2336
6104.2336
4096
4096
4096
4096
6104.2336
6104.2336
6104.2336
6104.2336
345
Scantable Manipulation
Within ASAP, data is stored in a scantable, which holds all of the observational information and
provides functionality to manipulate the data and information. The building block of a scantable
is an integration which is a single row of a scantable. Each row contains just one spectrum for each
beam, IF and polarization.
Once you have a scantable in ASAP, you can select a subset of the data based on scan numbers,
sources, or types of scan; note that each of these selections returns a new ’scantable’ with all of the
underlying functionality:
CASA
CASA
CASA
CASA
<5>:
<6>:
<7>:
<8>:
scan27=scans.get_scan(27)
scans20to24=scans.get_scan(range(20,25))
scans_on=scans.get_scan(’*_ps’)
scansOrion=scans.get_scan(’Ori*’)
#
#
#
#
Get
Get
Get
Get
the 27th scan
scans 20 - 24
ps scans on source
all Orion scans
To copy a scantable, do:
CASA <15>: ss=scans.copy()
A.3.3.1
Data Selection
In addition to the basic data selection above, data can be selected based on IF, beam, polarization,
scan number as well as values such as Tsys. To make a selection you create a selector object
which you then define with various selection functions, e.g.,
APPENDIX A. APPENDIX: SINGLE DISH DATA PROCESSING
sel = sd.selector()
#
#
sel.set_ifs(0)
#
scans.set_selection(sel) #
print scans
#
A.3.3.2
346
initialize a selector object
sel.<TAB> will list all options
select only the first IF of the data
apply the selection to the data
shows just the first IF
State Information
Some properties of a scantable apply to all of the data, such as example, spectral units, frequency
frame, or Doppler type. This information can be set using the scantable set xxxx methods.
These are currently:
CASA <1>: sd.scantable.set_<TAB>
sd.scantable.set_dirframe
sd.scantable.set_fluxunit
sd.scantable.set_doppler
sd.scantable.set_freqframe
sd.scantable.set_feedtype
sd.scantable.set_instrument
sd.scantable.set_restfreqs
sd.scantable.set_selection
sd.scantable.set_unit
For example, sd.scantable.set fluxunit sets the default units that describe the flux axis:
scans.set_fluxunit(’K’)
# Set the flux unit for data to Kelvin
Choices are ’K’ or ’Jy’. Note: the scantable.set fluxunit function only changes the name of
the current fluxunit. To change fluxunits, use scantable.convert flux as described in § A.3.4.2
instead (currently you need to do some gymnastics for non-AT telescopes).
Use sd.scantable.set unit to set the units to be used on the spectral axis:
scans.set_unit(’GHz’)
# Use GHZ as the spectral axis for plots
The choices for the units are ’km/s’, ’channel’, or ’*Hz’ (e.g. ’GHz’, ’MHz’, ’kHz’, ’Hz’). This
does the proper conversion using the current frame and Doppler reference as can be seen when the
spectrum is plotted.
You can use sd.scantable.set freqframe to set the frame in which the frequency (spectral) axis
is defined:
CASA <2>: help(sd.scantable.set_freqframe)
Help on method set_freqframe in module asap.scantable:
set_freqframe(self, frame=None) unbound asap.scantable.scantable method
Set the frame type of the Spectral Axis.
Parameters:
frame:
an optional frame type, default ’LSRK’. Valid frames are:
’REST’, ’TOPO’, ’LSRD’, ’LSRK’, ’BARY’,
’GEO’, ’GALACTO’, ’LGROUP’, ’CMB’
Examples:
scan.set_freqframe(’BARY’)
APPENDIX A. APPENDIX: SINGLE DISH DATA PROCESSING
347
The most useful choices here are frame = ’LSRK’ (the default for the function) and frame =
’TOPO’ (what the GBT actually observes in). Note that the ’REST’ option is not yet available.
The Doppler frame is set with sd.scantable.set doppler:
CASA <3>: help(sd.scantable.set_doppler)
Help on method set_doppler in module asap.scantable:
set_doppler(self, doppler=’RADIO’) unbound asap.scantable.scantable method
Set the doppler for all following operations on this scantable.
Parameters:
doppler:
One of ’RADIO’, ’OPTICAL’, ’Z’, ’BETA’, ’GAMMA’
Finally, there are a number of functions to query the state of the scantable. These can be found in
the usual way:
CASA <4>: sd.scantable.get<TAB>
sd.scantable.get_abcissa
sd.scantable.get_restfreqs
sd.scantable.get_azimuth
sd.scantable.get_scan
sd.scantable.get_column_names sd.scantable.get_selection
sd.scantable.get_direction
sd.scantable.get_sourcename
sd.scantable.get_elevation
sd.scantable.get_time
sd.scantable.get_fit
sd.scantable.get_tsys
sd.scantable.get_fluxunit
sd.scantable.get_unit
sd.scantable.get_parangle
sd.scantable.getbeam
sd.scantable.getbeamnos
sd.scantable.getcycle
sd.scantable.getif
sd.scantable.getifnos
sd.scantable.getpol
sd.scantable.getpolnos
sd.scantable.getscan
sd.scantable.getscannos
These include functions to get the current values of the states mentioned above, as well as as methods to query the number of scans, IFs, and polarizations in the scantable, and their designations.
See the inline help for the individual functions for more information.
A.3.3.3
Masks
Several functions (fitting, baseline subtraction, statistics, etc) may be run on a range of channels
(or velocity/frequency ranges). You can create masks of this type using the create mask function:
# spave = an averaged spectrum
spave.set_unit(’channel’)
rmsmask=spave.create_mask([5000,7000])
# create a region over channels 5000-7000
rms=spave.stats(stat=’rms’,mask=rmsmask) # get rms of line free region
rmsmask=spave.create_mask([3000,4000],invert=True) # choose the region
# *excluding* the specified channels
The mask is stored in a simple Python variable (a list) and so may be manipulated using an Python
facilities.
APPENDIX A. APPENDIX: SINGLE DISH DATA PROCESSING
A.3.3.4
348
Scantable Management
scantables can be listed via:
CASA <33>: sd.list_scans()
The user created scantables are:
[’scans20to24’, ’s’, ’scan27’]
As every scantable will consume memory, if you will not use it any longer, you can explicitly
remove it via:
del <scantable name>
A.3.3.5
Scantable Mathematics
It is possible to do simple mathematics directly on scantables from the CASA command line
using the +, −, ∗, / operators as well as their cousins + =, − =, ∗ =, / =
CASA <10>: scan2=scan1+2.0 # add 2.0 to data
CASA <11>: scan *= 1.05
# scale spectrum by 1.05
NOTE: mathematics between two scantables is not currently available in ASAP.
A.3.3.6
Scantable Save and Export
ASAP can save scantables in a variety of formats, suitable for reading into other packages. The
formats are:
• ASAP – This is the internal format used for ASAP. It is the only format that allows the
user to restore the data, fits, etc, without loosing any information. As mentioned before, the
ASAP scantable is a CASA Table (memory-based table). This function just converts it to a
disk-based table. You can access this with the CASA browsetable task or any other CASA
table tasks.
• SDFITS – The Single Dish FITS format. This format was designed for interchange between
packages but few packages can actually read it.
• ASCII – A simple text based format suitable for the user to process using Python or other
means.
• Measurement Set (V2: CASA format) – Saves the data in a Measurement Set. All CASA
tasks which use an MS should work on this.
scans.save(’output_filename’,’format’), e.g.,
CASA <19>: scans.save(’FLS3a_calfs’,’MS2’)
APPENDIX A. APPENDIX: SINGLE DISH DATA PROCESSING
A.3.4
349
Calibration
For some observatories, the calibration happens transparently as the input data contains the Tsys
measurements taken during the observations. The nominal ’Tsys’ values may be in Kelvin or Jansky.
The user may wish to apply a Tsys correction or apply gain-elevation and opacity corrections.
A.3.4.1
Tsys scaling
If the nominal Tsys measurement at the telescope is wrong due to incorrect calibration, the scale
function allows it to be corrected.
scans.scale(1.05,tsys=True) # by default only the spectra are scaled
# (and not the corresponding Tsys) unless tsys=True
A.3.4.2
Flux and Temperature Unit Conversion
To convert measurements in Kelvin to Jansky (and vice versa), the convert flux function may be
used. This converts and scales the data to the selected units. The user may need to supply the
aperture efficiency, telescope diameter or the Jy/K factor
scans.convert_flux(eta=0.48, d=35.) # Unknown telescope
scans.convert_flux(jypk=15) # Unknown telescope (alternative)
scans.convert_flux() # known telescope (mostly AT telescopes)
scans.convert_flux(eta=0.48) # if telescope diameter known
A.3.4.3
Gain-Elevation and Atmospheric Optical Depth Corrections
At higher frequencies, it is important to make corrections for atmospheric opacity and gain-elevation
effects. NOTE: Currently, the MS to scantable conversion does not adequately populate the
azimuth and elevation in the scantable. As a result, one must calculate these via:
scans.recalc_azel()
Computed azimuth/elevation using
Position: [882590, -4.92487e+06, 3.94373e+06]
Time: 01:48:38 Direction: 05:35:13.5 -05.24.08.2
=> azel: 154.696 43.1847 (deg)
Time: 01:48:38 Direction: 05:35:13.5 -05.24.08.2
=> azel: 154.696 43.1847 (deg)
Time: 01:48:38 Direction: 05:35:13.5 -05.24.08.2
=> azel: 154.696 43.1847 (deg)
Time: 01:48:38 Direction: 05:35:13.5 -05.24.08.2
=> azel: 154.696 43.1847 (deg)
Time: 01:48:38 Direction: 05:35:13.5 -05.24.08.2
=> azel: 154.696 43.1847 (deg)
...
APPENDIX A. APPENDIX: SINGLE DISH DATA PROCESSING
350
Once you have the correct Az/El, you can correct for a known opacity by:
scans.opacity(tau=0.09)
A.3.4.4
# Opacity from which the correction factor:
# exp(tau*zenith-distance)
Calibration of GBT data
Data from the GBT is uncalibrated and comes as sets of integrations representing the different
phases within a calibration cycle (e.g., on source, calibration on, on source, calibration off, on
reference, calibration on; on reference, calibration off). Currently, there are a number of routines
emulating the standard GBT calibration (in GBTIDL):
• calps - calibrate position switched data
• calfs - calibrate frequency switched data
• calnod - calibration nod (beam switch) data
All these routines calibrate the spectral data to antenna temperature adopting the GBT calibration
method as described in the GBTIDL calibration document available at:
• http://wwwlocal.gb.nrao.edu/GBT/DA/gbtidl/gbtidl_calibration.pdf
There are two basic steps:
First: determine system temperature using a noise tube calibrator (sd.dototalpower())
For each integration, the system temperature is calculated from CAL noise on/off data as:
Tsys = Tcal x
<refcalof f >
<refcalon −refcalof f >
+
Tcal
2
ref refers to reference data and the spectral data are averaged across the bandpass. Note that the
central 80% of the spectra are used for the calculation.
Second, determine antenna temperature (sd.dosigref())
The antenna temperature for each channel is calculated as:
Ta (ν) = Tsys x
sig(ν)−ref (ν)
ref (ν)
where sig = 12 (sigcalon + sigcalof f ), ref = 12 (sigcalon + sigcalof f ).
Each calibration routine may be used as:
scans=sd.scantable(’inputdata’,False)
# create a scantable called ’scans’
calibrated_scans = sd.calps(scans,[scanlist]) # calibrate scantable with position-switched
# scheme
Note: For calps and calnod, the scanlist must be scan pairs in correct order as these routines only
do minimal checking.
APPENDIX A. APPENDIX: SINGLE DISH DATA PROCESSING
A.3.5
351
Averaging
One can average polarizations in a scantable using the sd.scantable.average pol function:
averaged_scan = scans.average_pol(mask,weight)
where:
Parameters:
mask:
weight:
An optional mask defining the region, where the
averaging will be applied. The output will have all
specified points masked.
Weighting scheme. ’none’ (default), ’var’ (1/var(spec)
weighted), or ’tsys’ (1/Tsys**2 weighted)
Example:
spave = stave.average_pol(weight=’tsys’)
One can also average scans over time using sd.average time:
sd.average_time(scantable,mask,scanav,weight,align)
where:
Parameters:
one scan or comma separated scans
compel:
if True, enable averaging of multi-resolution spectra.
mask:
an optional mask (only used for ’var’ and ’tsys’ weighting)
scanav:
True averages each scan separately.
False (default) averages all scans together,
weight:
Weighting scheme.
’none’
(mean no weight)
’var’
(1/var(spec) weighted)
’tsys’
(1/Tsys**2 weighted)
’tint’
(integration time weighted)
’tintsys’ (Tint/Tsys**2)
’median’
( median averaging)
align:
align the spectra in velocity before averaging. It takes
the time of the first spectrum in the first scantable
as reference time.
Example:
stave = sd.average_time(scans,weight=’tintsys’)
Note that alignment of the velocity frame should be done before averaging if the time spanned by
the scantable is long enough. This is done through the align=True option in sd.average time, or
explicitly through the sd.scantable.freq align function, e.g.
CASA <62>: sc = sd.scantable(’orions_scan20to23_if0to3.asap’,False)
APPENDIX A. APPENDIX: SINGLE DISH DATA PROCESSING
352
CASA <63>: sc.freq_align()
Aligned at reference Epoch 2006/01/19/01:49:23 (UTC) in frame LSRK
CASA <64>: av = sd.average_times(sc)
The time averaging can also be applied to multiple scantables. This might have been taken on different days, for example. The sd.average time function takes multiple scantables as input. However,
if taken at significantly different times (different days for example) then sd.scantable.freq align
must be used to align the velocity scales to the same time, e.g.
CASA <65>:
CASA <66>:
CASA <67>:
Aligned at
CASA <68>:
Aligned at
CASA <69>:
A.3.6
sc1 = sd.scantable(’orions_scan21_if0to3.asap’,False)
sc2 = sd.scantable(’orions_scan23_if0to3.asap’,False)
sc1.freq_align()
reference Epoch 2006/01/19/01:49:23 (UTC) in frame LSRK
sc2.freq_align(reftime=’2006/01/19/01:49:23’)
reference Epoch 2006/01/19/01:54:46 (UTC) in frame LSRK
scav = sd.average_times(sc1,sc2)
Spectral Smoothing
Smoothing on data can be done as follows:
scantable.smooth(kernel,
width,
insitu)
#
#
#
#
type of smoothing: ’hanning’ (default), ’gaussian’, ’boxcar’
width in pixls (ignored for hanning); FWHM for gaussian.
if False (default), do smoothing in-situ; otherwise,
make new scantable
Example:
# spave is an averaged spectrum
spave.smooth(’boxcar’,5)
# do a 5 pixel boxcar smooth on the spectrum
sd.plotter.plot(spave)
# should see smoothed spectrum
A.3.7
Baseline Fitting
The function sd.scantable.poly baseline carries out a baseline fit, given an mask of channels
(if desired):
msk=scans.create_mask([100,400],[600,900])
scans.poly_baseline(msk,order=1)
This will fit a first order polynomial to the selected channels and subtract this polynomial from the
full spectrum.
The auto poly baseline function can be used to automatically baseline your data without having
to specify channel ranges for the line free data. It automatically figures out the line-free emission
and fits a polynomial baseline to that data. The user can use masks to fix the range of channels or
velocity range for the fit as well as mark the band edge as invalid:
APPENDIX A. APPENDIX: SINGLE DISH DATA PROCESSING
353
scans.auto_poly_baseline(mask,edge,order,threshold,chan_avg_limit,plot,insitu):
Parameters:
mask:
edge:
an optional mask retrieved from scantable
an optional number of channel to drop at
the edge of spectrum. If only one value is
specified, the same number will be dropped from
both sides of the spectrum. Default is to keep
all channels. Nested tuples represent individual
edge selection for different IFs (a number of spectral
channels can be different)
order:
the order of the polynomial (default is 0)
threshold: the threshold used by line finder. It is better to
keep it large as only strong lines affect the
baseline solution.
chan_avg_limit:
a maximum number of consecutive spectral channels to
average during the search of weak and broad lines.
The default is no averaging (and no search for weak
lines). If such lines can affect the fitted baseline
(e.g. a high order polynomial is fitted), increase this
parameter (usually values up to 8 are reasonable). Most
users of this method should find the default value
sufficient.
plot:
plot the fit and the residual. In this each
individual fit has to be approved, by typing ’y’
or ’n’
insitu:
if False a new scantable is returned.
Otherwise, the scaling is done in-situ
The default is taken from .asaprc (False)
Example:
scans.auto_poly_baseline(order=2,threshold=5)
A.3.8
Line Fitting
Multi-component Gaussian fitting is available. This is done by creating a fitting object, specifying
fit parameters and finally fitting the data. Fitting can be done on a scantable selection or an
entire scantable using the auto fit function.
#spave is an averaged spectrum
f=sd.fitter()
msk=spave.create_mask([3928,4255])
f.set_function(gauss=1)
f.set_scan(spave,msk)
f.fit()
f.plot(residual=True)
#
#
#
#
#
#
#
#
create fitter object
create mask region around line
set a single gaussian component
set the scantable and region
Automatically guess start values
fit
plot residual
APPENDIX A. APPENDIX: SINGLE DISH DATA PROCESSING
f.get_parameters()
#
#
0: peak = 0.786 K , centre = 4091.236
#
area = 59.473 K channel
f.store_fit(’orions_hc3n_fit.txt’)
#
#
#
f.set_function(gauss=1)
#
f.set_gauss_parameters(0.4,4100,200\
#
,component=0)
#
#
#
#
#
f.set_function(gauss=2)
#
f.set_gauss_parameters(0.4,4100,200\
#
,component=0)
#
f.set_gauss_parameters(0.1,4200,100\
#
,component=1)
#
A.3.9
A.3.9.1
354
retrieve fit parameters
channel, FWHM = 70.586 channel
store fit
To specify initial guess:
set a single gaussian component
set initial guesses for Gaussian
for first component (0)
(peak,center,fwhm)
For multiple components set
initial guesses for each, e.g.
set two gaussian components
set initial guesses for Gaussian
for first component (0)
set initial guesses for Gaussian
for second component (1)
Plotting
ASAP plotter
The ASAP plotter uses the same Python matplotlib library as in CASA (for x-y plots). It is
accessed via the:
sd.plotter<TAB>
# see all functions (omitted here)
sd.plotter.plot(scans) # the workhorse function
sd.plotter.set<TAB>
sd.plotter.set_abcissa
sd.plotter.set_legend
sd.plotter.set_range
sd.plotter.set_colors
sd.plotter.set_linestyles sd.plotter.set_selection
sd.plotter.set_colours
sd.plotter.set_mask
sd.plotter.set_stacking
sd.plotter.set_font
sd.plotter.set_mode
sd.plotter.set_title
sd.plotter.set_histogram
sd.plotter.set_ordinate
sd.plotter.set_layout
sd.plotter.set_panelling
Spectra can be plotted at any time, and it will attempt to do the correct layout depending on
whether it is a set of scans or a single scan.
The details of the plotter display (matplotlib) are detailed in the earlier section.
A.3.9.2
Line Catalog
ASAP allows to load a custom line catalog in ASCII format. The ASCII text file must have at
least 4 columns with Molecule name, frequency in MHz, frequency error and intensity (any units).
If the molecule name contains any spaces, they must be wrapped in quotes ””. A sample of the
ASCII catalog is shown below.
APPENDIX A. APPENDIX: SINGLE DISH DATA PROCESSING
H2D+
H2D+
H2D+
CH
CH
CH
CH
3955.2551 228.8818
12104.7712 177.1558
45809.2731 118.3223
701.6811
.0441
724.7709
.0456
3263.7940
.1000
3335.4810
.1000
355
-7.1941
-6.0769
-3.9494
-7.1641
-7.3912
-6.3501
-6.0304
You can load the ASCII line catalog, for example, if it is called my custom linecat.txt, by following
command.
mycatlog = sd.linecatlog(’my_custom_linecat.txt’)
Use sd.plotter.plot line to overlay the line catalog on the plot. (Currently overplotting line
catalog works only spectra plotted in frequency.)
scans.set_unit(’GHz’)
sd.plotter.plot(scans)
sd.plotter.plot_line(mycatlog)
Following are some useful functions to control the line catalog access. See ASAP User Guide for
more complete descriptions.
mycatlog.save(’my_custom_linecat.tbl’) # save to the internal table format
mycatlog.set_frequency_limits(100,115,’GHz’) #set a frequency range for line selection
mycatlog.set_name(’*OH’) # select all alchols
A.3.10
Setting/Getting Rest Frequencies
The rest frequencies used in the data can be retrieve by sd.scantable.get restfreqs() and set
to new values by sd.scantable.set restfreqs(). The CASA version of ASAP now can store
multiple rest frequencies for each IF.
scans.get_restfreqs()
#{0: [45490258000.0]
#retrieve current rest frequencies
All the rest frequencies currently set to the data are listed in python dictionary for each MOLECULE ID.
To set multiple rest frequencies to spectra for a particular IF, for example,
#Select IFs, then set rest frequencies,
sel=sd.selector()
sel.setifs(0)
scans.set_selection(sel)
scans.set_restfreqs([45490258000.0,45590258000.0,45690258000.0])
NOTE: there is no functionality yet to select a specific rest frequency to apply to a specific line, etc. Currently,
the first one in the list of the rest frequencies is used for such calculation.
APPENDIX A. APPENDIX: SINGLE DISH DATA PROCESSING
A.3.11
356
Single Dish Spectral Analysis Use Case With ASAP Toolkit
Below is a script that illustrates how to reduce single dish data using ASAP within CASA. First a summary
of the dataset is given and then the script.
#
MeasurementSet Name: /home/rohir3/jocular/SD/OrionS_rawACSmod
MS Version 2
#
# Project: AGBT06A_018_01
# Observation: GBT(1 antennas)
#
#Data records: 256
Total integration time = 1523.13 seconds
#
Observed from
01:45:58
to
02:11:21
#
#Fields: 4
# ID
Name
Right Ascension Declination
Epoch
# 0
OrionS
05:15:13.45
-05.24.08.20 J2000
# 1
OrionS
05:35:13.45
-05.24.08.20 J2000
# 2
OrionS
05:15:13.45
-05.24.08.20 J2000
# 3
OrionS
05:35:13.45
-05.24.08.20 J2000
#
#Spectral Windows: (8 unique spectral windows and 1 unique polarization setups)
# SpwID #Chans Frame Ch1(MHz)
Resoln(kHz) TotBW(kHz) Ref(MHz)
Corrs
# 0
8192 LSRK 45464.3506 6.10423298 50005.8766 45489.3536 RR LL HC3N
# 1
8192 LSRK 45275.7825 6.10423298 50005.8766 45300.7854 RR LL HN15CO
# 2
8192 LSRK 44049.9264 6.10423298 50005.8766 44074.9293 RR LL CH3OH
# 3
8192 LSRK 44141.2121 6.10423298 50005.8766 44166.2151 RR LL HCCC15N
# 12
8192 LSRK 43937.1232 6.10423356 50005.8813 43962.1261 RR LL HNCO
# 13
8192 LSRK 42620.4173 6.10423356 50005.8813 42645.4203 RR LL H15NCO
# 14
8192 LSRK 41569.9768 6.10423356 50005.8813 41594.9797 RR LL HNC18O
# 15
8192 LSRK 43397.8198 6.10423356 50005.8813 43422.8227 RR LL SiO
# Scans: 21-24
# Scans: 25-28
Setup 1 HC3N et al
Setup 2 SiO et al
casapath=os.environ[’AIPSPATH’]
#ASAP script
# COMMENTS
#-------------------------------------- ----------------------------------------------import asap as sd
#import ASAP package into CASA
#Orion-S (SiO line reduction only)
#Notes:
#scan numbers (zero-based) as compared to GBTIDL
os.environ[’AIPSPATH’]=casapath
#changes made to get to OrionS_rawACSmod
#modifications to label sig/ref positions
#set this environment variable back - ASAP changes it
s=sd.scantable(’OrionS_rawACSmod’,False)#load the data without averaging
APPENDIX A. APPENDIX: SINGLE DISH DATA PROCESSING
357
Figure A.3: Multi-panel display of the scantable. There are two plots per scan indicating the psr
(reference position data) and the ps (source data).
s.summary()
s.set_fluxunit(’K’)
scal=sd.calps(s,[20,21,22,23])
#summary info
# make ’K’ default unit
# Calibrate HC3N scans
scal.recalc_azel()
# recalculate az/el to
scal.opacity(0.09)
# do opacity correction
sel=sd.selector()
# Prepare a selection
sel.set_ifs(0)
# select HC3N IF
scal.set_selection(sel)
# get this IF
stave=sd.average_time(scal,weight=’tintsys’)
# average in time
spave=stave.average_pol(weight=’tsys’) # average polarizations;Tsys-weighted (1/Tsys**2) average
sd.plotter.plot(spave)
# plot
spave.smooth(’boxcar’,5)
spave.auto_poly_baseline(order=2)
sd.plotter.plot(spave)
# boxcar 5
# baseline fit order=2
# plot
spave.set_unit(’GHz’)
sd.plotter.plot(spave)
sd.plotter.set_histogram(hist=True)
# draw spectrum using histogram
sd.plotter.axhline(color=’r’,linewidth=2) # zline
sd.plotter.save(’orions_hc3n_reduced.eps’)# save postscript spectrum
APPENDIX A. APPENDIX: SINGLE DISH DATA PROCESSING
358
Figure A.4: Two panel plot of the calibrated spectra. The GBT data has a separate scan for the
SOURCE and REFERENCE positions so scans 20,21,22 and 23 result in these two spectra.
Figure A.5: Calibrated spectrum with a line at zero (using histograms).
APPENDIX A. APPENDIX: SINGLE DISH DATA PROCESSING
359
spave.set_unit(’channel’)
rmsmask=spave.create_mask([5000,7000]) # get rms of line free regions
rms=spave.stats(stat=’rms’,mask=rmsmask)# rms
#---------------------------------------------#Scan[0] (OrionS_ps) Time[2006/01/19/01:52:05]:
# IF[0] = 0.048
#---------------------------------------------# LINE
linemask=spave.create_mask([3900,4200])
max=spave.stats(’max’,linemask)
# IF[0] = 0.918
sum=spave.stats(’sum’,linemask)
# IF[0] = 64.994
median=spave.stats(’median’,linemask)
# IF[0] = 0.091
mean=spave.stats(’mean’,linemask)
# IF[0] = 0.210
spave.set_unit(’channel’)
sd.plotter.plot(spave)
f=sd.fitter()
msk=spave.create_mask([3928,4255])
f.set_function(gauss=1)
f.set_scan(spave,msk)
f.fit()
f.plot(residual=True)
# Fitting
# set units to channel
# plot spectrum
#
#
#
#
#
create region around line
set a single gaussian component
set the data and region for the fitter
fit
plot residual
f.get_parameters()
# retrieve fit parameters
#
0: peak = 0.786 K , centre = 4091.236 channel, FWHM = 70.586 channel
#
area = 59.473 K channel
f.store_fit(’orions_hc3n_fit.txt’)
# store fit
# Save the spectrum
spave.save(’orions_hc3n_reduced’,’ASCII’,True) # save the spectrum
A.4
Single Dish Imaging
Single dish imaging is supported within CASA using standard tasks and tools. The data must be
in the Measurement Set format. Once there, you can use the im (imager) tool to create images:
Tool example:
scans.save(’outputms’,’MS2’)
# Save your data from ASAP into an MS
im.open(’outputms’)
im.selectvis(nchan=901,start=30,step=1,
spwid=0,field=0)
dir=’J2000 17:18:29 +59.31.23’
im.defineimage(nx=150,cellx=’1.5arcmin’,
#
#
#
#
#
open the data set
choose a subset of the data
(just the key emission channels)
set map center
define image parameters
APPENDIX A. APPENDIX: SINGLE DISH DATA PROCESSING
phasecenter=dir,mode=’channel’,start=30,
nchan=901,step=1)
im.setoptions(ftmachine=’sd’,cache=1000000000)
im.setsdoptions(convsupport=4)
im.makeimage(type=’singledish’,
image=’FLS3a_HI.image’)
A.4.1
360
# (note it assumes symmetry if ny,celly
# aren’t specified)
#
#
#
#
#
choose SD gridding
use this many pixels to support the
gridding function used
(default=prolate spheroidal wave function)
make the image
Single Dish Imaging Use Case With ASAP Toolkit
Again, the data summary and then the script is given below.
#
#
#
#
#
#
#
#
#
#
#
#
#
#
#
#
#
#
#
#
#
#
#
Project: AGBT02A_007_01
Observation: GBT(1 antennas)
Telescope
GBT
GBT
GBT
Observation Date
[
[
[
Observer
Project
4.57539e+09, 4.5754e+09]Lockman
4.57574e+09, 4.57575e+09]Lockman
4.5831e+09, 4.58313e+09]Lockman
AGBT02A_007_01
AGBT02A_007_02
AGBT02A_031_12
Thu Feb 1 23:15:15 2007
NORMAL ms::summary:
Data records: 76860
Total integration time = 7.74277e+06 seconds
Observed from
22:05:41
to
12:51:56
Thu Feb 1 23:15:15 2007
NORMAL ms::summary:
Fields: 2
ID
Name
Right Ascension Declination
0
FLS3a
17:18:00.00
+59.30.00.00
1
FLS3b
17:18:00.00
+59.30.00.00
Epoch
J2000
J2000
Thu Feb 1 23:15:15 2007
NORMAL ms::summary:
Spectral Windows: (2 unique spectral windows and 1 unique polarization setups)
SpwID #Chans Frame Ch1(MHz)
Resoln(kHz) TotBW(kHz) Ref(MHz)
Corrs
0
1024 LSRK 1421.89269 2.44140625 2500
1420.64269 XX YY
1
1024 LSRK 1419.39269 2.44140625 2500
1418.14269 XX YY
# FLS3 data calibration
# this is calibration part of FLS3 data
#
casapath=os.environ[’AIPSPATH’]
import asap as sd
os.environ[’AIPSPATH’]=casapath
print ’--Import--’
s=sd.scantable(’FLS3_all_newcal_SP’,false)
# read in MeasurementSet
APPENDIX A. APPENDIX: SINGLE DISH DATA PROCESSING
361
print ’--Split--’
# splitting the data for each field
s0=s.get_scan(’FLS3a*’)
s0.save(’FLS3a_HI.asap’)
del s0
print ’--Calibrate--’
s=sd.scantable(’FLS3a_HI.asap’)
s.set_fluxunit(’K’)
scanns = s.getscannos()
sn=list(scanns)
print "No. scans to be processed:", len(scanns)
res=sd.calfs(s,sn)
print ’--Save calibrated data--’
res.save(’FLS3a_calfs’, ’MS2’)
# split the data for the field of interest
# save this scantable to disk (asap format)
# free up memory from scantable
#
#
#
#
read in scantable from disk (FLS3a)
set the brightness units to Kelvin
get a list of scan numbers
convert it to a list
# calibrate all scans listed using frequency
# switched calibration method
# Save the dataset as a MeasurementSet
print ’--Image data--’
im.open(’FLS3a_calfs’)
im.selectvis(nchan=901,start=30,step=1,
spwid=0,field=0)
dir=’J2000 17:18:29 +59.31.23’
im.defineimage(nx=150,cellx=’1.5arcmin’,
phasecenter=dir,mode=’channel’,start=30,
nchan=901,step=1)
im.setoptions(ftmachine=’sd’,cache=1000000000)
im.setsdoptions(convsupport=4)
#
#
#
#
#
#
#
open the data set
choose a subset of the data
(just the key emission channels)
set map center
define image parameters
(note it assumes symmetry if ny,celly
aren’t specified)
# choose SD gridding
# use this many pixels to support the
# gridding function used
# (default=prolate spheroidal wave function)
im.makeimage(type=’singledish’,image=’FLS3a_HI.image’) # make the image
APPENDIX A. APPENDIX: SINGLE DISH DATA PROCESSING
362
Figure A.6: FLS3a HI emission. The display illustrates the visualization of the data cube (left) and
the profile display of the cube at the cursor location (right); the Tools menu of the Viewer Display
Panel has a Spectral Profile button which brings up this display. By default, it grabs the left-mouse
button. Pressing down the button and moving in the display will show the profile variations.
A.5
Known Issues, Problems, Deficiencies and Features
The Single-Dish calibration and analysis package within CASA is still very much under development. Not surprisingly, there are a number of issues with ASAP and the SDtasks that are known
and are under repair. Some of these are non-obvious ”features” of the way ASAP or sd is implemented, or limitations of the current Python tasking environment. Some are functions that have
yet to be implemented. These currently include:
1. sd.plotter
Currently you can get hardcopy only after making a viewed plot. Ideally, ASAP should allow
you to choose the device for plotting when you set up the plotter.
Multi-panel plotting is poor. Currently you can only add things (like lines, text, etc.) to the
first panel. Also, sd.plotter.set range() sets the same range for multiple panels, while we
would like it to be able to set the range for each independently, including the default ranges.
The appearance of the plots need to be made a lot better. In principle matplotlib can make
”publication quality” figures, but in practice you have to do a lot of work to make it do that,
and our plots are not good.
The sd.plotter object remembers things throughout the session and thus can easily get confused. For example you have to reset the range sd.plotter.set range() if you have ever
APPENDIX A. APPENDIX: SINGLE DISH DATA PROCESSING
363
set it manually. This is not always the expected behavior but is a consequence of having
sd.plotter be its own object that you feed data and commands to.
There are known bugs if you try to switch between the task-based plotting with sdplot and
the tool-based plotting. the sdplot adds extra control buttons and this is not implemented
in the sd toolkit so no ’spec value’,’statistics’, nor ’Quit’ button for the plotter display with
sd.plotter.plot(). Once ’statistics’ button on sdplot is used and deleted sdplot display
with ’Quit’ button, you can still use mouse buttons to select region to get statistics with the
plotter displayed with sd.plotter.plot(). But spectral values won’t be displayed in such
case. Also, if you try to go back sdplot after using sd.plotter.plot(), you may encounter
an error and the plotter window won’t be displayed. In that case, you can reset the window
state by deleting the plotter window opened by sd.plotter.plot(), with the command,
sd.plotter. plotter.unmap().
Eventually we would like the capability to interactively set things using the plots, like select
frequency ranges, identify lines, start fitting.
2. sd.selector
The selector object only allows one selection of each type. It would be nice to be able to make
a union of selections (without resorting to query) for the set name - note that the others like
scans and IFs work off lists which is fine. Should make set name work off lists of names.
3. sd.scantable
There is no useful inline help on the scantable constructor when you do help sd.scantable,
nor in help sd.
The inline help for scantable.summary claims that there is a verbose parameter, but there is
not. The scantable.verbosesummary asaprc parameter (e.g. in sd.rcParams) does nothing.
GBT data has undefined fluxunit (’’, should be ’K’), incorrect freqframe (’LSRK’, is really
’TOPO’) and reference frequency (set to that of the first IF only).
The sd.scantable.freq align does not yet work correctly.
4. sd general issues
There should be a sdhelp equivalent of toolhelp and tasklist for the sd tools and tasks.
The current output of ASAP is verbose, and is controlled by setting sd.rcParams[’verbose’]=False
(or True). At the least we should make some of the output less cryptic.
Strip off leading and trailing whitespace on string parameters.
5. SDtasks general issues
The SDtasks work off of files saved onto disk in one of the scantable supported formats. It
might be useful to be able to work off of scantables in memory (passing the objects) but this
would require changes to the tasking system. Note that this behavior is consistent throughout
the casapy tasks.
6. sdaverage (and sdcal)
averageall=True is still experimental since test was insufficient because of a lack of test data.
APPENDIX A. APPENDIX: SINGLE DISH DATA PROCESSING
364
7. sdfit
Only way to handle multi-IFs is to set fitmode=’auto’. (linefinder is applied for each spectra
and derives initial guesses) For fitmode=’list’, there are no way to give initial guesses for each
IFs by hand.
8. sdplot
Only handles included JPL line catalog.
Also, see sd.plotter issues above.
Appendix B
Simulation
BETA ALERT: The simulation capabilities are currently under development. What we do have
is mostly at the Toolkit level. We have only a single task almasimmos at the present time. Stay
tuned. For the Beta Release, we include this chapter in the Appendix for the use of telescope
commissioners and software developers.
The capability for simulating observations and datasets
from the EVLA and ALMA are an important use-case for
CASA. This not only allows one to get an idea of the capabilities of these instruments for doing science, but also
provides benchmarks for the performance and utility of the
software for processing “realistic” datasets. To that end,
we are developing the simulator (sm) tool, as well as a
series of simulation tasks.
B.1
Inside the Toolkit:
The simulator methods are in the sm
tool. Many of the other tools are also
helpful when constructing and analyzing simulations.
Simulating ALMA with almasimmos
BETA ALERT: This is an experimental task that is under development. Its functionality and
parameters will be changing, so check the on-line documentation for the latest updates.
The inputs are:
#
almasimmos :: ALMA Mosaic simulation task
Please see the on-line documentation for this task.
project
modelimage
complist
antennalist
direction
nmosx
=
’mysim’
#
name of simulated project
=
’’
#
image name to derive simulate visibilities
=
’’
#
componentlist table to derive simulated visibilities
=
’’
#
antenna position ascii file
= ’J2000 19h00m00 -40d00m00’ #
mosaic center direction
=
1
#
number of pointings along x
365
APPENDIX B. APPENDIX: SIMULATION
nmosy
pointingspacing
refdate
totaltime
integration
mode
alg
niter
nchan
startfreq
chanwidth
imsize
cell
stokes
weighting
display
366
=
1
#
number of pointings along y
= ’5arcmin’
#
spacing in between beams
= ’2012/05/21/22:05:00’
#
center time/date of simulated observation
=
’7200s’
#
total time of observation
=
’10s’
#
integration (sampling) time
= ’channel’
#
type of selection: channel, continuum
=
’clark’
#
deconvolution algorithm: clark,hogbom,multiscale
=
500
#
number iterations
=
1
#
number of channels to select
=
’89GHz’
#
nrequency of first channel
=
’10MHz’
#
channel width
= [250, 250]
#
Image pixel size (x,y)
= ’10arcsec’
#
Cell size e.g., 10arcsec
=
’I’
#
Stokes parameters to image
= ’natural’
#
Weighting of visibilities
=
True
#
Plot simulation result images,figures
This task takes an input model image or list of components, plus a list of antennas (locations and
sizes), and simulates a particular observation (specifies by mosaic setup and observing cycles and
times). This is currently very simplistic. For example, it does not include noise by default, or gain
errors (but see the on-line wiki documentation for how to do these). The output is a MS suitable
for further processing in CASA.
Its name implies that it is for ALMA, but it is mostly general as you can give it any antenna
setup — it does have the ALMA observatory location hardwired in and sets the telescope name to
’ALMA’’ but thats about it. The task could be easily modified for other instruments.
BETA ALERT: Because of the experimental nature of this task, we do not provide extensive
documentation in this cookbook. For this purpose, there is an on-line “wiki” devoted to this task:
https://wikio.nrao.edu/bin/view/ALMA/SimulatorCookbook
Here you can find what documentation we do have, along with example files that are needed to
specify antenna locations, and a FAQ.
Appendix C
Obtaining and Installing CASA
C.1
Installation Script
Currently you must be able to log into your system as the root user or an administrator user to
install CASA.
The easiest way to install CASA on a RedHat Enterprise Linux (or compatible) system is to use
our installation script, load-casapy. This script will ftp the CASA RPMs and install them. To use
it, first use the link above to download it to your hard disk. Next, make sure execute permission is
set for the file.
Install CASA into /usr by logging in as root and running:
load-casapy –root
This option will install CASA into /usr, but it can only be run by the root user.
Alternatively, you can visit our FTP server, download the rpms, and install them by hand. Note:
you must be root/administrater to install CASA in this manner.
See the following for more details:
https://wikio.nrao.edu/bin/view/Software/ObtainingCASA
C.2
Startup
This section assumes that CASA has been installed on your LINUX or OSX system. For NRAOAOC testers, you should do the following on an AOC RHE4 machine:
> . /home/casa/casainit.sh
or
> source /home/casa/casainit.csh
367
Appendix D
Python and CASA
CASA uses Python, IPython and matplotlib within the package. IPython is an enhanced, interactive shell to Python which provides many features for efficient command line interaction, while
matplotlib is a Python 2-D plotting library for publication quality figures in different hardcopy
formats.
From www.python.org: ”Python is an interpreted, interactive, object-oriented programming language”. Python is used as the underlying command line interface/scripting language to CASA.
Thus, CASA inherits the features and the annoyances of Python. For example, since Python is
inherently 0-based in its indexing of arrays, vectors, etc, CASA is also 0-based; any Index inputs
(e.g., start (for start channel), fieldIndex, antennaID, etc) will start with 0. Another example is
that indenting of lines means something to Python, of which users will have to be aware.
Some key links are:
• http://python.org – Main Python page
• http://python.org/doc/2.4.2/ref/ref.html – Python Reference
• http://python.org/doc/2.4.2/tut/tut.html – Python Tutorial
• http://ipython.scipy.org – IPython page
• http://matplotlib.sourceforge.net – matplotlib page
Each of the features of these components behave in the standard way within CASA . In the following
sections, we outline the key elements for analysis interactions; see the Python references and the
IPython page for the full suite of functionality.
D.1
Automatic parentheses
Automatic parenthesis is enabled for calling functions with argument lists; this feature is intended
to allow less typing for common situations. IPython will display the interpretation of the line,
368
APPENDIX D. APPENDIX: PYTHON AND CASA
369
beneath the one typed, as indicated by the ’-------->’. Default behavior in CASA is to have
automatic parenthesis enabled.
D.2
Indentation
Python pays attention to indentation of lines in scripts or when you enter them interactively. It
uses indentation to determine the level of nesting in loops. Be careful when cutting and pasting,
if you get the wrong indentation, then unpredictable things can happen (usually it just gives an
error).
A blank line can be used to return the indentation to a previous level. For example, expanded parameters in tasks cause indentation in subsequent lines in the interface. For example, the following
snippet of inputs from clean can be cut and pasted without error due to the blank line after the
indented parameters:
mode
nchan
start
step
width
alg
=
=
=
=
=
’channel’
-1
0
1
1
#
#
#
#
#
Type of selection
Number of channels to select
Start channel
Increment between channels/velocity
Channel width
=
’clark’
#
Algorithm to use
If the blank line were not there, an error would result if you pasted this at the casapy prompt.
D.3
Lists and Ranges
Sometimes, you need to give a task a list of indices. For example, some tasks and tools expect a
comma-separated Python list, e.g.
scanlist = [241, 242, 243, 244, 245, 246]
You can use the Python range function to generate a list of consecutive numbers, e.g.
scanlist = range(241,247)
giving the same list as above, e.g.
CASA <1>: scanlist=range(241,247)
CASA <2>: print scanlist
[241, 242, 243, 244, 245, 246]
Note that range starts from the first limit and goes to one below the second limit (Python is
0-based, and range is designed to work in loop functions). If only a single limit is given, the first
limit is treated as 0, and the one given is used as the second, e.g.
APPENDIX D. APPENDIX: PYTHON AND CASA
370
CASA <3>: iflist=range(4)
CASA <4>: print iflist
[0, 1, 2, 3]
You can also combine multiple ranges by summing lists
CASA <5>: scanlist=range(241,247) + range(251,255)
CASA <6>: print scanlist
[241, 242, 243, 244, 245, 246, 251, 252, 253, 254]
D.4
Dictionaries
Python dictionaries are data structures that contain key:value pairs, sort of like a hash array.
These are useful to store mini-databases of things. In CASA, the parameter values are kept in a
dictionary behind the scenes.
To initialize a dictionary, say we call it mydict, for use:
CASA <7>: mydict = {}
To add members:
CASA <8>: mydict[’source’] = ’0137+331’
CASA <9>: mydict[’flux’] = 5.4
To see its contents:
CASA <10>:
Out[10]:
CASA <11>:
{’source’:
mydict
{’flux’: 5.4000000000000004, ’source’: ’0137+331’}
print mydict
’0137+331’, ’flux’: 5.4000000000000004}
To access a specific entry:
CASA <12>: print mydict[’flux’]
5.4
D.4.1
Saving and Reading Dictionaries
To save a simple dictionary to a file:
CASA
CASA
CASA
CASA
<13>:
<14>:
<15>:
<16>:
dictfile = open(’mydictfile.py’,’w’)
print >>dictfile,"mydict = ",mydict
dictfile.close()
!cat mydictfile.py
APPENDIX D. APPENDIX: PYTHON AND CASA
371
IPython system call: cat mydictfile.py
mydict = {’source’: ’0137+331’, ’flux’: 5.4000000000000004}
CASA <17>:
CASA <18>:
CASA <19>:
Out[19]:
mydict = {}
run mydictfile.py
mydict
{’flux’: 5.4000000000000004, ’source’: ’0137+331’}
More complex dictionaries, like those produced by imstat that contain NumPy arrays, require a
different approach to save. The pickle module lets you save general data structures from Python.
For example:
CASA <20>: import pickle
CASA <21>: xstat
Out[21]:
{’blc’: array([0, 0, 0, 0]),
’blcf’: ’15:24:08.404, +04.31.59.181, I,
’flux’: array([ 4.0795296]),
’max’: array([ 0.05235516]),
’maxpos’: array([134, 134,
0, 38]),
’maxposf’: ’15:21:53.976, +05.05.29.998,
’mean’: array([ 1.60097857e-05]),
’medabsdevmed’: array([ 0.00127436]),
’median’: array([ -1.17422514e-05]),
’min’: array([-0.0104834]),
’minpos’: array([160,
1,
0, 30]),
’minposf’: ’15:21:27.899, +04.32.14.923,
’npts’: array([ 3014656.]),
’quartile’: array([ 0.00254881]),
’rms’: array([ 0.00202226]),
’sigma’: array([ 0.0020222]),
’sum’: array([ 48.26399646]),
’sumsq’: array([ 12.32857318]),
’trc’: array([255, 255,
0, 45]),
’trcf’: ’15:19:52.390, +05.35.44.246, I,
1.41281e+09Hz’,
I, 1.41374e+09Hz’,
I, 1.41354e+09Hz’,
1.41391e+09Hz’}
CASA <22>: mydict
Out[22]: {’flux’: 5.4000000000000004, ’source’: ’0137+331’}
CASA
CASA
CASA
CASA
CASA
CASA
<23>:
<24>:
<25>:
<26>:
<27>:
<28>:
pickfile = ’myxstat.pickle’
f = open(pickfile,’w’)
p = pickle.Pickler(f)
p.dump(xstat)
p.dump(mydict)
f.close()
The dictionaries are now saved in pickle file myxstat.pickle in the current directory.
To retrieve:
CASA <29>: xstat2 = {}
APPENDIX D. APPENDIX: PYTHON AND CASA
CASA <30>: mydict2 = {}
CASA <31>: f = open(pickfile)
CASA <32>: u = pickle.Unpickler(f)
CASA <33>: xstat2 = u.load()
CASA <34>: mydict2 = u.load()
CASA <35>: f.close()
CASA <36>: xstat2
Out[36]:
{’blc’: array([0, 0, 0, 0]),
’blcf’: ’15:24:08.404, +04.31.59.181, I,
’flux’: array([ 4.0795296]),
’max’: array([ 0.05235516]),
’maxpos’: array([134, 134,
0, 38]),
’maxposf’: ’15:21:53.976, +05.05.29.998,
’mean’: array([ 1.60097857e-05]),
’medabsdevmed’: array([ 0.00127436]),
’median’: array([ -1.17422514e-05]),
’min’: array([-0.0104834]),
’minpos’: array([160,
1,
0, 30]),
’minposf’: ’15:21:27.899, +04.32.14.923,
’npts’: array([ 3014656.]),
’quartile’: array([ 0.00254881]),
’rms’: array([ 0.00202226]),
’sigma’: array([ 0.0020222]),
’sum’: array([ 48.26399646]),
’sumsq’: array([ 12.32857318]),
’trc’: array([255, 255,
0, 45]),
’trcf’: ’15:19:52.390, +05.35.44.246, I,
372
1.41281e+09Hz’,
I, 1.41374e+09Hz’,
I, 1.41354e+09Hz’,
1.41391e+09Hz’}
CASA <37>: mydict2
Out[37]: {’flux’: 5.4000000000000004, ’source’: ’0137+331’}
Thus, you can make scripts that save information and use it later, like for regressions.
Note that these examples use Python file-handling and IO, as well as importing modules such as
pickle. See your friendly Python reference for more on this kind of stuff. Its fairly obvious how it
works.
D.5
Control Flow: Conditionals, Loops, and Exceptions
There are a number of ways to control the flow of execution in Python, including conditionals (if),
loops (for and while), and exceptions (try). We will discuss the first two below.
D.5.1
Conditionals
The standard if block handles conditional execution or branches in Python:
APPENDIX D. APPENDIX: PYTHON AND CASA
373
if <expression>:
<statements>
elif <expression>:
<statements>
elif <expression>:
<statements>
...
else:
<statements>
Insert a pass statement if you want no action to be taken for a particular clause. The <expression>
should reduce down to True or False.
For example,
if ( importmode == ’vla’ ):
# Import the data from VLA Export to MS
default(’importvla’)
print "Use importvla to read VLA Export and make an MS"
archivefiles = datafile
vis = msfile
bandname = exportband
autocorr = False
antnamescheme = ’new’
project = exportproject
importvla()
elif ( importmode == ’fits’ ):
# Import the data from VLA Export to MS
default(’importuvfits’)
print "Use importuvfits to read UVFITS and make an MS"
fitsfile = datafile
vis = msfile
async = False
importuvfits()
else:
# Copy from msfile
print "Copying "+datafile+" to "+msfile
os.system(’cp -r ’+datafile+’ ’+msfile)
vis = msfile
chooses branches based on the value of the importmode Python variable (set previously in script).
APPENDIX D. APPENDIX: PYTHON AND CASA
D.5.2
374
Loops
The for loop
for iter in seq:
<statements>
iterates over elements of a sequence seq, assigning each in turn to iter. The sequence is usually a
list of values.
For example,
splitms = ’polcal_20080224.cband.all.split.ms’
srclist = [’0137+331’,’2136+006’,’2202+422’,’2253+161’,’0319+415’,’0359+509’]
spwlist = [’0’,’1’]
for src in srclist:
for spwid in spwlist:
imname = splitms + ’.’ + src + ’.’ + spwid + ’.clean’
clean(vis=splitms,field=src,spw=spwid,imagename=imname,
stokes=’IQUV’,psfmode=’hogbom’,imagermode=’csclean’,
imsize=[288,288],cell=[0.4,0.4],niter=1000,
threshold=1.3,mask=[134,134,154,154])
# Done with
spw
# Done with sources
As usual, blocks are closed by blank lines of the previous indentation level.
You can use the range (§ D.3) Python function to generate a numerical loop:
vis = ’polcal_20080224.cband.all.ms’
for i in range(0,6):
fld = str(i)
plotxy(vis,field=fld,xaxis=’uvdist’,yaxis=’amp’)
# Done with fields [0, 1, 2, 3, 4, 5]
There is also a while loop construct
while <expression>:
<statements>
which executes the statement block while the <expression> is True. The while loop can also take
an else block.
For example,
APPENDIX D. APPENDIX: PYTHON AND CASA
375
# Do an explicit set of clean iterations down to a limit
prevrms = 1.e10
while rms > 0.001 :
clean(vis=splitms,field=src,spw=spwid,imagename=imname,
stokes=’IQUV’,psfmode=’hogbom’,imagermode=’csclean’,
imsize=[288,288],cell=[0.4,0.4],niter=200,
threshold=1.3,mask=[134,134,154,154])
offstat=imstat(imname+’.residual’,box=’224,224,284,284’)
rms=offstat[’sigma’][0]
if rms > prevrms:
break
# the rms has increased, stop
prevrms = rms
# Clean until the off-source rms residual, reaches 0.001 Jy
Note that you can exit a loop using the break statement, as we have here when the rms increases.
D.6
System shell access
For scripts, the os.system methods are the preferred way to access system shell commands (see
§ D.6.1).
In interactive mode, any input line beginning with a ’ !’ character is passed verbatim (minus the ’ !’)
to the underlying operating system. Several common commands (ls, pwd, less) may be executed
with or without the ’!’. Note that the cd command must be executed without the ’!’, and the
cp command must use ’!’ as there is a conflict with the cp tool in casapy.
For example:
CASA [1]: pwd
/export/home/corsair-vml/jmcmulli/data
CASA [2]: ls n*
ngc5921.ms ngc5921.py
CASA [3]: !cp -r ../test.py .
D.6.1
Using the os.system methods
To use this, you need the os package. This should be loaded by default by casapy, but if not you
can use
import os
in your script.
For example, in our scripts we use this to clean up any existing output files
APPENDIX D. APPENDIX: PYTHON AND CASA
376
# The prefix to use for all output files
prefix=’ngc5921.usecase’
# Clean up old files
os.system(’rm -rf ’+prefix+’*’)
Note that the os package has many useful methods. You can see these by using tab-completion:
CASA <2>: os.<tab>
Display all 223 possibilities? (y or n)
os.EX_CANTCREAT
os.X_OK
os.EX_CONFIG
os._Environ
os.EX_DATAERR
os.__all__
os.EX_IOERR
os.__class__
os.EX_NOHOST
os.__delattr__
os.EX_NOINPUT
os.__dict__
os.EX_NOPERM
os.__doc__
os.EX_NOUSER
os.__file__
os.EX_OK
os.__getattribute__
os.EX_OSERR
os.__hash__
os.EX_OSFILE
os.__init__
os.EX_PROTOCOL
os.__name__
os.EX_SOFTWARE
os.__new__
os.EX_TEMPFAIL
os.__reduce__
os.EX_UNAVAILABLE
os.__reduce_ex__
os.EX_USAGE
os.__repr__
os.F_OK
os.__setattr__
os.NGROUPS_MAX
os.__str__
os.O_APPEND
os._copy_reg
os.O_CREAT
os._execvpe
os.O_DIRECT
os._exists
os.O_DIRECTORY
os._exit
os.O_DSYNC
os._get_exports_list
os.O_EXCL
os._make_stat_result
os.O_LARGEFILE
os._make_statvfs_result
os.O_NDELAY
os._pickle_stat_result
os.O_NOCTTY
os._pickle_statvfs_result
os.O_NOFOLLOW
os._spawnvef
os.O_NONBLOCK
os.abort
os.O_RDONLY
os.access
os.O_RDWR
os.altsep
os.O_RSYNC
os.chdir
os.O_SYNC
os.chmod
os.O_TRUNC
os.chown
os.O_WRONLY
os.chroot
os.P_NOWAIT
os.close
os.P_NOWAITO
os.confstr
os.P_WAIT
os.confstr_names
os.R_OK
os.ctermid
os.SEEK_CUR
os.curdir
os.SEEK_END
os.defpath
os.fdatasync
os.fdopen
os.fork
os.forkpty
os.fpathconf
os.fstat
os.fstatvfs
os.fsync
os.ftruncate
os.getcwd
os.getcwdu
os.getegid
os.getenv
os.geteuid
os.getgid
os.getgroups
os.getloadavg
os.getlogin
os.getpgid
os.getpgrp
os.getpid
os.getppid
os.getsid
os.getuid
os.isatty
os.kill
os.killpg
os.lchown
os.linesep
os.link
os.listdir
os.lseek
os.lstat
os.major
os.makedev
os.makedirs
os.minor
os.mkdir
os.mkfifo
os.mknod
os.name
os.readlink
os.remove
os.removedirs
os.rename
os.renames
os.rmdir
os.sep
os.setegid
os.seteuid
os.setgid
os.setgroups
os.setpgid
os.setpgrp
os.setregid
os.setreuid
os.setsid
os.setuid
os.spawnl
os.spawnle
os.spawnlp
os.spawnlpe
os.spawnv
os.spawnve
os.spawnvp
os.spawnvpe
os.stat
os.stat_float_times
os.stat_result
os.statvfs
os.statvfs_result
os.strerror
os.symlink
os.sys
os.sysconf
os.sysconf_names
os.system
os.tcgetpgrp
os.tcsetpgrp
os.tempnam
os.times
os.tmpfile
APPENDIX D. APPENDIX: PYTHON AND CASA
os.SEEK_SET
os.TMP_MAX
os.UserDict
os.WCONTINUED
os.WCOREDUMP
os.WEXITSTATUS
os.WIFCONTINUED
os.WIFEXITED
os.WIFSIGNALED
os.WIFSTOPPED
os.WNOHANG
os.WSTOPSIG
os.WTERMSIG
os.WUNTRACED
os.W_OK
D.6.2
os.devnull
os.dup
os.dup2
os.environ
os.error
os.execl
os.execle
os.execlp
os.execlpe
os.execv
os.execve
os.execvp
os.execvpe
os.extsep
os.fchdir
377
os.nice
os.open
os.openpty
os.pardir
os.path
os.pathconf
os.pathconf_names
os.pathsep
os.pipe
os.popen
os.popen2
os.popen3
os.popen4
os.putenv
os.read
os.tmpnam
os.ttyname
os.umask
os.uname
os.unlink
os.unsetenv
os.urandom
os.utime
os.wait
os.wait3
os.wait4
os.waitpid
os.walk
os.write
Directory Navigation
In addition, filesystem navigation is aided through the use of bookmarks to simplify access to
frequently-used directories:
CASA [4]: cd /home/ballista/jmcmulli/other_data
CASA [4]: pwd
/home/ballista/jmcmulli/other_data
CASA [5]: bookmark other_data
CASA [6]: cd /export/home/corsair-vml/jmcmulli/data
CASA [7]: pwd
/export/home/corsair-vml/jmcmulli/data
CASA [8]: cd -b other_data
(bookmark:data) -> /home/ballista/jmcmulli/other_data
D.6.3
Shell Command and Capture
See also § D.8 for the use of the command history.
1. sx shell command, !!shell command - this captures the output to a list
CASA [1]: sx pwd # stores output of ’pwd’ in a list
Out[1]: [’/home/basho3/jmcmulli/pretest’]
CASA [2]: !!pwd # !! is a shortcut for ’sx’
Out[2]: [’/home/basho3/jmcmulli/pretest’]
CASA [3]: sx ls v* # stores output of ’pwd’ in a list
Out[3]:
[’vla_calplot.jpg’,
’vla_calplot.png’,
’vla_msplot_cals.jpg’,
APPENDIX D. APPENDIX: PYTHON AND CASA
’vla_msplot_cals.png’,
’vla_plotcal_bpass.jpg’,
’vla_plotcal_bpass.png’,
’vla_plotcal_fcal.jpg’,
’vla_plotcal_fcal.png’,
’vla_plotvis.jpg’,
’vla_plotvis.png’]
CASA [4]: x=_ # remember ’_’ is a shortcut for the output from the last command
CASA [5]: x
Out[5]:
[’vla_calplot.jpg’,
’vla_calplot.png’,
’vla_msplot_cals.jpg’,
’vla_msplot_cals.png’,
’vla_plotcal_bpass.jpg’,
’vla_plotcal_bpass.png’, ’vla_plotcal_fcal.jpg’,
’vla_plotcal_fcal.png’,
’vla_plotvis.jpg’,
’vla_plotvis.png’]
CASA [6]: y=Out[2] # or just refer to the enumerated output
CASA [7]: y
Out[7]: [’/home/basho3/jmcmulli/pretest’]
2. sc - captures the output to a variable; options are ’-l’ and ’-v’
CASA [1]: sc x=pwd # capture output from ’pwd’ to the variable ’x’
CASA [2]: x
Out[2]: ’/home/basho3/jmcmulli/pretest’
CASA [3]: sc -l x=pwd # capture the output from ’pwd’ to the variable ’x’ but
# split newlines into a list (similar to sx command)
CASA [4]: x
Out[4]: [’/home/basho3/jmcmulli/pretest’]
CASA [5]: sc -v x=pwd # capture output from ’pwd’ to a variable ’x’ and
# show what you get (verbose mode)
x ==
’/home/basho3/jmcmulli/pretest’
CASA [6]: x
Out[6]: ’/home/basho3/jmcmulli/pretest’
378
APPENDIX D. APPENDIX: PYTHON AND CASA
D.7
379
Logging
There are two components to logging within CASA. Logging of all command line inputs is done
via IPython.
Upon startup, CASA will log all commands to a file called ipython.log. This file can be changed
via the use of the ipythonrc file. This log file can be edited and re-executed as appropriate using
the execfile feature (§ D.11).
The following line sets up the logging for CASA . There are four options following the specification
of the logging file: 1) append, 2) rotate (each session of CASA will create a new log file with
a counter incrementing ipython.log.1, ipython.log.2 etc, 3) over (overwrite existing file), and 4)
backup (renames existing log file to log name).
logfile ./ipython.log append
The command logstate will provide details on the current logging setup:
CASA [12]: logstate
File:
Mode:
State:
ipython.log
append
active
Logging can be turned on and off using the logon, logoff commands.
The second component is the output from applications which is directed to the file ./casapy.log.
See § 1.4.2 for more on the casalogger.
D.8
History and Searching
Numbered input/output history is provided natively within IPython. Command history is also
maintained on-line.
CASA [11]: x=1
CASA [12]: y=3*x
CASA [13]: z=x**2+y**2
CASA [14]: x
Out[14]: 1
CASA [15]: y
Out[15]: 3
APPENDIX D. APPENDIX: PYTHON AND CASA
380
CASA [16]: z
Out[16]: 10
CASA [17]: Out[14]
Out[17]: 1
# Note: The ’Out’ vector contains command output
CASA [18]: _15
Out[18]: 3
# Note: The return value can be accessed by _number
CASA [19]: ___
Out[19]: 10
# Note: The last three return values can be accessed as:
#
_, __, ___
Command history can be accessed via the ’hist’ command. The history is reset at the beginning
of every CASA session, that is, typing ’hist’ when you first start CASA will not provide any
commands from the previous session. However, all of the commands are still available at the
command line and can be accessed through the up or down arrow keys, and through searching.
CASA [22]: hist
1 : __IP.system("vi temp.py") # Note:shell commands are designated in this way
2 : ipmagic("run -i temp.py") # Note:magic commands are designated in this way
3 : ipmagic("hist ")
4 : more temp.py
5 : __IP.system("more temp.py")
6 : quickhelp()
# Note: autoparenthesis are added in the history
7 : im.open(’ngc5921.ms’)
8 : im.summary()
9 : ipmagic("pdoc im.setdata")
10: im.close()
11: quickhelp()
12: ipmagic("logstate ")
13: x=1
14: y=3*x
15: z=x**2+y**2
16: x
17: y
18: z
19: Out[16]
20: _17
21: ___
The history can be saved as a script or used as a macro for further use:
CASA [24]: save script.py 13:16
File ‘script.py‘ exists. Overwrite (y/[N])? y
The following commands were written to file ‘script.py‘:
x=1
y=3*x
z=x**2+y**2
APPENDIX D. APPENDIX: PYTHON AND CASA
381
CASA [25]: !more script.py
x=1
y=3*x
z=x**2+y**2
Note that the history commands will be saved up to, but not including the last value (i.e., history
commands 13-16 saves commands 13, 14, and 15).
There are two mechanisms for searching command history:
1. Previous/Next: use Ctrl-p (previous,up) and Ctrl-n (next,down) to search through only
the history items that match what you have typed so far (min-match completion). If you use
Ctrl-p or Ctrl-n at a blank prompt, they behave just like the normal arrow keys.
2. Search: Ctrl-r opens a search prompt. Begin typing and the system searches your history
for lines that contain what you’ve typed so far, completing what it can. For example:
CASA [37]: <Cntl-r>
(reverse-i-search)‘’:
Typing anything after the colon will provide you with the last command matching the characters, for example, typing ’op’ finds:
(reverse-i-search)‘op’: im.open(’ngc5921.ms’)
Subsequent hitting of Ctrl-r will search for the next command matching the characters.
D.9
Macros
Macros can be made for easy re-execution of previous commands. For example to store the commands 13-15 to the macro ’example’:
CASA [31]: macro example 13:16
Macro ‘example‘ created. To execute, type its name (without quotes).
Macro contents:
x=1
y=3*x
z=x**2+y**2
CASA [32]: z
Out[32]: 6
CASA [33]: z=10
CASA [34]: example
Out[34]: Executing Macro...
APPENDIX D. APPENDIX: PYTHON AND CASA
382
CASA [35]: z
Out[35]: 6
CASA [36]:
D.10
On-line editing
You can edit files on-line in two ways:
1. Using the shell access via ’ !vi’
2. Using the ed function; this will edit the file but upon closing, it will try to execute the file;
using the ’script.py’ example above:
CASA [13]: ed script.py # this will bring up the file in your chosen editor
# when you are finished editing the file,
# it will automatically
# execute it (as though you had done a
# execfile ’script.py’
Editing... done. Executing edited code...
CASA [14]: x
Out[14]: 1
CASA [15]: y
Out[15]: 3
CASA [16]: z
Out[16]: 6
D.11
Executing Python scripts
Python scripts are simple text files containing lists of commands as if typed at the keyboard. Note:
the auto-parentheses feature of IPython can not be used in scripts, that is, you should make sure
all function calls have any opening and closing parentheses.
# file is script.py
# My script to plot the observed visibilities
plotxy(’ngc5921.ms’,’uvdist’) #yaxis defaults to amplitude
This can be done by using the execfile command to execute this script. execfile will execute the
script as though you had typed the lines at the CASA prompt.
CASA [5]: execfile ’script.py’
--------> execfile(’script.py’)
APPENDIX D. APPENDIX: PYTHON AND CASA
D.12
383
How do I exit from CASA?
You can exit CASA by using the quit command. This will bring up the query
Do you really want to exit ([y]/n)?
to give you a chance in case you did not mean to exit. You can also quit using %exit or CTRL-D.
If you don’t want to see the question "Do you really want to exit [y]/n?", then just type
Exit or exit followed by return, and CASA will stop right then and there.
Appendix E
The Measurement Equation and
Calibration
The visibilities measured by an interferometer must be calibrated before formation of an image.
This is because the wavefronts received and processed by the observational hardware have been
corrupted by a variety of effects. These include (but are not exclusive to): the effects of transmission
through the atmosphere, the imperfect details amplified electronic (digital) signal and transmission
through the signal processing system, and the effects of formation of the cross-power spectra by
a correlator. Calibration is the process of reversing these effects to arrive at corrected visibilities
which resemble as closely as possible the visibilities that would have been measured in vacuum by
a perfect system. The subject of this chapter is the determination of these effects by using the
visibility data itself.
E.1
The HBS Measurement Equation
The relationship between the observed and ideal (desired) visibilities on the baseline between antennas i and j may be expressed by the Hamaker-Bregman-Sault Measurement Equation1 :
~ij = Jij V
~ IDEAL
V
ij
~ij represents the observed visibility, V
~ IDEAL represents the corresponding ideal visibilities,
where V
ij
and Jij represents the accumulation of all corruptions affecting baseline ij. The visibilities are
indicated as vectors spanning the four correlation combinations which can be formed from dualpolarization signals. These four correlations are related directly to the Stokes parameters which
fully describe the radiation. The Jij term is therefore a 4×4 matrix.
Most of the effects contained in Jij (indeed, the most important of them) are antenna-based, i.e.,
they arise from measurable physical properties of (or above) individual antenna elements in a
synthesis array. Thus, adequate calibration of an array of Nant antennas forming Nant (Nant − 1)/2
baseline visibilities is usually achieved through the determination of only Nant factors, such that
1
Hamaker, J.P., Bregman, J.D. & Sault, R.J. (1996), Astronomy and Astrophysics Supplement, v.117, p.137-147
384
APPENDIX E. APPENDIX: THE MEASUREMENT EQUATION AND CALIBRATION
385
Jij = Ji ⊗ Jj∗ . For the rest of this chapter, we will usually assume that Jij is factorable in this way,
unless otherwise noted.
As implied above, Jij may also be factored into the sequence of specific corrupting effects, each having their own particular (relative) importance and physical origin, which determines their unique
algebra. Including the most commonly considered effects, the Measurement Equation can be written:
~ij = Mij Bij Gij Dij Eij Pij Tij V
~ IDEAL
V
ij
where:
• Tij = Polarization-independent multiplicative effects introduced by the troposphere, such
as opacity and path-length variation.
• Pij = Parallactic angle, which describes the orientation of the polarization coordinates on
the plane of the sky. This term varies according to the type of the antenna mount.
• Eij = Effects introduced by properties of the optical components of the telescopes, such as
the collecting area’s dependence on elevation.
• Dij = Instrumental polarization response. ”D-terms” describe the polarization leakage
between feeds (e.g. how much the R-polarized feed picked up L-polarized emission, and vice
versa).
• Gij = Electronic gain response due to components in the signal path between the feed
and the correlator. This complex gain term Gij includes the scale factor for absolute flux
density calibration, and may include phase and amplitude corrections due to changes in the
atmosphere (in lieu of Tij ). These gains are polarization-dependent.
• Bij = Bandpass (frequency-dependent) response, such as that introduced by spectral filters
in the electronic transmission system
• Mij = Baseline-based correlator (non-closing) errors. By definition, these are not factorable
into antenna-based parts.
Note that the terms are listed in the order in which they affect the incoming wavefront (G and B
represent an arbitrary sequence of such terms depending upon the details of the particular electronic
system). Note that M differs from all of the rest in that it is not antenna-based, and thus not
factorable into terms for each antenna.
As written above, the measurement equation is very general; not all observations will require
treatment of all effects, depending upon the desired dynamic range. E.g., bandpass need only be
considered for continuum observations if observed in a channelized mode and very high dynamic
range is desired. Similarly, instrumental polarization calibration can usually be omitted when
observing (only) total intensity using circular feeds. Ultimately, however, each of these effects
occurs at some level, and a complete treatment will yield the most accurate calibration. Modern
high-sensitivity instruments such as ALMA and EVLA will likely require a more general calibration
APPENDIX E. APPENDIX: THE MEASUREMENT EQUATION AND CALIBRATION
386
treatment for similar observations with older arrays in order to reach the advertised dynamic ranges
on strong sources.
In practice, it is usually far too difficult to adequately measure most calibration effects absolutely (as
if in the laboratory) for use in calibration. The effects are usually far too changeable. Instead, the
calibration is achieved by making observations of calibrator sources on the appropriate timescales
for the relevant effects, and solving the measurement equation for them using the fact that we have
Nant (Nant − 1)/2 measurements and only Nant factors to determine (except for M which is only
sparingly used). (Note: By partitioning the calibration factors into a series of consecutive effects,
it might appear that the number of free parameters is some multiple of Nant , but the relative algebra
and timescales of the different effects, as well as the the multiplicity of observed polarizations and
channels compensate, and it can be shown that the problem remains well-determined until, perhaps,
the effects are direction-dependent within the field of view. Limited solvers for such effects are under
study; the calibrater tool currently only handles effects which may be assumed constant within the
field of view. Corrections for the primary beam are handled in the imager tool.) Once determined,
these terms are used to correct the visibilities measured for the scientific target. This procedure is
known as cross-calibration (when only phase is considered, it is called phase-referencing).
The best calibrators are point sources at the phase center (constant visibility amplitude, zero
phase), with sufficient flux density to determine the calibration factors with adequate SNR on the
relevant timescale. The primary gain calibrator must be sufficiently close to the target on the sky so
that its observations sample the same atmospheric effects. A bandpass calibrator usually must be
sufficiently strong (or observed with sufficient duration) to provide adequate per-channel sensitivity
for a useful calibration. In practice, several calibrators are usually observed, each with properties
suitable for one or more of the required calibrations.
Synthesis calibration is inherently a bootstrapping process. First, the dominant calibration term
is determined, and then, using this result, more subtle effects are solved for, until the full set of
required calibration terms is available for application to the target field. The solutions for each
successive term are relative to the previous terms. Occasionally, when the several calibration terms
are not sufficiently orthogonal, it is useful to re-solve for earlier types using the results for later
types, in effect, reducing the effect of the later terms on the solution for earlier ones, and thus better
isolating them. This idea is a generalization of the traditional concept of self-calibration, where
initial imaging of the target source supplies the visibility model for a re-solve of the gain calibration
(G or T ). Iteration tends toward convergence to a statistically optimal image. In general, the
quality of each calibration and of the source model are mutually dependent. In principle, as long
as the solution for any calibration component (or the source model itself) is likely to improve
substantially through the use of new information (provided by other improved solutions), it is
worthwhile to continue this process.
In practice, these concepts motivate certain patterns of calibration for different types of observation,
and the calibrater tool in CASA is designed to accommodate these patterns in a general and
flexible manner. For a spectral line total intensity observation, the pattern is usually:
1. Solve for G on the bandpass calibrator
2. Solve for B on the bandpass calibrator, using G
APPENDIX E. APPENDIX: THE MEASUREMENT EQUATION AND CALIBRATION
387
3. Solve for G on the primary gain (near-target) and flux density calibrators, using B solutions
just obtained
4. Scale G solutions for the primary gain calibrator according to the flux density calibrator
solutions
5. Apply G and B solutions to the target data
6. Image the calibrated target data
If opacity and gain curve information are relevant and available, these types are incorporated in
each of the steps (in future, an actual solve for opacity from appropriate data may be folded into
this process):
1. Solve for G on the bandpass calibrator, using T (opacity) and E (gain curve) solutions already
derived.
2. Solve for B on the bandpass calibrator, using G, T (opacity), and E (gain curve) solutions.
3. Solve for G on primary gain (near-target) and flux density calibrators, using B, T (opacity),
and E (gain curve) solutions.
4. Scale G solutions for the primary gain calibrator according to the flux density calibrator
solutions
5. Apply T (opacity), E (gain curve), G, and B solutions to the target data
6. Image the calibrated target data
For continuum polarimetry, the typical pattern is:
1. Solve for G on the polarization calibrator, using (analytical) P solutions.
2. Solve for D on the polarization calibrator, using P and G solutions.
3. Solve for G on primary gain and flux density calibrators, using P and D solutions.
4. Scale G solutions for the primary gain calibrator according to the flux density calibrator
solutions.
5. Apply P , D, and G solutions to target data.
6. Image the calibrated target data.
For a spectro-polarimetry observation, these two examples would be folded together.
In all cases the calibrator model must be adequate at each solve step. At high dynamic range
and/or high resolution, many calibrators which are nominally assumed to be point sources become
slightly resolved. If this has biased the calibration solutions, the offending calibrator may be imaged
at any point in the process and the resulting model used to improve the calibration. Finally, if
sufficiently strong, the target may be self-calibrated as well.
APPENDIX E. APPENDIX: THE MEASUREMENT EQUATION AND CALIBRATION
E.2
388
General Calibrater Mechanics
The calibrater tasks/tool are designed to solve and apply solutions for all of the solution types
listed above (and more are in the works). This leads to a single basic sequence of execution for all
solves, regardless of type:
1. Set the calibrator model visibilities
2. Select the visibility data which will be used to solve for a calibration type
3. Arrange to apply any already-known calibration types (the first time through, none may yet
be available)
4. Arrange to solve for a specific calibration type, including specification of the solution timescale
and other specifics
5. Execute the solve process
6. Repeat 1-4 for all required types, using each result, as it becomes available, in step 2, and
perhaps repeating for some types to improve the solutions
By itself, this sequence doesn’t guarantee success; the data provided for the solve must have sufficient SNR on the appropriate timescale, and must provide sufficient leverage for the solution (e.g.,
D solutions require data taken over a sufficient range of parallactic angle in order to separate the
source polarization contribution from the instrumental polarization).
Appendix F
Annotated Example Scripts
Note: These data sets are available with the full CASA rpm distribution. Other data sets can be
made available upon request. The scripts are intended to illustrate the types of commands needed
for different types of reduction/astronomical observations.
BETA ALERT: During the Beta Release period, we will be occasionally updating the syntax of
the tasks, which may break older versions of the scripts. You can find the latest versions of these
(and other) scripts at:
http://casa.nrao.edu/Doc/Scripts/
F.1
NGC 5921 — VLA red-shifted HI emission
This script demonstates basic spectral calibration and imaging, but does not include any selfcalibration steps.
The latest version of this script can be found at:
http://casa.nrao.edu/Doc/Scripts/ngc5921_demo.py
##########################################################################
#
#
# Use Case Script for NGC 5921
#
#
#
# Converted by STM 2007-05-26
#
# Updated
STM 2007-06-15 (Alpha Patch 1)
#
# Updated
STM 2007-09-05 (Alpha Patch 2+)
#
# Updated
STM 2007-09-18 (Alpha Patch 2+)
#
# Updated
STM 2007-09-18 (Pre-Beta) add immoments
#
# Updated
STM 2007-10-04 (Beta) update
#
# Updated
STM 2007-10-10 (Beta) add export
#
# Updated
STM 2007-11-08 (Beta Patch 0.5) add RRusk stuff
#
389
APPENDIX F. APPENDIX: ANNOTATED EXAMPLE SCRIPTS
#
#
#
#
#
#
#
#
#
#
#
#
#
#
#
#
#
#
#
#
#
#
#
#
#
#
#
#
#
#
#
#
#
#
#
#
#
#
#
#
#
#
#
#
#
#
#
#
#
#
#
Updated
Updated
Updated
Updated
Updated
Updated
Updated
STM
STM
STM
STM
STM
STM
STM
2008-03-25
2008-05-23
2008-06-11
2008-06-13
2008-06-14
2008-07-06
2009-05-26
(Beta
(Beta
(Beta
(Beta
(Beta
(Beta
(Beta
Patch
Patch
Patch
Patch
Patch
Patch
Patch
1.0)
2.0)
2.0)
2.0)
2.0)
2.0)
4.0)
new tasking/clean/cal
demo version
post-school update
regression version
McMaster demo
Features Tested:
The script illustrates end-to-end processing with CASA
as depicted in the following flow-chart.
Filenames will have the <prefix> = ’ngc5921.demo’
Input Data
Process
NGC5921.fits --> importuvfits
(1.4GHz,
|
63 sp chan,
v
D-array)
listobs
|
v
flagautocorr
|
v
setjy
|
v
bandpass
|
v
gaincal
|
v
fluxscale
|
v
applycal
|
v
split
|
v
split
|
v
exportuvfits
|
v
uvcontsub
|
Output Data
-->
<prefix>.ms
+
<prefix>.ms.flagversions
-->
casapy.log
-->
<prefix>.bcal
-->
<prefix>.gcal
-->
<prefix>.fluxscale
-->
<prefix>.ms
-->
<prefix>.cal.split.ms
-->
<prefix>.src.split.ms
-->
<prefix>.split.uvfits
-->
<prefix>.ms.cont +
<prefix>.ms.contsub
390
#
#
#
#
#
#
#
#
#
#
#
#
#
#
#
#
#
#
#
#
#
#
#
#
#
#
#
#
#
#
#
#
#
#
#
#
#
#
#
#
#
#
#
#
#
#
#
#
#
#
#
APPENDIX F. APPENDIX: ANNOTATED EXAMPLE SCRIPTS
#
v
#
#
clean
--> <prefix>.clean.image +
#
#
|
<prefix>.clean.model +
#
#
|
<prefix>.clean.residual
#
#
v
#
#
exportfits
--> <prefix>.clean.fits
#
#
|
#
#
v
#
#
imhead
--> casapy.log
#
#
|
#
#
v
#
#
imstat
--> xstat (parameter)
#
#
|
#
#
v
#
#
immoments
--> <prefix>.moments.integrated +
#
#
|
<prefix>.moments.weighted_coord #
#
v
#
##########################################################################
print ’Demo Script for NGC5921 VLA HI observation’
print ’Version for Beta Patch 4 (2.4.0) 1-June-2009’
print ’’
import time
import os
scriptmode = True
#
# The prefix to use for all output files
prefix=’ngc5921.demo’
# Set up some useful variables (these will also be set later on)
msfile = prefix + ’.ms’
btable = prefix + ’.bcal’
gtable = prefix + ’.gcal’
ftable = prefix + ’.fluxscale’
splitms = prefix + ’.src.split.ms’
imname = prefix + ’.cleanimg’
#
# Get to path to the CASA home and stip off the name
pathname=os.environ.get(’CASAPATH’).split()[0]
# This is where the NGC5921 UVFITS data will be
fitsdata=pathname+’/data/demo/NGC5921.fits’
#
# Or uncomment the following to use data in current directory
#fitsdata=’NGC5921.fits’
# Clean up old files
# Use rmtables on ms and cal tables to clear cache
# (not working on multiple runs for 2.4.0 release)
391
APPENDIX F. APPENDIX: ANNOTATED EXAMPLE SCRIPTS
#rmtables(msfile)
#rmtables(btable)
#rmtables(gtable)
#rmtables(ftable)
#rmtables(ftable)
#rmtables(splitms+’*’)
#rmtables(imname+’.*’)
#rmtables(prefix+’.moments*’)
# Final clean up of auxiliary files
os.system(’rm -rf ’+prefix+’*’)
#
#=====================================================================
#
# Import the data from FITS to MS
#
print ’--Import--’
# Safest to start from task defaults
default(’importuvfits’)
# Set up the MS filename and save as new global variable
msfile = prefix + ’.ms’
# Use task importuvfits
fitsfile = fitsdata
vis = msfile
saveinputs(’importuvfits’,prefix+’.importuvfits.saved’)
importuvfits()
#
# Note that there will be a ngc5921.demo.ms.flagversions
# there containing the initial flags as backup for the main ms
# flags.
#
#=====================================================================
#
# List a summary of the MS
#
print ’--Listobs--’
# Don’t default this one and make use of the previous setting of
# vis. Remember, the variables are GLOBAL!
# You may wish to see more detailed information, like the scans.
# In this case use the verbose = True option
verbose = True
392
APPENDIX F. APPENDIX: ANNOTATED EXAMPLE SCRIPTS
listobs()
#
#
#
#
#
#
#
#
#
#
#
#
#
#
#
#
#
#
#
#
#
#
#
#
#
#
#
#
#
#
#
#
#
#
#
#
#
#
#
#
#
#
#
#
#
#
#
#
#
You should get in your logger window and in the casapy.log file
something like:
MeasurementSet Name:
MS Version 2
Observer: TEST
Observation: VLA
/home/sandrock2/smyers/Testing2/Sep07/ngc5921.demo.ms
Project:
Data records: 22653
Total integration time = 5280 seconds
Observed from
09:19:00
to
10:47:00
ObservationID = 0
Date
Timerange
13-Apr-1995/09:19:00.0
09:27:30.0
09:33:00.0
09:50:30.0
10:22:00.0
10:26:00.0
10:45:30.0
Fields: 3
ID
Code
0
C
1
A
2
-
ArrayID = 0
Scan
09:24:30.0
1
09:29:30.0
2
09:48:00.0
3
09:51:00.0
4
10:23:00.0
5
10:43:00.0
6
10:47:00.0
7
Name
Right Ascension
1331+30500002_013:31:08.29
1445+09900002_014:45:16.47
N5921_2
15:22:00.00
FldId
0
1
2
1
1
2
1
FieldName
SpwIds
1331+30500002_0 [0]
1445+09900002_0 [0]
N5921_2
[0]
1445+09900002_0 [0]
1445+09900002_0 [0]
N5921_2
[0]
1445+09900002_0 [0]
Declination
Epoch
+30.30.32.96 J2000
+09.58.36.07 J2000
+05.04.00.00 J2000
Spectral Windows: (1 unique spectral windows and 1 unique polarization setups)
SpwID #Chans Frame Ch1(MHz)
Resoln(kHz) TotBW(kHz) Ref(MHz)
Corrs
0
63 LSRK 1412.68608 24.4140625 1550.19688 1413.44902 RR LL
Feeds: 28: printing first row only
Antenna
Spectral Window
# Receptors
1
-1
2
Antennas: 27:
ID
Name Station
0
1
VLA:N7
1
2
VLA:W1
2
3
VLA:W2
3
4
VLA:E1
4
5
VLA:E3
5
6
VLA:E9
6
7
VLA:E6
7
8
VLA:W8
8
9
VLA:N5
9
10
VLA:W3
10
11
VLA:N4
Diam.
25.0 m
25.0 m
25.0 m
25.0 m
25.0 m
25.0 m
25.0 m
25.0 m
25.0 m
25.0 m
25.0 m
Long.
-107.37.07.2
-107.37.05.9
-107.37.07.4
-107.37.05.7
-107.37.02.8
-107.36.45.1
-107.36.55.6
-107.37.21.6
-107.37.06.7
-107.37.08.9
-107.37.06.5
Polarizations
[
R, L]
Lat.
+33.54.12.9
+33.54.00.5
+33.54.00.9
+33.53.59.2
+33.54.00.5
+33.53.53.6
+33.53.57.7
+33.53.53.0
+33.54.08.0
+33.54.00.1
+33.54.06.1
393
APPENDIX F. APPENDIX: ANNOTATED EXAMPLE SCRIPTS
#
11
12
VLA:W5
25.0 m
-107.37.13.0 +33.53.57.8
#
12
13
VLA:N3
25.0 m
-107.37.06.3 +33.54.04.8
#
13
14
VLA:N1
25.0 m
-107.37.06.0 +33.54.01.8
#
14
15
VLA:N2
25.0 m
-107.37.06.2 +33.54.03.5
#
15
16
VLA:E7
25.0 m
-107.36.52.4 +33.53.56.5
#
16
17
VLA:E8
25.0 m
-107.36.48.9 +33.53.55.1
#
17
18
VLA:W4
25.0 m
-107.37.10.8 +33.53.59.1
#
18
19
VLA:E5
25.0 m
-107.36.58.4 +33.53.58.8
#
19
20
VLA:W9
25.0 m
-107.37.25.1 +33.53.51.0
#
20
21
VLA:W6
25.0 m
-107.37.15.6 +33.53.56.4
#
21
22
VLA:E4
25.0 m
-107.37.00.8 +33.53.59.7
#
23
24
VLA:E2
25.0 m
-107.37.04.4 +33.54.01.1
#
24
25
VLA:N6
25.0 m
-107.37.06.9 +33.54.10.3
#
25
26
VLA:N9
25.0 m
-107.37.07.8 +33.54.19.0
#
26
27
VLA:N8
25.0 m
-107.37.07.5 +33.54.15.8
#
27
28
VLA:W7
25.0 m
-107.37.18.4 +33.53.54.8
#
# Tables:
#
MAIN
22653 rows
#
ANTENNA
28 rows
#
DATA_DESCRIPTION
1 row
#
DOPPLER
<absent>
#
FEED
28 rows
#
FIELD
3 rows
#
FLAG_CMD
<empty>
#
FREQ_OFFSET
<absent>
#
HISTORY
273 rows
#
OBSERVATION
1 row
#
POINTING
168 rows
#
POLARIZATION
1 row
#
PROCESSOR
<empty>
#
SOURCE
3 rows
#
SPECTRAL_WINDOW
1 row
#
STATE
<empty>
#
SYSCAL
<absent>
#
WEATHER
<absent>
#
#
#=====================================================================
#
# Get rid of the autocorrelations from the MS
#
print ’--Flagautocorr--’
# Don’t default this one either, there is only one parameter (vis)
flagautocorr()
#
#=====================================================================
#
394
APPENDIX F. APPENDIX: ANNOTATED EXAMPLE SCRIPTS
# Set the fluxes of the primary calibrator(s)
#
print ’--Setjy--’
default(’setjy’)
vis = msfile
#
# 1331+305 = 3C286 is our primary calibrator
# Use the wildcard on the end of the source name
# since the field names in the MS have inherited the
# AIPS qualifiers
field = ’1331+305*’
# This is 1.4GHz D-config and 1331+305 is sufficiently unresolved
# that we dont need a model image. For higher frequencies
# (particularly in A and B config) you would want to use one.
modimage = ’’
# Setjy knows about this source so we dont need anything more
saveinputs(’setjy’,prefix+’.setjy.saved’)
# Pause script if you are running in scriptmode
if scriptmode:
inp()
user_check=raw_input(’Return to continue script\n’)
setjy()
#
# You should see something like this in the logger and casapy.log file:
#
# 1331+30500002_0 spwid= 0 [I=14.76, Q=0, U=0, V=0] Jy, (Perley-Taylor 99)
#
# So its using 14.76Jy as the flux of 1331+305 in the single Spectral Window
# in this MS.
#
#=====================================================================
#
# Bandpass calibration
#
print ’--Bandpass--’
default(’bandpass’)
#
#
#
#
We can first do
At 1.4GHz phase
a first (rough)
antenna gain as
vis = msfile
the bandpass on the single 5min scan on 1331+305
stablility should be sufficient to do this without
gain calibration. This will give us the relative
a function of frequency.
395
APPENDIX F. APPENDIX: ANNOTATED EXAMPLE SCRIPTS
# set the name for the output bandpass caltable
btable = prefix + ’.bcal’
caltable = btable
# No gain tables yet
gaintable = ’’
gainfield = ’’
interp = ’’
# Use flux calibrator 1331+305 = 3C286 (FIELD_ID 0) as bandpass calibrator
field = ’0’
# all channels
spw = ’’
# No other selection
selectdata = False
# In this band we do not need a-priori corrections for
# antenna gain-elevation curve or atmospheric opacity
# (at 8GHz and above you would want these)
gaincurve = False
opacity = 0.0
# Choose bandpass solution type
# Pick standard time-binned B (rather than BPOLY)
bandtype = ’B’
# set solution interval arbitrarily long (get single bpass)
solint = ’inf’
combine = ’scan’
# reference antenna Name 15 (15=VLA:N2) (Id 14)
refant = ’15’
saveinputs(’bandpass’,prefix+’.bandpass.saved’)
# Pause script if you are running in scriptmode
if scriptmode:
inp()
user_check=raw_input(’Return to continue script\n’)
bandpass()
#
#=====================================================================
#
# Use plotcal to examine the bandpass solutions
#
print ’--Plotcal (bandpass)--’
default(’plotcal’)
396
APPENDIX F. APPENDIX: ANNOTATED EXAMPLE SCRIPTS
caltable = btable
field = ’0’
# Set up 2x1 panels - upper panel amp vs. channel
subplot = 211
yaxis = ’amp’
# No output file yet (wait to plot next panel)
saveinputs(’plotcal’,prefix+’.plotcal.b.amp.saved’)
if scriptmode:
showgui = True
else:
showgui = False
plotcal()
#
# Set up 2x1 panels - lower panel phase vs. channel
subplot = 212
yaxis = ’phase’
saveinputs(’plotcal’,prefix+’.plotcal.b.phase.saved’)
#
# Note the rolloff in the start and end channels.
# channels 6-56 (out of 0-62) are the best
Looks like
# Pause script if you are running in scriptmode
if scriptmode:
# If you want to do this interactively and iterate over antenna, set
# iteration = ’antenna’
showgui = True
plotcal()
user_check=raw_input(’Return to continue script\n’)
else:
# No GUI for this script
showgui = False
# Now send final plot to file in PNG format (via .png suffix)
figfile = caltable + ’.plotcal.png’
plotcal()
#=====================================================================
#
# Gain calibration
#
print ’--Gaincal--’
default(’gaincal’)
# Armed with the bandpass, we now solve for the
# time-dependent antenna gains
397
APPENDIX F. APPENDIX: ANNOTATED EXAMPLE SCRIPTS
vis = msfile
# set the name for the output gain caltable
gtable = prefix + ’.gcal’
caltable = gtable
# Use our previously determined bandpass
# Note this will automatically be applied to all sources
# not just the one used to determine the bandpass
gaintable = btable
gainfield = ’’
# Use nearest (there is only one bandpass entry)
interp = ’nearest’
# Gain calibrators are 1331+305 and 1445+099 (FIELD_ID 0 and 1)
field = ’0,1’
# We have only a single spectral window (SPW 0)
# Choose 51 channels 6-56 out of the 63
# to avoid end effects.
# Channel selection is done inside spw
spw = ’0:6~56’
# No other selection
selectdata = False
# In this band we do not need a-priori corrections for
# antenna gain-elevation curve or atmospheric opacity
# (at 8GHz and above you would want these)
gaincurve = False
opacity = 0.0
# scan-based G solutions for both amplitude and phase
gaintype = ’G’
solint = ’inf’
combine = ’’
calmode = ’ap’
# minimum SNR allowed
minsnr = 1.0
# reference antenna 15 (15=VLA:N2)
refant = ’15’
saveinputs(’gaincal’,prefix+’.gaincal.saved’)
if scriptmode:
inp()
user_check=raw_input(’Return to continue script\n’)
398
APPENDIX F. APPENDIX: ANNOTATED EXAMPLE SCRIPTS
gaincal()
#
#=====================================================================
#
# Bootstrap flux scale
#
print ’--Fluxscale--’
default(’fluxscale’)
vis = msfile
# set the name for the output rescaled caltable
ftable = prefix + ’.fluxscale’
fluxtable = ftable
# point to our first gain cal table
caltable = gtable
# we will be using 1331+305 (the source we did setjy on) as
# our flux standard reference - note its extended name as in
# the FIELD table summary above (it has a VLA seq number appended)
reference = ’1331*’
# we want to transfer the flux to our other gain cal source 1445+099
transfer = ’1445*’
saveinputs(’fluxscale’,prefix+’.fluxscale.saved’)
# Pause script if you are running in scriptmode
if scriptmode:
inp()
user_check=raw_input(’Return to continue script\n’)
fluxscale()
# In the logger you should see something like:
# Flux density for 1445+09900002_0 in SpW=0 is:
#
2.48576 +/- 0.00123122 (SNR = 2018.94, nAnt= 27)
# If you run plotcal() on the tablein = ’ngc5921.demo.fluxscale’
# you will see now it has brought the amplitudes in line between
# the first scan on 1331+305 and the others on 1445+099
#
#=====================================================================
#
# Now use plotcal to examine the gain solutions
#
print ’--Plotcal (fluxscaled gains)--’
default(’plotcal’)
399
APPENDIX F. APPENDIX: ANNOTATED EXAMPLE SCRIPTS
caltable = ftable
field = ’0,1’
# Set up 2x1 panels - upper panel amp vs. time
subplot = 211
yaxis = ’amp’
# No output file yet (wait to plot next panel)
saveinputs(’plotcal’,prefix+’.plotcal.gscaled.amp.saved’)
if scriptmode:
showgui = True
else:
showgui = False
plotcal()
#
# Set up 2x1 panels - lower panel phase vs. time
subplot = 212
yaxis = ’phase’
saveinputs(’plotcal’,prefix+’.plotcal.gscaled.phase.saved’)
#
# The amp and phase coherence looks good
# Pause script if you are running in scriptmode
if scriptmode:
# If you want to do this interactively and iterate over antenna, set
#iteration = ’antenna’
showgui = True
plotcal()
user_check=raw_input(’Return to continue script\n’)
else:
# No GUI for this script
showgui = False
# Now send final plot to file in PNG format (via .png suffix)
figfile = caltable + ’.plotcal.png’
plotcal()
#=====================================================================
#
# Apply our calibration solutions to the data
# (This will put calibrated data into the CORRECTED_DATA column)
#
print ’--ApplyCal--’
default(’applycal’)
vis = msfile
400
APPENDIX F. APPENDIX: ANNOTATED EXAMPLE SCRIPTS
# We want to correct the calibrators using themselves
# and transfer from 1445+099 to itself and the target N5921
# Start with the fluxscale/gain and bandpass tables
gaintable = [ftable,btable]
# pick the 1445+099 out of the gain table for transfer
# use all of the bandpass table
gainfield = [’1’,’*’]
# interpolation using linear for gain, nearest for bandpass
interp = [’linear’,’nearest’]
# only one spw, do not need mapping
spwmap = []
# all channels
spw = ’’
selectdata = False
# as before
gaincurve = False
opacity = 0.0
# select the fields for 1445+099 and N5921
field = ’1,2’
applycal()
# Now for completeness apply 1331+305 to itself
field = ’0’
gainfield = [’0’,’*’]
# The CORRECTED_DATA column now contains the calibrated visibilities
saveinputs(’applycal’,prefix+’.applycal.saved’)
# Pause script if you are running in scriptmode
if scriptmode:
inp()
user_check=raw_input(’Return to continue script\n’)
applycal()
#
#=====================================================================
#
# Now use plotxy to plot the calibrated target data (before contsub)
#
print ’--Plotxy (NGC5921)--’
401
APPENDIX F. APPENDIX: ANNOTATED EXAMPLE SCRIPTS
default(’plotxy’)
vis = msfile
field = ’2’
# Edge channels are bad
spw = ’0:4~59’
# Time average across scans
timebin = ’86000.’
crossscans = True
# Set up 2x1 panels - upper panel amp vs. channel
subplot = 211
xaxis = ’channel’
yaxis = ’amp’
datacolumn = ’corrected’
# No output file yet (wait to plot next panel)
saveinputs(’plotxy’,prefix+’.plotxy.final.amp.saved’)
print "Amp averaged across time and baseline (upper)"
figfile = ’’
if scriptmode:
interactive = True
else:
interactive = False
plotxy()
#
# Set up 2x1 panels - lower panel phase vs. time
subplot = 212
yaxis = ’phase’
datacolumn = ’corrected’
# Time average across scans and baselines
timebin = ’86000.’
crossscans = True
crossbls = True
saveinputs(’plotxy’,prefix+’.plotxy.final.phase.saved’)
print "Phase averaged across time and baseline (lower)"
print "Final calibrated data"
# Pause script if you are running in scriptmode
if scriptmode:
interactive = True
figfile = ’’
plotxy()
402
APPENDIX F. APPENDIX: ANNOTATED EXAMPLE SCRIPTS
user_check=raw_input(’Return to continue script\n’)
else:
interactive = False
# Now send final plot to file in PNG format (via .png suffix)
figfile = vis + ’.plotxy.png’
plotxy()
#=====================================================================
#
# Split the sources out, pick off the CORRECTED_DATA column
#
#
# Split NGC5921 data (before continuum subtraction)
#
print ’--Split NGC5921 Data--’
default(’split’)
vis = msfile
splitms = prefix + ’.src.split.ms’
outputvis = splitms
field = ’N5921*’
spw = ’’
datacolumn = ’corrected’
saveinputs(’split’,prefix+’.split.n5921.saved’)
split()
print "Created "+splitms
# If you want, split out the calibrater 1445+099 field, all chans
#print ’--Split 1445+099 Data--’
#
#calsplitms = prefix + ’.cal.split.ms’
#outputvis = calsplitms
#field = ’1445*’
#
#saveinputs(’split’,prefix+’.split.1445.saved’)
#
#split()
#=====================================================================
#
# Here is how to export the NGC5921 data as UVFITS
# Start with the split file.
# Since this is a split dataset, the calibrated data is
# in the DATA column already.
# Write as a multisource UVFITS (with SU table)
# even though it will have only one field in it
# Run asynchronously so as not to interfere with other tasks
403
APPENDIX F. APPENDIX: ANNOTATED EXAMPLE SCRIPTS
# (BETA: also avoids crash on next importuvfits)
#
#print ’--Export UVFITS--’
#default(’exportuvfits’)
#
#srcuvfits = prefix + ’.split.uvfits’
#
#vis = splitms
#fitsfile = srcuvfits
#datacolumn = ’data’
#multisource = True
#async = True
#
#saveinputs(’exportuvfits’,prefix+’.exportuvfits.saved’)
#
#myhandle = exportuvfits()
#
#print "The return value for this exportuvfits async task for tm is "+str(myhandle)
#=====================================================================
#
# UV-plane continuum subtraction on the target
# use the split ms
# (this will update the CORRECTED_DATA column)
#
print ’--UV Continuum Subtract--’
default(’uvcontsub’)
vis = splitms
field = ’N5921*’
# Use channels 4-6 and 50-59 for continuum
fitspw=’0:4~6;50~59’
# Output all of spw 0
spw = ’0’
# Averaging time (none)
solint = 0.0
# Fit only a mean level
fitorder = 0
# Do the uv-plane subtraction
fitmode = ’subtract’
# Let it split out the data automatically for us
splitdata = True
saveinputs(’uvcontsub’,prefix+’.uvcontsub.saved’)
404
APPENDIX F. APPENDIX: ANNOTATED EXAMPLE SCRIPTS
# Pause script if you are running in scriptmode
if scriptmode:
inp()
user_check=raw_input(’Return to continue script\n’)
uvcontsub()
# You will see it made two new MS:
# <vis>.cont
# <vis>.contsub
srcsplitms = splitms + ’.contsub’
# Note that ngc5921.demo.ms.contsub contains the uv-subtracted
# visibilities (in its DATA column), and ngc5921.demo.ms.cont
# the pseudo-continuum visibilities (as fit).
# The original ngc5921.demo.ms now contains the uv-continuum
# subtracted vis in its CORRECTED_DATA column and the continuum
# in its MODEL_DATA column as per the fitmode=’subtract’
# Done with calibration
#=====================================================================
#
# Here is how to make a dirty image cube
#
#print ’--Clean (dirty image)--’
#default(’clean’)
# Pick up our split source continuum-subtracted data
#vis = srcsplitms
#dirtyname = prefix + ’.dirtyimg’
#imagename = dirtyname
#
#mode = ’channel’
#nchan = 46
#start = 5
#width = 1
#
#field = ’0’
#spw = ’’
#imsize = [256,256]
#cell = [15.,15.]
#weighting = ’briggs’
#robust = 0.5
# No cleaning
#niter = 0
#saveinputs(’clean’,prefix+’.invert.saved’)
405
APPENDIX F. APPENDIX: ANNOTATED EXAMPLE SCRIPTS
# Pause script if you are running in scriptmode
#if scriptmode:
#
inp()
#
user_check=raw_input(’Return to continue script\n’)
#
#clean()
#dirtyimage = dirtyname+’.image’
# Get the dirty image cube statistics
#dirtystats = imstat(dirtyimage)
#=====================================================================
#
# Now clean an image cube of N5921
#
print ’--Clean (clean)--’
default(’clean’)
# Pick up our split source continuum-subtracted data
vis = srcsplitms
# Make an image root file name
imname = prefix + ’.cleanimg’
imagename = imname
# Set up the output image cube
mode = ’channel’
nchan = 46
start = 5
width = 1
# This is a single-source MS with one spw
field = ’0’
spw = ’’
# Standard gain factor 0.1
gain = 0.1
# Set the output image size and cell size (arcsec)
imsize = [256,256]
# Do a simple Clark clean
psfmode = ’clark’
# No Cotton-Schwab iterations
csclean = False
# If desired, you can do a Cotton-Schwab clean
# but will have only marginal improvement for this data
#csclean = True
# Twice as big for Cotton-Schwab (cleans inner quarter)
406
APPENDIX F. APPENDIX: ANNOTATED EXAMPLE SCRIPTS
#imsize = [512,512]
# Pixel size 15 arcsec for this data (1/3 of 45" beam)
# VLA D-config L-band
cell = [15.,15.]
# Fix maximum number of iterations
niter = 6000
# Also set flux residual threshold (in mJy)
threshold=8.0
# Set up the weighting
# Use Briggs weighting (a moderate value, on the uniform side)
weighting = ’briggs’
robust = 0.5
# Set a cleanbox +/-20 pixels around the center 128,128
mask = [108,108,148,148]
# But if you had a cleanbox saved in a file, e.g. "regionfile.txt"
# you could use it:
#mask=’regionfile.txt’
#
# If you don’t want any clean boxes or masks, then
#mask = ’’
# If you want interactive clean set to True
#interactive=True
interactive=False
saveinputs(’clean’,prefix+’.clean.saved’)
# Pause script if you are running in scriptmode
if scriptmode:
inp()
user_check=raw_input(’Return to continue script\n’)
clean()
#
#
#
#
#
#
#
#
#
#
#
Should find stuff in the logger like:
Fitted beam used in restoration: 51.5643 by 45.6021 (arcsec)
at pa 14.5411 (deg)
It will have made the images:
----------------------------ngc5921.demo.cleanimg.flux
ngc5921.demo.cleanimg.image
ngc5921.demo.cleanimg.mask
ngc5921.demo.cleanimg.model
407
APPENDIX F. APPENDIX: ANNOTATED EXAMPLE SCRIPTS
# ngc5921.demo.cleanimg.psf
# ngc5921.demo.cleanimg.residual
clnimage = imname+’.image’
#=====================================================================
#
# Done with imaging
# Now view the image cube of N5921
#
if scriptmode:
print ’--View image--’
print "Use Spectral Profile Tool to get line profile in box in center"
viewer(clnimage,’image’)
user_check=raw_input(’Return to continue script\n’)
#=====================================================================
#
# Here is how to export the Final CLEAN Image as FITS
# Run asynchronously so as not to interfere with other tasks
# (BETA: also avoids crash on next importfits)
#
#print ’--Final Export CLEAN FITS--’
#default(’exportfits’)
#
#clnfits = prefix + ’.cleanimg.fits’
#
#imagename = clnimage
#fitsimage = clnfits
#async = True
#
#saveinputs(’exportfits’,prefix+’.exportfits.saved’)
#
#myhandle2 = exportfits()
#
#print "The return value for this exportfits async task for tm is "+str(myhandle2)
#=====================================================================
#
# Print the image header
#
print ’--Imhead--’
default(’imhead’)
imagename = clnimage
mode = ’summary’
imhead()
# A summary of the cube will be seen in the logger
408
APPENDIX F. APPENDIX: ANNOTATED EXAMPLE SCRIPTS
#=====================================================================
#
# Get the cube statistics
#
print ’--Imstat (cube)--’
default(’imstat’)
imagename = clnimage
# Do whole image
box = ’’
# or you could stick to the cleanbox
#box = ’108,108,148,148’
cubestats = imstat()
# Statistics will printed to the terminal, and the output
# parameter will contain a dictionary of the statistics
#=====================================================================
#
# Get some image moments
#
print ’--ImMoments--’
default(’immoments’)
imagename = clnimage
# Do first and second moments
moments = [0,1]
# Need to mask out noisy pixels, currently done
# using hard global limits
excludepix = [-100,0.009]
# Collapse along the spectral (channel) axis
axis = ’spectral’
# Include all planes
chans = ’’
# Output root name
momfile = prefix + ’.moments’
outfile = momfile
saveinputs(’immoments’,prefix+’.immoments.saved’)
# Pause script if you are running in scriptmode
if scriptmode:
inp()
user_check=raw_input(’Return to continue script\n’)
409
APPENDIX F. APPENDIX: ANNOTATED EXAMPLE SCRIPTS
immoments()
momzeroimage = momfile + ’.integrated’
momoneimage = momfile + ’.weighted_coord’
#
#
#
#
It will have made the images:
-------------------------------------ngc5921.demo.moments.integrated
ngc5921.demo.moments.weighted_coord
#
#=====================================================================
#
# Get some statistics of the moment images
#
print ’--Imstat (moments)--’
default(’imstat’)
imagename = momzeroimage
momzerostats = imstat()
imagename = momoneimage
momonestats = imstat()
#=====================================================================
#
# Now view the moments
#
if scriptmode:
print ’--View image (Moments)--’
viewer(momzeroimage)
print "You can add mom-1 image "+momoneimage
print "as a contour plot"
user_check=raw_input(’Return to continue script\n’)
#=====================================================================
#
# Set up an output logfile
import datetime
datestring=datetime.datetime.isoformat(datetime.datetime.today())
outfile = ’out.’+prefix+’.’+datestring+’.log’
logfile=open(outfile,’w’)
print >>logfile,’Results for ’+prefix+’ :’
print >>logfile,""
#=====================================================================
#
# Can do some image statistics if you wish
# Treat this like a regression script
410
APPENDIX F. APPENDIX: ANNOTATED EXAMPLE SCRIPTS
# WARNING: currently requires toolkit
#
print ’ NGC5921 results ’
print ’ =============== ’
print >>logfile,’ NGC5921 results ’
print >>logfile,’ =============== ’
#
# Use the ms tool to get max of the MSs
# Eventually should be available from a task
#
# Pull the max cal amp value out of the MS (if you split this)
#ms.open(calsplitms)
#thistest_cal = max(ms.range(["amplitude"]).get(’amplitude’))
#ms.close()
#oldtest_cal = 34.0338668823
#diff_cal = abs((oldtest_cal-thistest_cal)/oldtest_cal)
#
#print ’ Calibrator data ampl max = ’,thistest_cal
#print ’
Previous: cal data max = ’,oldtest_cal
#print ’
Difference (fractional) = ’,diff_cal
#print ’’
#
#print >>logfile,’ Calibrator data ampl max = ’,thistest_cal
#print >>logfile,’
Previous: cal data max = ’,oldtest_cal
#print >>logfile,’
Difference (fractional) = ’,diff_cal
#print >>logfile,’’
# Pull the max src amp value out of the MS
ms.open(srcsplitms)
thistest_src = max(ms.range(["amplitude"]).get(’amplitude’))
ms.close()
oldtest_src = 46.2060050964 # now in all chans
diff_src = abs((oldtest_src-thistest_src)/oldtest_src)
print
print
print
print
’ Target Src data ampl max = ’,thistest_src
’
Previous: src data max = ’,oldtest_src
’
Difference (fractional) = ’,diff_src
’’
print
print
print
print
>>logfile,’ Target Src data ampl max = ’,thistest_src
>>logfile,’
Previous: src data max = ’,oldtest_src
>>logfile,’
Difference (fractional) = ’,diff_src
>>logfile,’’
#
# Now use the stats produced by imstat above
#
# DIRTY IMAGE MAX & RMS (IF YOU MADE A DIRTY IMAGE)
#
411
APPENDIX F. APPENDIX: ANNOTATED EXAMPLE SCRIPTS
#thistest_dirtymax=dirtystats[’max’][0]
#oldtest_dirtymax = 0.0515365377069
#diff_dirtymax = abs((oldtest_dirtymax-thistest_dirtymax)/oldtest_dirtymax)
#
#print ’ Dirty image max = ’,thistest_dirtymax
#print ’
Previous: max = ’,oldtest_dirtymax
#print ’
Difference (fractional) = ’,diff_dirtymax
#print ’’
#
#print >>logfile,’ Dirty Image max = ’,thistest_dirtymax
#print >>logfile,’
Previous: max = ’,oldtest_dirtymax
#print >>logfile,’
Difference (fractional) = ’,diff_dirtymax
#print >>logfile,’’
#
#thistest_dirtyrms=dirtystats[’rms’][0]
#oldtest_dirtyrms = 0.00243866862729
#diff_dirtyrms = abs((oldtest_dirtyrms-thistest_dirtyrms)/oldtest_dirtyrms)
#
#print ’ Dirty image rms = ’,thistest_dirtyrms
#print ’
Previous: rms = ’,oldtest_dirtyrms
#print ’
Difference (fractional) = ’,diff_dirtyrms
#print ’’
#
#print >>logfile,’ Dirty Image rms = ’,thistest_dirtyrms
#print >>logfile,’
Previous: rms = ’,oldtest_dirtyrms
#print >>logfile,’
Difference (fractional) = ’,diff_dirtyrms
#print >>logfile,’’
# Now the clean image
#
thistest_immax=cubestats[’max’][0]
oldtest_immax = 0.052414759993553162
diff_immax = abs((oldtest_immax-thistest_immax)/oldtest_immax)
print
print
print
print
’ Clean image max = ’,thistest_immax
’
Previous: max = ’,oldtest_immax
’
Difference (fractional) = ’,diff_immax
’’
print
print
print
print
>>logfile,’ Clean Image max = ’,thistest_immax
>>logfile,’
Previous: max = ’,oldtest_immax
>>logfile,’
Difference (fractional) = ’,diff_immax
>>logfile,’’
thistest_imrms=cubestats[’rms’][0]
oldtest_imrms = 0.0020218724384903908
diff_imrms = abs((oldtest_imrms-thistest_imrms)/oldtest_imrms)
print ’ Clean image rms = ’,thistest_imrms
print ’
Previous: rms = ’,oldtest_imrms
print ’
Difference (fractional) = ’,diff_imrms
412
APPENDIX F. APPENDIX: ANNOTATED EXAMPLE SCRIPTS
print ’’
print
print
print
print
>>logfile,’ Clean image rms = ’,thistest_imrms
>>logfile,’
Previous: rms = ’,oldtest_imrms
>>logfile,’
Difference (fractional) = ’,diff_imrms
>>logfile,’’
# Now the moment images
#
thistest_momzeromax=momzerostats[’max’][0]
oldtest_momzeromax = 1.40223777294
diff_momzeromax = abs((oldtest_momzeromax-thistest_momzeromax)/oldtest_momzeromax)
print
print
print
print
’ Moment 0 image max = ’,thistest_momzeromax
’
Previous: m0 max = ’,oldtest_momzeromax
’
Difference (fractional) = ’,diff_momzeromax
’’
print
print
print
print
>>logfile,’ Moment 0 image max = ’,thistest_momzeromax
>>logfile,’
Previous: m0 max = ’,oldtest_momzeromax
>>logfile,’
Difference (fractional) = ’,diff_momzeromax
>>logfile,’’
thistest_momoneavg=momonestats[’mean’][0]
oldtest_momoneavg = 1479.77119646
diff_momoneavg = abs((oldtest_momoneavg-thistest_momoneavg)/oldtest_momoneavg)
print
print
print
print
print
’ Moment 1 image mean = ’,thistest_momoneavg
’
Previous: m1 mean = ’,oldtest_momoneavg
’
Difference (fractional) = ’,diff_momoneavg
’’
’--- Done ---’
print
print
print
print
print
>>logfile,’ Moment 1 image mean = ’,thistest_momoneavg
>>logfile,’
Previous: m1 mean = ’,oldtest_momoneavg
>>logfile,’
Difference (fractional) = ’,diff_momoneavg
>>logfile,’’
>>logfile,’--- Done ---’
#
#
#
#
#
#
#
#
#
#
#
#
Should see output like:
Clean image max should be 0.0524147599936
Found : Image Max = 0.0523551553488
Difference (fractional) = 0.00113717290288
Clean image rms should be 0.00202187243849
Found : Image rms = 0.00202226242982
Difference (fractional) = 0.00019288621809
Moment 0 image max should be 1.40223777294
Found : Moment 0 Max = 1.40230333805
413
APPENDIX F. APPENDIX: ANNOTATED EXAMPLE SCRIPTS
414
# Difference (fractional) = 4.67574844349e-05
#
# Moment 1 image mean should be 1479.77119646
# Found : Moment 1 Mean = 1479.66974528
# Difference (fractional) = 6.85586935973e-05
#
#=====================================================================
# Done
#
logfile.close()
print "Results are in "+outfile
F.2
Jupiter — VLA continuum polarization
This script demonstrates continuum polarization calibration and imaging, including self-calibration.
There is also extensive interactive flagging, and image analysis.
The latest version of this script can be found at:
http://casa.nrao.edu/Doc/Scripts/jupiter6cm_demo.py
######################################################################
#
#
# Use Case Script for Jupiter 6cm VLA
#
# Trimmed down from Use Case jupiter6cm_usecase.py
#
#
#
# Updated STM 2008-05-15 (Beta Patch 2.0)
#
# Updated STM 2008-06-11 (Beta Patch 2.0)
#
# Updated STM 2008-06-12 (Beta Patch 2.0) for summer school demo
#
# Updated STM 2008-06-13 (Beta Patch 2.0) make a bit faster
#
# Updated STM 2008-12-24 (Beta Patch 3.0) extendflags
#
# Updated STM 2009-05-29 (Beta Patch 4.0) for mcmaster tutorial
#
#
#
# This is a VLA 6cm dataset that was observed in 1999 to set the
#
# flux scale for calibration of the VLA. Included in the program
#
# were observations of the planets, including Jupiter.
#
#
#
# This is D-configuration data, with resolution of around 14"
#
#
#
# Includes polarization imaging and analysis
#
#
#
######################################################################
import time
import os
print "Jupiter 6cm Interactive Tutorial/Demo Script"
print "Version 2009-05-29 (Version 2.4.0 Patch 4.0)"
APPENDIX F. APPENDIX: ANNOTATED EXAMPLE SCRIPTS
print ""
#
#=====================================================================
#
# This script has some interactive commands: scriptmode = True
# if you are running it and want it to stop during interactive parts.
scriptmode = True
#=====================================================================
#
# Set up some useful variables - these will be set during the script
# also, but if you want to restart the script in the middle here
# they are in one place:
# This will prefix all output file names
prefix=’jupiter6cm.demo’
# Clean up old files
os.system(’rm -rf ’+prefix+’*’)
# This is the output MS file name
msfile = prefix + ’.ms’
#
#=====================================================================
# Calibration variables
#
# Use same prefix as rest of script
calprefix = prefix
# spectral windows to process
usespw = ’’
usespwlist = [’0’,’1’]
# prior calibration to apply
usegaincurve = True
gainopacity = 0.0
# reference antenna 11 (11=VLA:N1)
calrefant = ’11’
gtable = calprefix + ’.gcal’
ftable = calprefix + ’.fluxscale’
atable = calprefix + ’.accum’
#
#=====================================================================
# Polarization calibration setup
#
415
APPENDIX F. APPENDIX: ANNOTATED EXAMPLE SCRIPTS
dopolcal = True
ptable = calprefix + ’.pcal’
xtable = calprefix + ’.polx’
# Pol leakage calibrator
poldfield = ’0137+331’
# Pol angle calibrator
polxfield = ’1331+305’
# At Cband the fractional polarization of this source is 0.112 and
# the R-L PhaseDiff = 66deg (EVPA = 33deg)
polxfpol = 0.112
polxrlpd_deg = 66.0
# Dictionary of IPOL in the spw
polxipol = {’0’ : 7.462,
’1’ : 7.510}
# Make Stokes lists for setjy
polxiquv = {}
for spw in [’0’,’1’]:
ipol = polxipol[spw]
fpol = polxfpol
ppol = ipol*fpol
rlpd = polxrlpd_deg*pi/180.0
qpol = ppol*cos(rlpd)
upol = ppol*sin(rlpd)
polxiquv[spw] = [ipol,qpol,upol,0.0]
#
# Split output setup
#
srcname = ’JUPITER’
srcsplitms = calprefix + ’.’ + srcname + ’.split.ms’
calname = ’0137+331’
calsplitms = calprefix + ’.’ + calname + ’.split.ms’
#
#=====================================================================
#
# Intensity imaging parameters
#
# Same prefix for this imaging demo output
#
imprefix = prefix
#
#
#
#
#
This is D-config VLA 6cm (4.85GHz) obs
Check the observational status summary
Primary beam FWHM = 45’/f_GHz = 557"
Synthesized beam FWHM = 14"
RMS in 10min (600s) = 0.06 mJy (thats now, but close enough)
416
APPENDIX F. APPENDIX: ANNOTATED EXAMPLE SCRIPTS
# Set the output image size and cell size (arcsec)
# 4" will give 3.5x oversampling
clncell = [4.,4.]
# 280 pix will cover to 2xPrimaryBeam
# clean will say to use 288 (a composite integer) for efficiency
clnalg = ’clark’
clnmode = ’’
# For Cotton-Schwab use
clnmode = ’csclean’
clnimsize = [288,288]
# iterations
clniter = 10000
# Also set flux residual threshold (0.04 mJy)
# From our listobs:
# Total integration time = 85133.2 seconds
# With rms of 0.06 mJy in 600s ==> rms = 0.005 mJy
# Set to 10x thermal rms
clnthreshold=0.05
#
# Filenames
#
imname1 = imprefix + ’.clean1’
clnimage1 = imname1+’.image’
clnmodel1 = imname1+’.model’
clnresid1 = imname1+’.residual’
clnmask1 = imname1+’.clean_interactive.mask’
imname2 =
clnimage2
clnmodel2
clnresid2
clnmask2
imprefix + ’.clean2’
= imname2+’.image’
= imname2+’.model’
= imname2+’.residual’
= imname2+’.clean_interactive.mask’
imname3 =
clnimage3
clnmodel3
clnresid3
clnmask3
imprefix + ’.clean3’
= imname3+’.image’
= imname3+’.model’
= imname3+’.residual’
= imname3+’.clean_interactive.mask’
#
# Selfcal parameters
#
# reference antenna 11 (11=VLA:N1)
calrefant = ’11’
#
417
APPENDIX F. APPENDIX: ANNOTATED EXAMPLE SCRIPTS
# Filenames
#
selfcaltab1 = imprefix + ’.selfcal1.gtable’
selfcaltab2 = imprefix + ’.selfcal2.gtable’
smoothcaltab2 = imprefix + ’.smoothcal2.gtable’
#
#=====================================================================
#
# Polarization imaging parameters
#
# New prefix for polarization imaging output
#
polprefix = prefix + ’.polimg’
# Set up clean slightly differently
polclnalg = ’hogbom’
polclnmode = ’csclean’
polimname
polimage
polmodel
polresid
polmask
=
=
=
=
=
polprefix + ’.clean’
polimname+’.image’
polimname+’.model’
polimname+’.residual’
polimname+’.clean_interactive.mask’
#
# Other files
#
ipolimage = polimage+’.I’
qpolimage = polimage+’.Q’
upolimage = polimage+’.U’
poliimage = polimage+’.poli’
polaimage = polimage+’.pola’
#
#=====================================================================
#=====================================================================
# Start processing
#=====================================================================
#
# Get to path to the CASA home and stip off the name
pathname=os.environ.get(’CASAPATH’).split()[0]
# This is where the UVFITS data should be
#fitsdata=pathname+’/data/demo/jupiter6cm.fits’
# Or
#fitsdata=pathname+’/data/nrao/VLA/planets_6cm.fits’
#fitsdata=’/home/ballista/casa/devel/data/nrao/VLA/planets_6cm.fits’
#
418
APPENDIX F. APPENDIX: ANNOTATED EXAMPLE SCRIPTS
# Can also be found online at
#http://casa.nrao.edu/Data/VLA/Planets6cm/planets_6cm.fits
# Use version in current directory
fitsdata=’planets_6cm.fits’
#
#=====================================================================
# Data Import and List
#=====================================================================
#
# Import the data from FITS to MS
#
print ’--Import--’
# Safest to start from task defaults
default(’importuvfits’)
print "Use importuvfits to read UVFITS and make an MS"
# Set up the MS filename and save as new global variable
msfile = prefix + ’.ms’
print "MS will be called "+msfile
# Use task importuvfits
fitsfile = fitsdata
vis = msfile
importuvfits()
#=====================================================================
#
# List a summary of the MS
#
print ’--Listobs--’
# Don’t default this one and make use of the previous setting of
# vis. Remember, the variables are GLOBAL!
print "Use listobs to print verbose summary to logger"
# You may wish to see more detailed information, in this case
# use the verbose = True option
verbose = True
listobs()
# You should get in your logger window and in the casapy.log file
# something like:
#
#
Observer: FLUX99
Project:
419
APPENDIX F. APPENDIX: ANNOTATED EXAMPLE SCRIPTS
# Observation: VLA
#
# Data records: 2021424
Total integration time
#
Observed from
23:15:27
to
22:54:20
#
#
ObservationID = 0
ArrayID = 0
#
Date
Timerange
Scan FldId
#
15-Apr-1999/23:15:26.7 - 23:16:10.0
1
0
#
23:38:40.0 - 23:48:00.0
2
1
#
23:53:40.0 - 23:55:20.0
3
2
#
16-Apr-1999/00:22:10.1 - 00:23:49.9
4
3
#
00:28:23.3 - 00:30:00.1
5
4
#
00:48:40.0 - 00:50:20.0
6
1
#
00:56:13.4 - 00:57:49.9
7
2
#
01:10:20.1 - 01:11:59.9
8
5
#
01:23:29.9 - 01:25:00.1
9
3
#
01:29:33.3 - 01:31:10.0
10
4
#
01:49:50.0 - 01:51:30.0
11
6
#
02:03:00.0 - 02:04:30.0
12
7
#
02:17:30.0 - 02:19:10.0
13
1
#
02:24:20.0 - 02:26:00.0
14
2
#
02:37:49.9 - 02:39:30.0
15
5
#
02:50:50.1 - 02:52:20.1
16
3
#
02:59:20.0 - 03:01:00.0
17
6
#
03:12:30.0 - 03:14:10.0
18
7
#
03:27:53.3 - 03:29:39.9
19
1
#
03:35:00.0 - 03:36:40.0
20
2
#
03:49:50.0 - 03:51:30.1
21
6
#
04:03:10.0 - 04:04:50.0
22
7
#
04:18:49.9 - 04:20:40.0
23
1
#
04:25:56.6 - 04:27:39.9
24
2
#
04:42:49.9 - 04:44:40.0
25
8
#
04:56:50.0 - 04:58:30.1
26
6
#
05:24:03.3 - 05:33:39.9
27
7
#
05:48:00.0 - 05:49:49.9
28
1
#
05:58:36.6 - 06:00:30.0
29
8
#
06:13:20.1 - 06:14:59.9
30
6
#
06:27:40.0 - 06:29:20.0
31
7
#
06:44:13.4 - 06:46:00.0
32
1
#
06:55:06.6 - 06:57:00.0
33
8
#
07:10:40.0 - 07:12:20.0
34
6
#
07:28:20.0 - 07:30:10.1
35
7
#
07:42:49.9 - 07:44:30.0
36
8
#
07:58:43.3 - 08:00:39.9
37
6
#
08:13:30.0 - 08:15:19.9
38
7
#
08:27:53.4 - 08:29:30.0
39
8
#
08:42:59.9 - 08:44:50.0
40
6
#
08:57:09.9 - 08:58:50.0
41
7
#
09:13:03.3 - 09:14:50.1
42
9
#
09:26:59.9 - 09:28:40.0
43
6
#
09:40:33.4 - 09:42:09.9
44
7
420
= 85133.2 seconds
FieldName
0137+331
0813+482
0542+498
0437+296
VENUS
0813+482
0542+498
0521+166
0437+296
VENUS
1411+522
1331+305
0813+482
0542+498
0521+166
0437+296
1411+522
1331+305
0813+482
0542+498
1411+522
1331+305
0813+482
0542+498
MARS
1411+522
1331+305
0813+482
MARS
1411+522
1331+305
0813+482
MARS
1411+522
1331+305
MARS
1411+522
1331+305
MARS
1411+522
1331+305
NGC7027
1411+522
1331+305
SpwIds
[0, 1]
[0, 1]
[0, 1]
[0, 1]
[0, 1]
[0, 1]
[0, 1]
[0, 1]
[0, 1]
[0, 1]
[0, 1]
[0, 1]
[0, 1]
[0, 1]
[0, 1]
[0, 1]
[0, 1]
[0, 1]
[0, 1]
[0, 1]
[0, 1]
[0, 1]
[0, 1]
[0, 1]
[0, 1]
[0, 1]
[0, 1]
[0, 1]
[0, 1]
[0, 1]
[0, 1]
[0, 1]
[0, 1]
[0, 1]
[0, 1]
[0, 1]
[0, 1]
[0, 1]
[0, 1]
[0, 1]
[0, 1]
[0, 1]
[0, 1]
[0, 1]
APPENDIX F. APPENDIX: ANNOTATED EXAMPLE SCRIPTS
#
#
#
#
#
#
#
#
#
#
#
#
#
#
#
#
#
#
#
#
#
#
#
#
#
#
#
#
#
#
#
#
#
#
#
#
#
#
#
#
#
#
#
#
#
#
#
#
#
#
# Fields: 13
09:56:19.9
10:12:59.9
10:27:09.9
10:40:30.0
10:56:10.0
11:28:30.0
11:48:20.0
12:01:36.7
12:35:33.3
12:46:30.0
13:00:29.9
13:15:23.3
13:33:43.3
13:44:30.0
14:00:46.7
14:10:40.0
14:24:06.6
14:34:30.0
14:59:13.4
15:09:03.3
15:24:30.0
15:40:10.0
15:53:50.0
16:18:53.4
16:29:10.1
16:42:53.4
16:54:53.4
17:23:06.6
17:41:50.0
17:55:36.7
18:19:23.3
18:30:23.3
18:44:49.9
18:59:13.3
19:19:10.0
19:32:50.1
19:39:03.3
20:08:06.7
20:18:10.0
20:33:53.3
20:40:59.9
21:00:16.6
21:13:53.4
21:20:43.4
21:47:26.7
21:57:30.0
22:12:13.3
22:28:33.3
22:53:33.3
-
09:58:10.0
10:14:50.0
10:28:50.0
10:42:00.0
10:57:50.0
11:35:30.0
11:50:10.0
12:03:10.0
12:37:40.0
12:48:10.0
13:02:10.0
13:17:10.1
13:35:40.0
13:46:10.0
14:01:39.9
14:12:09.9
14:25:40.1
14:36:10.1
15:00:00.0
15:10:40.1
15:26:20.1
15:45:00.0
15:55:20.0
16:19:49.9
16:30:49.9
16:44:30.0
16:56:40.0
17:30:40.0
17:43:20.0
17:57:39.9
18:20:09.9
18:32:00.0
18:46:30.0
19:00:59.9
19:21:20.1
19:34:29.9
19:40:40.1
20:08:59.9
20:19:50.0
20:35:40.1
20:42:40.0
21:02:20.1
21:15:29.9
21:22:30.0
21:48:20.1
21:59:10.0
22:14:00.1
22:30:19.9
22:54:19.9
45
46
47
48
49
50
51
52
53
54
55
56
57
58
59
60
61
62
63
64
65
66
67
68
69
70
71
72
73
74
75
76
77
78
79
80
81
82
83
84
85
86
87
88
89
90
91
92
93
9
8
6
7
9
10
6
7
11
10
6
9
11
10
0
12
11
10
0
12
9
11
10
0
12
11
9
2
3
4
0
12
9
2
5
3
4
0
12
1
2
5
3
4
0
12
2
4
0
NGC7027
MARS
1411+522
1331+305
NGC7027
NEPTUNE
1411+522
1331+305
URANUS
NEPTUNE
1411+522
NGC7027
URANUS
NEPTUNE
0137+331
JUPITER
URANUS
NEPTUNE
0137+331
JUPITER
NGC7027
URANUS
NEPTUNE
0137+331
JUPITER
URANUS
NGC7027
0542+498
0437+296
VENUS
0137+331
JUPITER
NGC7027
0542+498
0521+166
0437+296
VENUS
0137+331
JUPITER
0813+482
0542+498
0521+166
0437+296
VENUS
0137+331
JUPITER
0542+498
VENUS
0137+331
421
[0,
[0,
[0,
[0,
[0,
[0,
[0,
[0,
[0,
[0,
[0,
[0,
[0,
[0,
[0,
[0,
[0,
[0,
[0,
[0,
[0,
[0,
[0,
[0,
[0,
[0,
[0,
[0,
[0,
[0,
[0,
[0,
[0,
[0,
[0,
[0,
[0,
[0,
[0,
[0,
[0,
[0,
[0,
[0,
[0,
[0,
[0,
[0,
[0,
1]
1]
1]
1]
1]
1]
1]
1]
1]
1]
1]
1]
1]
1]
1]
1]
1]
1]
1]
1]
1]
1]
1]
1]
1]
1]
1]
1]
1]
1]
1]
1]
1]
1]
1]
1]
1]
1]
1]
1]
1]
1]
1]
1]
1]
1]
1]
1]
1]
APPENDIX F. APPENDIX: ANNOTATED EXAMPLE SCRIPTS
#
ID
Name
Right Ascension Declination
Epoch
#
0
0137+331
01:37:41.30
+33.09.35.13 J2000
#
1
0813+482
08:13:36.05
+48.13.02.26 J2000
#
2
0542+498
05:42:36.14
+49.51.07.23 J2000
#
3
0437+296
04:37:04.17
+29.40.15.14 J2000
#
4
VENUS
04:06:54.11
+22.30.35.91 J2000
#
5
0521+166
05:21:09.89
+16.38.22.05 J2000
#
6
1411+522
14:11:20.65
+52.12.09.14 J2000
#
7
1331+305
13:31:08.29
+30.30.32.96 J2000
#
8
MARS
14:21:41.37
-12.21.49.45 J2000
#
9
NGC7027
21:07:01.59
+42.14.10.19 J2000
#
10
NEPTUNE
20:26:01.14
-18.54.54.21 J2000
#
11
URANUS
21:15:42.83
-16.35.05.59 J2000
#
12
JUPITER
00:55:34.04
+04.45.44.71 J2000
#
# Spectral Windows: (2 unique spectral windows and 1 unique polarization setups)
#
SpwID #Chans Frame Ch1(MHz)
Resoln(kHz) TotBW(kHz) Ref(MHz)
Corrs
#
0
1 TOPO 4885.1
50000
50000
4885.1
RR RL LR
#
1
1 TOPO 4835.1
50000
50000
4835.1
RR RL LR
#
# Feeds: 28: printing first row only
#
Antenna
Spectral Window
# Receptors
Polarizations
#
1
-1
2
[
R, L]
#
# Antennas: 27:
#
ID
Name Station
Diam.
Long.
Lat.
#
0
1
VLA:W9
25.0 m
-107.37.25.1 +33.53.51.0
#
1
2
VLA:N9
25.0 m
-107.37.07.8 +33.54.19.0
#
2
3
VLA:N3
25.0 m
-107.37.06.3 +33.54.04.8
#
3
4
VLA:N5
25.0 m
-107.37.06.7 +33.54.08.0
#
4
5
VLA:N2
25.0 m
-107.37.06.2 +33.54.03.5
#
5
6
VLA:E1
25.0 m
-107.37.05.7 +33.53.59.2
#
6
7
VLA:E2
25.0 m
-107.37.04.4 +33.54.01.1
#
7
8
VLA:N8
25.0 m
-107.37.07.5 +33.54.15.8
#
8
9
VLA:E8
25.0 m
-107.36.48.9 +33.53.55.1
#
9
10
VLA:W3
25.0 m
-107.37.08.9 +33.54.00.1
#
10
11
VLA:N1
25.0 m
-107.37.06.0 +33.54.01.8
#
11
12
VLA:E6
25.0 m
-107.36.55.6 +33.53.57.7
#
12
13
VLA:W7
25.0 m
-107.37.18.4 +33.53.54.8
#
13
14
VLA:E4
25.0 m
-107.37.00.8 +33.53.59.7
#
14
15
VLA:N7
25.0 m
-107.37.07.2 +33.54.12.9
#
15
16
VLA:W4
25.0 m
-107.37.10.8 +33.53.59.1
#
16
17
VLA:W5
25.0 m
-107.37.13.0 +33.53.57.8
#
17
18
VLA:N6
25.0 m
-107.37.06.9 +33.54.10.3
#
18
19
VLA:E7
25.0 m
-107.36.52.4 +33.53.56.5
#
19
20
VLA:E9
25.0 m
-107.36.45.1 +33.53.53.6
#
21
22
VLA:W8
25.0 m
-107.37.21.6 +33.53.53.0
#
22
23
VLA:W6
25.0 m
-107.37.15.6 +33.53.56.4
#
23
24
VLA:W1
25.0 m
-107.37.05.9 +33.54.00.5
#
24
25
VLA:W2
25.0 m
-107.37.07.4 +33.54.00.9
#
25
26
VLA:E5
25.0 m
-107.36.58.4 +33.53.58.8
422
LL
LL
APPENDIX F. APPENDIX: ANNOTATED EXAMPLE SCRIPTS
#
26
27
VLA:N4
#
27
28
VLA:E3
#
# Tables:
#
MAIN
#
ANTENNA
#
DATA_DESCRIPTION
#
DOPPLER
#
FEED
#
FIELD
#
FLAG_CMD
#
FREQ_OFFSET
#
HISTORY
#
OBSERVATION
#
POINTING
#
POLARIZATION
#
PROCESSOR
#
SOURCE
#
SPECTRAL_WINDOW
#
STATE
#
SYSCAL
#
WEATHER
25.0 m
25.0 m
-107.37.06.5
-107.37.02.8
2021424
28
2
<absent>
28
13
<empty>
<absent>
7058
1
2604
1
<empty>
<empty>
2
<empty>
<absent>
<absent>
rows
rows
rows
+33.54.06.1
+33.54.00.5
rows
rows
rows
row
rows
row
(see FIELD)
rows
#
#=====================================================================
# Data Examination and Flagging
#=====================================================================
#
# Use Plotxy to interactively flag the data
#
print ’--Plotxy--’
default(’plotxy’)
print "Now we use plotxy to examine and interactively flag data"
vis = msfile
# The fields we are interested in: 1331+305,JUPITER,0137+331
selectdata = True
# First we do the primary calibrator
field = ’1331+305’
# Plot only the RR and LL for now
correlation = ’RR LL’
# As of 2.3.0 (Patch 3) you can extend the flags to the cross-correlations
# But this slows things down immensely
#extendflag = T
#extendcorr = ’all’
423
APPENDIX F. APPENDIX: ANNOTATED EXAMPLE SCRIPTS
# Plot amplitude vs. uvdist
xaxis = ’uvdist’
yaxis = ’amp’
multicolor = ’both’
# Use the field name as the title
selectplot = True
title = field+" "
iteration = ’’
plotxy()
print ""
print "-----------------------------------------------------"
print "Plotxy"
print "Showing 1331+305 RR LL for all antennas"
print "Use MarkRegion then draw boxes around points to flag"
print "You can use ESC to drop last drawn box"
print "When happy with boxes, hit Flag to flag"
print "You can repeat as necessary"
print ""
#print "NOTE: These flags will extend to the RL LR cross-hands"
#print "Because of this the flagging will be slower than otherwise"
# Pause script if you are running in scriptmode
if scriptmode:
user_check=raw_input(’Return to continue script\n’)
# You can also use flagdata to do this non-interactively
# (see below)
# Now look at the cross-polar products
correlation = ’RL LR’
extendflag = F
plotxy()
print
print
print
print
""
"-----------------------------------------------------"
"Looking at RL LR"
"Now flag any remaining bad data here"
# Pause script if you are running in scriptmode
if scriptmode:
user_check=raw_input(’Return to continue script\n’)
#--------------------------------------------------------------------# Now do calibrater 0137+331
field = ’0137+331’
correlation = ’RR LL’
424
APPENDIX F. APPENDIX: ANNOTATED EXAMPLE SCRIPTS
xaxis = ’uvdist’
spw = ’’
iteration = ’’
antenna = ’’
# As of 2.3.0 (Patch 3) you can extend the flags to the cross-correlations
# But this slows things down immensely
#extendflag = T
#extendcorr = ’all’
title = field+"
"
plotxy()
# You’ll see a bunch of bad data along the bottom near zero amp
# Draw a box around some of it and use Locate
# Looks like much of it is Antenna 9 (ID=8) in spw=1
print
print
print
print
print
print
print
""
"-----------------------------------------------------"
"Plotting 0137+331 RR LL all antennas"
"You see bad data along bottom"
"Mark a box around a bit of it and hit Locate"
"Look in logger to see what it is"
"You see much is Antenna 9 (ID=8) in spw 1"
# Pause script if you are running in scriptmode
if scriptmode:
user_check=raw_input(’Return to continue script\n’)
xaxis = ’time’
spw = ’1’
correlation = ’’
extendflag = F
# Note that the strings like antenna=’9’ first try to match the
# NAME which we see in listobs was the number ’9’ for ID=8.
# So be careful here (why naming antennas as numbers is bad).
antenna = ’9’
plotxy()
# YES! the last 4 scans are bad.
print
print
print
print
Box ’em and flag.
""
"-----------------------------------------------------"
"Plotting vs. time antenna=’9’ and spw=’1’ "
"Box up last 4 scans which are bad and Flag"
# Pause script if you are running in scriptmode
if scriptmode:
425
APPENDIX F. APPENDIX: ANNOTATED EXAMPLE SCRIPTS
user_check=raw_input(’Return to continue script\n’)
# Go back and clean up
xaxis = ’uvdist’
spw = ’’
antenna = ’’
correlation = ’RR LL’
# Note that RL,LR are too weak to clip on.
# As of 2.3.0 (Patch 3) you can extend the flags to the cross-correlations
# But this slows things down immensely
#extendflag = T
#extendcorr = ’all’
plotxy()
# Box up the bad low points (basically a clip below 0.52) and flag
print ""
print "-----------------------------------------------------"
print "Back to all data"
print "Clean up remaining bad points"
print ""
#print "NOTE: These flags will extend to the RL LR cross-hands"
#print "Because of this the flagging will be slower than otherwise"
# Pause script if you are running in scriptmode
if scriptmode:
user_check=raw_input(’Return to continue script\n’)
#--------------------------------------------------------------------# Finally, do JUPITER
field = ’JUPITER’
correlation = ’RR LL’
iteration = ’’
xaxis = ’uvdist’
title = field+"
"
plotxy()
# Here you will see that the final scan at 22:00:00 UT is bad
# Draw a box around it and flag it!
print
print
print
print
print
print
""
"-----------------------------------------------------"
"Now plot JUPITER versus uvdist"
"Lots of bad stuff near bottom"
"Lets go and find it - try Locate"
"Looks like lots of different antennas but at same time"
426
APPENDIX F. APPENDIX: ANNOTATED EXAMPLE SCRIPTS
# Pause script if you are running in scriptmode
if scriptmode:
user_check=raw_input(’Return to continue script\n’)
correlation = ’’
extendflag = F
xaxis = ’time’
plotxy()
# Here you will see that the final scan at 22:00:00 UT is bad
# Draw a box around it and flag it!
print
print
print
print
""
"-----------------------------------------------------"
"Now plotting vs. time"
"See bad scan at end - flag it!"
# Pause script if you are running in scriptmode
if scriptmode:
user_check=raw_input(’Return to continue script\n’)
# Now look at whats left
correlation = ’RR LL’
# As of 2.3.0 (Patch 3) you can extend the flags to the cross-correlations
# But this slows things down immensely
#extendflag = T
#extendcorr = ’all’
xaxis = ’uvdist’
spw = ’1’
antenna = ’’
iteration = ’antenna’
plotxy()
# As you step through, you will see that Antenna 9 (ID=8) is often
# bad in this spw. If you box and do Locate (or remember from
# 0137+331) its probably a bad time.
print
print
print
print
print
print
print
""
"-----------------------------------------------------"
"Looking now at SPW 1"
"Now we set iteration to Antenna"
"Step through antennas with Next"
"See bad Antenna 9 (ID 8) as in 0137+331"
"Do not flag yet, we will isolate this next"
# Pause script if you are running in scriptmode
if scriptmode:
427
APPENDIX F. APPENDIX: ANNOTATED EXAMPLE SCRIPTS
user_check=raw_input(’Return to continue script\n’)
# The easiset way to kill it:
antenna = ’9’
iteration = ’’
xaxis = ’time’
correlation = ’’
extendflag = F
plotxy()
# Draw a box around all points in the last bad scans and flag ’em!
print
print
print
print
""
"-----------------------------------------------------"
"Now plotting vs. time antenna 9 spw 1"
"Box up the bad scans and Flag"
# Pause script if you are running in scriptmode
if scriptmode:
user_check=raw_input(’Return to continue script\n’)
# Now clean up the rest
xaxis = ’uvdist’
correlation = ’RR LL’
# As of 2.3.0 (Patch 3) you can extend the flags to the cross-correlations
# But this slows things down immensely
#extendflag = T
#extendcorr = ’all’
antenna = ’’
spw = ’’
# You will be drawing many tiny boxes, so remember you can
# use the ESC key to get rid of the most recent box if you
# make a mistake.
plotxy()
# Note that the end result is we’ve flagged lots of points
# in RR and LL. We will rely upon imager to ignore the
# RL LR for points with RR LL flagged!
print
print
print
print
print
print
print
""
"-----------------------------------------------------"
"Final cleanup of JUPITER data"
"Back to uvdist plot, see remaining bad data"
"You can draw little boxes around the outliers and Flag"
"Depends how patient you are in drawing boxes!"
"Could also use Locate to find where they come from"
428
APPENDIX F. APPENDIX: ANNOTATED EXAMPLE SCRIPTS
print ""
#print "NOTE: These flags will extend to the RL LR cross-hands"
#print "Because of this the flagging will be slower than otherwise"
# Pause script if you are running in scriptmode
if scriptmode:
user_check=raw_input(’Return to continue script\n’)
print "Done with plotxy!"
#
#=====================================================================
#
# Use Flagmanager to save a copy of the flags so far
#
print ’--Flagmanager--’
default(’flagmanager’)
print "Now will use flagmanager to save a copy of the flags we just made"
print "These are named xyflags"
vis = msfile
mode = ’save’
versionname = ’xyflags’
comment = ’Plotxy flags’
merge = ’replace’
flagmanager()
#=====================================================================
#
# Use Flagmanager to list all saved versions
#
print ’--Flagmanager--’
default(’flagmanager’)
print "Now will use flagmanager to list all the versions we saved"
vis = msfile
mode = ’list’
flagmanager()
#
# Done Flagging
print ’--Done with flagging--’
#
#=====================================================================
# Calibration
#=====================================================================
429
APPENDIX F. APPENDIX: ANNOTATED EXAMPLE SCRIPTS
#
# Set the fluxes of the primary calibrator(s)
#
print ’--Setjy--’
default(’setjy’)
print "Use setjy to set flux of 1331+305 (3C286)"
vis = msfile
#
# 1331+305 = 3C286 is our primary calibrator
field = ’1331+305’
# Setjy knows about this source so we dont need anything more
setjy()
#
# You should see something like this in the logger and casapy.log file:
#
# 1331+305 spwid= 0 [I=7.462, Q=0, U=0, V=0] Jy, (Perley-Taylor 99)
# 1331+305 spwid= 1 [I=7.51, Q=0, U=0, V=0] Jy, (Perley-Taylor 99)
#
print "Look in logger for the fluxes (should be 7.462 and 7.510 Jy)"
#
#=====================================================================
#
# Initial gain calibration
#
print ’--Gaincal--’
default(’gaincal’)
print "Solve for antenna gains on 1331+305 and 0137+331"
print "We have 2 single-channel continuum spw"
print "Do not want bandpass calibration"
vis = msfile
# set the name for the output gain caltable
caltable = gtable
print "Output gain cal table will be "+gtable
# Gain calibrators are 1331+305 and 0137+331 (FIELD_ID 7 and 0)
# We have 2 IFs (SPW 0,1) with one channel each
# selection is via the field and spw strings
field = ’1331+305,0137+331’
430
APPENDIX F. APPENDIX: ANNOTATED EXAMPLE SCRIPTS
spw = ’’
# a-priori calibration application
gaincurve = usegaincurve
opacity = gainopacity
# scan-based G solutions for both amplitude and phase
gaintype = ’G’
calmode = ’ap’
# one solution per scan
solint = ’inf’
combine = ’’
# do not apply parallactic angle correction (yet)
parang = False
# reference antenna
refant = calrefant
# minimum SNR 3
minsnr = 3
gaincal()
#
#=====================================================================
#
# Bootstrap flux scale
#
print ’--Fluxscale--’
default(’fluxscale’)
print "Use fluxscale to rescale gain table to make new one"
vis = msfile
# set the name for the output rescaled caltable
fluxtable = ftable
print "Output scaled gain cal table is "+ftable
# point to our first gain cal table
caltable = gtable
# we will be using 1331+305 (the source we did setjy on) as
# our flux standard reference
reference = ’1331+305’
# we want to transfer the flux to our other gain cal source 0137+331
# to bring its gain amplitues in line with the absolute scale
431
APPENDIX F. APPENDIX: ANNOTATED EXAMPLE SCRIPTS
transfer = ’0137+331’
fluxscale()
# You should see in the logger something like:
#Flux density for 0137+331 in SpW=0 is:
#
5.42575 +/- 0.00285011 (SNR = 1903.7, nAnt= 27)
#Flux density for 0137+331 in SpW=1 is:
#
5.46569 +/- 0.00301326 (SNR = 1813.88, nAnt= 27)
#
#--------------------------------------------------------------------# Plot calibration
#
print ’--PlotCal--’
default(’plotcal’)
showgui = True
caltable = ftable
multiplot = True
yaxis = ’amp’
showgui = True
plotcal()
print
print
print
print
""
"-------------------------------------------------"
"Plotcal"
"Looking at amplitude in cal-table "+caltable
# Pause script if you are running in scriptmode
if scriptmode:
user_check=raw_input(’Return to continue script\n’)
#
# Now go back and plot to file
#
showgui = False
yaxis = ’amp’
#figfile = caltable + ’.plotcal.amp.png’
#print "Plotting calibration to file "+figfile
#saveinputs(’plotcal’,caltable.plotcal.amp.saved’)
#plotcal()
yaxis = ’phase’
#figfile = caltable + ’.plotcal.phase.png’
432
APPENDIX F. APPENDIX: ANNOTATED EXAMPLE SCRIPTS
#print "Plotting calibration to file "+figfile
#saveinputs(’plotcal’,caltable.plotcal.phase.saved’)
#plotcal()
#
#=====================================================================
# Polarization Calibration
#=====================================================================
#
if (dopolcal):
print ’--Polcal (D)--’
default(’polcal’)
print "Solve for polarization leakage on 0137+331"
print "Pretend it has unknown polarization"
vis = msfile
# Start with the un-fluxscaled gain table
gaintable = gtable
# use settings from gaincal
gaincurve = usegaincurve
opacity = gainopacity
# Output table
caltable = ptable
# Use a 3C48 tracked through a range of PA
field = ’0137+331’
spw = ’’
# No need for further selection
selectdata=False
# Polcal mode (D+QU = unknown pol for D)
poltype = ’D+QU’
# One solution for entire dataset
solint = ’inf’
combine = ’scan’
# reference antenna
refant = calrefant
# minimum SNR 3
minsnr = 3
#saveinputs(’polcal’,calprefix+’.polcal.saved’)
polcal()
433
APPENDIX F. APPENDIX: ANNOTATED EXAMPLE SCRIPTS
#=====================================================================
#
# List polcal solutions
#
print ’--Listcal (PolD)--’
listfile = caltable + ’.list’
print "Listing calibration to file "+listfile
listcal()
#=====================================================================
#
# Plot polcal solutions
#
print ’--Plotcal (PolD)--’
iteration = ’’
showgui = False
xaxis = ’antenna’
yaxis = ’amp’
showgui = True
figfile = ’’
plotcal()
print "These are the amplitudes of D-terms versus antenna"
# Pause script if you are running in scriptmode
if scriptmode:
user_check=raw_input(’Return to continue script\n’)
# Now plot to files
showgui = False
#figfile = caltable + ’.plotcal.antamp.png’
#print "Plotting calibration to file "+figfile
#saveinputs(’plotcal’,caltable+’.plotcal.antamp.saved’)
#plotcal()
xaxis = ’antenna’
yaxis = ’phase’
#figfile = caltable + ’.plotcal.antphase.png’
#print "Plotting calibration to file "+figfile
#saveinputs(’plotcal’,caltable+’.plotcal.antphase.saved’)
#plotcal()
434
APPENDIX F. APPENDIX: ANNOTATED EXAMPLE SCRIPTS
xaxis = ’antenna’
yaxis = ’snr’
#figfile = caltable + ’.plotcal.antsnr.png’
#print "Plotting calibration to file "+figfile
#saveinputs(’plotcal’,caltable+’.plotcal.antsnr.saved’)
#plotcal()
xaxis = ’real’
yaxis = ’imag’
#figfile = caltable + ’.plotcal.reim.png’
#print "Plotting calibration to file "+figfile
#saveinputs(’plotcal’,caltable+’.plotcal.reim.saved’)
#plotcal()
#=====================================================================
# Do Chi (X) pol angle calibration
#=====================================================================
# First set the model
print ’--Setjy--’
default(’setjy’)
vis = msfile
print "Use setjy to set IQU fluxes of "+polxfield
field = polxfield
for spw in usespwlist:
fluxdensity = polxiquv[spw]
#saveinputs(’setjy’,calprefix+’.setjy.polspw.’+spw+’.saved’)
setjy()
#
# Polarization (X-term) calibration
#
print ’--PolCal (X)--’
default(’polcal’)
print "Polarization R-L Phase Calibration (linear approx)"
vis = msfile
# Start with the G and D tables
gaintable = [gtable,ptable]
# use settings from gaincal
gaincurve = usegaincurve
opacity = gainopacity
435
APPENDIX F. APPENDIX: ANNOTATED EXAMPLE SCRIPTS
# Output table
caltable = xtable
# previously set with setjy
field = polxfield
spw = ’’
selectdata=False
# Solve for Chi
poltype = ’X’
solint = ’inf’
combine = ’scan’
# reference antenna
refant = calrefant
# minimum SNR 3
minsnr = 3
#saveinputs(’polcal’,calprefix+’.polcal.X.saved’)
polcal()
#=====================================================================
# Apply the Calibration
#=====================================================================
#
# Interpolate the gains onto Jupiter (and others)
#
# print ’--Accum--’
# default(’accum’)
#
# print "This will interpolate the gains onto Jupiter"
#
# vis = msfile
#
# tablein = ’’
# incrtable = ftable
# calfield = ’1331+305, 0137+331’
#
# # set the name for the output interpolated caltable
# caltable = atable
#
# print "Output cumulative gain table will be "+atable
#
# # linear interpolation
# interp = ’linear’
#
# # make 10s entries
# accumtime = 10.0
#
436
APPENDIX F. APPENDIX: ANNOTATED EXAMPLE SCRIPTS
# accum()
#
# NOTE: bypassing this during testing
atable = ftable
# #=====================================================================
#
# Correct the data
# (This will put calibrated data into the CORRECTED_DATA column)
#
print ’--ApplyCal--’
default(’applycal’)
print "This will apply the calibration to the DATA"
print "Fills CORRECTED_DATA"
vis = msfile
# Start with the interpolated fluxscale/gain table
gaintable = [atable,ptable,xtable]
# use settings from gaincal
gaincurve = usegaincurve
opacity = gainopacity
# select the fields
field = ’1331+305,0137+331,JUPITER’
spw = ’’
selectdata = False
# IMPORTANT set parang=True for polarization
parang = True
# do not need to select subset since we did accum
# (note that correct only does ’nearest’ interp)
gainfield = ’’
applycal()
#
#=====================================================================
#
# Now split the Jupiter target data
#
print ’--Split Jupiter--’
default(’split’)
vis = msfile
# Now we write out the corrected data to a new MS
437
APPENDIX F. APPENDIX: ANNOTATED EXAMPLE SCRIPTS
# Select the Jupiter field
field = srcname
spw = ’’
# pick off the CORRECTED_DATA column
datacolumn = ’corrected’
# Make an output vis file
outputvis = srcsplitms
print "Split "+field+" data into new ms "+srcsplitms
split()
# Also split out 0137+331 as a check
field = calname
outputvis = calsplitms
print "Split "+field+" data into new ms "+calsplitms
split()
#=====================================================================
# Force scratch column creation so plotxy will work
#
vis = srcsplitms
clearcal()
vis = calsplitms
clearcal()
#=====================================================================
# Use Plotxy to look at the split calibrated data
#
print ’--Plotxy--’
default(’plotxy’)
selectdata = True
correlation = ’RR LL’
xaxis = ’uvdist’
datacolumn = ’data’
multicolor = ’both’
iteration = ’’
selectplot = True
field = ’JUPITER’
#vis = srcsplitms
#interactive = True
#yaxis = ’amp’
#title = field+" "
438
APPENDIX F. APPENDIX: ANNOTATED EXAMPLE SCRIPTS
#
# Plotxy interactively if desired
#plotxy()
#
#print ""
#print "-----------------------------------------------------"
#print "Plotting JUPITER corrected visibilities"
#print "Look for outliers"
# Pause script if you are running in scriptmode
#if scriptmode:
#
user_check=raw_input(’Return to continue script\n’)
#
# Now go back and plot to files
interactive = False
#
# First the target
#
vis = srcsplitms
field = srcname
yaxis = ’amp’
# Use the field name as the title
title = field+" "
#figfile = vis + ’.plotxy.amp.png’
#print "Plotting to file "+figfile
#saveinputs(’plotxy’,vis+’.plotxy.amp.saved’)
#plotxy()
yaxis = ’phase’
# Use the field name as the title
#figfile = vis + ’.plotxy.phase.png’
#print "Plotting to file "+figfile
#saveinputs(’plotxy’,vis+’.plotxy.phase.saved’)
#plotxy()
#
# Now
#
vis =
field
yaxis
# Use
title
the calibrator
calsplitms
= calname
= ’amp’
the field name as the title
= field+" "
#figfile = vis + ’.plotxy.amp.png’
#print "Plotting to file "+figfile
#saveinputs(’plotxy’,vis+’.plotxy.amp.saved’)
#plotxy()
439
APPENDIX F. APPENDIX: ANNOTATED EXAMPLE SCRIPTS
yaxis = ’phase’
#figfile = vis + ’.plotxy.phase.png’
#print "Plotting to file "+figfile
#saveinputs(’plotxy’,vis+’.plotxy.phase.saved’)
#plotxy()
print ’Calibration completed’
#
#=====================================================================
#
# Intensity Imaging/Selfcal
#
#=====================================================================
#
# Make the scratch columns in the split ms
#
print ’--Clearcal--’
default(’clearcal’)
vis = srcsplitms
clearcal()
print "Created scratch columns for MS "+vis
print ""
#
#=====================================================================
# FIRST CLEAN / SELFCAL CYCLE
#=====================================================================
#
# Now clean an image of Jupiter
# NOTE: this uses the new combined invert/clean/mosaic task Patch 2
#
print ’--Clean 1--’
default(’clean’)
# Pick up our split source data
vis = srcsplitms
# Make an image root file name
imagename = imname1
print "Output images will be prefixed with "+imname1
# Set up the output continuum image (single plane mfs)
mode = ’mfs’
stokes = ’I’
print "Will be a single MFS continuum image"
440
APPENDIX F. APPENDIX: ANNOTATED EXAMPLE SCRIPTS
# NOTE: current version field=’’ doesnt work
field = ’*’
# Combine all spw
spw = ’’
# Imaging mode params
psfmode = clnalg
imagermode = clnmode
# Imsize and cell
imsize = clnimsize
cell = clncell
# NOTE: will eventually have an imadvise task to give you this
# information
# Standard gain factor 0.1
gain = 0.1
# Fix maximum number of iterations and threshold
niter = clniter
threshold = clnthreshold
# Note - we can change niter and threshold interactively
# during clean
# Set up the weighting
# Use Briggs weighting (a moderate value, on the uniform side)
weighting = ’briggs’
robust = 0.5
# No clean mask or box
mask = ’’
# Use interactive clean mode
interactive = True
# Moderate number of iter per interactive cycle
npercycle = 100
saveinputs(’clean’,imagename+’.clean.saved’)
clean()
#
#
#
#
#
#
When the interactive clean window comes up, use the right-mouse
to draw rectangles around obvious emission double-right-clicking
inside them to add to the flag region. You can also assign the
right-mouse to polygon region drawing by right-clicking on the
polygon drawing icon in the toolbar. When you are happy with
the region, click ’Done Flagging’ and it will go and clean another
441
APPENDIX F. APPENDIX: ANNOTATED EXAMPLE SCRIPTS
# 100 iterations.
When done, click ’Stop’.
print
print
print
print
print
print
print
""
"----------------------------------------------------"
"Clean"
"Final clean model is "+clnmodel1
"Final restored clean image is "+clnimage1
"The clean residual image is "+clnresid1
"Your final clean mask is "+clnmask1
print
print
print
print
print
print
print
print
print
print
""
"This is the final restored clean image in the viewer"
"Zoom in and set levels to see faint emission"
"Use rectangle drawing tool to box off source"
"Double-click inside to print statistics"
"Move box on-source and get the max"
"Calcualte DynRange = MAXon/RMSoff"
"I got 1.060/0.004 = 270"
"Still not as good as it can be - lets selfcal"
"Close viewer panel when done"
#
#--------------------------------------------------------------------#
# If you did not do interactive clean, bring up viewer manually
viewer(clnimage1,’image’)
# Pause script if you are running in scriptmode
if scriptmode:
user_check=raw_input(’Return to continue script\n’)
#
#
#
#
#
#
#
#
#
#
#
#
#
#
#
#
#
#
#
#
You can use the right-mouse to draw a box in the lower right
corner of the image away from emission, the double-click inside
to bring up statistics. Use the right-mouse to grab this box
and move it up over Jupiter and double-click again. You should
see stuff like this in the terminal:
jupiter6cm.demo.clean1.image
(Jy/beam)
n
4712
Std Dev
0.003914
RMS
0.003927
Mean
0.0003205
Variance
1.532e-05
Sum
1.510
Flux
0.09417
Med |Dev|
0.002646
IntQtlRng
0.005294
Median
0.0001885
Min
-0.01125
Max
0.01503
Std Dev
0.1007
RMS
0.1027
Mean
0.02023
Variance
0.01015
Sum
73.63
On Jupiter:
n
3640
442
APPENDIX F. APPENDIX: ANNOTATED EXAMPLE SCRIPTS
#
#
#
#
#
#
#
Flux
4.592
Med |Dev|
0.003239
IntQtlRng
0.007120
Median
0.0001329
Min
-0.01396
Max
1.060
Estimated dynamic range = 1.060 / 0.003927 = 270 (poor)
Note that the exact numbers you get will depend on how deep you
take the interactive clean and how you draw the box for the stats.
#=====================================================================
#
# Do some non-interactive image statistics
print ’--Imstat--’
default(’imstat’)
imagename = clnimage1
on_statistics1 = imstat()
# Now do stats in the lower right corner of the image
# remember clnimsize = [288,288]
box = ’216,1,287,72’
off_statistics1 = imstat()
# Pull the max and rms from the clean image
thistest_immax=on_statistics1[’max’][0]
print ’ Found : Max in image = ’,thistest_immax
thistest_imrms=off_statistics1[’rms’][0]
print ’ Found : rms in image = ’,thistest_imrms
print ’ Clean image Dynamic Range = ’,thistest_immax/thistest_imrms
print ’’
#
#--------------------------------------------------------------------#
# Self-cal using clean model
#
# Note: clean will have left FT of model in the MODEL_DATA column
# If you’ve done something in between, can use the ft task to
# do this manually.
#
print ’--SelfCal 1--’
default(’gaincal’)
vis = srcsplitms
print "Will self-cal using MODEL_DATA left in MS by clean"
# New gain table
caltable = selfcaltab1
print "Will write gain table "+selfcaltab1
# Don’t need a-priori cals
443
APPENDIX F. APPENDIX: ANNOTATED EXAMPLE SCRIPTS
selectdata = False
gaincurve = False
opacity = 0.0
# This choice seemed to work
refant = calrefant
# Do amp and phase
gaintype = ’G’
calmode = ’ap’
# Do 30s solutions with SNR>1
solint = 30.0
minsnr = 1.0
print "Calibrating amplitudes and phases on 30s timescale"
# Do not need to normalize (let gains float)
solnorm = False
gaincal()
#
#--------------------------------------------------------------------# It is useful to put this up in plotcal
#
#
print ’--PlotCal--’
default(’plotcal’)
caltable = selfcaltab1
multiplot = True
yaxis = ’amp’
plotcal()
print
print
print
print
""
"-------------------------------------------------"
"Plotcal"
"Looking at amplitude in self-cal table "+caltable
# Pause script if you are running in scriptmode
if scriptmode:
user_check=raw_input(’Return to continue script\n’)
yaxis = ’phase’
plotcal()
print ""
print "-------------------------------------------------"
print "Plotcal"
444
APPENDIX F. APPENDIX: ANNOTATED EXAMPLE SCRIPTS
print "Looking at phases in self-cal table "+caltable
#
# Pause script if you are running in scriptmode
if scriptmode:
user_check=raw_input(’Return to continue script\n’)
#
#--------------------------------------------------------------------#
# Correct the data (no need for interpolation this stage)
#
print ’--ApplyCal--’
default(’applycal’)
vis = srcsplitms
print "Will apply self-cal table to over-write CORRECTED_DATA in MS"
gaintable = selfcaltab1
gaincurve = False
opacity = 0.0
field = ’’
spw = ’’
selectdata = False
calwt = True
applycal()
# Self-cal is now in CORRECTED_DATA column of split ms
#=====================================================================
# Use Plotxy to look at the self-calibrated data
#
#print ’--Plotxy--’
#default(’plotxy’)
#
#vis = srcsplitms
#selectdata = True
#field = ’JUPITER’
#correlation = ’RR LL’
#xaxis = ’uvdist’
#yaxis = ’amp’
#datacolumn = ’corrected’
#multicolor = ’both’
#selectplot = True
#title = field+" "
#
#iteration = ’’
#
445
APPENDIX F. APPENDIX: ANNOTATED EXAMPLE SCRIPTS
#plotxy()
#
#print ""
#print "-----------------------------------------------------"
#print "Plotting JUPITER self-corrected visibilities"
#print "Look for outliers, and you can flag them"
# Pause script if you are running in scriptmode
#if scriptmode:
#
user_check=raw_input(’Return to continue script\n’)
#
#
#=====================================================================
# SECOND CLEAN / SELFCAL CYCLE
#=====================================================================
#
print ’--Clean 2--’
default(’clean’)
print "Now clean on self-calibrated data"
vis = srcsplitms
imagename = imname2
field = ’*’
spw = ’’
mode = ’mfs’
gain = 0.1
# Imaging mode params
psfmode = clnalg
imagermode = clnmode
imsize = clnimsize
cell = clncell
niter = clniter
threshold = clnthreshold
weighting = ’briggs’
robust = 0.5
mask = ’’
interactive = True
npercycle = 100
saveinputs(’clean’,imagename+’.clean.saved’)
clean()
print ""
print "----------------------------------------------------"
446
APPENDIX F. APPENDIX: ANNOTATED EXAMPLE SCRIPTS
print
print
print
print
print
"Clean"
"Final clean model is "+clnmodel2
"Final restored clean image is "+clnimage2
"The clean residual image is "+clnresid2
"Your final clean mask is "+clnmask2
print
print
print
print
print
print
print
print
print
print
print
""
"This is the final restored clean image in the viewer"
"Zoom in and set levels to see faint emission"
"Use rectangle drawing tool to box off source"
"Double-click inside to print statistics"
"Move box on-source and get the max"
"Calculate DynRange = MAXon/RMSoff"
"This time I got 1.050 / 0.001 = 1050 (better)"
"Still not as good as it can be - you can try selfcal again"
"We will stop here"
"Close viewer panel when done"
#
#--------------------------------------------------------------------#
# If you did not do interactive clean, bring up viewer manually
viewer(clnimage2,’image’)
# Pause script if you are running in scriptmode
if scriptmode:
user_check=raw_input(’Return to continue script\n’)
# jupiter6cm.demo.clean2.image
(Jy/beam)
#
# n
Std Dev
RMS
Mean
Variance
# 5236
0.001389
0.001390
3.244e-05
1.930e-06
#
# Flux
Med |Dev|
IntQtlRng
Median
Min
# 0.01060
0.0009064
0.001823
-1.884e-05 -0.004015
#
#
# On Jupiter:
#
# n
Std Dev
RMS
Mean
Variance
# 5304
0.08512
0.08629
0.01418
0.007245
#
# Flux
Med |Dev|
IntQtlRng
Median
Min
# 4.695
0.0008142
0.001657
0.0001557
-0.004526
#
# Estimated dynamic range = 1.076 / 0.001389 = 775 (better)
#
# Note that the exact numbers you get will depend on how deep
# take the interactive clean and how you draw the box for the
#
print ""
Sum
0.1699
Max
0.004892
Sum
75.21
Max
1.076
you
stats.
447
APPENDIX F. APPENDIX: ANNOTATED EXAMPLE SCRIPTS
print "--------------------------------------------------"
print "After this script is done you can continue on with"
print "more self-cal, or try different cleaning options"
#
#=====================================================================
# Image Analysis
#=====================================================================
#
# Can do some image statistics if you wish
print ’--Imstat (Cycle 2)--’
default(’imstat’)
imagename = clnimage2
on_statistics2 = imstat()
# Now do stats in the lower right corner of the image
# remember clnimsize = [288,288]
box = ’216,1,287,72’
off_statistics2 = imstat()
# Pull the max and rms from the clean image
thistest_immax=on_statistics2[’max’][0]
print ’ Found : Max in image = ’,thistest_immax
thistest_imrms=off_statistics2[’rms’][0]
print ’ Found : rms in image = ’,thistest_imrms
print ’ Clean image Dynamic Range = ’,thistest_immax/thistest_imrms
print ’’
#=====================================================================
#
# Print results and regression versus previous runs
#
print ""
print ’ Final Jupiter results ’
print ’ ===================== ’
print ’’
# Pull the max and rms from the clean image
thistest_immax=on_statistics2[’max’][0]
oldtest_immax = 1.07732224464
print ’
Clean image ON-SRC max = ’,thistest_immax
print ’
Previously found to be = ’,oldtest_immax
diff_immax = abs((oldtest_immax-thistest_immax)/oldtest_immax)
print ’
Difference (fractional) = ’,diff_immax
print ’’
thistest_imrms=off_statistics2[’rms’][0]
oldtest_imrms = 0.0010449
print ’
Clean image OFF-SRC rms = ’,thistest_imrms
print ’
Previously found to be = ’,oldtest_imrms
diff_imrms = abs((oldtest_imrms-thistest_imrms)/oldtest_imrms)
448
APPENDIX F. APPENDIX: ANNOTATED EXAMPLE SCRIPTS
print ’
print
print
print
print
Difference (fractional) = ’,diff_imrms
’’
’ Final Clean image Dynamic Range = ’,thistest_immax/thistest_imrms
’’
’--- Done with I Imaging and Selfcal---’
#
#=====================================================================
# Polarization Imaging
#=====================================================================
#
print ’--Clean (Polarization)--’
default(’clean’)
print "Now clean polarized data"
vis = srcsplitms
imagename = polimname
field = ’*’
spw = ’’
mode = ’mfs’
gain = 0.1
# Polarization
stokes = ’IQUV’
psfmode = polclnalg
imagermode = polclnmode
niter = clniter
threshold = clnthreshold
imsize = clnimsize
cell = clncell
weighting = ’briggs’
robust = 0.5
interactive = True
npercycle = 100
saveinputs(’clean’,imagename+’.clean.saved’)
clean()
print
print
print
print
""
"----------------------------------------------------"
"Clean"
"Final restored clean image is "+polimage
449
APPENDIX F. APPENDIX: ANNOTATED EXAMPLE SCRIPTS
print "Final clean model is "+polmodel
print "The clean residual image is "+polresid
print "Your final clean mask is "+polmask
#
#=====================================================================
# Image Analysis
#=====================================================================
#
# Polarization statistics
print ’--Final Pol Imstat--’
default(’imstat’)
imagename = polimage
on_statistics = {}
off_statistics = {}
# lower right corner of the image (clnimsize = [288,288])
onbox = ’’
# lower right corner of the image (clnimsize = [288,288])
offbox = ’216,1,287,72’
for stokes in [’I’,’Q’,’U’,’V’]:
box = onbox
on_statistics[stokes] = imstat()
box = offbox
off_statistics[stokes] = imstat()
#
# Peel off some Q and U planes
#
print ’--Immath--’
default(’immath’)
mode = ’evalexpr’
stokes = ’I’
outfile = ipolimage
expr = ’\"’+polimage+’\"’
immath()
print "Created I image "+outfile
stokes = ’Q’
outfile = qpolimage
expr = ’\"’+polimage+’\"’
immath()
print "Created Q image "+outfile
450
APPENDIX F. APPENDIX: ANNOTATED EXAMPLE SCRIPTS
stokes = ’U’
outfile = upolimage
expr = ’\"’+polimage+’\"’
immath()
print "Created U image "+outfile
#
#--------------------------------------------------------------------# Now make POLI and POLA images
#
stokes = ’’
outfile = poliimage
mode = ’poli’
imagename = [qpolimage,upolimage]
# Use our rms above for debiasing
mysigma = 0.5*( off_statistics[’Q’][’rms’][0] + off_statistics[’U’][’rms’][0] )
#sigma = str(mysigma)+’Jy/beam’
# This does not work well yet
sigma = ’0.0Jy/beam’
immath()
print "Created POLI image "+outfile
outfile = polaimage
mode = ’pola’
immath()
print "Created POLA image "+outfile
#
#--------------------------------------------------------------------# Save statistics of these images
default(’imstat’)
imagename = poliimage
stokes = ’’
box = onbox
on_statistics[’POLI’] = imstat()
box = offbox
off_statistics[’POLI’] = imstat()
#
#
#--------------------------------------------------------------------# Display clean I image in viewer but with polarization vectors
#
# If you did not do interactive clean, bring up viewer manually
viewer(polimage,’image’)
print "Displaying pol I now.
You should overlay pola vectors"
451
APPENDIX F. APPENDIX: ANNOTATED EXAMPLE SCRIPTS
print
print
print
print
print
print
print
print
print
print
print
print
452
"Bring up the Load Data panel:"
""
"Use LEL for POLA VECTOR with cut above 6*mysigma in POLI = "+str(6*mysigma)
"For example:"
"\’"+polaimage+"\’[\’"+poliimage+"\’>0.0048]"
""
"In the Data Display Options for the vector plot:"
" Set the x,y increments to 2 (default is 3)"
" Use an extra rotation this 90deg to get B field"
"Note the lengths are all equal. You can fiddle these."
""
"You can also load the poli image as contours"
# Pause script if you are running in scriptmode
if scriptmode:
user_check=raw_input(’Return to continue script\n’)
# NOTE: the LEL will be something like
# ’jupiter6cm.demo.polimg.clean.image.pola’[’jupiter6cm.demo.polimg.clean.image.poli’>0.005]
#
# NOTE: The viewer can take complex images to make Vector plots, although
# the image analysis tasks (and ia tool) cannot yet handle these. But we
# can use the imagepol tool (which is not imported by default) to make
# a complex image of the linear polarized intensity for display.
# See CASA User Reference Manual:
# http://casa.nrao.edu/docs/casaref/imagepol-Tool.html
#
# Make an imagepol tool and open the clean image
potool = casac.homefinder.find_home_by_name(’imagepolHome’)
po = potool.create()
po.open(polimage)
# Use complexlinpol to make a Q+iU image
complexlinpolimage = polimname + ’.cmplxlinpol’
po.complexlinpol(complexlinpolimage)
po.close()
#
#
#
#
#
#
#
You can now display this in the viewer, in particular overlay this
over the intensity raster with the poli contours. The vector lengths
will be proportional to the polarized intensity. You can play with
the Data Display Options panel for vector spacing and length.
You will want to have this masked, like the pola image above, on
the polarized intensity. When you load the image, use the LEL:
’jupiter6cm.demo.polimg.clean.cmplxlinpol’[’jupiter6cm.demo.polimg.clean.image.poli’>0.005]
#=====================================================================
#
# Print results
#
print ""
print ’ Jupiter polarization results ’
APPENDIX F. APPENDIX: ANNOTATED EXAMPLE SCRIPTS
print ’ ============================ ’
print ’’
for stokes in [’I’,’Q’,’U’,’V’,’POLI’]:
print ’’
print ’ =============== ’
print ’’
print ’ Polarization (Stokes ’+stokes+’):’
mymax = on_statistics[stokes][’max’][0]
mymin = on_statistics[stokes][’min’][0]
myrms = off_statistics[stokes][’rms’][0]
absmax = max(mymax,mymin)
mydra = absmax/myrms
print ’
Clean image ON-SRC max = ’,mymax
print ’
Clean image ON-SRC min = ’,mymin
print ’
Clean image OFF-SRC rms = ’,myrms
print ’
Clean image dynamic rng = ’,mydra
print ’--- Done ---’
#
#=====================================================================
F.3
BIMA Mosaic Spectral Imaging
This script analyzes a BIMA SONG mosaic of the galaxy NGC 4826 at 3mm.
The latest version of this script can be found at:
http://casa.nrao.edu/Doc/Scripts/ngc4826_tutorial.py
##########################################################################
#
#
# Demo Script for NGC 4826 (BIMA line data)
#
#
#
# Converted by STM 2008-05-27 (Beta Patch 2.0) new tasking/clean/cal
#
# Updated by
CB 2008-05-30
start from raw data
#
# Updated by
STM 2008-06-01
scriptmode, plotting
#
# Updated by CB,STM 2008-06-02
improvements
#
# Updated by CB,STM 2008-06-03
bigger cube, pbcor
#
# Updated by CB,STM 2008-06-04
pbcor stuff
#
# Updated by CB,STM 2008-06-04
tutorial script
#
# Updated by CB
2008-06-05
small tweaks
#
# Updated by CB,STM 2008-06-12
final revisions (DS)
#
# Updated by STM
2008-06-14
post-school fix
#
# Updated by DP
2009-05-05
pre-Garching
immoments chans
#
# Updated by DP
2009-05-05
messages for flagging
#
# Updated by CB
2009-05-18
pre-Canada
spw fix not needed now
#
453
APPENDIX F. APPENDIX: ANNOTATED EXAMPLE SCRIPTS
# Updated by CB
2009-05-18
immoments axis=spectral #
# Updated by CB
2009-05-19
added restfreq to clean #
# Updated by CB
2009-05-19
removed clearcals
#
#
#
# N4826 - BIMA SONG Data
#
#
#
# This data is from the BIMA Survey of Nearby Galaxies (BIMA SONG)
#
# Helfer, Thornley, Regan, et al., 2003, ApJS, 145, 259
#
# Many thanks to Michele Thornley for providing the data and description #
#
#
# First day of observations only
#
#
#
# Script Notes:
#
#
o The "default" commands are not necessary, but are included
#
#
in case we want to change from function calls to globals
#
#
o This script has some interactive commands, such as with plotxy
#
#
and the viewer. This script will stop and require a
#
#
carriage-return to continue at these points.
#
#
o Sometimes cut-and-paste of a series of lines from this script
#
#
into the casapy terminal will get garbled (usually a single
#
#
dropped character). In this case, try fewer lines, like groups
#
#
of 4-6.
#
#
#
##########################################################################
import os
# Some diagnostic stuff
pl.ion()
pl.clf()
#
##########################################################################
#
# Clear out previous run results
rmtables(’ngc4826.tutorial.*’)
os.system(’rm -rf ngc4826.tutorial.*’)
# Sets a shorthand for the ms, not necessary
prefix=’ngc4826.tutorial’
msfile = prefix + ’.16apr98.ms’
print ’Tutorial Script for BIMASONG NGC4826 Mosaic’
print ’Will do: import, flagging, calibration, imaging’
print ’’
#
##########################################################################
#
#
##########################################################################
#
# N4826 - BIMA SONG Data CO(1-0) 115.2712 GHz
# 16apr98
454
APPENDIX F. APPENDIX: ANNOTATED EXAMPLE SCRIPTS
# source=ngc4826
# phasecal=1310+323
# fluxcal=3c273, Flux = 23 Jy on 16apr98
# passcal= none - data were observed with online bandpass correction.
#
# NOTE: This data has been filled into MIRIAD, line-length correction
# done, and then exported as separate files for each source.
# 3c273 was not line length corrected since it was observed
# for such a short amount of time that it did not need it.
#
# From miriad: source Vlsr = 408; delta V is 20 km/s
#
##########################################################################
# Import and concatenate sources
##########################################################################
#
# USB spectral windows written separately by miriad for 16apr98
# Assumes these are in sub-directory called "fitsfiles" of working directory
print ’--Importuvfits (16apr98)--’
default(’importuvfits’)
print "Starting from the uvfits files exported by miriad"
print "The USB spectral windows were written separately by miriad for 16apr98"
####
####
####
####
We could read in each of the individual fits files as example
below -- this works well if you only have one or two files to
read, but here we have many, so instead we use some useful
pythonease to simplify the commands.
#importuvfits(fitsfile=’fitsfiles/3c273.fits5’, vis=’ngc4826.tutorial.3c273.5.ms’)
#### Tutorial Note: For the loop to work, the high end of range must be
#### 1+ number of actual files.
for i in range(5,9):
importuvfits(fitsfile="fitsfiles/3c273.fits"+str(i),
vis="ngc4826.tutorial.3c273."+str(i)+".ms")
for i in range(9,17):
importuvfits(fitsfile="fitsfiles/1310+323.ll.fits"+str(i),
vis="ngc4826.tutorial.1310+323.ll."+str(i)+".ms")
for i in range(5,9):
importuvfits(fitsfile="fitsfiles/ngc4826.ll.fits"+str(i),
vis="ngc4826.tutorial.ngc4826.ll."+str(i)+".ms")
#
##########################################################################
#
print ’--Concat--’
default(’concat’)
455
APPENDIX F. APPENDIX: ANNOTATED EXAMPLE SCRIPTS
concat(vis=[’ngc4826.tutorial.3c273.5.ms’,
’ngc4826.tutorial.3c273.6.ms’,
’ngc4826.tutorial.3c273.7.ms’,
’ngc4826.tutorial.3c273.8.ms’,
’ngc4826.tutorial.1310+323.ll.9.ms’,
’ngc4826.tutorial.1310+323.ll.10.ms’,
’ngc4826.tutorial.1310+323.ll.11.ms’,
’ngc4826.tutorial.1310+323.ll.12.ms’,
’ngc4826.tutorial.1310+323.ll.13.ms’,
’ngc4826.tutorial.1310+323.ll.14.ms’,
’ngc4826.tutorial.1310+323.ll.15.ms’,
’ngc4826.tutorial.1310+323.ll.16.ms’,
’ngc4826.tutorial.ngc4826.ll.5.ms’,
’ngc4826.tutorial.ngc4826.ll.6.ms’,
’ngc4826.tutorial.ngc4826.ll.7.ms’,
’ngc4826.tutorial.ngc4826.ll.8.ms’],
concatvis=’ngc4826.tutorial.ms’,
freqtol="",dirtol="1arcsec",async=False)
#
##########################################################################
#
# TUTORIAL NOTES:
#
# You can invoke tasks in two ways:
#
# (1) As function calls with arguments as shown above for concat and used
#
extensively in this script, e.g.
#
#
task( par1=val1, par2=val2, ... )
#
#
with parameters set as arguments in the call. Note that in this
#
case, the global parameter values are NOT used or changed, and any
#
task parameters that are not specified as arguments to the call
#
will be defaulted to the task-specific default values (see the
#
"help task" description).
#
# (2) By setting the values of the global parameters and then using the
#
"go" command (if taskname is set) or calling the task with no
#
arguments. For example:
#
#
default task
#
par1 = val1
#
par2 = val2
#
...
#
inp
#
task()
#
#
In this case, the "default" command sets the parmeters to their
#
task defaults, and sets the "taskname" paramter to the task to be
#
run. The "inp" command displays the current values for the task
456
APPENDIX F. APPENDIX: ANNOTATED EXAMPLE SCRIPTS
#
parameters. Then the call with no arguments runs with the globals.
#
#
Warning: "go" does not work inside scripts. See Cookbook.
#
# Using the concat call above as an example, we would do:
#
#default(’concat’)
#
#vis = [’ngc4826.tutorial.3c273.5.ms’,
#
’ngc4826.tutorial.3c273.6.ms’,
#
’ngc4826.tutorial.3c273.7.ms’,
#
’ngc4826.tutorial.3c273.8.ms’,
#
’ngc4826.tutorial.1310+323.ll.9.ms’,
#
’ngc4826.tutorial.1310+323.ll.10.ms’,
#
’ngc4826.tutorial.1310+323.ll.11.ms’,
#
’ngc4826.tutorial.1310+323.ll.12.ms’,
#
’ngc4826.tutorial.1310+323.ll.13.ms’,
#
’ngc4826.tutorial.1310+323.ll.14.ms’,
#
’ngc4826.tutorial.1310+323.ll.15.ms’,
#
’ngc4826.tutorial.1310+323.ll.16.ms’,
#
’ngc4826.tutorial.ngc4826.ll.5.ms’,
#
’ngc4826.tutorial.ngc4826.ll.6.ms’,
#
’ngc4826.tutorial.ngc4826.ll.7.ms’,
#
’ngc4826.tutorial.ngc4826.ll.8.ms’]
#
#concatvis=’ngc4826.tutorial.ms’
#freqtol = ""
#dirtol = "1arcsec"
#async=False
#
#concat()
#
##########################################################################
#
# Fix up the MS
# This ensures that the rest freq will be found for all spws.
# NOTE: STILL NECESSARY IN 2.4
#
# print ’--Fixing up spw rest frequencies in MS--’
vis=’ngc4826.tutorial.ms’
tb.open(vis+’/SOURCE’,nomodify=false)
spwid=tb.getcol(’SPECTRAL_WINDOW_ID’)
#spwid.setfield(-1,int)
# Had to do this for 64bit systems 08-Jul-2008
spwid.setfield(-1,’int32’)
tb.putcol(’SPECTRAL_WINDOW_ID’,spwid)
tb.close()
##########################################################################
# 16 APR Calibration
457
APPENDIX F. APPENDIX: ANNOTATED EXAMPLE SCRIPTS
##########################################################################
#
# List contents of MS
#
print ’--Listobs--’
listobs(vis=’ngc4826.tutorial.ms’)
# Should see the listing included at the end of this script
#
print "There are 3 fields observed in a total of 16 spectral windows"
print "
field=0
3c273
spwids 0,1,2,3
64 chans "
print "
field=1
1310+323 spwids 4,5,6,7,8,9,10,11
32 chans "
print "
field=2~8 NGC4826 spwids 12,13,14,15
64 chans "
print ""
print "See listobs summary in logger"
#
##########################################################################
# Plotting and Flagging
##########################################################################
#
# The plotxy task is the interactive x-y display and flagging GUI
#
print ’--Plotxy--’
default(plotxy)
# Here we will suggest things to plot, and actually only do a few
# (near the end of this task block). If you like you can
# uncomment these when you run this script
#
# First look at amplitude as a funciton of uv-distance using an
# average over all channels for each source.
#
# Interactive plotxy
#plotxy(vis=’ngc4826.tutorial.ms’,xaxis=’uvdist’,yaxis=’amp’,field=’0’,spw=’0~3’,
#
averagemode=’vector’,width=’1000’,
#
selectplot=True,title=’Field 0 SPW 0~3’)
#
# Pause script if you are running in scriptmode
#user_check=raw_input(’Return to continue script\n’)
#
#
#
#
#
#
#
#
#
#
NOTE: width here needs to be larger than combination of all channels
selected with spw and/or field. Since field and spw are unique in this
case, both don’t need to be specified, however plotting is much faster
if you "help it" by selecting both.
Now average over all times across scans but not over channel and
plot versus channel. There are four 64-channel spws set end-to-end
by plotxy You should see bad edge channels in each spw segment We
will flag these (non-interactively) later
458
APPENDIX F. APPENDIX: ANNOTATED EXAMPLE SCRIPTS
# Interactive plotxy
#plotxy(vis=’ngc4826.tutorial.ms’,xaxis=’channel’,yaxis=’amp’,field=’0’,spw=’0~3’,
#
averagemode=’vector’,timebin=’1e7’,crossscans=True,
#
selectplot=True,newplot=False,title=’Field 0 SPW 0~3’)
#
# Pause script if you are running in scriptmode
#user_check=raw_input(’Return to continue script\n’)
# You can also plot versus velocity by setting xaxis=’velocity’
#
# You might do this for all the other spw/field combos
#
# You can also non-interactively plotxy to a file
# (note this works only if iteration is not set)
# Also, see how we use Python variables to make this easier
#
#field = ’0’
#spw = ’0~3’
#figfile = ’ngc4826.tutorial.ms’ + ’.plotxy.’+field+’.spectrum.raw.png’
#plotxy(vis=’ngc4826.tutorial.ms’,xaxis=’velocity’,yaxis=’amp’,field=field,spw=spw,
#
averagemode=’vector’,timebin=’1e7’,crossscans=True,
#
selectplot=True,newplot=False,title=’Field ’+field+’ SPW ’+spw,
#
interactive=False,figfile=figfile)
# Now lets look at the target source, the first of the NGC4826 mosaic fields
# which are 2~8 in this MS.
#
# Since we are plotting versus velocity we can clearly see the bad edge
# channels and the overlap between spw
#
# There is nothing terribly wrong with this data and again we will flag the
# edge channels non-interactively later for consistency.
#
# Normally, if there were obviously bad data, you would flag it here
# before calibration. To do this, hit the Mark Region button, then draw a box around
# some of the moderately high outliers, and then Flag.
#
# But this data is relatively clean, and flagging will not improve results.
#
# Interactive plotxy
plotxy(vis=’ngc4826.tutorial.ms’,xaxis=’velocity’,yaxis=’amp’,field=’2’,spw=’12~15’,
averagemode=’vector’,timebin=’1e7’,crossscans=True,
selectplot=True,newplot=False,title=’Field 2 SPW 12~15’)
print "You could Mark Region around outliers and Flag"
# Pause script if you are running in scriptmode
user_check=raw_input(’Return to continue script\n’)
#
# You could set up a Python loop to do all the N4826 fields, like this:
459
APPENDIX F. APPENDIX: ANNOTATED EXAMPLE SCRIPTS
#
#for fld in range(2,9):
# field = str(fld)
# plotxy(vis=’ngc4826.tutorial.ms’,xaxis=’velocity’,yaxis=’amp’,field=field,spw=spw,
#
averagemode=’vector’,timebin=’1e7’,crossscans=True,
#
selectplot=True,newplot=False,title=’Field ’+field+’ SPW ’+spw)
#
# print "Nominally, Mark Region around outliers and Flag"
# # Pause script if you are running in scriptmode
# user_check=raw_input(’Return to continue script\n’)
# Back to first field.
# You can also have it iterate over baselines, using Next to advance
# Ignore baselines 1:1, 2:2 etc. as they would correspond to autocorrelations
# if they were present (they are not in this dataset)
#
# Interactive plotxy
#plotxy(vis=’ngc4826.tutorial.ms’,xaxis=’channel’,yaxis=’amp’,field=’0’,spw=’0~3’,
#
averagemode=’vector’,timebin=’1e7’,crossscans=True,
#
iteration=’baseline’,
#
selectplot=True,newplot=False,title=’Field 0 SPW 0~3’)
#
# Pause script if you are running in scriptmode
#user_check=raw_input(’Return to continue script\n’)
#
# Finally, look for bad data. Here we look at field 8 w/o averaging
plotxy(vis=’ngc4826.tutorial.ms’,xaxis=’time’,yaxis=’amp’,field=’8’,spw=’12~15’,
selectplot=True,newplot=False,title=’Field 8 SPW 12~15’)
print "You can see some bad data here"
print "Mark Region and Locate, look in logger"
print "This is a correlator glitch in baseline 3-9 at 06:19:30"
print "PLEASE DON\’T FLAG ANYTHING HERE. THE SCRIPT WILL DO IT!"
print "In a normal session you could Mark Region and Flag."
print "Here we will use flagdata instead."
# Pause script if you are running in scriptmode
user_check=raw_input(’Return to continue script\n’)
# If you change xaxis=’channel’ you see its all channels
#
##########################################################################
#
# Flag end channels
#
print ’--Flagdata--’
default(’flagdata’)
print ""
print "Flagging edge channels in all spw"
print " 0~3:0~1;62~63 , 4~11:0~1;30~31, 12~15:0~1;62~63 "
460
APPENDIX F. APPENDIX: ANNOTATED EXAMPLE SCRIPTS
461
print ""
flagdata(vis=’ngc4826.tutorial.ms’, mode=’manualflag’,
spw=’0~3:0;1;62;63,4~11:0;1;30;31,12~15:0;1;62;63’)
#
# Flag correlator glitch
#
print ""
print "Flagging bad correlator field 8 antenna 3&9 spw 15 all channels"
print " timerange 1998/04/16/06:19:00.0~1998/04/16/06:20:00.0"
print ""
flagdata(vis=’ngc4826.tutorial.ms’, mode=’manualflag’, field=’8’, spw=’15’, antenna=’3&9’,
timerange=’1998/04/16/06:19:00.0~1998/04/16/06:20:00.0’)
#
##########################################################################
#
# Some example clean-up editing
# Slightly high almost-edge channel in field=’1’, spw=’4’ (channel 2)
# can be flagged interactively with plotxy.
#
#plotxy(vis=’ngc4826.tutorial.ms’,
#
xaxis=’channel’,yaxis=’amp’,field=’1’,spw=’4’,
#
averagemode=’vector’,timebin=’1e7’,crossscans=True,
#
selectplot=True,newplot=False,title=’Field 1 SPW 4’)
print "Completed pre-calibration flagging"
#
##########################################################################
#
# Use Flagmanager to save a copy of the flags so far
#
print ’--Flagmanager--’
default(’flagmanager’)
print "Now will use flagmanager to save a copy of the flags we just made"
print "These are named myflags"
flagmanager(vis=’ngc4826.tutorial.ms’,mode=’save’,versionname=’myflags’,
comment=’My flags’,merge=’replace’)
# Can also use Flagmanager to list all saved versions
#
#flagmanager(vis=’ngc4826.tutorial.ms’,mode=’list’)
#
##########################################################################
APPENDIX F. APPENDIX: ANNOTATED EXAMPLE SCRIPTS
#
# CALIBRATION
#
##########################################################################
#
# Bandpasses are very flat because of observing mode used (online bandpass
# correction) so bandpass calibration is unecessary for these data.
#
##########################################################################
#
# Derive gain calibration solutions.
# We will use VLA-like G (per-scan) calibration:
#
##########################################################################
#
# Set the flux density of 3C273 to 23 Jy
#
print ’--Setjy (3C273)--’
default(’setjy’)
setjy(vis=’ngc4826.tutorial.ms’,field=’0’,fluxdensity=[23.0,0.,0.,0.],spw=’0~3’)
#
# Not really necessary to set spw but you get lots of warning messages if
# you don’t
#
##########################################################################
#
# Gain calibration
#
print ’--Gaincal--’
default(’gaincal’)
# This should be combining all spw for the two calibrators for single
# scan-based solutions
print ’Gain calibration for fields 0,1 and spw 0~11’
print ’Using solint=inf combining over spw’
print ’Output table ngc4826.tutorial.16apr98.gcal’
gaincal(vis=’ngc4826.tutorial.ms’, caltable=’ngc4826.tutorial.16apr98.gcal’,
field=’0,1’, spw=’0~11’, gaintype=’G’, minsnr=2.0,
refant=’ANT5’, gaincurve=False, opacity=0.0,
solint=’inf’, combine=’spw’)
#
##########################################################################
#
# Transfer the flux density scale:
#
print ’--Fluxscale--’
default(’fluxscale’)
462
APPENDIX F. APPENDIX: ANNOTATED EXAMPLE SCRIPTS
463
print ’’
print ’Transferring flux of 3C273 to sources: 1310+323’
print ’Output table ngc4826.tutorial.16apr98.fcal’
fluxscale(vis=’ngc4826.tutorial.ms’, caltable=’ngc4826.tutorial.16apr98.gcal’,
fluxtable=’ngc4826.tutorial.16apr98.fcal’,
reference=’3C273’, transfer=[’1310+323’])
# Flux density for 1310+323 is: 1.48 +/- 0.016 (SNR = 90.6, nAnt= 8)
#
##########################################################################
#
# Plot calibration
print ’--Plotcal (fluxscale)--’
default(plotcal)
# Interactive plotcal
plotcal(caltable=’ngc4826.tutorial.16apr98.fcal’, yaxis=’amp’, field=’’)
print ’’
print ’Plotting final scaled gain calibration table’
print ’First amp vs. time for all fields ’
# Pause script if you are running in scriptmode
user_check=raw_input(’Return to continue script\n’)
plotcal(caltable=’ngc4826.tutorial.16apr98.fcal’, yaxis=’phase’, field=’’)
print ’’
print ’and phase vs. time ’
# Pause script if you are running in scriptmode
user_check=raw_input(’Return to continue script\n’)
# And you can plot the SNR of the solution
#plotcal(caltable=’ngc4826.tutorial.16apr98.fcal’, yaxis=’snr’, field=’’)
# You can also plotcal to file
#figfile = ’ngc4826.tutorial.16apr98.fcal.plotcal.amp.png’
#plotcal(caltable=’ngc4826.tutorial.16apr98.fcal’,yaxis=’amp’,field=’’,showgui=False,figfile=figfile)
#figfile = ’ngc4826.tutorial.16apr98.fcal.plotcal.phase.png’
#plotcal(caltable=’ngc4826.tutorial.16apr98.fcal’,yaxis=’phase’,field=’’,showgui=False,figfile=figfile)
#
##########################################################################
#
# Correct the calibrater/target source data:
# Use new parm spwmap to apply gain solutions derived from spwid1
# to all other spwids...
print ’--Applycal--’
default(’applycal’)
APPENDIX F. APPENDIX: ANNOTATED EXAMPLE SCRIPTS
464
print ’Applying calibration table ngc4826.tutorial.16apr98.fcal to data’
applycal(vis=’ngc4826.tutorial.ms’,
field=’’, spw=’’,
gaincurve=False, opacity=0.0,
gaintable=’ngc4826.tutorial.16apr98.fcal’,
spwmap=[0,0,0,0,0,0,0,0,0,0,0,0,0,0,0,0])
#
##########################################################################
#
# Check calibrated data
print ’--Plotxy--’
default(plotxy)
#
# Here we plot the first of the NGC4826 fields unaveraged versus velocity
# Notice how the spw fit together
# Interactive plotxy
#print "Will plot all the NGC4826 calibrated data unaveraged - this will take a while"
#plotxy(vis=’ngc4826.tutorial.ms’,xaxis=’velocity’,yaxis=’amp’,field=’2~8’,spw=’12~15’,
#
averagemode=’vector’,datacolumn=’corrected’,
#
selectplot=True,newplot=False,title=’Field 2~8 SPW 12~15’)
#print ""
#print "Look for outliers, flag them if there are any bad ones"
#print ""
# Pause script if you are running in scriptmode
#user_check=raw_input(’Return to continue script\n’)
# You can also plot all the N4826 fields 2 through 8, for example using a loop:
#for fld in range(2,9):
# field = str(fld)
# plotxy(vis=’ngc4826.tutorial.ms’,xaxis=’velocity’,yaxis=’amp’,
#
field=field,spw=’11~15’,
#
averagemode=’vector’,datacolumn=’corrected’,
#
selectplot=True,newplot=False,title=’Field ’+field+’ SPW 11~15’)
#
# user_check=raw_input(’Return to continue script\n’)
# Now here we time-average the data, plotting versus velocity
#plotxy(vis=’ngc4826.tutorial.ms’,xaxis=’velocity’,yaxis=’amp’,field=field,spw=spw,
#
averagemode=’vector’,datacolumn=’corrected’,
#
timebin=’1e7’,crossscans=True,plotcolor=’blue’,
#
selectplot=True,newplot=False,title=’Field ’+field+’ SPW ’+spw)
#print ""
#print ’Final Spectrum field ’+field+’ spw ’+spw+’ TimeAverage Corrected Data’
APPENDIX F. APPENDIX: ANNOTATED EXAMPLE SCRIPTS
# Pause script if you are running in scriptmode
#user_check=raw_input(’Return to continue script\n’)
# Here we overplot 3C273 the Time+Chan averaged calibrated and uncalibrated data
#
# First the corrected column in blue
#field = ’0’
#spw = ’0~3’
#plotxy(vis=’ngc4826.tutorial.ms’,xaxis=’uvdist’,yaxis=’amp’,field=field,spw=spw,
#
averagemode=’vector’,width=’1000’,datacolumn=’corrected’,
#
timebin=’1e7’,crossscans=True,plotcolor=’blue’,
#
selectplot=True,newplot=False,title=’Field ’+field+’ SPW ’+spw)
#print ""
#print ’Plotting field ’+field+’ spw ’+spw+’ TimeChanAverage Corrected Data in blue’
#
# Now the original data column in red
#plotxy(vis=’ngc4826.tutorial.ms’,xaxis=’uvdist’,yaxis=’amp’,field=field,spw=spw,
#
averagemode=’vector’,width=’1000’,datacolumn=’data’,
#
timebin=’1e7’,crossscans=True,plotcolor=’red’,overplot=True,
#
selectplot=True,newplot=False,title=’Field ’+field+’ SPW ’+spw)
#
#print ’OverPlotting field ’+field+’ spw ’+spw+’ TimeChanAverage Original Data in red’
## Pause script if you are running in scriptmode
#user_check=raw_input(’Return to continue script\n’)
# Can repeat for
#field = ’1’
#spw = ’4~11’
print "Done calibration and plotting"
#
##########################################################################
#
# SPLIT THE DATA INTO SINGLE-SOURCE MS
# AND THEN IMAGE THE CALIBRATOR
#
##########################################################################
#
#
# Split out calibrated target source and calibrater data:
#
print ’--Split--’
default(’split’)
print ’Splitting 3C273 data to ngc4826.tutorial.16apr98.3C273.split.ms’
split(vis=’ngc4826.tutorial.ms’,
outputvis=’ngc4826.tutorial.16apr98.3C273.split.ms’,
465
APPENDIX F. APPENDIX: ANNOTATED EXAMPLE SCRIPTS
field=’0’,spw=’0~3:0~63’, datacolumn=’corrected’)
print ’Splitting 1310+323 data to ngc4826.tutorial.16apr98.1310+323.split.ms’
split(vis=’ngc4826.tutorial.ms’,
outputvis=’ngc4826.tutorial.16apr98.1310+323.split.ms’,
field=’1’, spw=’4~11:0~31’, datacolumn=’corrected’)
print ’Splitting NGC4826 data to ngc4826.tutorial.16apr98.src.split.ms’
split(vis=’ngc4826.tutorial.ms’,
outputvis=’ngc4826.tutorial.16apr98.src.split.ms’,
field=’2~8’, spw=’12~15:0~63’,
datacolumn=’corrected’)
#
##########################################################################
#
# If you want to use plotxy before cleaning to look at the split ms
#plotxy(vis=’ngc4826.tutorial.16apr98.src.split.ms’,xaxis=’time’,yaxis=’amp’)
#
##########################################################################
#
# You might image the calibrater data:
#
#print ’--Clean (1310+323)--’
#default(’clean’)
#
#
#clean(vis=’ngc4826.tutorial.16apr98.1310+323.split.ms’,
#
imagename=’ngc4826.tutorial.16apr98.cal.clean’,
#
cell=[1.,1.],imsize=[256,256],
#
field=’0’,spw=’0~7’,threshold=10.,
#
mode=’mfs’,psfmode=’clark’,niter=100,stokes=’I’)
# You can look at this in the viewer
#viewer(’ngc4826.tutorial.16apr98.cal.clean.image’)
#
#
##########################################################################
#
# IMAGING OF NGC4826 MOSAIC
#
##########################################################################
#
#
Mosaic field spacing looks like:
#
#
F3 (field 3)
F2 (field 2)
#
#
F4 (field 4)
F0 (field 0)
F1 (field 1)
466
APPENDIX F. APPENDIX: ANNOTATED EXAMPLE SCRIPTS
#
#
F5 (field 5)
F6 (field 6)
#
# 4x64 channels = 256 channels
#
# Primary Beam should be about 1.6’ FWHM (7m dishes, 2.7mm wavelength)
# Resolution should be about 5-8"
##########################################################################
#
# Image the target source mosaic:
#
print ’--Clean (NGC4826)--’
default(’clean’)
clean(vis=’ngc4826.tutorial.16apr98.src.split.ms’,
imagename=’ngc4826.tutorial.16apr98.src.clean’,
field=’0~6’,spw=’0~3’,
cell=[1.,1.],imsize=[256,256],stokes=’I’,
mode=’channel’,nchan=36,start=35,width=4,
psfmode=’clark’,imagermode=’mosaic’,scaletype=’SAULT’,
niter=10000,threshold=’45mJy’,
restfreq=’115.2712GHz’,interactive=F,
minpb=0.3,pbcor=False)
### NOTE: Sault weighting implies a uniform noise mosaic
### NOTE: that niter is set to large number so that stopping point is
### controlled by threshold.
###
###
###
###
###
###
###
###
#
#
#
#
#
NOTE: with pbcor=False, the final image is not "flux correct",
instead the image has constant noise despite roll off in power as
you move out from the phase center(s). Though this format makes it
"look nicest", for all flux density measurements, and to get an
accurate integrated intensity image, one needs to divide the
srcimage.image/srcimage.flux in order to correct for the mosaic
response pattern. One could also achieve this by setting pbcor=True
in clean.
Try running clean adding the parameter interactive=True.
This parameter will periodically bring up the viewer to allow
interactive clean boxing. For poor uv-coverage, deep negative bowls
from missing short spacings, this can be very important to get correct
integrated flux densities.
#
##########################################################################
#
# Do interactive viewing of clean image
print ’--Viewer--’
viewer(’ngc4826.tutorial.16apr98.src.clean.image’)
467
APPENDIX F. APPENDIX: ANNOTATED EXAMPLE SCRIPTS
468
print ""
print "This is the non-pbcorrected cube of NGC4826"
print "Use tape deck to move through channels"
print "Close the viewer when done"
print ""
#
# Pause script if you are running in scriptmode
user_check=raw_input(’Return to continue script\n’)
#
##########################################################################
#
# Statistics on clean image cube
#
print ’--ImStat (Clean cube)--’
srcstat = imstat(’ngc4826.tutorial.16apr98.src.clean.image’)
print "Found image max = "+str(srcstat[’max’][0])
# offbox = ’106,161,153,200’
offstat = imstat(’ngc4826.tutorial.16apr98.src.clean.image’,
box=’106,161,153,200’)
print "Found off-source image rms = "+str(offstat[’sigma’][0])
# cenbox = ’108,108,148,148’
# offlinechan = ’0,1,2,3,4,5,30,31,32,33,34,35’
offlinestat = imstat(’ngc4826.tutorial.16apr98.src.clean.image’,
box=’108,108,148,148’,
chans=’0,1,2,3,4,5,30,31,32,33,34,35’)
print "Found off-line image rms = "+str(offlinestat[’sigma’][0])
#
##########################################################################
#
# Manually correct for mosaic response pattern using .image/.flux images
#
print ’--ImMath (PBcor)--’
immath(outfile=’ngc4826.tutorial.16apr98.src.clean.pbcor’,
mode=’evalexpr’,
expr="’ngc4826.tutorial.16apr98.src.clean.image’/’ngc4826.tutorial.16apr98.src.clean.flux’")
#
##########################################################################
#
# Statistics on PBcor image cube
APPENDIX F. APPENDIX: ANNOTATED EXAMPLE SCRIPTS
#
print ’--ImStat (PBcor cube)--’
pbcorstat = imstat(’ngc4826.tutorial.16apr98.src.clean.pbcor’)
print "Found image max = "+str(pbcorstat[’max’][0])
pbcoroffstat = imstat(’ngc4826.tutorial.16apr98.src.clean.pbcor’,
box=’106,161,153,200’)
print "Found off-source image rms = "+str(pbcoroffstat[’sigma’][0])
pbcorofflinestat = imstat(’ngc4826.tutorial.16apr98.src.clean.pbcor’,
box=’108,108,148,148’,
chans=’0,1,2,3,4,5,30,31,32,33,34,35’)
print "Found off-line image rms = "+str(pbcorofflinestat[’sigma’][0])
#
##########################################################################
#
# Do zeroth and first moments
#
# NGC4826 LSR velocity is 408 km/s; delta is 20 km/s
#
print ’--ImMoments--’
default(’immoments’)
momfile = ’ngc4826.tutorial.16apr98.moments’
momzeroimage = ’ngc4826.tutorial.16apr98.moments.integrated’
momoneimage = ’ngc4826.tutorial.16apr98.moments.mom1’
print "Calculating Moments 0,1 for PBcor image"
immoments(imagename=’ngc4826.tutorial.16apr98.src.clean.pbcor’,
moments=0,axis=’spectral’,
chans=’7~28’,
outfile=’ngc4826.tutorial.16apr98.moments.integrated’)
#
#
#
#
#
#
#
TUTORIAL NOTES: For moment 0 we use the image corrected for the
mosaic response to get correct integrated flux densities. However,
in *real signal* regions, the value of moment 1 does not dependent on
the flux being correct so the non-pb corrected SAULT image can be
used, this avoids having lots of junk show up at the edges of your
moment 1 image due to the primary beam correction. Try it both ways
and see for yourself.
# TUTORIAL NOTES:
#
# Moments greater than zero need to have a conservative lower
# flux cutoff to produce sensible results.
469
APPENDIX F. APPENDIX: ANNOTATED EXAMPLE SCRIPTS
470
immoments(imagename=’ngc4826.tutorial.16apr98.src.clean.image’,
moments=1,axis=’spectral’,includepix=[0.2,1000.0],
chans=’7~28’,
outfile=’ngc4826.tutorial.16apr98.moments.mom1’)
# Now view the resulting images
viewer(’ngc4826.tutorial.16apr98.moments.integrated’)
#
print "Now viewing Moment-0 ngc4826.tutorial.16apr98.moments.integrated"
print "Note PBCOR effects at field edge"
print "Change the colorscale to get better image"
print "You can also Open and overlay Contours of Moment-1 ngc4826.tutorial.16apr98.moments.mom1"
print "Close the viewer when done"
#
# Pause script if you are running in scriptmode
user_check=raw_input(’Return to continue script\n’)
#
##########################################################################
#
# Statistics on moment images
#
print ’--ImStat (Moment images)--’
momzerostat=imstat(’ngc4826.tutorial.16apr98.moments.integrated’)
print "Found moment 0 max = "+str(momzerostat[’max’][0])
print "Found moment 0 rms = "+str(momzerostat[’rms’][0])
momonestat=imstat(’ngc4826.tutorial.16apr98.moments.mom1’)
print "Found moment 1 median = "+str(momonestat[’median’][0])
#
##########################################################################
#
# An alternative is to mask the pbcor image before calculating
# moments. The following block shows how to do this.
#print ’--Viewer--’
#viewer(ngc4826.tutorial.16apr98.moments.integrated)
#
#
#
#
#
#
#
TUTORIAL NOTES: After loading change "unit contour level" in "Data
Display Options" gui to something like 70. select "region manager
tool" from "tool" drop down menu Then assign the sqiggly Polygon
button to a mouse button by clicking on it with a mouse button. Then
draw a polygon region around galaxy emission, avoiding edge regions
and double click in the region you created. Then in "region manager
tool" select "save to file" and give file name mom0mask.rgn.
APPENDIX F. APPENDIX: ANNOTATED EXAMPLE SCRIPTS
471
#print ’--ImMoments (masked)--’
#print ’Creating masked moment 0 image ngc4826.tutorial.16apr98.moments.integratedmasked’
#
#immoments(imagename=’ngc4826.tutorial.16apr98.src.clean.pbcor’,
#
moments=0,axis=’spectral’,
#
chans=’7~28’,region=’mom0mask.rgn’,
#
outfile=’ngc4826.tutorial.16apr98.moments.integratedmasked’)
#
#print ’Creating masked moment 1 image ngc4826.tutorial.16apr98.moments.mom1masked’
#
#immoments(imagename=’ngc4826.tutorial.16apr98.src.clean.pbcor.masked’,
#
moments=1,axis=’spectral’,
#
includepix=[0.2,1000.0],
#
chans=’7~28’, region=’mom0mask.rgn’,
#
outfile=’ngc4826.tutorial.16apr98.moments.mom1masked’)
# Now view the resulting images
#viewer(’ngc4826.tutorial.16apr98.moments.integratedmasked’)
#
#print "Now viewing masked Moment-0 ngc4826.tutorial.16apr98.moments.integratedmasked"
#print "You can Open and overlay Contours of Moment-1 ngc4826.tutorial.16apr98.moments.mom1masked"
#
# Pause script if you are running in scriptmode
#user_check=raw_input(’Return to continue script\n’)
# Finally, can compute and print statistics
#print ’--ImStat (masked moments)--’
#
#maskedmomzerostat = imstat(’ngc4826.tutorial.16apr98.moments.integratedmasked’)
#print "Found masked moment 0 max = "+str(maskedmomzerostat[’max’][0])
#print "Found masked moment 0 rms = "+str(maskedmomzerostat[’rms’][0])
#
#maskedmomonestat=imstat(’ngc4826.tutorial.16apr98.moments.mom1masked’)
#print "Found masked moment 1 median = "+str(maskedmomonestat[’median’][0])
#
##########################################################################
#
# Now show how to print out results
#
print ’--Results (16apr98)--’
print ’’
#
# Currently using non-PBcor values
#
im_srcmax16 = srcstat[’max’][0]
im_offrms16 = offstat[’sigma’][0]
im_offlinerms16 = offlinestat[’sigma’][0]
thistest_immax = momzerostat[’max’][0]
thistest_imrms = momzerostat[’rms’][0]
APPENDIX F. APPENDIX: ANNOTATED EXAMPLE SCRIPTS
472
#
# Report a few key stats
#
print ’ NGC4826 Image Cube Max = ’+str(im_srcmax16)
print "
At ("+str(srcstat[’maxpos’][0])+","+str(srcstat[’maxpos’][1])+") Channel "+str(srcstat[’
print ’
’+srcstat[’maxposf’]
print ’’
print ’
Off-Source Rms = ’+str(im_offrms16)
print ’
Signal-to-Noise ratio = ’+str(im_srcmax16/im_offrms16)
print ’’
print ’
Off-Line
Rms = ’+str(im_offlinerms16)
print ’
Signal-to-Noise ratio = ’+str(im_srcmax16/im_offlinerms16)
# Note previous regression values (using this script STM 2008-06-04) were:
#srcmax16=1.45868253708
#immax=169.420959473
#imrms=14.3375244141
#offrms16=0.0438643493782
#offlinerms16=0.0544108718199
# Could print out comparison:
#print ’’
#print ’--Src image max (16apr98):
#print ’--Off-src
rms (16apr98):
#print ’--Off-line rms (16apr98):
#print ’--Moment 0 max (16apr98):
#print ’--Moment 0 rms (16apr98):
#print ’’
’+str(im_srcmax16)+’ was ’+str(srcmax16)
’+str(im_offrms16)+’ was ’+str(offrms16)
’+str(im_offlinerms16)+’ was ’+str(offlinerms16)
’+str(thistest_immax)+’ was ’+str(immax)
’+str(thistest_imrms)+’ was ’+str(imrms)
print "Done with NGC4826 Tutorial"
#
##########################################################################
Appendix G
CASA Dictionaries
BETA ALERT: These tend to become out of date as we add new tasks or change names.
G.1
AIPS – CASA dictionary
Please see:
• https://wikio.nrao.edu/bin/view/Software/CASA-AIPSDictionary
BETA ALERT: This link is out-of-date and refers mostly to the Toolkit. We will update this with
a task dictionary.
G.2
MIRIAD – CASA dictionary
Table G.1 provides a list of common Miriad tasks, and their equivalent CASA tool or tool function
names. The two packages differ in both their architecture and calibration and imaging models,
and there is often not a direct correspondence. However, this index does provide a scientific user
of CASA who is familiar with MIRIAD, with a simple translation table to map their existing data
reduction knowledge to the new package.
G.3
CLIC – CASA dictionary
Table G.2 provides a list of common CLIC tasks, and their equivalent CASA tool or tool function
names. The two packages are very similar since the CASA software to reduce IRAM data is based
on the CLIC reduction procedures.
473
APPENDIX G. APPENDIX: CASA DICTIONARIES
474
Table G.1: MIRIAD – CASA dictionary
MIRIAD Task
atlod
blflag
cgcurs
cgdisp
clean
fits
gpboot
gpcal
gpcopy
gpplt
imcomb
imfit
impol
imstat
imsub
invert
linmos
maths
mfcal
prthd
restor
selfcal
tvclip
tvdisp
tvflag
uvaver
uvfit
uvflag
uvgen
uvlist
uvmodel
uvplt
uvsplit
Description
load ATCA data
Interactive baseline based editor/flagger
Interactive image analysis
Image display, overlays
Clean an image
FITS image filler
Set flux density scale
Polarization leakage and gain calibration
copy calibration tables
Plot calibration solutions
Image combination
Image-plane component fitter
Create polarization images
Image statistics
Extract sub-image
Synthesis imaging
linear mosaic combination of images
Calculations involving images
Bandpass and gain calibration
Print header of image or uvdata
Restore a clean component model
selfcalibration of visibility data
automated flagging based on clip levels
Load image to TV display
Interactive TB data editing
Average/select data, apply calibration
uv-plane component fitter
Command-based flagging
Simulator
List uv-data
Source model computation
uv-data plotting
split uv file in sources and spectral windows
CASA task/tool
atcafiller tool
mp raster displays
viewer
viewer
clean
importfits
fluxscale
cb with ’G’ and ’D’
not needed
plotcal
im tool
ia.imagefitter
ia.imagepol
ia.statistics
ia.subimage
invert, im tool
mosaic
ia.imagecalc, ia.calc
bandpass
imhead, listobs
im tool
clean, gaincal, etc.
flagdata
viewer
viewer
applycal, split
uvmodelfit
flagdata
sm tool
listvis (TBD)
ft
plotxy
split
APPENDIX G. APPENDIX: CASA DICTIONARIES
475
Table G.2: CLIC–CASA dictionary
CLIC Function
load
print
flag
phcor
rf
phase
flux
ampl
table
Description
Load data
Print text summary of data
Flag data
Atmospheric phase correction
Radio frequency bandpass
Phase calibration
Absolute flux calibration
Amplitude calibration
Split out calibrated data (uv table)
CASA task/tool
almatifiller tool
listobs
plotxy, flagdata, viewer
almatifiller
bandpass
gaincal
setjy, fluxscale
gaincal
split
Appendix H
Writing Tasks
BETA ALERT: This prescription for writing and incorporating tasks in CASA is for the poweruser. This procedure is also likely to change in future releases.
It is possible to write your own task and have it appear in casapy. You must create two files,
yourtask.xml and a task yourtask.py. The xml file is use to describe the interface to the task and
the task yourtask.py does the actual work. The argument names must be the same in both the
yourtask.xml and task yourtask.py file. The yourtask.xml file is used to generated all the interface
files so yourtask will appear in the casapy system.
Synopsis
• buildmytasks yourtask
• execfile ’PATH TO YOURTASK/yourtask.py (from inside casapy)’
H.1
The XML file
The key to getting your task into casapy is constructing a task interface description XML file.
Some XML basics, an xml element begins with <element> and ends with </element>. If an XML
element contains no other XML element you may specify it via <element/>. An XML element
may have zero or more attributes which are specified by attribute=”attribute value”. You must
put the attribute value in quotes, i.e. <element myattribute=”attribute value”>.
All task xml files must start with this header information.
<?xml version="1.0" encoding="UTF-8"?>
<?xml-stylesheet type="text/xsl" ?>
<casaxml xmlns="http://casa.nrao.edu/schema/psetTypes.html"
xmlns:xsi="http://www.w3.org/2001/XMLSchema-instance"
xsi:schemaLocation="http://casa.nrao.edu/schema/casa.xsd
476
APPENDIX H. APPENDIX: WRITING TASKS IN CASA
477
file:///opt/casa/code/xmlcasa/xml/casa.xsd">
and the file must have the end tag
</casaxml>
Inside a <task> tags you will need to specify the following elements.
<task>
Attributes
type required, allowed value is ”function”
name required
Subelements
shortdescription required
description required
input optional
output optional
returns optional
constraints optional
<shortdescription> - required by <task>; A short one-line description describing your task
Attributes
None
Subelements
None
<description> - required] by <task>, Also used by <param>a; A longer description describing
your task with multiple lines
Attributes
None
Subelements
None
<input> - optional element used by <task>; An input block specifies which parameters are used
for input
Attributes
None
Subelements
APPENDIX H. APPENDIX: WRITING TASKS IN CASA
478
<param> , optional
<output> - optional An output element that contains a list of parameters that are ”returned”
by the task.
Attributes
None
Subelements
<param> , optional
<returns> - optional Value returned by the task
Attributes
type optional; as specfied in <param>
Subelements
<description> , optional
<constraints> - optional A constraints element that lets you constrain params based on the
values of other params.
Attributes
None
Subelements
<when> , required.
<param> - optional The input and output elements consist of param elements.
Attributes
type , required; allowed values are record, variant, string int, double, bool, intArray,
doubleArray, boolArray, stringArray
name , required;
subparam , optional; allowed values True, False, Yes or No.
kind , optional;
mustexist , optional; allowed values True, False, Yes or No.
All param elements require name and type attributes.
Subelements
<description> , required;
<value> , optional;
<allowed> , optional;
<value> - optional Value returned by the task
Attributes
type , required; as specified in <param> attributes.
APPENDIX H. APPENDIX: WRITING TASKS IN CASA
479
Subelements
<value> , optional
<allowed> - optional; Block of allowed values
Attributes
enum , required; maybe enum or range. If specfied as enum only specific values are
allowed If specified as range then the value tags may have min and max attributes.
Subelements
<value> , optional
<when> - optional When blocks allow value specific handling for parameters
Attributes
param , required; Specifies special handling for a <param>
Subelements
<equals> , optional
<notequals> , optional
<equals> - optional Reset parameters if equal to the specified value
Attributes
value , required; the value of the parameter
Subelements
<default> , required
<notequals> - optional Reset specified parameters if not equal to the specified value
Attributes
value , required; The value of the parameter
Subelements
<default> , optional
<default> - optional Resets default values for specified parameters
Attributes
param , required; Name of the <param> to be reset.
Subelements
<value> , required, the revised value of the <param>.
<example> - optional An example block, typically in python
Attributes
lang optional; specifies the language of the example, defaults to python.
Subelements
None
APPENDIX H. APPENDIX: WRITING TASKS IN CASA
480
The task yourtask.py file
H.2
You must write the python code that does the actual work. The task *.py file function call sequence
must be the same as specified in the XML file. We may relax the requirement that the function
call sequence exactly match the sequence in the XML file in a future release.
H.3
Example: The clean task
H.3.1
File clean.xml
Clean.xml gives a fairly comprehensive example of how to construct the XML file.
<?xml version="1.0" encoding="UTF-8"?>
<?xml-stylesheet type="text/xsl" ?>
<casaxml xmlns="http://casa.nrao.edu/schema/psetTypes.html"
xmlns:xsi="http://www.w3.org/2001/XMLSchema-instance"
xsi:schemaLocation="http://casa.nrao.edu/schema/casa.xsd
file:///opt/casa/code/xmlcasa/xml/casa.xsd">
<!-<!-<!-<!-<!-<!-<!-<!-<!--
This is the param set for clean -->
This does the equivalent of -->
imgr:=imager(’anyfile.ms’); -->
imgr.setdata(mode=’channel’,nchan=100,start=1,step=1,fieldid=1) -->
imgr.setimage(nx=512,ny=,cellx=’1arcsec’,celly=’1arcsec’,stokes=’I’,-->
mode=’channel’,start=35,step=1,nchan=40, -->
fieldid=[1]) -->
imgr.weight(’natural’); -->
imgr.clean(algorithm=’csclean’,niter=500,model=’field1’) -->
<task type="function" name="clean">
<shortdescription>Deconvolve an image with selected algorithm</shortdescription>
<description>
Form images from visibilities. Handles continuum and spectral line cubes.
</description>
<input>
<param type="string" name="vis" kind="ms" mustexist="true">
<description>name of input visibility file</description>
APPENDIX H. APPENDIX: WRITING TASKS IN CASA
<value></value>
</param>
<param type="string" name="imagename">
<description>Pre-name of output images</description>
<value></value>
</param>
<param type="string" name="field">
<description>Field Name</description>
<value></value>
</param>
<param type="any" name="spw">
<description>Spectral windows:channels: \’\’ is all </description>
<any type="variant"/>
<value type="string"></value>
</param>
<param type="bool" name="selectdata">
<description>Other data selection parameters</description>
<value>False</value>
</param>
<param type="string" name="timerange" subparam="true">
<description>Range of time to select from data</description>
<value></value>
</param>
<param type="string" name="uvrange" subparam="true">
<description>Select data within uvrange </description>
<value></value>
</param>
<param type="string" name="antenna" subparam="true">
<description>Select data based on antenna/baseline</description>
<value></value>
</param>
<param type="string" name="scan" subparam="true">
<description>scan number range</description>
<value></value>
</param>
<param type="string" name="mode">
<description>
Type of selection (mfs, channel, velocity, frequency)
</description>
481
APPENDIX H. APPENDIX: WRITING TASKS IN CASA
482
<value>mfs</value>
<allowed kind="enum">
<value>mfs</value>
<value>channel</value>
<value>velocity</value>
<value>frequency</value>
</allowed>
</param>
<param type="int" name="niter">
<description>Maximum number of iterations</description>
<value>500</value>
</param>
<param type="double" name="gain">
<description>Loop gain for cleaning</description>
<value>0.1</value>
</param>
<param type="double" name="threshold" units="mJy">
<description>Flux level to stop cleaning. Must include units</description>
<value>0.0</value>
</param>
<!-- Getting rid of this
<param type="bool" name="csclean">
<description>Use Cotton-Schwab style reconciliation with UV-data</description>
<value>False</value>
</param>
-->
<param type="string" name="psfmode">
<description>method of PSF calculation to use during minor cycles</description>
<value>clark</value>
<allowed kind="enum">
<value>clark</value>
<value>hogbom</value>
</allowed>
</param>
<param type="string" name="imagermode">
<description> Use csclean or mosaic. If \’\’, use psfmode</description>
APPENDIX H. APPENDIX: WRITING TASKS IN CASA
483
<value></value>
<allowed kind="enum">
<value></value>
<value>csclean</value>
<value>mosaic</value>
</allowed>
</param>
<param type="string" name="ftmachine" subparam="true">
<description>Gridding method for the image</description>
<value>mosaic</value>
<allowed kind="enum">
<value>mosaic</value>
<value>ft</value>
<value>sd</value>
<value>both</value>
</allowed>
</param>
<param type="bool" name="mosweight" subparam="true">
<description>Individually weight the fields of the mosaic</description>
<value>False</value>
</param>
<param type="string" name="scaletype" subparam="true">
<description>Controls scaling of pixels in the image plane.
default=\’SAULT\’;
example: scaletype=\’PBCOR\’ Options: \’PBCOR\’,\’SAULT\’</description>
<value>SAULT</value>
<allowed kind="enum">
<value>SAULT</value>
<value>PBCOR</value>
</allowed>
</param>
<param type="intArray" name="multiscale">
<description>set deconvolution scales (pixels),
default: multiscale=[] (standard CLEAN)</description>
<value type="vector">
<value></value>
</value>
</param>
<param type="int" name="negcomponent" subparam="true">
APPENDIX H. APPENDIX: WRITING TASKS IN CASA
484
<description>
Stop cleaning if the largest scale finds this number of neg components
</description>
<value>0</value>
</param>
<param type="bool" name="interactive">
<description>use interactive clean (with GUI viewer)</description>
<value>False</value>
</param>
<param type="any" name="mask">
<description>cleanbox(es), mask image(s), and/or region(s)
</description>
<any type="variant"/>
<value type="stringArray"></value>
</param>
used in cleaning
<param type="int" name="nchan" subparam="true">
<description>Number of channels (planes) in output image</description>
<value>1</value>
</param>
<param type="any" name="start" subparam="true">
<description>First channel in input to use</description>
<any type="variant"/>
<value type="int">0</value>
</param>
<param type="any" name="width" subparam="true">
<description>Number of input channels to average</description>
<any type="variant"/>
<value type="int">1</value>
</param>
<param type="intArray" name="imsize">
<description>x and y image size in pixels, symmetric for single value
</description>
<value type="vector">
<value>256</value><value>256</value>
</value>
</param>
APPENDIX H. APPENDIX: WRITING TASKS IN CASA
<param type="doubleArray" name="cell" units="arcsec">
<description>x and y cell size. default unit arcsec</description>
<value type="vector"><value>1.0</value><value>1.0</value></value>
</param>
<param type="any" name="phasecenter">
<description>Image phase center: position or field index</description>
<any type="variant"/>
<value type="string"></value>
</param>
<param type="string" name="restfreq">
<description>rest frequency to assign to image (see help)</description>
<value></value>
</param>
<param type="string" name="stokes">
<description>Stokes params to image (eg I,IV, QU,IQUV)</description>
<value>I</value>
<allowed kind="enum">
<value>I</value>
<value>IV</value>
<value>QU</value>
<value>IQUV</value>
<value>RR</value>
<value>LL</value>
<value>RRLL</value>
<value>XX</value>
<value>YY</value>
<value>XXYY</value>
</allowed>
</param>
<param type="string" name="weighting">
<description>Weighting to apply to visibilities</description>
<value>natural</value>
<allowed kind="enum">
<value>natural</value>
<value>uniform</value>
<value>briggs</value>
485
APPENDIX H. APPENDIX: WRITING TASKS IN CASA
486
<value>briggsabs</value>
<value>radial</value>
<value>superuniform</value>
</allowed>
</param>
<param type="double" name="robust" subparam=’true’>
<description>Briggs robustness parameter</description>
<value>0.0</value>
<allowed kind="range">
<value range="min">-2.0</value>
<value range="max">2.0</value>
</allowed>
</param>
<param type="bool" name="uvtaper">
<description>Apply additional uv tapering of
<value>False</value>
</param>
visibilities.</description>
<param type="stringArray" name="outertaper" subparam="true">
<description>uv-taper on outer baselines in uv-plane</description>
<value type="vector">
<value></value>
</value>
</param>
<param type="stringArray" name="innertaper" subparam="true">
<description>uv-taper in center of uv-plane</description>
<value>1.0</value>
</param>
<param type="string" name="modelimage">
<description>Name of model image(s) to initialize cleaning</description>
<value></value>
</param>
<param type="stringArray" name="restoringbeam">
<description>Output Gaussian restoring beam for CLEAN image</description>
<value></value>
</param>
<param type="bool" name="pbcor">
<description>Output primary beam-corrected image</description>
<value>False</value>
</param>
APPENDIX H. APPENDIX: WRITING TASKS IN CASA
487
<param type="double" name="minpb">
<description>Minimum PB level to use</description>
<value>0.1</value>
</param>
<param type="any" name="noise" subparam=’true’>
<description>noise parameter for briggs abs mode weighting</description>
<any type="variant"/>
<value type="string">1.0Jy</value>
</param>
<param type="int" name="npixels" subparam=’true’>
<description>number of pixels for superuniform or briggs weighting
</description>
<value>0</value>
</param>
<param type="int" name="npercycle" subparam=’true’>
<description>Number of iterations before interactive prompt</description>
<value>100</value>
</param>
<param type="double" name="cyclefactor" subparam=’true’>
<description>change depth in between of csclean cycle</description>
<value>1.5</value>
</param>
<param type="int" name="cyclespeedup" subparam=’true’>
<description>Cycle threshold doubles in this number of iteration</description>
<value>-1</value>
</param>
<constraints>
<when param="selectdata">
<equals type="bool" value="False"/>
<equals type="bool" value="True">
<default param="timerange"><value type="string"></value>
</default>
<default param="uvrange"><value type="string"></value>
</default>
APPENDIX H. APPENDIX: WRITING TASKS IN CASA
<default param="antenna"><value type="string"></value>
</default>
<default param="scan"><value type="string"></value>
</default>
</equals>
</when>
<when param="multiscale">
<notequals type="vector" value="[]" >
<default param="negcomponent"><value>-1</value>
</default>
</notequals>
</when>
<when param="mode">
<equals value="mfs"/>
<equals value="channel">
<default param="nchan"><value>1</value></default>
<default param="start"><value>0</value>
<description>first input channel to use</description>
</default>
<default param="width"><value>1</value></default>
</equals>
<equals value="velocity">
<default param="nchan"><value>1</value></default>
<default param="start"><value type="string">0.0km/s</value>
<description>Velocity of first image channel: e.g \’0.0km/s\’
</description>
</default>
<default param="width"><value type="string">1km/s</value>
<description>image channel width in velocity units:
e.g \’-1.0km/s\’</description>
</default>
</equals>
<equals value="frequency">
<default param="nchan"><value>1</value></default>
<default param="start"><value type="string">1.4GHz</value>
<description>Frequency of first image channel: e.q. \’1.4GHz\’
</description>
</default>
<default param="width"><value type="string">10kHz</value>
<description>Image channel width in frequency units:
e.g \’1.0kHz\’</description>
</default>
</equals>
</when>
488
APPENDIX H. APPENDIX: WRITING TASKS IN CASA
<when param="weighting">
<equals value="natural"/>
<equals value="uniform"/>
<equals value="briggs">
<default param="robust"><value>0.0</value></default>
<default param="npixels"><value>0</value>
<description>number of pixels to determine uv-cell size
0=> field of view</description>
</default>
</equals>
<equals value="briggsabs">
<default param="robust"><value>0.0</value></default>
<default param="noise"><value type="string">1.0Jy</value></default>
<default param="npixels"><value>0</value>
<description>number of pixels to determine uv-cell size
0=> field of view</description>
</default>
</equals>
<equals value="superuniform">
<default param="npixels"><value>0</value>
<description>number of pixels to determine uv-cell size
0=> +/-3pixels</description>
</default>
</equals>
</when>
<when param="uvtaper">
<equals type="bool" value="False"/>
<equals type="bool" value="True">
<default param="outertaper"><value type="vector"></value></default>
<default param="innertaper"><value type="vector"></value></default>
</equals>
</when>
<when param="interactive">
<equals type="bool" value="False"/>
<equals type="bool" value="True">
<default param="npercycle"><value>100</value></default>
</equals>
</when>
<when param="imagermode">
<equals value=""/>
<equals value="csclean">
<default param="cyclefactor"><value>1.5</value></default>
<default param="cyclespeedup"><value>-1</value></default>
</equals>
<equals value="mosaic">
489
APPENDIX H. APPENDIX: WRITING TASKS IN CASA
<default param="mosweight"><value>False</value></default>
<default param="ftmachine"><value type="string">mosaic</value>
</default>
<default param="scaletype"><value type="string">SAULT</value>
</default>
<default param="cyclefactor"><value>1.5</value></default>
<default param="cyclespeedup"><value>-1</value></default>
</equals>
</when>
<!--Get rid of that soon
<when param="mosaicmode">
<equals type="bool" value="False"/>
<equals type="bool" value="True">
<default param="mosweight"><value>False</value></default>
<default param="ftmachine"><value type="string">mosaic</value></default>
<default param="scaletype"><value type="string">SAULT</value></default>
</equals>
</when>
-->
</constraints>
</input>
<returns type="void"/>
<example>
The main clean deconvolution task.
1)
2)
3)
4)
5)
6)
7)
It contains many functions
Make ’dirty’ image and ’dirty’ beam (psf)
Multi-frequency-continuum images or spectral channel imaging
Full Stokes imaging
Mosaicking of several pointings
Multi-scale cleaning
Interactive clean boxing
Initial starting model
vis -- Name of input visibility file
default: none; example: vis=’ngc5921.ms’
imagename -- Pre-name of output images:
default: none; example: imagename=’m2’
output images are:
m2.image; cleaned and restored image
With or without primary beam correction
490
APPENDIX H. APPENDIX: WRITING TASKS IN CASA
m2.psf; point-spread function (dirty beam)
m2.flux; relative sky sensitivity over field
m2.model; image of clean components
m2.residual; image of residuals
m2.interactive.mask; image containing clean regions
field -- Select fields in mosaic. Use field id(s) or field name(s).
[’go listobs’ to obtain the list id’s or names]
default: ’’=all fields
If field string is a non-negative integer, it is assumed to
be a field index otherwise, it is assumed to be a
field name
field=’0~2’; field ids 0,1,2
field=’0,4,5~7’; field ids 0,4,5,6,7
field=’3C286,3C295’; field named 3C286 and 3C295
field = ’3,4C*’; field id 3, all names starting with 4C
spw -- Select spectral window/channels
NOTE: This selects the data passed as the INPUT to mode
default: ’’=all spectral windows and channels
spw=’0~2,4’; spectral windows 0,1,2,4 (all channels)
spw=’0:5~61’; spw 0, channels 5 to 61
spw=’<2’;
spectral windows less than 2 (i.e. 0,1)
spw=’0,10,3:3~45’; spw 0,10 all channels, spw 3,
channels 3 to 45.
spw=’0~2:2~6’; spw 0,1,2 with channels 2 through 6 in each.
spw=’0:0~10;15~60’; spectral window 0 with channels
0-10,15-60
spw=’0:0~10,1:20~30,2:1;2;3’; spw 0, channels 0-10,
spw 1, channels 20-30, and spw 2, channels, 1,2 and 3
selectdata -- Other data selection parameters
default: True
>>> selectdata=True expandable parameters
See help par.selectdata for more on these
timerange -- Select data based on time range:
default = ’’ (all); examples,
timerange = ’YYYY/MM/DD/hh:mm:ss~YYYY/MM/DD/hh:mm:ss’
Note: if YYYY/MM/DD is missing date defaults to first
day in data set
timerange=’09:14:0~09:54:0’ picks 40 min on first day
timerange= ’25:00:00~27:30:00’ picks 1 hr to 3 hr
30min on NEXT day
timerange=’09:44:00’ pick data within one integration
of time
timerange=’>10:24:00’ data after this time
uvrange -- Select data within uvrange (default units meters)
default: ’’ (all); example:
491
APPENDIX H. APPENDIX: WRITING TASKS IN CASA
uvrange=’0~1000klambda’; uvrange from 0-1000 kilo-lambda
uvrange=’>4klambda’;uvranges greater than 4 kilo lambda
antenna -- Select data based on antenna/baseline
default: ’’ (all)
If antenna string is a non-negative integer, it is
assumed to be an antenna index, otherwise, it is
considered an antenna name.
antenna=’5&6’; baseline between antenna index 5 and
index 6.
antenna=’VA05&VA06’; baseline between VLA antenna 5
and 6.
antenna=’5&6;7&8’; baselines 5-6 and 7-8
antenna=’5’; all baselines with antenna index 5
antenna=’05’; all baselines with antenna number 05
(VLA old name)
antenna=’5,6,9’; all baselines with antennas 5,6,9
index numbers
scan -- Scan number range.
default: ’’ (all)
example: scan=’1~5’
Check ’go listobs’ to insure the scan numbers are in
order.
mode -- Frequency Specification:
NOTE: See examples below:
default: ’mfs’
mode = ’mfs’ means produce one image from all
specified data.
mode = ’channel’; Use with nchan, start, width to specify
output image cube. See examples below
mode = ’velocity’, means channels are specified in
velocity.
mode = ’frequency’, means channels are specified in
frequency.
>>> mode expandable parameters (for modes other than ’mfs’)
Start, width are given in units of channels, frequency
or velocity as indicated by mode, but only channel
is complete.
nchan -- Number of channels (planes) in output image
default: 1; example: nchan=3
start -- Start input channel (relative-0)
default=0; example: start=5
width -- Output channel width in units of the input
channel width (>1 indicates channel averaging)
default=1; example: width=4
examples:
492
APPENDIX H. APPENDIX: WRITING TASKS IN CASA
spw = ’0,1’; mode = ’mfs’
will produce one image made from all channels in spw
0 and 1
spw=’0:5~28^2’; mode = ’mfs’
will produce one image made with channels
(5,7,9,...,25,27)
spw = ’0’; mode = ’channel’: nchan=3; start=5; width=4
will produce an image with 3 output planes
plane 1 contains data from channels (5+6+7+8)
plane 2 contains data from channels (9+10+11+12)
plane 3 contains data from channels (13+14+15+16)
spw = ’0:0~63^3’; mode=’channel’; nchan=21; start = 0;
width = 1
will produce an image with 20 output planes
Plane 1 contains data from channel 0
Plane 2 contains date from channel 2
Plane 21 contains data from channel 61
spw = ’0:0~40^2’; mode = ’channel’; nchan = 3; start =
5; width = 4
will produce an image with three output planes
plane 1 contains channels (5,7)
plane 2 contains channels (13,15)
plane 3 contains channels (21,23)
psfmode -- method of PSF calculation to use during minor cycles:
default: ’clark’: Options: ’clark’,’hogbom’
’clark’ use smaller beam (faster, usually good enough)
’hogbom’ full-width of image (slower, better for poor
uv-coverage)
Note: psfmode will be used to clean is imagermode = ’’
imagermode -- Advanced imaging e.g mosaic or Cotton-Schwab clean
default: imagermode=’’: Options: ’’, ’csclean’, ’mosaic’
default ’’ => psfmode cleaning algorithm used
>>> imagermode=’mosaic’ expandable parameter(s):
Image as a mosaic of the different pointings (uses csclean
style too)
mosweight -- Individually weight the fields of the mosaic
default: False; example: mosweight=True
This can be useful if some of your fields are more
sensitive than others (i.e. due to time spent
on-source); this parameter will give more weight to
higher sensitivity fields in the overlap regions.
ftmachine -- Gridding method for the image;
Options: ft (standard interferometric gridding), sd
(standard single dish) both (ft and sd as appropriate),
mosaic (gridding use PB as convolution function)
493
APPENDIX H. APPENDIX: WRITING TASKS IN CASA
default: ’mosaic’; example: ftmachine=’ft’
scaletype -- Controls scaling of pixels in the image plane.
(Not fully implemented...for now only controls
what is seen if interactive=True...but in the future will
control the image on which clean components are searched)
default=’SAULT’; example: scaletype=’PBCOR’
Options: ’PBCOR’,’SAULT’
’SAULT’ when interactive=True shows the residual
with constant noise across the mosaic. If
pbcor=False, the final output image is NOT
corrected for the PB pattern, and therefore is
not "flux correct". Division of SAULT
<imagename>.image by the <imagename>.flux image
will produce a "flux correct image", can also
be acheived by setting pbcor=True.
’PBCOR’ uses the SAULT scaling scheme for
deconvolution, but if interactive=True shows the
primary beam corrected image; the final PBCOR
image is "flux correct" if pbcor=True.
>>> imagermode=’csclean’ expandable parameter(s): Image using the
Cotton-Schwab algorithm in between major cycles
cyclefactor -- Change the threshold at which
the deconvolution cycle will stop, degrid
and subtract from the visibilities. For
poor PSFs, reconcile often (cyclefactor=4 or
5); For good PSFs, use cyclefactor 1.5 to
2.0. Note: threshold = cyclefactor * max
sidelobe * max residual.
default: 1.5; example: cyclefactor=4
cyclespeedup -- Cycle threshold doubles in this
number of iterations default: -1;
example: cyclespeedup=3
try cyclespeedup = 50 to speed up cleaning
multiscale -- set of scales to use in deconvolution. If set,
cleans with several resolutions using hobgom clean. The
scale sizes are in units of cellsize. So if
cell=’2arcsec’, a multiscale scale=10 = 20arcsec. First
scale should always be 0 (point), we suggest second on
the order of synthesized beam, third 3-5 times
synthesized beam, etc. For example if synthesized beam
is 10" and cell=2", try multscale = [0,5,15]. Note,
multiscale is currently a bit slow.
default: multiscale=[] (standard CLEAN using psfmode algorithm,
no multi-scale). Example: multscale = [0,5,15]
>>> multiscale expandable parameter(s): negcomponent -- Stop
494
APPENDIX H. APPENDIX: WRITING TASKS IN CASA
component search when the largest scale has found this
number of negative components; -1 means continue
component search even if the largest component is
negative. default: -1; example: negcomponent=50
imsize -- Image pixel size (x,y)
default = [256,256]; example: imsize=[350,350]
imsize = 500 is equivalent to [500,500]
cell -- Cell size (x,y)
default= ’1.0arcsec’;
example: cell=[’0.5arcsec,’0.5arcsec’] or
cell=[’1arcmin’, ’1arcmin’]
cell = ’1arcsec’ is equivalent to [’1arcsec’,’1arcsec’]
NOTE:cell = 2.0 => [’2arcsec’, ’2arcsec’]
phasecenter -- direction measure or fieldid for the mosaic center
default: ’’ => first field selected ; example: phasecenter=6
or phasecenter=’J2000 19h30m00 -40d00m00’
restfreq -- Specify rest frequency to use for output image
default=’’ Occasionally it is necessary to set this (for
example some VLA spectral line data). For example for
NH_3 (1,1) put restfreq=’23.694496GHz’
stokes -- Stokes parameters to image
default=’I’; example: stokes=’IQUV’;
Options: ’I’,’IV’’QU’,’IQUV’,’RR’,’LL’,’XX’,’YY’,’RRLL’,’XXYY’
niter -- Maximum number iterations,
if niter=0, then no CLEANing is done ("invert" only)
default: 500; example: niter=5000
gain -- Loop gain for CLEANing
default: 0.1; example: gain=0.5
threshold -- Flux level at which to stop CLEANing
default: ’0.0mJy’;
example: threshold=’2.3mJy’ (always include units)
threshold = ’0.0023Jy’
threshold = ’0.0023Jy/beam’ (okay also)
interactive -- use interactive clean (with GUI viewer)
default: interactive=False
example: interactive=True
interactive clean allows the user to build the cleaning
mask interactively using the viewer. The viewer will
appear every npercycle interation, but modify as needed
The final interactive maks is saved in the file
imagename_interactive.mask. The initial masks use the
union of mask and cleanbox (see below)
>>> interactive=True expandable parameter npercycle -- this is the
number of iterations between each clean to update mask
interactively. Set to about niter/5, but can also be
495
APPENDIX H. APPENDIX: WRITING TASKS IN CASA
changed interactively.
mask -- Specification of cleanbox(es), mask image(s), and/or
region(s) to be used for CLEANing. As long as the image has
the same shape (size), mask images from a previous
interactive session can be used for a new execution. NOTE:
the initial clean mask actually used is the union of what
is specified in mask and <imagename>.mask default: [] (no
masking); Possible pecification types: (a) Explicit
cleanbox pixel ranges example: mask=[110,110,150,145] clean
region with blc=110,100; trc=150,145 (pixel values) (b)
Filename with cleanbox pixel values with ascii format:
example: mask=’mycleanbox.txt’ <fieldid blc-x blc-y
trc-x trc-y> on each line
1 45 66 123 124
2 23 100 300 340
(c) Filename for image mask example: mask=’myimage.mask’
(d) Filename for region specification (e.g. from viewer)
example: mask=’myregion.rgn’ (e) Combinations of any of the
above example: mask=[[110,110,150,145],’mycleanbox.txt’,
’myimage.mask’,’myregion.rgn’]
uvtaper -- Apply additional uv tapering of the visibilities.
default: uvtaper=False; example: uvtaper=True
>>> uvtaper=True expandable parameters
outertaper -- uv-taper on outer baselines in uv-plane
[bmaj, bmin, bpa] taper Gaussian scale in uv or
angular units. NOTE: uv taper in (klambda) is roughly on-sky
FWHM(arcsec/200)
default: outertaper=[]; no outer taper applied
example: outertaper=[’5klambda’] circular taper
FWHM=5 kilo-lambda
outertaper=[’5klambda’,’3klambda’,’45.0deg’]
outertaper=[’10arcsec’] on-sky FWHM 10"
outertaper=[’300.0’] default units are meters
in aperture plane
innertaper -- uv-taper in center of uv-plane
[bmaj,bmin,bpa] Gaussian scale at which taper falls to
zero at uv=0
default: innertaper=[]; no inner taper applied
NOT YET IMPLEMENTED
modelimage -- Name of model image(s) to initialize cleaning. If
multiple images, then these will be added together to
form initial staring model NOTE: these are in addition
to any initial model in the <imagename>.model image file
default: ’’ (none); example: modelimage=’orion.model’
modelimage=[’orion.model’,’sdorion.image’] Note: if the
496
APPENDIX H. APPENDIX: WRITING TASKS IN CASA
units in the image are Jy/beam as in a single-dish
image, then it will be converted to Jy/pixel as in a
model image, using the restoring beam in the image
header
weighting -- Weighting to apply to visibilities:
default=’natural’; example: weighting=’uniform’;
Options: ’natural’,’uniform’,’briggs’,
’superuniform’,’briggsabs’,’radial’
>>> Weighting expandable parameters
For weighting=’briggs’ and ’briggsabs’
robust -- Brigg’s robustness parameter
default=0.0; example: robust=0.5;
Options: -2.0 to 2.0; -2 (uniform)/+2 (natural)
For weighting=’briggsabs’
noise
-- noise parameter to use for Briggs "abs"
weighting
example noise=’1.0mJy’
For superuniform/briggs/briggsabs weighting
npixels -- number of pixels to determine uv-cell size
for weight calculation
example npixels=7
restoringbeam -- Output Gaussian restoring beam for CLEAN image
[bmaj, bmin, bpa] elliptical Gaussian restoring beam
default units are in arc-seconds for bmaj,bmin, degrees
for bpa default: restoringbeam=[]; Use PSF calculated
from dirty beam.
example: restoringbeam=[’10arcsec’] circular Gaussian
FWHM 10" example:
restoringbeam=[’10.0’,’5.0’,’45.0deg’] 10"x5"
at 45 degrees
pbcor -- Output primary beam-corrected image
default: pbcor=False; output un-corrected image
example: pbcor=True; output pb-corrected image (masked outside
minpb) Note: if you set pbcor=False, you can later
recover the pbcor image by dividing by the .flux image
(e.g. using immath)
minpb -- Minimum PB level to use default=0.1; example:
minpb=0.01 Note: this minpb is always in effect
(regardless of pbcor=True/False)
async -- Run asynchronously
default = False; do not run asychronously
</example>
497
APPENDIX H. APPENDIX: WRITING TASKS IN CASA
</task>
</casaxml>
H.3.2
File task clean.py
Task clean implementation file.
import os
from taskinit import *
from cleanhelper import *
def clean(vis,imagename,field, spw, selectdata, timerange, uvrange, antenna,
scan, mode,niter, gain,threshold, psfmode, imagermode, ftmachine,
mosweight, scaletype, multiscale, negcomponent,interactive,mask,
nchan,start,width,imsize,cell, phasecenter, restfreq, stokes,
weighting,robust, uvtaper,outertaper,innertaper, modelimage,
restoringbeam,pbcor, minpb, noise, npixels, npercycle, cyclefactor,
cyclespeedup):
#Python script
casalog.origin(’clean’)
maskimage=’’
if((mask==[]) or (mask==’’)):
mask=[’’]
if (interactive):
if( (mask==’’) or (mask==[’’]) or (mask==[])):
maskimage=imagename+’.mask’
#try:
if(1):
imCln=imtool.create()
imset=cleanhelper(imCln, vis)
if((len(imagename)==0) or (imagename.isspace())):
raise Exception, ’Cannot proceed with blank imagename’
casalog.origin(’clean’)
imset.defineimages(imsize=imsize, cell=cell, stokes=stokes,
498
APPENDIX H. APPENDIX: WRITING TASKS IN CASA
mode=mode, spw=spw, nchan=nchan,
start=start, width=width,
restfreq=restfreq, field=field,
phasecenter=phasecenter)
imset.datselweightfilter(field=field, spw=spw,
timerange=timerange, uvrange=uvrange,
antenna=antenna, scan=scan,
wgttype=weighting, robust=robust,
noise=noise, npixels=npixels,
mosweight=mosweight,
innertaper=innertaper,
outertaper=outertaper)
if(maskimage==’’):
maskimage=imagename+’.mask’
imset.makemaskimage(outputmask=maskimage,imagename=imagename,
maskobject=mask)
###define clean alg
alg=psfmode
if(multiscale==[0]):
multiscale=[]
if((type(multiscale)==list) and (len(multiscale)>0)):
alg=’multiscale’
imCln.setscales(scalemethod=’uservector’,
uservector=multiscale)
if(imagermode==’csclean’):
alg=’mf’+alg
if(imagermode==’mosaic’):
if(alg.count(’mf’) <1):
alg=’mf’+alg
imCln.setoptions(ftmachine=ftmachine, padding=1.0)
imCln.setvp(dovp=True)
###PBCOR or not
sclt=’SAULT’
if((scaletype==’PBCOR’) or (scaletype==’pbcor’)):
sclt=’NONE’
imCln.setvp(dovp=True)
else:
if(imagermode != ’mosaic’):
##make a pb for flux scale
imCln.setvp(dovp=True)
imCln.makeimage(type=’pb’, image=imagename+’.flux’)
499
APPENDIX H. APPENDIX: WRITING TASKS IN CASA
500
imCln.setvp(dovp=False)
##restoring
imset.setrestoringbeam(restoringbeam)
###model image
imset.convertmodelimage(modelimages=modelimage,
outputmodel=imagename+’.model’)
####after all the mask shenanigans...make sure to use the
####last mask
maskimage=imset.outputmask
if((imagermode==’mosaic’)):
imCln.setmfcontrol(stoplargenegatives=negcomponent,scaletype=sclt,
minpb=minpb,cyclefactor=cyclefactor,
cyclespeedup=cyclespeedup,
fluxscale=[imagename+’.flux’])
else:
imCln.setmfcontrol(stoplargenegatives=negcomponent,
cyclefactor=cyclefactor, cyclespeedup=cyclespeedup)
imCln.clean(algorithm=alg,niter=niter,gain=gain,
threshold=qa.quantity(threshold,’mJy’),
model=[imagename+’.model’],
residual=[imagename+’.residual’],
image=[imagename+’.image’],
psfimage=[imagename+’.psf’],
mask=maskimage, interactive=interactive,
npercycle=npercycle)
imCln.close()
presdir=os.path.realpath(’.’)
newimage=imagename
if(imagename.count(’/’) > 0):
newimage=os.path.basename(imagename)
os.chdir(os.path.dirname(imagename))
result
= ’\’’ + newimage + ’.image’ + ’\’’;
fluxscale_image = ’\’’ + newimage + ’.flux’ + ’\’’;
if (pbcor):
if(sclt != ’NONE’):
##otherwise its already divided
ia.open(newimage+’.image’)
pixmask = fluxscale_image+’>’+str(minpb);
ia.calcmask(pixmask,asdefault=True);
pixels=’iif(’+ fluxscale_image+’>’+str(minpb)+’,’
+ result+’/’+fluxscale_image+’, 0)’
APPENDIX H. APPENDIX: WRITING TASKS IN CASA
ia.calc(pixels=pixels)
ia.close()
else:
## people has imaged the fluxed corrected image
## but want the
## final image to be non-fluxed corrected
if(sclt==’NONE’):
ia.open(newimage+’.image’)
result=newimage+’.image’
fluxscale_image=newimage+’.flux’
pixels=result+’*’+fluxscale_image
ia.calc(pixels=pixels)
ia.close()
os.chdir(presdir)
del imCln
# except Exception, instance:
# print ’*** Error *** ’,instance
# raise Exception, instance
501