1
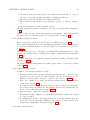
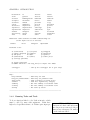
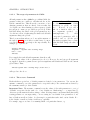
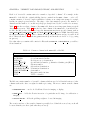
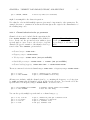
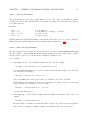
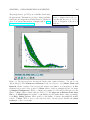
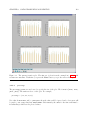
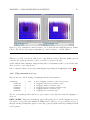
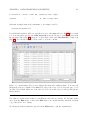
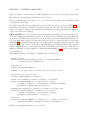
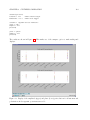
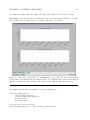
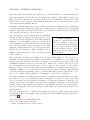
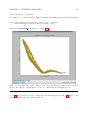
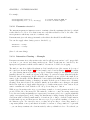
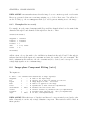
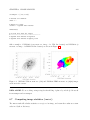
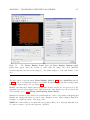
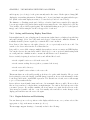
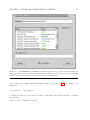
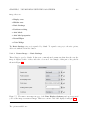
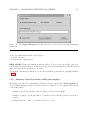
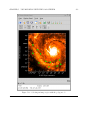
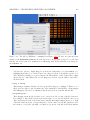
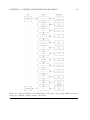
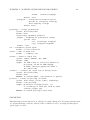
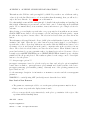
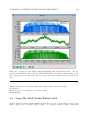
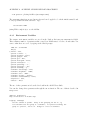
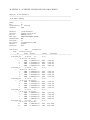
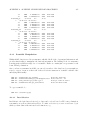
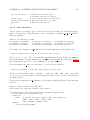
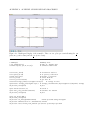
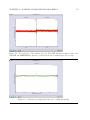
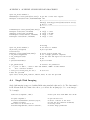
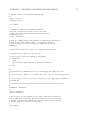
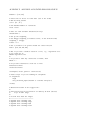
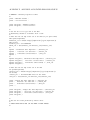
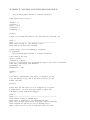
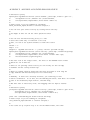
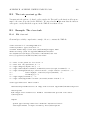
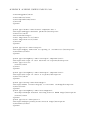
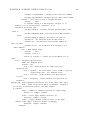
CHAPTER 7. VISUALIZATION WITH THE CASA VIEWER
7.3.2
271
Viewing a contour map
Viewing a contour image is similar to the process above. A contour map shows lines of equal data
value (e.g., flux density) for the selected plane of gridded data (Figure 7.9). Contour maps are
particularly useful for overlaying on raster images so that two different measurements of the same
part of the sky can be shown simultaneously (§ 7.3.3).
Several Basic Settings options control the contour levels used. The contours themselves are
specified by a list in the RelativeContourLevels box. These are defined relative to the two other
parameters, the BaseContourLevel (which sets what 0 in the relative contour list corresponds to in
the image), and the UnitContourLevel (which sets what 1 in the relative contour list corresponds
to in the image). Note that negative contours are usually dashed. BETA ALERT: This scheme
was adopted in 2.4.0 and is slightly different to that used in previous versions.
Figure 7.9: The Viewer Display Panel (left) and Data Display Options panel (right) after
choosing Contour Map from the Load Data panel. The image shown is for channel 11 of the
NGC5921 cube, selected using the Animator tape deck, and zoomed in using the tool bar icon.
Note the different options in the open Basic Settings category of the Data Display Options
panel.
For example, it is relatively straightforward to set fractional contours (e.g. “percent levels”), e.g.: