1
CHAPTER 7. VISUALIZATION WITH THE CASA VIEWER
261
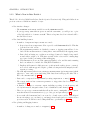
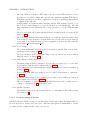
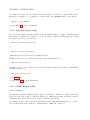
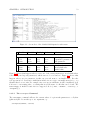
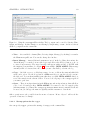
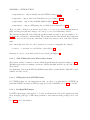
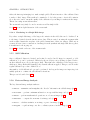
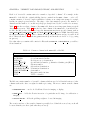
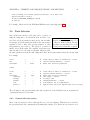
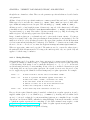
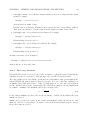
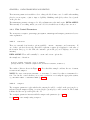
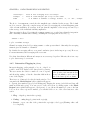
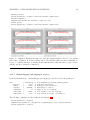
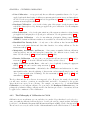
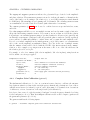
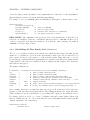
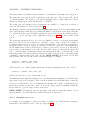
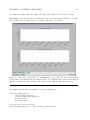
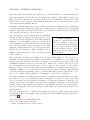
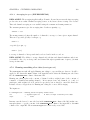
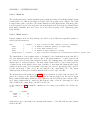
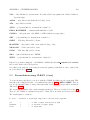
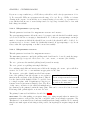
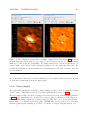
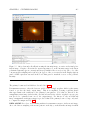
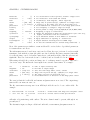
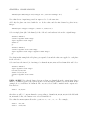
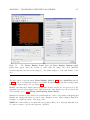
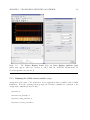
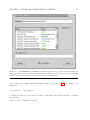
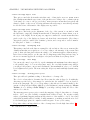
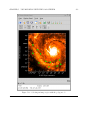
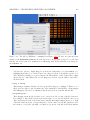
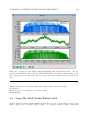
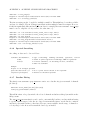
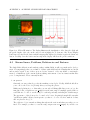
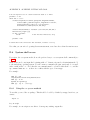
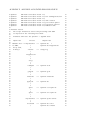
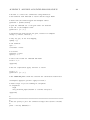
Figure 7.3: The display panel’s Main Toolbar appears directly below the menus and contains
’shortcut’ buttons for most of the frequently-used menu items.
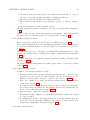
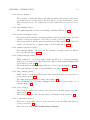
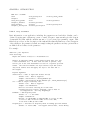
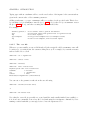
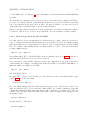
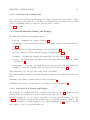
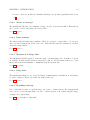
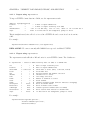
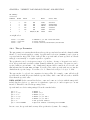
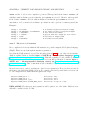
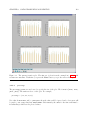
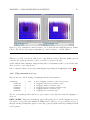
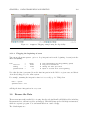
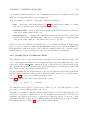
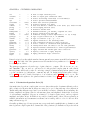
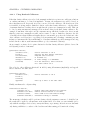
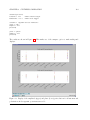
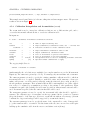
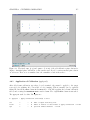
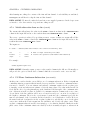
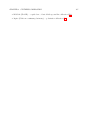
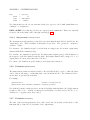
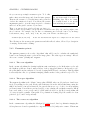
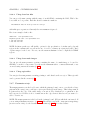
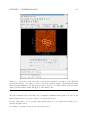
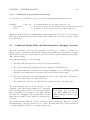
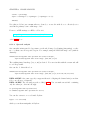
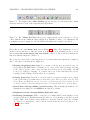
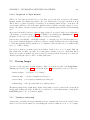
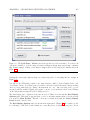
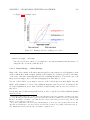
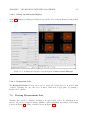
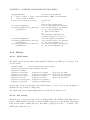
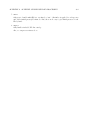
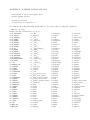
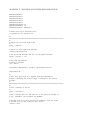
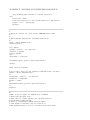
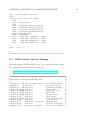
Figure 7.4: The ’Mouse Tool’ Bar allows you to assign separate mouse buttons to tools you
control with the mouse within the image display area. Initially, zooming, color adjustment, and
rectangular regions are assigned to the left, middle and right mouse buttons, respectively.
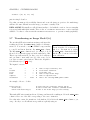
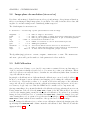
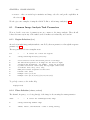
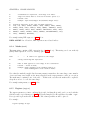
Below this are the eight Mouse Tool buttons (Figure 7.4). These allow assignment of each of
the three mouse buttons to a different operation on the display area. Clicking a mouse tool icon
will [re-]assign the mouse button that was clicked to that tool. The icons show which mouse
button is currently assigned to which tool.
The ’escape’ key can be used to cancel any mouse tool operation that was begun but not completed,
and to erase any tool showing in the display area.
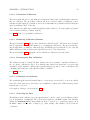
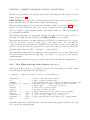
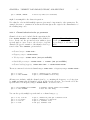
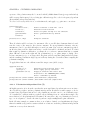
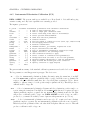
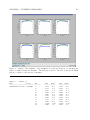
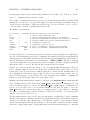
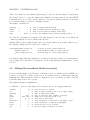
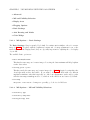
• Zooming (magnifying glass icon): To zoom into a selected area, press the Zoom tool’s
mouse button (the left button by default) on one corner of the desired rectangle and drag
to the desired opposite corner. Once the button is released, the zoom rectangle can still
be moved or resized by dragging. To complete the zoom, double-click inside the selected
rectangle (double-clicking outside it will zoom out instead).
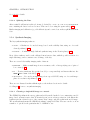
• Panning (hand icon): Press the tool’s mouse button on a point you wish to move, drag it
to the position where you want it moved, and release. Note: The arrow keys, Page Up, Page
Down, Home and End keys can also be used to scroll through your data any time you are
zoomed in. (Click on the main display area first, to be sure the keyboard is ’focused’ there).
• Stretch-shift colormap fiddling (crossed arrows): This is usually the handiest color
adjustment; it is assigned to the middle mouse button by default.
• Brightness-contrast colormap fiddling (light/dark sun)
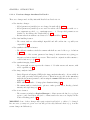
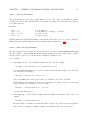
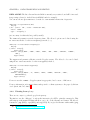
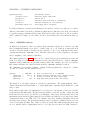
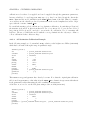
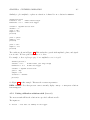
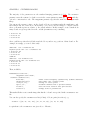
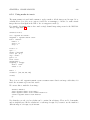
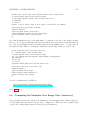
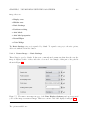
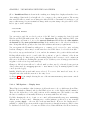
• Positioning (bombsight): This tool can place a ’crosshair’ marker on the display to select
a position. It is used to flag Measurement Set data or to select an image position for spectral
profiles. Click on the desired position with the tool’s mouse button to place the crosshair;
once placed you can drag it to other locations. Double-click is not needed for this tool. See
§ 7.2.3 for more detail.