1
CHAPTER 7. VISUALIZATION WITH THE CASA VIEWER
287
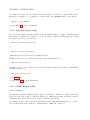
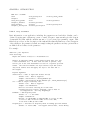
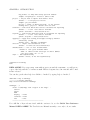
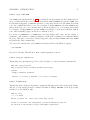
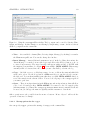
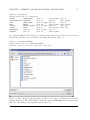
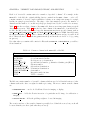
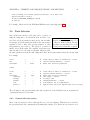
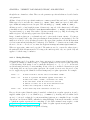
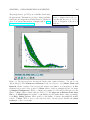
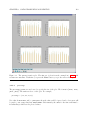
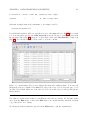
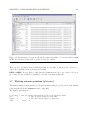
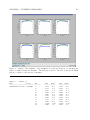
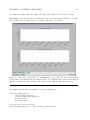
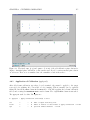
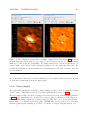
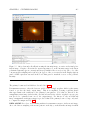
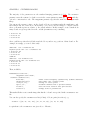
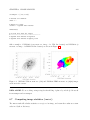
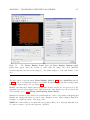
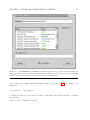
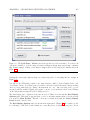
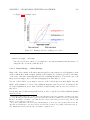
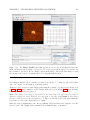
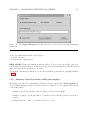
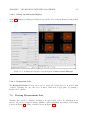
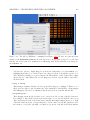
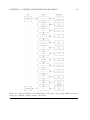
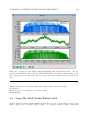
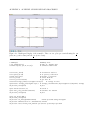
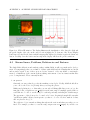
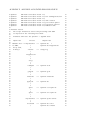
Figure 7.19: Setting up to print to a file. The background color has been set to white, the line
width to 2, and the print resolution to 600 dpi (for an postscript plot). To make the plot, use the
Save button on the Viewer Print Manager panel (positioned in the figure in the upper right)
and select a format with the drop-down, or use the Print button to send directly to a printer.
BETA ALERT: The postscript printing capabilities of the casaviewer are currently limited due
to some issues with the way we use Qt and do axis labels. Significant improvements have been
made in Patch 3. This will be further upgraded in the future, but for now you will need to follow
the suggestions above to get a useable plot. Note that ghostview may show a poorer version of
the PS than you will get when you print.