1
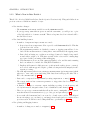
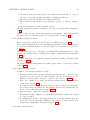
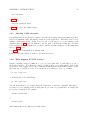
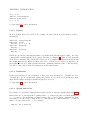
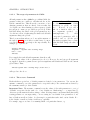
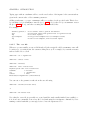
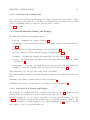
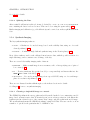
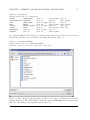
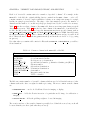
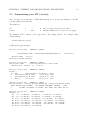
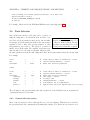
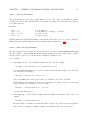
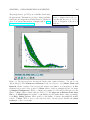
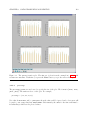
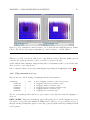
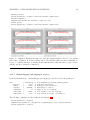
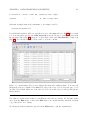
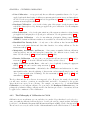
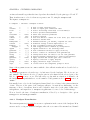
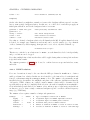
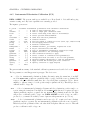
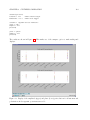
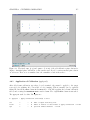
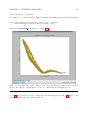
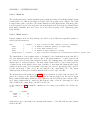
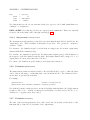
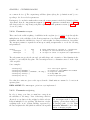
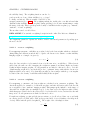
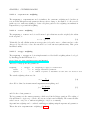
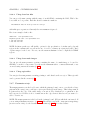
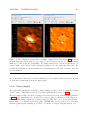
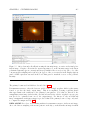
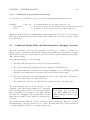
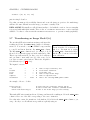
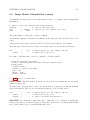
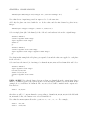
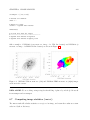
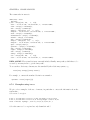
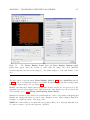
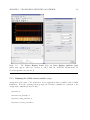
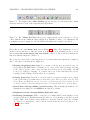
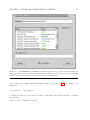
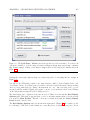
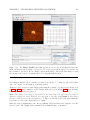
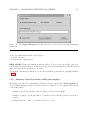
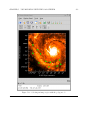
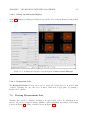
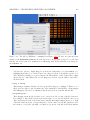
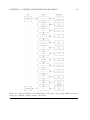
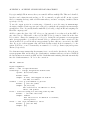
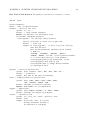
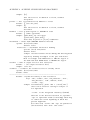
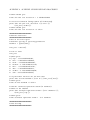
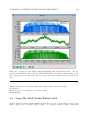
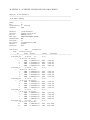
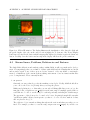
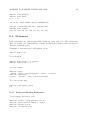
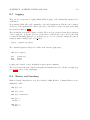
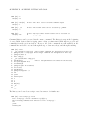
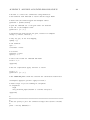
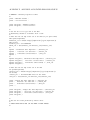
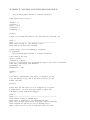
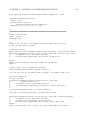
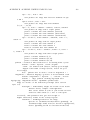
CHAPTER 7. VISUALIZATION WITH THE CASA VIEWER
267
Figure 7.6: The Load Data - Viewer panel as it appears if you select an image. You can see all
options are available to load the image as a Raster Image, Contour Map, Vector Map, or Marker
Map. In this example, clicking on the Raster Image button would bring up the displays shown in
Figure 7.1.
Starting the casaviewer with an image as a raster map will look something like the example in
Figure 7.1.
You will see the GUI which consists of two main windows, entitled ”Viewer Display Panel” and
”Load Data”. In the ”Load Data” panel, you will see all of the viewable files in the current working
directory along with their type (Image, Measurement Set, etc). After selecting a file, you are
presented with the available display types (raster, contour, vector, marker) for these data. Clicking
on the button Raster Map will create a display as above.
The data display can be adjusted by the user as needed. This is done through the Data Display
Options panel. This window appears when you choose the Data:Adjust menu or use the wrench
icon from the Main Toolbar. This also comes up by default along with the Viewer Display
Panel when the data is loaded.
The Data Display Options window is shown in the right panel of Figure 7.1. It consists of a tab
for each image or MS loaded, under which are a cascading series of expandable categories. For an