1
www.scb.se
PC-Axis 2008 – user’s manual
PC-Axis 2008 main module including function to create own
aggregations
News in PC-Axis 2008
Change variable order on graph screen - new button to easily transform the table to
time series.
Save change of texts when recording to pxq file - the text for contents was
introduced in 2007, now change of units and variable names can also be made.
Remove lines with 0, “-“and dots
Save to Google earth, show data on Google Map
LIST OF CONTENTS
TO INSTALL PC-AXIS ...................................................................................................... 2
SOME INFORMATION ON PC-AXIS AND ITS HELP FUNCTIONS ........................ 2
A WALK THROUGH OF THE TOOLBAR .................................................................................. 3
OPEN A DATABASE IN PC-AXIS. .................................................................................. 4
MAKE A TABLE IN PC-AXIS .......................................................................................... 5
TO SAVE A TABLE .......................................................................................................... 11
TO EDIT A TABLE IN PC-AXIS .................................................................................... 13
TO DO SIMPLE CALCULATIONS USING PC-AXIS ................................................. 15
UPDATING TABLES ....................................................................................................... 17
TO MAKE GRAPHS IN PC-AXIS .................................................................................. 18
PX-MAP – PRESENTS THE STATISTICS AS A THEMATIC MAP ........................ 20
ABOUT ADVANCED FUNCTIONS IN PC-AXIS ......................................................... 21
TABLE SIZE ...................................................................................................................... 24
CLASSIFICATIONS ......................................................................................................... 25
TO CREATE A CLASSIFICATION BASED ON AN EXISTING VALUE SET. ................................. 26
TO CREATE A CLASSIFICATION BASED ON A NEW VALUE SET. ........................................... 29
WHAT IS WRONG? ............................................................................................................. 29
SAVED QUERIES IN PC-AXIS MAIN MODULE........................................................ 30
LIST ON ACTIONS THAT CAN BE RECORDED IN THE MAIN MODULE OF
PC-AXIS (PXQ) ................................................................................................................. 35
PXQ XML FILES .............................................................................................................. 35
HISTORY ........................................................................................................................... 39
PC-AXIS FOR DISSEMINATION OF STATISTICS FROM OTHER
ORGANISATIONS............................................................................................................ 39
OVERVIEW OF THE PC-AXIS FAMILY SOFTWARE ............................................. 39
CONTACT PERSONS ...................................................................................................... 40
1
PC-AXIS 2007
www.scb.se
To install PC-Axis
PC-Axis can be downloaded from the PC-Axis website:
http://www.scb.se/Pages/List____314051.aspx
When PC-Axis has been downloaded from the website, follow the instructions in
the installation program.
Some information on PC-Axis and its help functions
There a few things good to know before you start using PC-Axis for the first time.
If you let the mouse stay over a tool key in the toolbar a small yellow frame will
tell the purpose of that very tool key.
If you need more help, please use the tool key that opens the help function. It is on
the far right position in the toolbar. This key is the way to get help for menus,
commands and how to work with PC-Axis. Press the F1 keyboard key to get
context related help wherever you are in PC-Axis.
2
PC-AXIS 2007
www.scb.se
A walk through of the toolbar
Open a database
Footnote
Select new values
Save
Print out
Undo
Copy
Pivot (clockwise)
Pivot (anti-clockwise)
Pivot any option
Sum
Percent
Per mille
Add
Subtract
Multiply
Divide
More information
Graphs
Maps
Search help
3
PC-AXIS 2007
www.scb.se
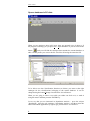
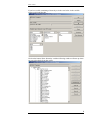
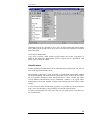
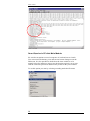
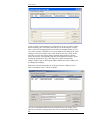
Open a database in PC-Axis.
Picture 1.
When you are opening a table in PC-Axis, there are optional ways of doing it. If
the program is running, you just press File – Open Database or you can click on the
button
and you will find the catalogue that contains the current database or
table. On this picture you can see the PC-Axis files all having the extension PX.
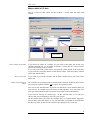
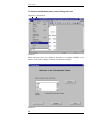
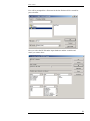
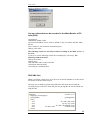
Picture 2
To be able to use the Classification function (see below) you must set the right
catalogue for the classifications belonging to the current database. It can be
changed using the button Change Classification. See in Picture 2.
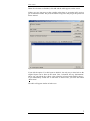
When you are going to select a new table you either can click on it, or mark it
using the mouse and then press the ENTER key.
Let us say that you are interested in Population statistics – press the subject
”Population”, select the sub catalogue ”Population statistics” and then select the
table named Mean population by region, age, period and sex. See Picture 3.
4
PC-AXIS 2007
www.scb.se
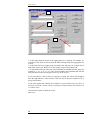
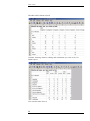
Make a table in PC-Axis
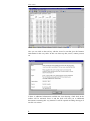
Now it is time to select values for the variables – decide what the table shall
contain.
Selected values:
CTRL+mause
Click here to
select all values
Picture 3
Select values to the table
If you desire all values in a variable you can click on the name bar for the very
variable selection box. As in sample on Picture 3, where all, two, values will be
selected by clicking on the word sex.
If you only want some of the values, just press the CTRL-button at the same time
as you click the left mouse button on the desired values. Then only those selected
will be put into the table.
How to select all
If you wish to get all the variables and all their variable values, just click on the
button All.
About classification of
values
All variables can be grouped into a classification if desired. It shall be done before
you select all variables with the ”All” button. See Pictures 4 and 5.
You can use the classifications if you have a table that is more detailed than you
want it to be, for example one-year classes or municipalities. You can create your
own age classifications or make your own areas based on the municipalities.
If you want to classify on variable age – in the selected table it is in one-year
classes, and you would prefer it to be five-year classes.
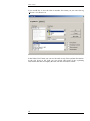
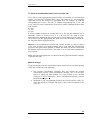
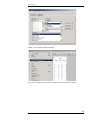
On the picture where you select the variables there is a button named Aggregate.
Press it and it looks like Picture 4. You will find what is available for classification
for this very table, in this case the variables age and region. We select age.
5
PC-AXIS 2007
www.scb.se
Picture 4
Press OK. In next window you will find a list showing the different classifications
available.
Picture 5
Select the 5-yearclasses and press on the OK button.
Then you will come back to Picture 3, but the list of ages has been changed to 5yearclasses:
Picture 6 a
6
PC-AXIS 2007
www.scb.se
When all selections are finished, click OK and the table appears on the screen.
If there are very long texts on the variable values there is an option in PC-Axis to
get an alternative menu. Just press the button Long texts and you get the picture 6b
below instead:
Figure 6 b.
If you tick the option “Use this layout as default”, the only way to alter back to the
original layout can be done in the menu View, Advanced, the tag “Information”
where you can tick the box “Show value selection in layout with small list boxes”.
If you immediately would like to turn back to narrow lists, just click the button
“Short texts”.
The table will appear similar in both cases.
7
PC-AXIS 2007
www.scb.se
Picture 7
Now you can click on the tool key with the icon of a star that gives the footnote
information for this very table. In this case latest up date, source, contact persons
etc.
If there is additional information available the icon showing a little book in the
toolbar will be activated. Press it and the book will lead you to additional
documents concerning this very material. It will be opened according what type of
text file it is written.
8
PC-AXIS 2007
www.scb.se
If you have a table containing a hierarchy as in the case below in the variable
region it will look like this:
Click on the button”Show hierarchy” and the following window will turn up where
you can select freely from the values:
9
PC-AXIS 2007
www.scb.se
If you select all the values the table will be presented with a hierarchical layout.
If you make a selection from the region variable the hierarchical layout will
disappear:
10
PC-AXIS 2007
www.scb.se
To save a table
When you are satisfied with the layout of the table you can save it on your hard
disc or a server. Use the pull down menu”File, Save as. "
Picture 8
Then a windows turns up where you can enter where to save the file and name the
file.
Location
Name
Picture 9
11
PC-AXIS 2007
www.scb.se
If you would like to save the table in another file format you just select the tag
”Convert” as in Picture 10.
Picture 10
In the listbox File Format you can save the table in any of the optional file formats.
In the tick boxes to the right you can decide what parts of the explaining
information that shall accompany the table into the selected file format.
12
PC-AXIS 2007
www.scb.se
To edit a table in PC-Axis
If you are not satisfied with the layout of the table there are some different things to
be done to change it.
The Pivot function can be used to let the variables change places in the table. Stub
and heading can be switched according to your own needs. Press this button ,
which give you total freedom to move around with the variables. You are using a
drag and drop technique as showed on Picture 11:
Picture 11
When you are satisfied just press OK and the new table turns up. This can be
repeated so you will really be satisfied with your table. You could also delete
variable and values.
13
PC-AXIS 2007
www.scb.se
It is also possible to change the texts in the column headings and the stub. Use Edit
Change texts... Here you mark the variables you want to modify, the variable name
and also variable values are possible to change.
In the second part of the Edit menu options to combine the active table with
another table is available. Then the tables have to be similar. Table with table can
be used when data for additional periods shall be put together with the original
table, while Table on table is used if you have two tables with different contents, as
imports and exports. Combination of tables also can be used in the software PXEdit.
14
PC-AXIS 2007
www.scb.se
To do simple calculations using PC-Axis
There are some simple tasks able to carry out with the PC-Axis calculation toolbox.
Let us study some samples.
Click on the pull down menu Calculate as showed on Picture 12 and you will find
the different options.
Picture 12
Let us try the percent calculation as is marked in the picture 12 above. Then the
following window pops up:
Picture 13.
15
PC-AXIS 2007
www.scb.se
If we wish to calculate the ratio female and male compared to the total we select
the total for the variable sex as the base for the operation. Then you will be
prompted a name of the new established value.
Picture 14
PC-Axis will automatically suggest the name ”Per cent”, you can change it if you
wish and then click OK.
Now all the figures will turn up on the screen. If you did not wish to have the initial
values left in the table there is a possibility on the base selection window to tick
according to your wishes. See picture 15.
Picture 15
16
PC-AXIS 2007
www.scb.se
Updating tables
If you have a table that contains the population in sixteen municipalities,
distributed on age, sex and time (1995-2000), and the figures for 2001 has become
published it is possible to update with the new figures instead of download the
whole table again from Sweden’s statistical databases on Internet.
You just link a table to another table (adding new values).
It is also possible to overlay a table with another table (adding a new variable), for
example if immigration and emigration are retrieved from two separate tables they
can be put together in a very large table using this function.
Please notice when using these two functions the tables have to be very similar. So
if something is changed in one of the tables the other has to be changed in exactly
the same manner to fit in together.
Picture 16
To use these functions, click Edit and then Link with table../Overlay with table.
See Picture 16.
You will then be prompted what catalogue to pick up the second table from. Be
aware that you are only offered the tables that are possible to put together. Select
the table you want to have and click OK. Then your table on the screen have got
new values or variable.
If you are using Link with table it is a matter of adding a new time period.
When using Overlay with table it is because you have to similar tables possible to
put together.
17
PC-AXIS 2007
www.scb.se
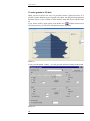
To make graphs in PC-Axis
When you have a table in PC-Axis it is possible to make a graph out from it. It is
possible to make different types of graphs, like charts, line diagram and population
pyramids. There is also possible to make thematic maps that will be showed later
on.
If you want to make a graph, please click on this icon:
and the picture below
will turn up where you can select from different types of graphs.
Picture 17
If you press the button ”Adjust..” you will get some options to change in the graph.
Picture 18
18
PC-AXIS 2007
www.scb.se
To coopy a graph
You can use the option copy in the graph window and insert the graph into another
Windows program like MS-Word and MS-Excel. Just click on this button
.
When arriving to the other program where the graph is supposed to be inserted use
the ”paste special” option using ”bitmap” format. If not using this, a table will
apear instead of the graph in the windows program.
Notice
Notice that some of the graph options need a certain structure of the table. For
example a population pyramid desires that the age variable is in the stub alone and
the sex variable is as column heads. If you are violating these rules PC-Axis will
tell you what is wrong for a certain type of graph.
When you have moved a diagram to Excel you must notice that it is just a picture
which is not possible to adjust in Excel.
If you on the other hand transfer a table it is of course possible to continue to work
on this table in Excel.
19
PC-AXIS 2007
www.scb.se
PX-Map – presents the statistics as a thematic map
Using the PX-Map makes it possible to transfer your table information into a
thematic map. If you want a regional distributed table to be a map, just click the
globe icon in the toolbar . All tables cannot be presented as maps. If it is not
possible the icon is non-collared.
This is how a thematic map in PX-Map looks like:
If you retrieve a table from the Sweden’s Statistical databases there is not yet made
any link to Maps.
To make a Map link
If you insist to make a map from a table retrieved from Sweden’s Statistical
Database on the Internet, download the table in PC-Axis file format to your
computer and save it. Then you open the file in a text editor like MS-Word. Search
for a section looking like this:
TITLE="Mean population by region, age, period and sex.";
CONTENTS="Mean population";
UNITS="number";
STUB="region","age";
HEADING="period","sex";
MAP("region")="Sweden_municipality";
Insert the line:
MAP("region")="Sweden_municipality";
You have to insert this line after STUB and HEADING which is in the beginning
of the file.
20
PC-AXIS 2007
www.scb.se
When you save the file again (be aware of that MS-Word tries to change the
extension of the file when saving in another file format than doc. Save in txt format
and change the extension to PX) it is possible to find the file from PC-Axis and
make a map in PX-Map.
About advanced functions in PC-Axis
The presentation of figures in the table cells can optionally hold thousand
delimiters. Use the menu View, Advanced
Picture 19
Where you select the tag ”Format for data cells”:
21
PC-AXIS 2007
www.scb.se
Figure 20.
Then mark the type of format for presentation of data you intend to use in the
tables. The selected option will work from the next table opened in PC-Axis.
PC-Axis optionally can be linked to another software. Then it is possible to launge
the other program from PC-Axis moving the present table into that very program.
To make such a link use the menu View, Advanced. The installation program will
automatically establish such a link to MS-Excel if it is available on the computer.
In the new window select folders named More Features and then click on
Additions. Now use the folder Other programs and the button
you will find this window:
. And
Picture 21
In the dialog box there are options to create links to four other programs. To create
such a link PC-Axis needs the following information:
−
The name of the program is entered in the Menu text field. If a & sign is
entered before a letter in the name this gives a key shortcut for that letter. The
program name will appear as a line in the File menu in PC-Axis.
−
The file type for the program is entered in the field File type.
−
In the field Program the path and the name of the exe-file has to be entered
using Browse support. If you cannot find the program search for it using the
File explorer search function.
When you getting back to PC-Axis you will find a line in the File menu named
Excel.
22
PC-AXIS 2007
www.scb.se
Picture 22
When you click on the Excel line PC-Axis automatically will pass the table on into
Excel. In Excel the table will be put in a new sheet and footnotes will appear below
the table in Excel.
23
PC-AXIS 2007
www.scb.se
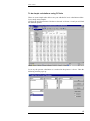
Table size
Another thing to be happy about concerning PC-Axis is the capacity to handle
tables consisting of millions of table cells.
One more thing that makes you glad is that you do not have to watch all these table
cells on the screen. The more table cells you show on the screen the longer it will
take to make operations on the table. Furthermore it uses more RAM. So it is
possible to reduce the number of table lines to be exposed on the screen.
Click on View, Advanced and select a tag called Table Presentation.
Picture 23
Here you can set the number of lines you as a maximum want the table to use on
the screen. Remember that even if you cannot see the table on the screen you can
work with the whole table. Everything you do will affect the whole table.
To change the table
layout
It is easy to change the table layout. If you do not want to have line numbers, grid
frames just enter the View menu omit or insert the different properties.
24
PC-AXIS 2007
www.scb.se
Picture 24
Within the program it is possible to copy, move or delete tables and subject matter
areas. When you are doing it in PC-Axis you are sure that all references are deleted
at the same time.
Click on File, Maintenance...
Copy, move or delete a table within a subject matter area. Select Copy/Move or
Delete in the dialog box Maintenance. Select a subject area as ”Population” and
delete, copy or move the tables.
Classifications
Former mentioned classification will be elaborated and explained and you will see
how useful the classifications can be.
The principle is that from a value set define a classification register that contains
the desired summing. The classification register then can be used on all files where
the very variable classified is used. One useful area is on the variable age where
several different classifications can be established. Another is on region where
municipalities can be put together in larger areas forming special divisions of the
country.
It is not a must to make classification registers; it is possible use the sum function
in PC-Axis. The advantage is the possibility to reuse the classifications.
To make a classification list takes some time, but you gain from it every time you
use it in the future.
25
PC-AXIS 2007
www.scb.se
To create a classification based on an existing value set.
Open File, Classification...
Picture 25
Select among the value sets available in the listbox. For example ALDER1, or use
Browse if you want to change to another classification catalogue.
Picture 26
26
PC-AXIS 2007
www.scb.se
Press Continue..
Picture 27
To avoid manual data entry you can use the option Read from file... and you will
find a window with already existing value sets.
Picture 28
Now the page will be filled with values from the selected value set (text and codes)
for example ALDER1, the name of the domain and the type of value set (V=Value
set of normal structure, H= Hierarchical value set, N=sub areas). Press on the
button named Aggregations.
27
PC-AXIS 2007
www.scb.se
1
2
3
Picture 29
1. In the upper field the name of the aggregation list is entered, for example 10yearclasses. This name will be used in the table heading when this aggregation list
is used.
2. In the next field every single group is named (Code and text), for example 0-9 in
both fields in this case. Before every new group you press the button Add.
3. In the bottom field you select the values that shall be included into the group for
example 0, 1, 2, 3, 4, 5, 6, 7, 8, 9. They will be found in the right hand side list and
then transferred to the left using the arrow key on the screen.
If it is not ticked on ”Allow values in a group to overlap” the values will disappear
from the right hand box when clicked to the left. This is the most common way of
using classification.
If you make groups that contains for example 0-4 years and also one 0-9 years it is
necessary to tick the ”Allow values in a group to overlap” button. This because 0-4
is a subset of 0-9.
Use the Show button to check the result.
Then save.
28
PC-AXIS 2007
www.scb.se
To create a classification based on a new value set.
To be able to create aggregations based on values not available in a classification
register, you first have to import those values. The value set is a file containing
codes and texts for the values to be aggregated from. For example ”0” with the
corresponding text ”0 year”. The code ”1” with the corresponding text ”1 year” and
so on. Value sets can be read into PC-Axis from a comma separated file that could
look like this:
0,0 year
1,1 year
2,2 year
It is also possible to import an existing value set (a file with the extension VS) to
optionally correct it. At most cases it is a PC-Axis file one want to make
aggregations for and then the PC-Axis file can be used as input to get the value set.
To be able to use the aggregations one shall secure the consistency between the
PC-Axis files and the aggregations lists.
Domain is a keyword that can occur for any variable. It refers to a class of values.
A list with all names of existing domains can be seen from the Classification
program if the right current database is linked. The name can also be found with
the Domain keyword in the PX-file. This name is to be used when establishing a
new value set.
When using the aggregation lists you shall secure the right classification catalogue
is linked to PC-Axis.
What is wrong?
If you after having created a classification register do not access to it when opening
a table the reasons can be the following:
•
•
The Current Classification catalogue does not contain the created
classification register. Shift classification catalogue. Do it at the same
places as where you shift database. It is also possible to set a default
catalogue in ”View, Advanced..”. Select ”Classification Directory” and set
the desired catalogue.
DOMAIN is not corresponding between the PX-file and the value set.
Open the PX-file in Notepad and check if the name corresponds to the
value set.
29
PC-AXIS 2007
www.scb.se
Picture30
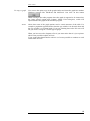
Saved Queries in PC-Axis Main Module
PC-Axis has an option to record a sequence of work and run as a batch.
You can record calculations, pivot and convert but not change text in the
Edit menu. It is also possible to decide how the time variable is to be
treated: Select for instance to always use the last time period(s), or to start
with the same time period but add new time periods as they are available.
To use this option you start by selecting recording under the file menu
30
PC-AXIS 2007
www.scb.se
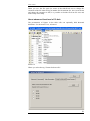
You will be prompted for a file name for the bat file that will be created for
your selections.
Next you select the PX file under 'Open database' and the variables and
values you want to have.
31
PC-AXIS 2007
www.scb.se
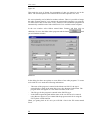
The table will be shown as usual
Continue choosing whatever editing and calculations you wish to do, for
instance pivot
You can also select 'Save as'
32
PC-AXIS 2007
www.scb.se
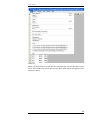
When you are ready stop the recording
You will see all the steps you have selected since you started recording.
33
PC-AXIS 2007
www.scb.se
If you want the recorded actions in a catalogue of its own you just click the
down left ticking box. The names that can be seen in the window of steps
above will not be changed and does not need to be changed in this case. If
you on the contrary would like to save more than one recording in the same
catalogue you has to rename some of the fields in each step. Click on the
first line as can be seen below and the different items opens for editing
below the window. The phrasing tmp must be changed for instance. If you
rename the output file in step 1 the input file in step2 automatically
changes. When a step is edited push update and the line in the window will
be changed accordingly.
Repeat the selection and update for each line in the list. When you have
done so the button “Save” will be available.
You get a confirmation what has been created and you can run the job as
often as you need by selecting run in PC-Axis or by double clicking on the
34
PC-AXIS 2007
www.scb.se
bat file in Windows Explorer.
List on actions that can be recorded in the Main Module of PCAxis (PXQ)
Aggregations
Calculations within a table
Conversion into dBase, Excel, Gesmes, HTML, Lotus, text matrix, PX-ML, PRN,
PX-file
Pivot, clockwise, anti clockwise and manual pivot
Change value order
The following actions are not allowed when recording in the Main Module of
PC-Axis.
If you try to use the following actions the recorded query will wrong. The
following could not be done:
Change texts/codes…
Change texts…
Link with table and Overlay with table
Calculations between tables
Converting to a relational table
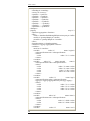
PXQ XML files
When a recording is done in PC-Axis the user can decide whether to use the old ini
file format or the new XML format.
The steps are recorded in separat temp XML files and when the user ends the
recording and gives the file a name the parts are put together in one file which can
look like this
<?xml
version="1.0"
encoding="iso-8859-1"
?>
<pxqueries
version="1.0">
<language>en</language>
<pxlangsuffix>
</pxlangsuffix>
<texts>
<text
id="and">and</text>
<text
id="by">by</text>
<text
id="dist">Distributed</text>
<text
id="unit">unit
variable</text>
</texts>
35
PC-AXIS 2007
www.scb.se
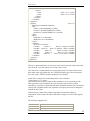
<datapres>
<rounding>0</rounding>
<secrecy>0</secrecy>
<symbol1>.</symbol1>
<symbol2>..</symbol2>
<symbol3>...</symbol3>
<symbol4>....</symbol4>
<symbol5>.....</symbol5>
<symbol6>......</symbol6>
<symbol7>.......</symbol7>
<symbolnil>-</symbolnil>
</datapres>
<pxquery
step="1">
<function>aggregation</function>
<files>
<infile>c:\database\Befolkning\BE0101A1oneyear.px</infile>
<outfile>C:\pxtemp\$tmp6.px</outfile>
<errorfile>C:\pxtemp\$tmp6.err</errorfile>
</files>
<keepdescription>1</keepdescription>
<classcat>C:\aggreg\Aggreg2006</classcat>
<variables>
<noofvar>5</noofvar>
<variable
order="1"
name="region">
<valuespecification>text</valuespecification>
<values>
<value
order="1">*</value>
</values>
</variable>
<variable
order="2"
name="marital
status">
<valuespecification>code</valuespecification>
<values>
<value
order="1">unm</value>
<value
order="2">mar</value>
<value
order="3">div</value>
<value
order="4">wid</value>
</values>
</variable>
<variable
order="3"
name="age">
<valuespecification>order</valuespecification>
<aggreg>C:\aggreg\Aggreg2006\10-years.agg</aggreg>
<values>
<value
order="1">1</value>
<value
order="2">2</value>
<value
order="3">3</value>
<value
order="4">4</value>
</values>
</variable>
<variable
order="4"
name="time">
<valuespecification>text</valuespecification>
<values>
<value
order="1">2005</value>
<value
order="2">2006</value>
</values>
</variable>
<variable
order="5"
name="sex">
36
PC-AXIS 2007
www.scb.se
<valuespecification>code</valuespecification>
<values>
<value
order="1">1</value>
<value
order="2">2</value>
</values>
</variable>
</variables>
</pxquery>
<pxquery
step="2">
<function>pivotmanual</function>
<files>
<infile>C:\pxtemp\$tmp6.px</infile>
<outfile>C:\pxtemp\$TMP7.PX</outfile>
<errorfile>C:\pxtemp\$TMP7.err</errorfile>
</files>
<query>
<stuborder>1,2</stuborder>
<headorder>4,5,3</headorder>
</query>
<variables>
<noofvar>5</noofvar>
<variable
order="1"
from="1">region</variable>
<variable order="2" from="2">marital status</variable>
<variable
order="3"
from="4">time</variable>
<variable
order="4"
from="5">sex</variable>
<variable
order="5"
from="3">10-years</variable>
</variables>
</pxquery>
</pxqueries>
The tag <valuespecification> is created as 'code' if the keywords Values and Codes
exist in the PC-Axis file and as 'text' if only Values exists.
The values for a variable which uses an aggregation file are always referred to by
their order in the aggregation list. If a Valuespecification tag is used it must have
the value "order" for that variable, but the tag is not needed.
In the above example for variable Region the value is stated as
<value order="1">*</value>
This means that all existing values for this variable are to be used in the px file.
This expressions is not created in PC-Axis, but if the pxq xml file is edited
elsewhere it is possible to define that all values should be included. This means that
if the px file is updated with a new region the saved query need not be changed to
include the new value.
If the selection is followed by further steps make sure that the editing or
calculations in these steps can still be done after a change of values in the original
PX-file.
The functions supported are
Function
selection
aggregation
Description
Select variables and values
Select aggregations and variables and values
37
PC-AXIS 2007
www.scb.se
pivotmanual
pivotauto
valueorder
vardelete
chgtextcontents
textcode
decimals
splitquarters
splitmonths
calculation
filecalculation
excel
asp
XMLC1
XMLC2
XMLC3
text
dbase1
dbase2
dbase3
dbase4
graph
matrix
lotus
html1
html2
prnmatrix
prntable
reltable
pxfile
Change variable order, manual
Change variable order, auto
Change value order
Delete a variable
Change text for contents
Change between text and code presentation
Change number of decimals (whole table only)
Split time variable when quarters
Split time variable when months
Operations:
remove remove values
sum
sum values for a variable
percent per cent
permille per 1000
add
add 2 values
subtract subtract one value from another
multiply multiply 2 values
divide divide one value with another
Calculations involving 2 files (tables)
Save as Excel
Save as asp
Save as PXML xdf
Save as PXML keys
Save as PXML cals
Save as text file
Save as dBase 1
Save as dBase 2
Save as dBase 3
Save as dBase 4
Save as graph file
Save as matrix file
Save as Lotus wk1 file
Save as html 1 (no table tag)
Save as html 2 (with table tag)
Save as delimited matrix
Save as delimited table
Save as relational table
Save as px file
Updated: 2008-01-17
38
PC-AXIS 2007
www.scb.se
History
PC-Axis was developed for the 1990 Population Census in Sweden. The software
has been further developed in the framework of the International PC-Axis
Reference Group.
For instance a Windows version 1995, an Internet version of PC-Axis named PXWeb is available and in use since 2000. In Statistics Denmark and Statistics
Finland software to create PC-Axis files, named PX-Make and PX-Edit
respectively, has been developed. Statistics Norway has made a map-software
named PX-Map.
PC-Axis for dissemination of Statistics from other organisations
The PC-Axis family products are used for dissemination of statistics from
statistical agencies in a lot of organizations and countries. For a complete list of
PC-Axis family members look at the PC-Axis web site:
http://www.scb.se/Pages/List____313990.aspx
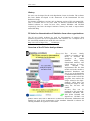
Overview of the PC-Axis family software
The
PC-Axis
family
software is leaning on the
thesis of Professor Bo
Sundgren
on
Output
databases
using
many
dimensional matrices, also
called cubicles or boxes.
These
thoughts
are
implemented into the data
model used in the Sweden’s
Statistical Databases and
also in use in the databanks
of Denmark and Norway. In
the figure to the left are the
programs that touches the
ellipse related to the SQLdatabase, while those not
touching the ellipse is only
using the PC-Axis file
format.
PC-Axis files can be
produced by PC-Axis SQL,
PX-Batch, PX-Make, PXEdit (From Finland) and
SuperCross. PX-Publ can
produce tables direct into a MS-Word- or MS-Excel documents. Makrometa and
Metalist are used for the maintenance of the metadata. Metadok is software for
entering metadata on registers for micro data.
39
PC-AXIS 2007
www.scb.se
Contact persons
[email protected] and [email protected] Tel: +46 8 5069 4000
40
PC-AXIS 2007