1
-r@
IEF
A
t
r
r
a
50und LaD
TDS
Software User's Manual
:
CrownInternational.Inc.
1718W. MishawakaRoad
Elkhart,IN 46517-4095
01997CrownIntemational,Inc.
102842-l
619'7
soundt"o=
Trademarks
The Techron TEF System 20 is manufactured by TECHRON Division of Crown
International, Inc., Elkhart, Indiana, U.S.A.,under license fromJet Propulsion
Laboratories, California Institute of Technology, Pasadena, California, U.S.A.
TEF" , TEF System 20., and TECHRON, are registeredtrademarks of TECHRON
Division of Crown International, Inc., Elkhart, Indiana.
The trademark Sound Lab'is licensed underUnited Statestrademark registration
number I.424.678.
Apple' and Macintosh' are registered trademarks of Apple Computer,
Incorporated.
IBM and all IBM products mentioned in the manual are registered trademarks
of International Business Machines, Incorporated.
Motorola' is a registered trademark of Motorola, Incorporated.
MS-DOS' and Microsoft' are registered trademarks of Microsoft Corporation.
The Techron TEF System 20 incorporates technologies requiring validated
licensing upon export from the United Statesin accordance with U.S. Export
Administration Regulations.
Acknowledgment
Techron gratefully acknowledges the kindness of author and publisher in
giving permission to reproduce their materials tn Sound labfor PC Software
User'sManual. Howard'S7. Sams& Co.: "B*sics of Sound, "from Introduction
to Professional Recording, by Bruce Bartlett, @1987.
TECHRON is a division of Crown International. Inc.. 1718 Sfest Mishawaka
Road, Elkhart, Indiana, 46517-4095.
Sound Lab :
Foreword
=
Dedication: "lt is the theory which
decides what we can
observe."
In1967, arcmarkable man, Richard Heyser, brought a
new paradigm to the science of sound. His passion for
the study of acoustics, sound perception and audio
measurement launched him upon a solitary journey in
uncharted ateas between paradoxes in the
understanding of sound.
His travels led from one end of the spectrum of
language and thought to the extreme opposite. Here
was the problem: Things don't always sound the way
they measure. \7hile statistical excellence could be
described in the sy-mbolic language of objective analysis,
it was often contradicted by the langtage descriptions
of subjective perception. And it was in this world of
paradox that Dick Heyser navigated comfortably until
he found an'entirely new wodd emerging on the
horizon.
The expansive Heyser often quoted Einstein: "It is the
theory which decides what we can observe." From the
center of that theory, Heyser began to push into new
horizons of sound measurement, uffestricted by the
boundaries of convention.
\-.
Along the way, his observations, drawn from nature
itself, fueled his thinking into even deeper areas of
He
understanding with far-reaching implications.
generously shared the results of his explorations at a
Sound Lab :
Foreword :
-
Syn-Aud-Con gathering in 7984 with the following
preface.
1. Nature proceeds without prejudice to the way
you look at it.
2. There ^re ^n infinite number of equally valid
ways of looking at nature-s/hich he named
the principal of alternatives.
The background of his work brought him to question:
If there is no preferred way of observing any one event,
was there away, perhaps, to travel from one alternative
frame of reference to another?
The experimental Heyser, comfortable with the validiry
of both the subjective and objective domains of sound
evaluation, began seeking maps that would enable
traveling between both frames of reference.
He reasoned: If there was a way, and the event still
retains the same essence, what essentially doesn't
change as you transfer from one alternative to another?
Heyser's pursuit of the dynamics and mathematics
underlying this assumption led eventually to its
application in sound analysis which Heyser named
"time delay spectrometry"-a specific class of integral
transform that maps among domains of differient
"a small tear on the fabric
dimensionality. Indeed itwas
of contemporary understanding" of electroacoustic
measuring.
Sound Lab :
Foreword
=
:
Heyser lived to see the beginnings of the acceptance
and incorporation of his thinking into sound analysis
equipment, and its actual application in the fields of
audio, medicine and geophysics. Unfortunately, long
before he could transfer the abundance of all his
thought into realities, he died suddenly in 1,987,
carrying much unfinished business with him.
A man before his time, Heyser, some have said, was the
Newton of our age. It remains to be seen, as time delay
spectfometry continues to growwith better equipment
and software to make practical use of Heyser's theory.
The Techron division of Crown International takes
particular honor in its good fortune of being one
avenue in which the thinking of Richard Heyser is
becoming avatlable in useful terms to people solving
problems in sound analysis.
'We
therefore dedicate this manual to the memory of
Richard Heyser, the remarkable man who gave us a
nev/ theory in which to not only observe, but to
continue to work, as well.
Richard C. Heyser received his B.S.E.E.degree from the University
of Lrizona in 1953. Awarded the AIEE Chades LeGeyt Fortescue
Fellowship for advanced studies, he received his M.S.E.E.from the
California Institute of Technology in f954. The following two years
were spent in post-graduate work at Cal Tech leading toward a
doctorate. During the summer months of 1954 and 1955, Mr.
Heyser was a research engineer specializing in transistor circuits
with the Motorola Research Labontory, Phoenix, Arizona. From
1956, until his death in 1987, he had been associated with the
California Institute of Technology Jet Propulsion Laboratory in
Pasadena California where he was a senior member of the TPL
Technical Staff.
Sound Lab :
Contents :
-
Contents
Trademarks
Acknowledoment
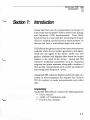
DedicationSection 7:
lntroduction
1-1
Unpacking
. . . . . . . . . . . . . . . .1. .-.1. .
Typicalequipmentforacousticalmeasurements............
.....1-2
you
need
\Vhat
to know
.................1.-2
A b o u t t h i s m a n u a l. . . . . . . . . . . . . . . .
...........I-2
Customersupport
.........1-5
,
\/
Section 2:
Sound Lab TDS Install program
Section 3:
Navigation in Sound Lab
Navigationin Sound Lab............
Gettingaround
Selectinga menu title from the main menu
Exiting the menu
Selectingmenu items .........
Enteringinformationin a sub-menu...........
How to undo what you entered................
Helpful featuresfor working with the software
Moving from module to module ...............
2-1
3-1
.....3-1"
..............3-2
....................3-3
......3-3
.....................3-5
....3-5
...,..........3-7
Sound Lab :
Contents
=
Seetion 4:
Menus for the TDS module
F i l em e n u
M e a s u r em e n u
Parametersmenu
Settingtest parameters............
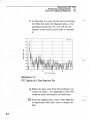
Time Response(ETC)Parameters
FrequencyResponse
Noise Test (NC)
S T r ). . . . . . . . .
S T r / R A S T(T
(
3
D
). . . . . . . . . .
3D Test
Averaging
Output
Display pull-down menu.........
Time Response...Magnitude
.........
Time Response...Heyser
Spiral......
FrequencyResponse
FrequencyResponse...Phase
FrequenryResponse...Magnitude
FrequencyResponse...Magnitude
and Phase
FrequencyResponse...Nyquist
FrequencyResponse...HeyserSpira1.......,.
3 D ( \ ? a t e r f a l l.). . . . . . . . . . . . .
NC (Noise)
s T r. . . . . . . . . . . .
OtherDisplayoptions
Summaryof Displaymenu options
I n p u tm e n u
Settingssub-menu
Calibration
sub-menu
Calibrating
the display
Communication
sub-menu............
......................4-1.
............4-LI
........4-75
..4-15
...............4-16
.................4-20
...,,.4-27
................4-29
....................4-30
................4-36
..4-39
......4-41,
4-44
...............
..............4-46
.................4-47
.... 4-48
4-49
...............
................4-50
4-51,
....................
,. 4-53
..............4-55
..............4-57
.......,,,,....4-58
...........,..,4-59
.............4-69
.................4-73
..4-74
...,.,..........4-76
...............4-75
4-81,
...............
SoundL6fr :
Contents :
-
Seetion 5:
,
\-
\
Performing measurements
5-'|
. . . . . . . . . . . . . . . . .5. .-.I. .
I n t r o d u c t i o n. . . . . . . . . . . . . . .
To make Sound Lab TDS tests...........
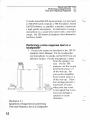
Performinga time responsetest on a loudspeaker................................5-2
Performinga frequencyresponsetest............
......................
5-6
.............
.................5-9
Noise criteriameasurements
E q u i p m e n tn e e d e d
......................5-9
NC measurements
with a microphone................
.............5-9
NC measurementswith sound level meters.................
.. 5-10
Introduction to STI
.....5-73
.............5-13
S T I a n d R A S T Im e a s u r e m e n t s . . . . . . . . . . . . .
Performing the measurementwith calibrated talker/ speaker..........5-15
Equipmentarrangementfor calibration...........
..............5-75
....5-16
Settingup parameters............
Arrangethe equipmentfor STI.............
.......5-19
.......5-20
Driving the system directly
Adding noise to STI measurements
.............5-21
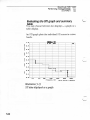
Evaluatingthe STI graph and sumrnarytable
................5-22
........5-23
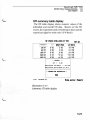
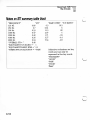
STI summary table display
About the STI measurementprocess.
..........5-25
......5-27
Introductionto 3D measurements.............
...5-28
Measuringloudspeakerswith 3D .............
Measuringrooms with 3D
.........5-30
Overlap ratio in 3D displays
.....5-31.
Section 6: Practice measurements
6-1
.............,........6-1
T w o b a s i ct e s t s . . . . . . . . . . .
..............5-t
A b o u tt h e E T C
........,........,6-3
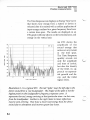
Readingan ETCdisplay
..................6-4
Doinga Time Response
Test(ETC)
................
6-4
Equipmentarrangement.................
.......6-5
Settingthe input parameters
.................6-6
Calibrating
the display
................6-7
for the TimeResponse
test............
Settingthe parameters
......6-8
Settingup the screendisplay
Sound Lab :
Contents
=
.......6-9
Runningthe Tirne Responsetest............
...6-1.0
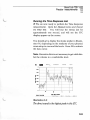
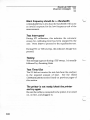
The power of the data cursor
.........6-11'
Using the cursor to examine the data
..6-tZ
Finding reflections
(TDS)
.......6-74
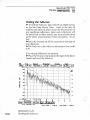
Doing a Frequency ResponseTest
Settingthe parametersfor the FrequencyResponseTest ....................6-1'5
.........6-17
Settingthe screendisplay
. . . . . . . . . . . . . . .6. -. .1.3
R u n n i n gt h e t e s t . . . . . .
.....6-19
Adjusting the receive delay to tune in to the phase
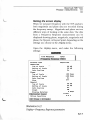
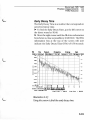
Making %oAlconsand RT60measurements.............
Terms to know
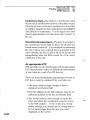
A n a p p r o p r i a t eE T C
ETC display example
Parameters
P o w e ro f t h e c u r s o r
Additionalinformation
C l a s s i c aRl T 6 0. . . . . . . . .
Early Decay Time
F i n d i n gt h e % 0 A l c o n s . . . . . . . . . . . . . . . . .
Appendix
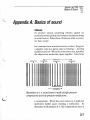
A: Basics of sound
'waves
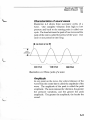
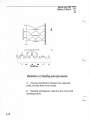
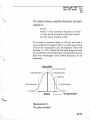
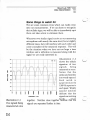
IllustrationA-3 Three cycles of a wave.
Characteristics
of sound waves
Amplitude
Wavelength
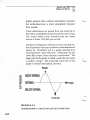
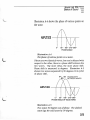
P h a s ea n d p h a s es h i f t . . . . . . . . . . .
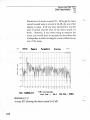
The phase of various points on a wave.
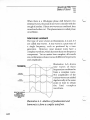
Harmonic content
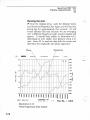
Behavior of sound in rooms
Echoes
R e v e r b e r a t i o.n. . . . . . . . . . . . .
Reverberationtime
Roommodes
...........
6-25
.......5-25
...................5-26
...............6-27
...............5-28
...................6-28
..............6-30
...................6-31
...6-33
...................6-34
A-1
.........A-1
............A-3
.......A-3
....... ............A-3
...................A-4
...........A-4
...... ...A-5
........A-6
...........1'-7
........4-7
.....................A-9
......A-11
...............A-11
Sound l-6fi :
Contents
=
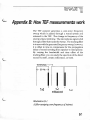
Appendix B: How TEFmeasurements work
Reflectionscan be kept out of measurement.........
Relationshipbetween Time/Frequency..........
Fourier transform
Measurementresolution...............
Trade-off between time and frequency.
Interrelatedparameters
Sweepr^te ...........
F r e q u e n c ys p a n . . . . . . . . . .
Receive(signal)delay.........
Bandwidth/Sweeprate............
Spacewindow considerations............
B-'l
.............8-2
B-3
......................
..........B'-4
......................B-5
............8-7
....................B-B
.....B-8
.................8-9
........B-9
..B-10
.........8-12
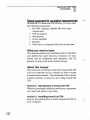
Appendix C: Data inEerpretation
c-1
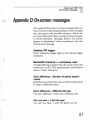
AppendixD: On-screenmessages
D-1
AppendixE: ASCIIfile formats
E-1
Sound Lab::
Contents :
-
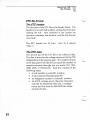
The TDS header
The TDS data...........
N o t e so n T D S f i 1 e s . . . . . . . . . . .
STI and RASTIfile formats
STI analyzersettingsblock
STI summary table block
STI ETC headerblock
S T I E T C d a t ab l o c k s
Notes on STI summary table block
Notes on STI noise data b1ock.........
Notes on STI ETC block
3D file format
The 3D masterfile header
N o t e so n 3 D f i 1 e s . . . . . . . . . . .
E-9
............
. . . . . . . . . . . . . . .E
. .-,9. .
. . . . . . . .E. .- 1 1
E-13
............
.......8-73
..........E-13
...............8-1.4
..................8-I4
E-18
..,..........
E-20
.....,......
............E-22
..............E-25
........F.-25
............E-26
Appendix F: Glossary
F-1
Appendix G: Best Frequency Hesolution and the TEF
Besolution V
@1
Bibliography
Sound Lab TDS::
lnffoduction
fuction'l:
=
Infrpduc:tion
Sound Lab TDS uses the measurement technique of
Time Delay Spectrometry (TDS) to make Time, Energy
and Frequenry (TEF) measurements. Time Delay
Spectrometry is a time selective measuring technique
suited to making transfer-function measurements on
devices that have a well-defined input and output.
TDS falls into the general classof two-port measurement
methods where the test system generates a test signal,
sends the test signal to the device under test, and
gathers, analyzes and displays data about the output
relative to the input of the device. Sound Lab TDS
measures traditional parameters such as frequency
response and phase response, along with a number of
TDS specific measurements such as time and distance
and energy-time-frequency curves.
Sound lab TD.Ssoftware displays and stores data on a
variety of microcomputers but requires the Techron
TEF 20 analyzer to make measurements and collect
data.
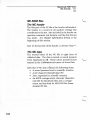
Unpacking
SoundLab TDSsoftwarecontainsthe following items:
. Ijser's manual
. 1,.44M,3.5"Distributiondisk
o Function key template
1-1
SoundLab TDS :
Introduction :
-
Typicalequipment for amustical measuremeltF
\-
In addition to Sound Lab TDS software you may need
the following equipment:
. MS-DOS computer (20MHz 386 with math
coprocessor)
. TEF 20 analyzer
. Microphone
. Power amplifier
' Speaker
. Hard drive or formatted disks for storing data
What you need to know
This manual assumesyour familiarity with (1) MS-DOS
and utilities that came with your computer, (2) your
mouse and its installation and operation, and (3)
general acoustics and sound system design.
\
About this manual
This manual is a referencemanual for SoundLab TDS
and is not intended to be a tutorial on how to make
acousticmeasurements.The remainderof the manual
contains sectionsto help you start using Sound Lab
TDS.
Sectlon 1: Introductlon toSoznd.Ia.b TDS
'What
you purchased,what you needknow, equipment
you need and where to get help.
Section 2: Installing Sound la.b TDS
Stepby step instructionsto install SoundLab TDSon
your computer.
1-2
\
SoundLabTDS:
lntroduction :
-
Section 3: NavigationimSound Lab TDS
How to move around in Sound Lab TDS. Explains
menus, important keys and moving around within the
program and from module to module.
Section 4: Menus for ttre IDS module
Thesemenus are detailed: File. Measure,Parameterc,
Display, and Input.
Section 5: Performing measuremerrts
This section of the manual detailsthe sequenceused
to maketime and frequencyresponsetests,noisetests,
STI/RASTItests.and 3D tests.
Section 6: Practice (neasurernents
A practice measufementsessionyou can set up to
perform the most fundamentalTEF measurementstime response a.ndfrequency fesponse. Explanation
and exercise on cursor functions for o/oAlcons and
RT60calculations.
AppendixAc' Basics of sound
Fundamentalacoustic principles and basic concepts
you need to know to understandTEF measurements.
works
Appendix B: How the TEF arrall.;o.:zer
This section describeshow the TEF analyzerworks,
discussesthe relationshipbetweentime and frequency,
measurementresolution, the interrelated parameters
and spacewindow considerations.
Appendix C: Datainterpretation
Described and explained are several tests to help
determine the legitimacy of a measurementalong with
cofirmon effors that can creep into measurements.
1-3
SoundLabTDS :
lnffoduction
Appendix D: On-screen messages
Appendix E: File structures
Appendix F: Glossary of terms
Appendlx C': TEF resolutionV
14
=
Sound Lab TDS:lntroduction
:
-
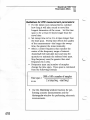
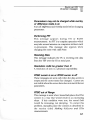
Cusf,omersupporE
All Techron products are backed by a customer
suppofi system. If you need assistance beyond that
provided in the manual, follow these steps:
. Try to duplicate the problem, keystroke by
keystroke, to see exactly what was done.
. Have the date and version number of software
available. This information is displayed in the
File. . .Aboul sub-menu.
. Have the date and version number of the
manual available (found on the front cover
page)'
. Be at the TEF analvzer and call customer
support.
{
Customer support for Techron hardware and software
can be reached by dialing:
(800) 833-8575 North America
(zLD 294-8295 Outside North America
(zLD 294-8302 FAx
Techron CustomerSupport takescalls daily from 8:00
errato 5:00pru EasternStandardTime. Before 8:00 or
after !:00, you may leavea recordedmessagevia voice
mail or send a messagevia FAX. The automatedTEF
FAXInformation Systemhasan index of varioustopics
relatedto the TEF analyzersand softwarethatyou can
requestto have transmittedto your FAX machine.
1-5
SoundLabTDS :
lnstall
:
U
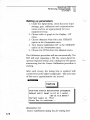
Section 2:
Sound Lab lnstall program
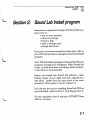
Assumedis a minimal knowledge of DOSand thatyou
know how to:
. turn on your machine
' .
come to a prompt
. format a disk
. make a backup coPy
, . change directories
If you are not sure how to perform thesetasks,refer to
your DOSmanualbeforestartingthe Soundlablnstall
program.
U
Your TEFSoundLab packageincludesall the files and
programsneceqsaryfor installation.While SoundLab
works on both hard drive and floppy-basedsystems,
a hard drive is recommended.
Before youiinstall this Sound Lab software, make
backup copies of your disks and store originals in a
safe place. Install from the copy which is not write
protected. (This meansit can be written to.)
Let's assumethat you're installing Sound Lab TDSon
your hard disk, which is drive C, from floppy drive A.
Put the copy diskindrive A and type A:TDSINST.Press
Enter to continue.
e-1
Sound Lab TDS :
lnstall
:
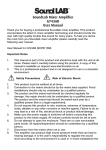
SOUHD LftE
F ro g ra l r
I nsta I lat ion
(c)
copsrisht
TECHFoN
Division
of
Croun
P.O.
Box
1?14
!l ,
Elkhart,
(2'.9)
e ,O
1991,9.1
Inc.
Internation€l,
I.OOO
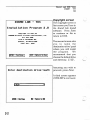
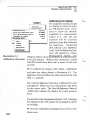
1'l ishauaka
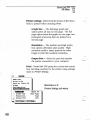
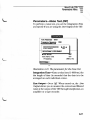
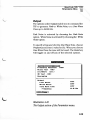
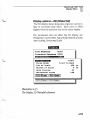
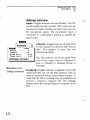
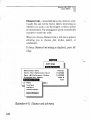
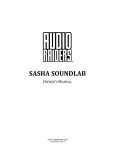
The copyrightscreenis
first screenyou'll seein
the Sound Lab Install
software. Press Enfer
to continue or Esc to
return to DOS.
Fd .
45515-'.OOO
- 4295
294
IN
dest inat
Enter
Copyright screen
TDS
ion
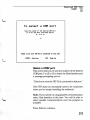
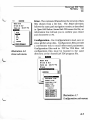
The secondscreenasks
you to name the
destination drive: \path
where you will install
the program. We
recommend that you
choosethe defaultdrive
and directoqy,C\S/\.
driue:\path
Assumingyou wish to
proceed, pressEnter.
A third screen appears
not found.
it TDS.SETis
IffiAA_
EHTEF
2-2
-
Continue
ESC -
Eeturn
to
DOS
SoundLabTDS :
lnstall -
To =e lect
thc
ts
or
H
a trtr|'l Fort
nuFb-r
for
tle
of
tl,
Chek
to
be
EIITEF
TEF-zO
sure
-
entire
th.
Hogt
2
d.3ircd
COi
Int.rfrcc
or
is
Frt
oEtion
Hl
@reted
ESC
to
-
Blck
thi5
Fort
Up
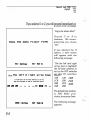
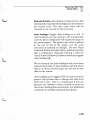
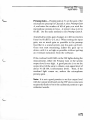
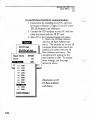
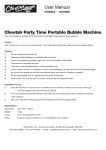
Select a COM poft
This screentells you to type the number of the desired
COMport (l or 2) or H to select the HostInterface and
a messageprompting you to:
"Check
to be sure the TEF20 is connectedto thisport."
(The TEF does not necessarilyneed to be connected
when you're simply installing the software.)
Note If you intend on using parallelcommunications
select Host Interface at this time. You will be able to
select parallel communicationsonce the program is
installed.
PressEnler to continue.
2-3
Sound Lab TDS :
tnstatt
=
If you selected 1 or 2, you will proceed immediately to
ascreenwitha message:
"Copy
the demo files?"
tropg
tFre denc
(Y/H)
f iles?
Choose Y or y'/ to
continue. We recommend that you choose
"yes."
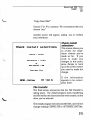
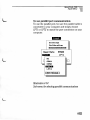
If you selectedthe l/
option, a new screen
will appear with the
following message:
"Use
Y/N
-
the
to
left
htdrli9ht
th.
loa
ls
ESC
Contlnuc
DIP
&
the
teltc|rg
HI
ff
-
B.ck
right
base
th.
arrtrur
ddress
HI
Llp
s
lnt.rtrc.
laa
set
kegs
by
brrd.
26
3.a
IE
the left and right
arrow keys to highlight
the HI base address as
set by the DIP switches
on the HI interface
board."
108
148 188
1C8
208
248
288
2C8 308
348
388
The default base address
is 308. Make your
choice, then press Enfer.
EilIER
2-4
- Cont iro.
ESC
-
B.ct<
lh
The following message
appears:
SoundLabTDS :
Install -
"Copy
demo files?"
Choose Yor y'y'tocontinue. We recommend that vou
"yes."
choose
Another screen will appear, asking you to confirm
your selections.
trheck
instal
select
I
=
Source
n:\SL\
-
Destination
ions
C:\SL\
HI
Base
CoFt
EHTEF
-
continu-
Addrss
deno
=
3{18
fil$
ESC
-
B.ck
UF
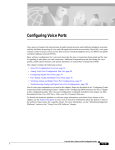
Check install
selections
This screen allows you
to review the installation choices you've
made so far. If you
wish to make any
changes at this point,
press Escape to back
up to the screen where
you need to make the
change.
If the information
appears to be correct,
press Enter.
File transfer
\-
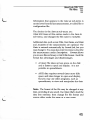
The final screen announces that the File Transfer is
taking place. The Install program startstransferring
the files within the directoriesthat were created.on the
drive you've selected.
This installprogramwill only transferfiles,and will not
BAT files.
changeexisting CONFIG.SYSor AUTOEXEC.
2-5
Sound LabTDS :
Install -
Assoon asall files aretransferred,you witl be given the
message:
\-'
"TDS
hasbeeninstalled. TypeSLto begin using Sound
Lab TDSsoftware."
Sound Labwill open in the last module of Sound Lab
you used. Choose the Go 7o option under the File
menu to select TDSto open Sound Lab TDS'
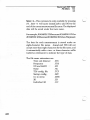
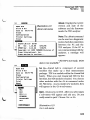
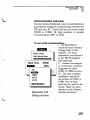
Required files
Afte; installation, use the MS-DOS command Tree to
confirm that the following files are in the S/ directory'
All of the files shown in the following illustration must
be present, but not necessarily in the order shown'
DPMIl68I.OVL
TDS.OVR
TDS.SL
RTM.EXE
SL.MNU
SL.COM
TDS.SET
DATA
Illustration 2-1
The directory tree after TDSinstallation
2-6
'\.,
Sound Lab TDS :
Navigation
Section 3:
=
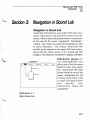
Navigationin Sound Lab
Navigation in tound Lab
Sound lab 7DS software runs under DOS and uses a
mouse input device and pull-down menus and submenus, which contain either parameters or commands.
"comrnnnd", "pa.rameter,"
In this manual the terms
"option" and "itetn" are used interchangeably to refer
to menu selections. The current Sound Lab TDS
module name appears in the upper left hand corner,
along with the major menus in the Sound Lab TDS
program: File, Measure, Parameterc, Display, andlnput.
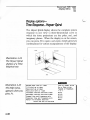
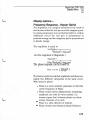
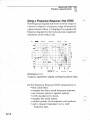
Main Menu Bar
111s11s-Je
Pull-dow1
run Sound Lab TDS , you
selectone of thefive menu
titles from the main menu
bar. SoundLabTDS then
drops down the rest of the
menu, displaying the list
of items onthe menu. One
of more sub-menus allow
your
you
specify
instructions about test
parameters.
Illustration 3-1
Main Menu bar
3-1
SoundLab TDS :
Navigation :
:
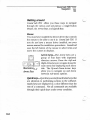
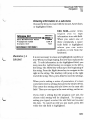
Getting around
Sound Lab TDS offers you three ways to navigate
through the menus and sub-menus: a single-button
Mouse, the Arrow keys, and Quick keys.
Mouse
You must have installed the device driver that controls
the mouse to be able to use it in Sound Lab TDS. If
you do not have a mouse driver installed, see your
mouse manual for installation procedures. Soundlab
uses the left button of the mouse to select items and
move the cursors in displays.
rn
ci
@@
Illustration 3-2
Arrou.tKqts
Arow keys are a
Arrow key#The
group of four keys with imprinted
direction arrows. Press the Left and
Rigb t Arrowkeys to navigate along the
main menu bar displaying each menu
title. The Up and Doutn Arrout keys
allow you to navigate up and down
between sub-menu options.
keys arckeyboard letter keys that
Quickkeys---Quick
are shortcuts to performing actions in the software.
Quick keys are displayed in a color different than the
rest of a command. Not all commands are available
through their quick-keys under every condition.
3-2
SoundLab TDS :
Navigation
=
Eelecting a menu title from the main menu
There are three ways to select a menu title from the
main menu bar.
Meus6-pqint
mouse.
and click the menu title with the
Arrow keys-Press the Rigbt Arroukey or Left Arrow
key to highlight your choice, then press Enterto select
it.
the highlighted letter in the menu
Quickkeys-Type
(such
title
as the n h Display.)
Exiting the menu
No matter how you select a menu, you can exit the
menu (close the window) by selecting Alt-Closein any
of the three wayJ:
Mouse-Point
and click Alt-Close.
Arrow keys-Press
and press Enter.
Quick keys-Hold
the Dotun atrolu key to Alt-Close
Alt and press C.
J-J
SoundLabTDS:
Navigation :
:
Selecting menu items
Afteryouselecta menutitle,a sub-menuappearswith
a list of commands on the left and their settings on the
right.
Selecting an item will invoke one of three things:
o A new sub-menu
. A highlighted area called an editfield.
. A toggle or switch between two settings.
Command
Quick keys
fon of Scale
of Scale
Botton
Auto Scaling
Action buttons
Illustration 3-3
Sub-menu options
34
Editfi.eld
(reuercetype wben
selected)
Sound Lab TDS :
Navigation
=
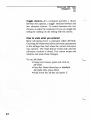
Entering information in a suh-menu
Choose the itemyou wantwith the mouse, Arrow keys,
or highlighted letter.
Rrference
Unit
Irasca
lg
lEilro-uuE--l
Zrro
dE
Feference
Distance
Ualue
feet
Unit
rETFE-lo_FI
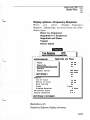
Illustration 3-4
Editfield.
o.ooo(la
113O,O
SFeed
FroFEgation
ITiT=ii;;i6-I
items
Edit field-some
require you to type
information in an edit field.
'When
you select one of
these commands, a space
(edit field) is highlighted
where you can enter
numbers or text from the
keyboard.
It is not necessaryto erase any highlighted numbers or
text.'SThenyou begin typing, the new data replaces the
old. To edit information in the highlighted field, you
may press the Left Arrotakey to navig te to the left in
the string. The Homekeywill jump to the beginning of
the string. Pressthe RigbtAnoru key to navigate to the
right in the string. The End key will jump to the right
end of the string. Then, pressEnterto store the settings.
When you're setting a series of parameters, it's more
convenient enter a setting, then press the DounArrout.
This enters the setting and tabs down to the next edit
field. Then you can type in the next setting, and so on.
If you enter a setting that the ptogram can't use, the
closest valid setting will be displayed. To charige a
setting you typed, re-select the edit field and re-enter
the data. To cancel an edit you just made, press ESC
while the edit field is highlighted.
3-5
Sound Lab TDS :
Navigation :
:
Toggle choices-If
a command provides a choice
between two options, a toggle switches between the
two alternate choices. To switch between the two
choices, re-select the command. Or you can toggle the
setting by clicking on the setting with the mouse.
How to undo what you entered
Many sub-menushave a commandcalledAlt-Undo.
Choosing z4lt-Undo resetsall the sub-menu parameters
to the settings they had when the current sub-menu
was opened. The Undo featttre works only until the
sub-menu window is closed. You cannot reopen the
window and undo those thanges.
To use Alt-Undo:
o Using your mouse, point and click on
Alt-Undo.
. Press the Doun Arrout key to highlight
Alt-Undo, then press Enter.
. Hold down the Alt key and press U.
3-6
Sound Lab TDS :
Navioation
::
"
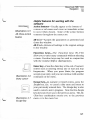
Helpful features for working with the
software
Illustration 3-5
Alt-Close action
button
Action buttons-Usually
^ppear at the bottom of
a menu or sub-menu and cause an immediate action
to occur when chosen. Some of the action buttons
cofirmon throughout the menus are:
Alt-Close-Accepts the parameters as presented and
closes the window.
Alt-Undo-Returns all settings to the original settings
in the window.
Function
keys-The
Function Aeys (F1-F10)
allow you to enter many commands without selecting
a menu. Function keys may be used in conjunction
with the Control, Sbiftor Altematekeys.
Illustration 3-6
Entry cursor
Illustration 3-7
Escape key
Enter key-Press the Enterkey at the end of numeric
entries such as entering sweep rate or start and stop
'$7hen
you press Enter, the program
frequencies.
accepts your entry, and you can continue with another
command on the menu.
Escape key-In numeric or typed entries, press the
Escapekey, Esc, to cancel a data entry and return to
your previously entered data. The Escapekey is also
used to cancel a test in progress. Note that the Escape
key does not retum you to the previous menu. The AltClose key combination retums you to the previous
menu or to the menu bar.
3-7
Sound Lab TDS :
Navigation =
:
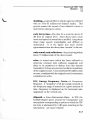
Message boxes-Pertinent information to report the
status of a process or calculation is presented in
windows called messageboxes. Messageboxes contain
information only. They typically appear at the top
center of the screen under the main menu bar.
Moving from module to module
OFen Old
Drive t Dir
Save as
Shift-F3
Er€ge
Cdf ig'urat ion
Printer
Settings
Pr int
About
IEE
EIT
llLS
ELF
HTA
RTADEI.IO
Precision
sLtl
EQ
lTTFdTo-;;-]
Illustration 3-8
Go to sub-menu
3-8
Sound lab sofware is comprised of
several modules that make up a total
measurement package. Whenyou start
Sound Lab TDS for the first time, the
TDS module is loaded. You choose
other modules with the Go to command
in File menu. As you install new
modules, theywill ^ppear inthe Goto
sub-menu.
\-
SoundLab TDS=File Menu
-
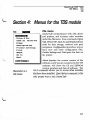
Section 4: Menus for the TDS module
TDS
File menu
IET
IIEililil
Drive
* Dir
Saue gs
Shift-F3
Erase
Eonf iglurat ion
Printer
Settings
Print
About
Go to
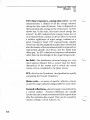
Sound lab commttnicates with disk drives
and printers, and accesses other modules
under the File menu. Four comma nds (Open
Old, Drtue & Dir, Saue As, and Erase) perform
tasks for data stotage, retrieval and path
navigation. Configuration provides a way to
load, save and erase configuration files.
Printer Settings and Print print the data on
the printer.
Quit
l-ETFE'ToEe
Illustration 4-1.
File menu
I
About displays the current version of the
software, and if you are connected to the TEF
analyznr, will show the EE and EEPROM
version numbers and date of software. The
Go to command allows you to accessother modules
that havebeeninstalled. Quit,the lastcommand,is the
only proper *ay to exit Sound Lab.
4-1
SoundLab TDS::
File Menu .-
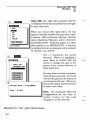
Open Old...The Open Old. command retrieves
and displays stored data and allows you to navigate
to other directories.
EEIil
EEililT
ETC
IEil
\7hen you choose File, Open Old, a list box
appears showing avaiTable file types from which
to choose. Afteryou choose a file type, a list box
opens displaying filenames and/or directories
and subdirectories. Filenames appear as a n me
plus extension, e.g. FRSTA/IEAS.DS.A directory
or subdirectory has no extension and is enclosed
by brackets, e.g., IDATA].
HC
STI
3D
TDSSD
TETt--E-Io-e
I
The [..] represents the parent
directory. \rhen it is highlighted,
press Enter or double click the
mouse to change the path to the
parent of the current directory or
other directories.
tilr
FIFST.TDS
FFST}IEAS.TDS
lil
Err-c-E;;]
ITTFET-I -'l
[mE:TnTo
TF'TFFFE;i-I
current
Path
Fath
:
:
e:\SL\DATA\
No more than ten items can appeat
in the list box at any time. The word
(more)willappear at the bottom of
anylist gre terthanten. Whenyou
choose this option, the list advances
to show more items.
C:\SL\
Note: The commands Erase and
Configuration use the same or
similar routine for file path
navigation and file selection.
Illustration 4-2 File...Open Old sub-menus.
4-2
v
SoundLab TDS :
File Menu
=
Four other commands are displayed:
ITTE=ETffi
fETFFulf---l
TFTFETo
TETFFFfrfl
I
I
Illustration 4-3
Action buttons
Alt-Close-Closes the sub-menu without making a
selection.
the file information box showing
Alt-Full-Expands
files and directories with details such as file size, date
and time cre ated. Alt-Brief appearsin the file information
box when you choose Alt-Full. Choosing Alt-Brief
collapses the file information box to a list box of file or
directory names only. If you want to revert to the file
information box, select Ah-Full.
Alrlnfo-If
a fiiename is highlighted, Alt-Info opens a
file information box containing the job description
about that file. If a directory name is highlighted, the
information box will show the current path and the
path you can travel to if you press Enter.
Alt-Print will print the job
Alt-P4nt-Selecting
description that was recorded with the SaaeAs command
for each of the files listed in the sub-menu. Seven job
description entries will print per page.
4-3
Sound Lab TDS :
File Menu
-
Open
Drive & Dir - DOS allows you to
group files in directories. The
Driue & Dir commandallows you
to selecta drive and directory for
data storage or retrieval. Sound
Iab TDS defaults to drive C: and
directory \SL\DATA.
Old
Irc-IE
C
ErlilrcI
Directors
Pattr
l-Arr--Elo--5]l-Ajr--
\SLV)ATA\
jilto--l
Go to
Qutt
l-Arr--mo-Jl
Note The Drive and Directory
will reflectany changesmadewhen
the File...Open Old commandis
used.
Illustration 4-4
Driue & Directory sub-menu
lrdilr
Fil€
NaF€
Title
U3er
ALTAFool,Etc
ETC
Nahe
Teken
Date
E?./2A/L993
Location
Coalbush
Strou
Feedback
Through
AItEr
.,9: 15 :33
Church:
Bend,
South
IN
ion
DescriFt
second
Line
|.
I
Lin€
2
PCc
Fomet
To
LJS./JAE
t-5o
ETC,
on
Center
Alt€r
Used
At
As
zkHz
Pick
UF ]lic
Binarg
Save
f ETFeIo-;]l-Alr--iffi
iE-l
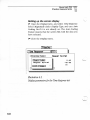
IJlustration 4-5 Saue as sub-menu
Save as-Saves the current test data, settings, parameters
and job description to the drive and directory selected
in the Driue E Dirsub-menu. Until you execute Saue
a.s,testdatais stored only in memoryandwillbe erased
if a new measurement is performed.
4-4
Sound Lab TDS :
File Menu :
-
L
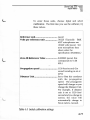
Information that appears in the Saue as sub-menu is
carried over from the last measurement, re-called file or
configuration file.
The choices in the Saueas sub-menu are:
Clear All: Erases all the entries made in the SaueAs
sub-menu, and changes the file name to nonarne.
Additional data such as test Title, UserName, and Date
and location of the measurement are optional. The
Date is entered automatically by Sound lab, but you
maychange it. You mayalso entertwo linesto describe
the measurement under Description. Format allows
you to save files in binary or ASCII file format. Each file
format has advantages and disadvantages.
o A binav file takes up less space on the disk
and is fastcr to open and display. It is not
portable to spreadsheets.
.
ASCII data requires several times more disk
space and takes longer to open and display,
but you fixry use other programs, such as
spreadsheets, to view and manipulate the data.
Note The format of the file may be changed at any
time, providing itwas saved. Use OpenOldto loadthe
data into memory, then change the file format and
resave either under the same or a new name.
4-5
Sound Lab TDS :
File Menu
:
-
Save +L-This command is only available by pressing
F3. Saue +,/ will cause Sound Lab to add 00L to the
end of the curent measurement file name. The displayed
data will be saved under that new name.
Forexample, ROOMFIIE.TDSbecomesROOMF0OL.TDSor
rcOMFWl.ZDSbecornesRAoMFW2.TDSvihenFiispressed
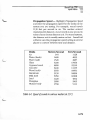
The data for each measurement is stored under an
eight-character file name. Sound Lab TDS will not
accept more than eight characters for the file name, and
it automatically adds a two- or tfuee-character suffix
(called an extension) to indicate the type of data.
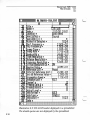
The file name extensions are:
Time and distance
Frequenry
STI and RASTI
Noise
TDS config. file
Startup config.
Go to menu
46
.ETC
.mS
.STI
.NC
.TCF
.SET
.MNU
3D
.3D
Individual 3D
.###
SoundLab TDS::
File Menu :,
-
Open
Driue
Saue
Old
A
as
Dir
Shift-F3
I@
ETC
IIT
NC
STI
3D
TDS3D
fErF-ilo-;;]
Illustration 4-6
Erasesub-menu
Erase - The command Eraseallows the removal of data
files chosen from a list box. The Erase sub-menu
follows the same pathnavigation routine as described
n Open Old. Beforc Sound lab TDSerasesthe file, an
information box will ask you to confirm your choice
and chooseYesor No.
- Use Configuration to load, save or
Configuration
erase global setup data. Configuration files provide
a convenient way to recall often-used parameters.
Configuration files end in .TCF for TDS files. All
configuration files must be located in the same
directory as the Sound Lab TDS program file.
r=r
OFen
Driue
Seue
old
*
es
Dir
Shift-F3
Erase
IE@@
EESTEDATASHT.TCF
FACT '..TCF
FACTOEY.TCF
GFAY.TCF
G]IAY,. .TCF
(Eore )
|Tft=ET6;il
|ETFFuT-l
ITTFGTo
rmT+?fr-l
I
Illustration 4-7
Confi.guration sub-menus
47
SoundLab TDS :
File Menu -
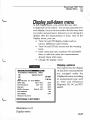
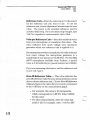
Printer settings - Selectfrom the choices in the menu.
Select a printer before choosing PNnt.
Graph Size - The half-page graph size
option prints all data on one page. The full
page option prints the graph on one page; test
parameters and setup data are printed on a
second page.
Resolution - The medium and high resolution options determine print quality. High
resolution yields a better printout but takes
longer to print than medium resolution.
Output Port - Select the port that matches
the printer connection to your computer.
Prirrt - Sound Lab TDS prints the current data screen
(not including overlays) to the printer using settings
made in Pdnter Settings.
Open
Bld
t
Driue
Saue a=
Dir
Shift-Fg
Erese
Confis|urat
EFson
I@il
GraFh
Size
Hglf
Fx
Page
Fesolution
High
OutFut
LPT'.
ITTFEEE-
+a
Illustration 4-B
Printer Settingssub-mmu
ion
Port
ITTF-ij;ii6-l
\
SoundLabTDS : -:
File Menu
-
Open
Illustration 4-9
About sub-nrcnu
Old
t
Drive
Dir
es
Savr
Shift-Fg
Erese
ConfigurEt
Printer
About - Displays the current
version and date of the
software and the firmware
inside the TEF analyzer.
ion
Settinss
Print
E@
Sound
Leb
EE
Uer.
e.O
EPFOH Uer.
A/OL/92
O.'.4.6e
(ct
coFurig]rt
LO-Z9
l.l.6.(l(l
'.993
eroun
International,
Press
En!'
ke!'
to
?lZolgL
TECHROH Dieision
of
Inc.
continue...
NoteThe Aboutcommand
can be used as a diagnostic
tool to check the connection
between the PC and the
TEF analyzer. If the PC is
not communicating with the
analyzer, a message will
appeatl
" The TEF is not ready. ROM
data is not auailable."
Etil
OFen
Old
Driue
SEtre
&
as
Dir
Shift-Fg
Erese
Configurat
PrintEr
iolr
Settings
Pr int
About
Iilil
Go teSound
Lab is composed of several
modules that make up a total measurement
package. TD,Sis a module within the SoundLab
'til7hen
you start Sound Lab 7DS for the
family.
first time, the TDSmodule is loaded. You choose
other modules with the Go to command under
the Filemenu. As you install newmodules, they
will appear in the Go to sub-menu.
IIEil
l.tLS
ELF
FTA
1.1
FTADEI'TO
\-
AcoustaEQ
Quit - returns you to DOS. After you selectQuit,
a sub-menu will appear and ask you, Do you
really want to quit? Choose les or No.
sLt{
TFTE=E'Tos.e I
Illustration 4-L0
Go to sub-menu
+9
Sound Lab TDS
Measure Menu
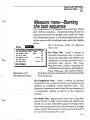
Measure menu-Starting
the test sequence
Fi
EEEE@
le
Do Frequencg
Do Noise
Do STI
Test
Do FASTI
Do
Test
Test
Test
3D Tst
Do Average
fTTt--cCFl
Illustration 4-7 7
TDSMeasure trcnu
The commands in the Measure menu start the Sound
Lab TDS test sequence. Sound lab will perform the
measurement with the settings made under the Input
and Parametercmenus. It will then display the results
on the screen with the settings made under the Display
menu.
The sub-menus under the Measure
menu are:
(TDS)
F6
<HC)
F7
Do Time Test - sends a sweep of
FA
selected frequencies into a system or
Shift-FA
device and calculates and displays the
F9
Shift-F!}
amplitude of energy received over a
specified time period. The Time
Response test is useful to pinpoint the
arrival times of energy at a microphone.
RT5s, 0/oAL666s,and Early+o-Direct/
Early Reverberation information is derived from the
Time Response.
Do Frequency Test - sends a sweep of selected
frequencies into a system or device and calculates and
displays an amplitude versus frequency plot. The
frequency response is used to find the true response of
a loudspeaker, system or device in the frequency
domain.
Do Noise Test - gathers noise data over a specified
period of time in eight octave bands and displays the
results on a noise criteria(NC) graph showing octave
band sound pressure levels versus frequency in eight
octave bands. The lowest NC contour not exceeded by
the curve becomes the NC value.
4-11
SoundLab TDS :
Measure Menu
=
Do STI Test (Speecb Transmission IndexF
Do RASTI Test (RApid Speecb TransmissionlndexF
performs STI (and the faster RASTI) tests by running
several time response tests plus an NC measurement,
and then processing the data to yield an overall speech
intelligibility prediction. The resultin g datais displayed
on the screen in a graph or table.
. STI makes modulation transfer function (MTF)
measurements in the seven octaves from'1,25
Hz to 8 kHz.
. RASTI is a shortened version of the STI procedure, measuring the MTF at the 500 Hz and
2 kHz octaves.
When you choose Do STI Test,Do RAST Testand Do
JD Test, a Saue as sub-menu appears because you
must name the test before it begins.
EEEIE
Fll.
N-F.
fttla
Utsr
l{ri.
D.te
Lc.tton
Dc*riEtion
Line
I
Ltne a
Forut
Saw
TATFe'Io-=E-lf
fl-TAFOOT,,ETC
ETG T.ks
To Shos Fr!&rck
Ttrrough
LJS/JAB
n/ZA/L:XE
09 | 15:S
Corlbu-h
Church:
Sdth
Bcnd,
lH
a Sed
flC,
Center
POe 160 O.r ettar
t-d
Bidry
At *Hz
ns Pt*
Altar
}lie
Up tllc
ElF-t-ittr;]
Illustration 4-12
Saueas sub-menu
You can set the parametersto do a noiselesstest and
edit in noise later from a storedNC file or the NC table
in the Display menu.
+12
Sound Lab TDS :
Measure Menu =
-
\-
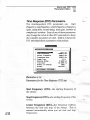
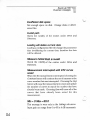
Do 3D Test-performs
from 2 to L00 individual TDS
measurements, each offset in time by a constant
amount. When all of the individual sweeps are displayed
on the screen, they form a three-dimensional display
that plots the changes in magnitude/frequency over
time.
Do Average - repeats from 2-999 tests and displays a
the vector or magnitude avenge of Time or Frequency
Response measurements. Signal avenging is used to
improve signal-to-noise ratios under adverse conditions
such as noise.
L
Note You can cause an Auto Rqeat mode for any
Time, Frequency or Noise Test by pressing the
Function key F10. The test will repeat until you press
,Escto cancel it.
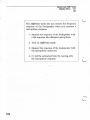
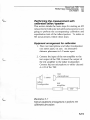
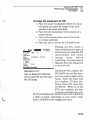
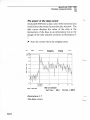
A logical test sequencein a room fop
time and flequency measurements
1. Make a coarse Time Response Test (one
second span) to reveal energy arrival times at
the microphone.
2. Refine the time resolution (0.1 to 0.5 second
time span) if the first reading is too coarse for
clarity.
3. Tum the cursor Onand pinpoint the exact
time of the first energy anival at the microphone.
4. Do a Frequency Response Test using a receive
delay which equals the anival time from the
Time response.
+15
Soundt"r r0t-:
ParametersMenu
=
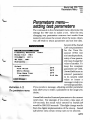
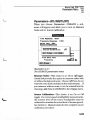
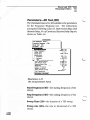
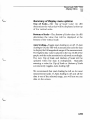
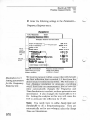
Parameters menusetting test parameters
The commands in the Parame,fersmenu determine the
settings the TEF uses to make a test. After the test,
changing arly p2lameters removes test results from
memory and erasesthe screen when the menu closes.
Use Alt-Undoto retain parameters and not lose data.
Severalofthe Sound
Lab testparameters
for the Time Re(TDS)
sponse (ETC) test
are interdependent;
entryof one parameter may change the
valueofanother. To
keep the complete
off
parameter set valid,
off
SoundLabforces an
off
parameter
entered
O.O Hz
its
to
nearest valid
value or issues a
messagetohelpyou
setvalid parameters.
If you receive a message, adjusting another parameter
may allow you to enter a parameter in the range you
desire.
IEEIGIISA
Frequenc!,
Hoise
Te=t
FesFonse
(He)
(STI }
STI./FASTI
3D
(3D)
Test
Arreragl
in9
Outpl.tt
Pink
]'lhite
S ine
\
Hoise
Noise
l.laue
Tone
Freqtrene!,
fETf:elo-se
I
llustration 4-1J
Theparam.etetstnenu
\,,
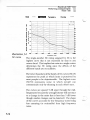
Sound Lab rounds all entered parameters to the nearest
valid value. For example, if you enter a time span of
100 seconds, the actual value entered by Sound Lab
would be998.1.552seconds. This slight change results
from the digital implementation of the sweep. Sound
Lab allows only certain sweep rates to be selected.
+'t5
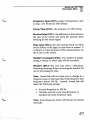
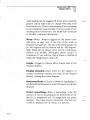
SoundLab TDS :
Parameters Menu
=
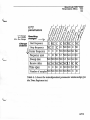
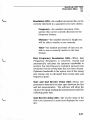
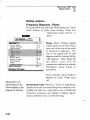
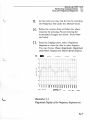
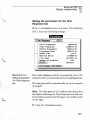
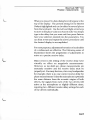
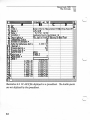
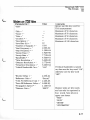
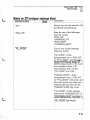
(ETCIParameters
Time,Besponse
The interdependent ETC parameters are: Start
frequency, stopfrequeri cy, centerfrequency,frequency
spa.n,sueep time, receiuedelay, tirne span, number of
sarnples^nd uindow. Entryof one of theseparameters
may changethe value of other ETCparametersto keep
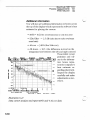
the completeparametersetvalid. Table4-l showsthe
ETC interdependentparametersrelationships.
r@r
stoF
Frequencg
Frequenca
Center
Frequrnca
SueeF
F€ceiue
Tine
l{uhber
SFan
Tire
Hz
5o5O.O
Hz
99OO.O
l.O
Delag
O.OOOO
43.9596
Span
of
1OOOO.(]
SehEles
l{indou
Hz
s
EE
hs
lO24
HaEEing
l-A-TFE-Io---lmTFIFii6-l
Illustration 4-14
Parametersfor tbe Time Response (ETC) test.
Start Frequency
the sweep.
(ETC)-the
Stop Frequency (ETC)-the
sweep.
4-16
starting frequency of
ending frequency of the
frequency halfway
Center Frequency (ETC)-the
between the start and stop of'the sweep. This is
entered automatically when you set start and stop
frequencies.
- \
SoundLabTDS : -:
Paramehrs Menu
of frequencies, start
Frequency Span (ETCFrange
to stop, over which the TEF sweeps.
Sweep Time (ETCF-the
duration of a TEF sweep.
Recelve Delay (ETCFthe difference in time between
the start of the sweep and when the analyzer starts
listening for the retum signal.
time during which we listen
Time span (ETC)-the
for the effects of the signal on the room or system. It
is shown in Time Response (ETC) measurements on
the x axis on the screen.
number of points,
Number of samples (ETC)-the
during a sweep, at which data will be recorded.
user firay select a Blackman,
Window (ETCFthe
Hamming, Hanning, Kaiser or rectangular window for
use in processing the data.
Note Sound. Lab wrllnot allow you to change to a
frequency span or time span that would require a start
frequency below 100 Hz. Instead, Sound Lab will
make the following settings:
.
.
Set start frequency to 100 Hz
Calculate and set a new stop frequency to
maintain the same frequency span.
Note A start frequency below 100 Hz maybe entered
manually.
+17
Sound Lab TDS :
Parameters Menu
=
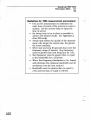
Guidelinesfor ETC measurement parameters:
o For the initial room measufement, calculate
how long it will take sound to travel the
longest dimension of the room. Set the time
span to be at least 10 times longer than the
travel time.
. Set sweep time to be 3 to 4 times longer than
the time span. Sweep time effects the quality
of the measurement-the longer the sweep
time, the greater the noise immunity.
o Select a center frequenry that matches the
center of the frequency range of interest.
Sound Lab will calculate start and stop frequencies to maintain the selected time span.
Stop frequency must be greater than start
frequency by 1,4Hz
. Frequency span and number of samples
change the time span. Time span is calculated
from the follo-wing formula:
Time span =
in ms
.
4't8
1000x 0.85x number of samples
2 x (stop freq. - start freq.)
Use the Hammingwindow function for performing acousticmeasurementsand the
Rectangular window for performing electronic
measurements.
SoundLab TDS-:
Paramebrs Menu
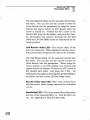
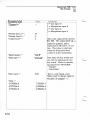
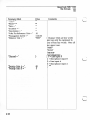
ETC
parameters
Resulting
changes
-
C- Change
U= Update
NC= No change
Change
entered
II
\r
.X
it
\
Start frequency
U
NC
C
C
NC NC
C
NC
Stop frequency
NC
U
C
C
NC NC
C
NC
Center frequency
C
C
U
Frequencyspan
c
C
NC
NC NC NC NC NC
U
NC NC
U
c
NC
NC NC NC
Sweep time
NC NC NC NC
Receive delav
NC NC NC NC NC U
NC NC
NC NC
U
NC
Number of samples NC NC NC NC NC NC
c
U
Time span
.
C
C
NC
C
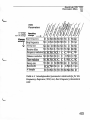
Table4-1 sbowstbe interdeltendentpararneter relationsbipsJor
tbe Time Responsetest.
+19
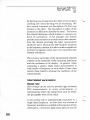
SoundLab TDS--:
Parameters Menu =
:
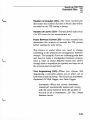
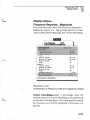
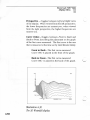
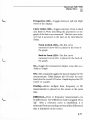
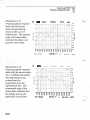
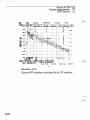
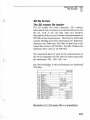
TDS parameters-Frequency Besponse
The interdependent parametersfor Frequency Response
(TDS) tests are: startfrequency, stopfrequency, sueep
time, w;e@ rate, resolutions, receiue delay, banduidth,
and number of samples. Entry of one of these TDS
parameters may change the value of other TDS
parameters to keep the complete parameter set valid.
Table 4-2 shows the TDS dependent parametet
relationships.
T ihe
(ETC )
FespoBa
St.rt
stop
Freq@nq
Frequ6ca
Sse€F
TiEe
Sue€D
R€te
Fesolut
IOO.O
Hz
'.oOOO.O
Bz
l.O
IO3L?,S
l..'1.6
Distence
11.1
Tine
9,8473
Fre@enca
E€ceiee
Fesolutim
of
TATFETA-iI
0,6125
ft
6s
ns
n"
lEil
SahplE
Hz
On
Delag
r?Eriirlnrrlir
Huhber
Hz/s
ion i
Frequenca
Eest
s
512
|ETFiffi|;-]
Illustration 4-1.5
Theparametersfor tbe Frequency Responsetest
Start Frequency (TDS)-the starting frequency of the
sweep.
Stop Frequency (TDS)-the ending frequency of the
sweep.
inseconds,
ofaTEFsureep.
SweepTime(TDS)--theduration,
Sweep rate (TDS-the
sweeD.
4-20
rate in Hz/second of a TEF
Sound Lab TDS :
Parameters Menu
=
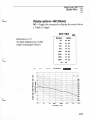
Resolution(TDs)-the smallestincrementthat canbe
correctly discernedin a parameteryou have chosen.
Frequency-the smallest increment of frequency that you will be able to resolveor see
correctlv.
If Bandwidth < lfsweep rate, then
TDS
=
Frequency
resolurion
ffi
If Bandwidth
> lfsweep rate, then
Frequenry resolution = Bandwidth
Conuentional
swq)t spectral
analysis
Distance-the
smallest interval in length you
will be able to resolve or see correctlv.
Tlme-the
smallest increment of time that you
will be able to resolve or see.
Time resolution =
Bandwidth
Sweep rate
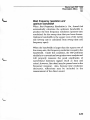
Best Frequency Resolution (TDS)-\fhen
Best
Frequency Resolution is selected, Sound Lab
automatically calculatesthe optimum bandwidth to
produce the best frequency resolution (poorest time
resolution) for the sweep time that you have chosen.
Optimum bandwidth is the squareroot of the sweep
rate (sweep rate is calculated from sweep time and
frequency span).
+?'l
Sound Lab TDS :
Parameters Menu
=
ReceiveDelay(TDSFthe difference in time between
the start of the sweep and when the analyzer starts
listening for the signal to retum.
Bandwidth (TDS)-The value enteredheredetermines
the size of sweepingfilter, i.e., what the filter can see.
SeeAppendix A, How tbe TEFworks.
Number of samples (TDS)-the number of points,
during a sweep, at which data will be recorded.
+2P.
. , '
\--l
SoundLabTDS :
Parametnrs Menu
C= Change
U= Update
NC= No change
Change
entered
J
=
,;;:Mr ,lo
fta
Sart frequency
M
U NC NC NC NC NC NC
c
NC NC
U NC NC NC NC NC
c
NC NC
NC NC NC NC
c
NC NC
Stop frequency
NC
Sweep time
NC NC U
Receive delav
NC NC NC
Frequency resolution
NC NC NC NC U
c
C
NC
C
NC
Distance resolution
NC NC NC NC
c
U
c
NC
c
NC
Time resolution
NC NC NC NC
c
C
U
NC
c
NC
Sweep rate
NC NC
Bandwidth
NC NC NC NC
* Samples
NC NC NC NC NC NC NC NC NC
c
U NC NC NC NC NC NC
NC NC NC NC
c
c
C
U NC NC
NC
U
NC
U
Table 4-2 Interd@endentpararneter relationsbipsfor tbe
FrequencyResponse(TDS) test,BestFrequency Resolution
OFF.
i
+23
SoundLabTDS:
Parameters Menu
=
Guidelines for TDS measurement parameters:
.
Use an ETC measurement to detemine the
exact time of arrival of the sound you want to
analyze. Set the receive delay to equal the
time of arrival.
o Set sweep time to be as short as possible to
achieve the desired results. See Appendix A,
Hotl TEF utorks.
o. Sweep time effects the quality of the measurement-the longer the sweep time, the greater
the noise immunity.
. Select start and stop frequencies that cover the
frequency range of interest. Stop frequency
must be greater than start frequency by I Hz.
o Start frequency must be greater than or equal
to the bandwidth for a valid test.
. S(hen Best Frequency Resolutionis On, Sound
Lab calculates the optimum bandwidth and all
resolutions (see the next section.)
. Bandwidth must be greater than or equal to
2 Hz and less than or equal to 240 Hz
+24
Sound Lab TDS-:
Paramenrs Menu
L-
=
Best frequency resolution and
optimum bandwidth
rilfhen BestFrequencyResolutionis On, SoundLab
automatically calculates the optimum bandwidth to
produce the best frequency resolution (poorest time
resolution) for the sweep time that you have chosen.
Optimum bandwidth is the square root of the sweep
rate (sweep rate is calculated from sweep time and
frequency span).
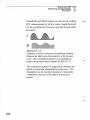
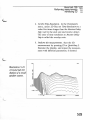
'When
\-
the bandwidth is larger than the square root of
the sweep rate, the frequency resolution is equal to the
bandwidth. Under this condition, the TEF performs
similarly to conventional swept sine wave analysis and
will properly measure the peak amplitudes of
narrowband stationary signals (such as hum and
noise); however, fine detail maybe passed over in the
frequenry response. Also, because time resolution
decreases, reflections may be included in the
measurement of the direct sound.
4-25
SoundLab TDS--:
Paramenrs Menu
=
^\
r -Yr .S
T;;-/W,
Mftr
flfi
C- Chmge
U- Update
NC- No change
Change
entered
II
\t
{lo
{
NC NC
c
L
c
Stop frequency
NC U NC NC
c
C
c
Sweep time
NC NC
NC
C
C
c
Receive delay
NC NC NC
Start frequency
U
NC
t,
L
NC
L
NC
c
NC
U NC NC NC NC NC NC
Frequency resolution
Distance resolution
Calculated by Sound Iab
Time resolution
Sweep rate
Bandwidth
# samples
NC NC
c
NC
c
c
L
U
L
Calculated by Sound Iab
NC NC NC NC NC
NC NC NC NC
Table4-3
Interdqendent pararneter relationsbipsfor
FrequencyResponse(TDS) tests, BestFrequency
ResolutionOn.
+26
NC
U
SoundLab TDS::
Parameters Menu
=
L
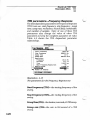
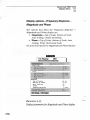
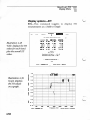
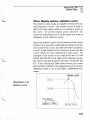
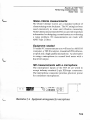
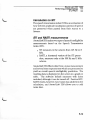
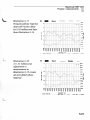
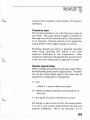
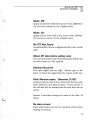
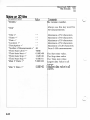
Parameters-Noise Test (NCl
To perform a noise test, you set the Integration Time
and specifyifyou areusingtheLineOulputof theTEF.
IEEEEET
(ETet
T iEc BEFmse
(TDS t
Frcqurncg
FcsFssr
rl,O
Linc
(lrtFut
rETFE'IFI
l.lhite
Sine
TETFI!;6-]
Noi*
,laG
FreqrsB
s
Off
Off
Tore
Off
lmo.O
Hz
'TTFGIA;;I
Illustration 4-16 Tbeparametersfor tbe Noise Test
Integration Time-Enter a value here (1-9999sec)for
the length of time (in seconds) that the data is to be
averagedon each individual octave.
Line Output-Onor Off. U|hen tumed on,the Line
Outputallows you to monitor the octave-bandfiltered
noise at the output of the TEFthrough headphones,an
amplifier or a tape recorder.
+27
SoundLabTDS:
Parameters Menu
=
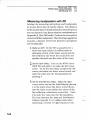
Guidelinesfor setting NC parameters.
Input levels have to be sufficient to yield valid results.
If the levels are set too low, the resulting graphs will
show abnormally low noise curves, especially at the
higher frequencies.
If you are using the built-in TEF preamps,
adjust the gain in the preamp until you get an
overload, then lower it one step to get the
proper level.
If you are using a sound level meter and the
line level input, the output of the sound level
meter should be in the range of L millivolt to 1
volt to perform valid NC measurements.
Due to the inherent noise of the computer and
TEF, your measurement setup should be in a
different room from where the NC is being
measured.
4-24
S o u n d L a b T D S-::
Paramefcrs Menu
:
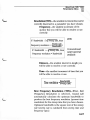
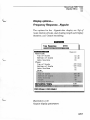
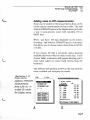
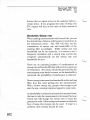
€iTI,/BASTI(STD
Parameter
\7tren you choose Parameters...SWRASTI,a submenu will appear and allow you to tum on Measure
Noiseand/or SourceCalibration.
EITEtr@
Tihe
(ETC)
FesFonse
Frequenc!,
flespqnse
(NC'
Test
Hoige
SourcE
(TDS'
Calibratiqn
ITIE=E-icF-l
fETF{imio
Off
I
off
off
S ine
f{au€
Tone
Frequenca
off
1OOO.O Hz
lj-iT:e'E;-l
Illustration 4-17
TbeSTARASUpararneters rnenu
Measure Nolse-This choice is an Onor Offtoggle.
SoundLabprovides the option to measureeither with
orwithout backgroundnoise. ChooseOfifyou do not
want the room noise included in the measurement. If
you measurewithout noise, it can be enteredlater by
choosing Add Noiseto STVRASTIinthe Display menu.
\-
choice is an On or Off
Sour:ce Calibmtion-This
toggle. Forcorrectspeechintelligibility measurements,
the acousticlevel of the source loudspeakermust be
calibratedtosimulatethe actuallevelof humanspeech.
SeeSection4 , Measure rnsnu for the complete source
calibrationprocedure.
+29
Sound Lab TDS-:
Parameters Menu
=
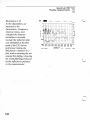
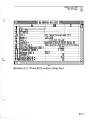
Test (9Dl
Parameter*3D
T1lleParameterc merru for JD is simil at to the parumeters
for the Frequency Response test. The interactions
among the following values of Start receiae delay, End
ReceiueDelay, No. of Cuntes and ReceiueDelay Step are
shown nTable 4-4.
Tlre
(trC)
Be$m*
F|q[|.g
rct.r
Tdt
(lN)
Beo|rn
(NC)
SIIASTI
<STt )
EErcE
E@
4O.O
Stop
F|,!dImg
lmo,g
Hz
Hz
4 . 9 .
?@,9
FEolut
to
k/3
!
W,O
Dirtno
Hr
3.4
ft
nt
3.333
h
St-rt
Ed
tuetE
kiE
nc.iv.
hlau
hl:e
hls
Sts
O.O@
is
5.OmO
ii
o.1C9
Bs*tdth
46.3
bEr
|bbr
of
S$pl6
of
Cur96
Pil*
btc$
T6t
Sq|scl€
ITTFEIg-;]I-fi
E
E
5ta
37
@ruE
O.O -
TFIES]
Illustration 4-18
TbeJD pararneters rnenu
+30
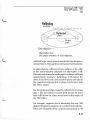
Start Frequency (3D)-the
sweep.
starting frequency of the
Stop Frequency (3D)-the
sweep.
ending frequency of the
Sweep Time (3D)-the
duration of a TEF sweep.
Sweep rate (3D)-the
sweep.
r^te in Hzlsecond of a TEF
SoundLab TDS::
Parameters Menu :-
Resolutlon(3D)-the
smallest increment that can be
correctly discerned in a panmeter you have chosen.
Frequency-the
smallest increment of frequency that can be correctly discemed in the
frequenry domain.
Distance-the
smallest interval in length you
resolve
or see correctlv.
will be able to
Tim+the
smallest increment of time you are
able to see or correctlv resolve in the time
domain.
(3D)-r$fhen
Best
Best Frequency
Resolution
Frequency Resolution is selected, Sound lab
automatically calculates the optimum bandwidth to
produce the best frequency resolution (poorest time
resolution) for the sweep time that you have chosen.
Optimum bandwidth is the square root of the ssieep
rate (sweep rate is calculated from sweep time and
frequency span).
two
Start and End Recefue Delay (3D)-These
parameters determine the time span between the first
and last measurements. The software will allow the
values to be equal, making this measurement useful for
collecting polar data.
receive delay of the
Start Receive delay (3D)-The
first curve measured is stored and displayed as curve
001.
+3'|
SoundLab TDS::
Parameters Menu :_
:
The Start ReceiueDelay can be manually entered into
the menu, You can also use the cursors to enter the
value directly into the parameters by using the cursor
buttons that appear below an ETC display when the
cursor is turned on. Position the ETC cursor at the
desired data point on the display, and press the Skey.
An information box appears showing the 3D Start
Delay and 3D End Delayvaltes as determined by the
cursor position.
End Receive delay (3D)-The
receive delay of the
last curve measured. \7hen displayed with the cursor,
this curve number is equal to the value at No. of Curues.
The End Receiue Delay can be manually entered into
the menu, You can also use the cursors to enter the
'u7hen
value directly into the parameters.
using the
cursor buttons in an ETC display, four buttons will
^ppear below the display. Position the ETC cursor at
the desired data point and press the S key. An
information box appears showing th e JD Start Delay as
set before and the cuffent 3D End Delay values.
Receive Delay Step (3D)-The
value entered here
sets the receive delay change between the individual
curves.
Bandwidth (3D)-The value entered here determines
the size of the sweeping filter, i.e., what the filter can
see. See Appendix A, Hotl tbe TEF utorks.
+32
SoundLabTDS :
Parameters Menu
=
L
Number of samples (3D)-The value entered here
determinesthe number of points at which data will be
recorded on the TEF during a sweep.
Number of Cunres (3D)- Sound Lab wd.lmake from
2 to 100 curves in one measufementset.
Pause Between Curves (3D)-A value entered here
determines the number of seconds the TEF pauses
before starting the nex sweep.
This feature is useful when you need to change
something in the physical test arrangement between
sweeps. For example,if you are collecting polat data
and need to rotate a loudspeaker between sweeps,
enter a value in Pause Betueen Curaes that allows
enough time to repositionthe speakerand step out of
the measurement'sound field.
you choose Test
Test Sequencing (3D)-\fhen
Sequencing,a sub-menuallows you to select one of
fourways to startthe sweep. The choicesarcAutomatic,
Kqtboard, DC Sbift Triger, and Pulse Trigger.
Automatic*'V|hen you choose Automatic,
Sound Lab automatically makes each sweep
with the pausebetween them the number of
secondsas set in Parameters...3DTest...Pause
betueen cun)es.
4-33
SoundLabTDS :
Parameters Menu -=
Keyboard-Y{hen you choose Keyboard, the
software waits for you to press a key before
making the next sweep.
\-
DC Sbift Trigger-This option is available to
work with a remote push bunon accessory
connected to the TEF through the exernal
trigger connector. \)7hen DC Shifi Triggeris
selected, the software begins the measurement
when signaled by a push button. (See schematic in analyzer user manual)
Pulse trigger-This option was designed
specifically to be used with an accessory
tumtable* connected to the TEF through the
extemal trigger connector. For specific turntable details, refer to the instructions from the
manufacturer.
*Outline@ Outline snc, Via Leonardo daYrnci,55
25020Flero(BS),rtaly,030/3581341,
FAX030/
3580431.
+34
\-
SoundLab TDS::
Parameters Menu
=
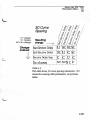
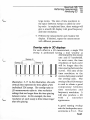
3D Curue
Spacing
C= Change
U= Update
NC= No change
Change
entered
\/
Resulting
chanqe ------------7\
l^slFlsl
/ ; / E/ i / p
relslf
lfr
8l8l{ler
Start Receive Delay
U
End Receive Delav
NC
U
C
NC
Receive Delay Step
C
C
U
C
No. of curves
NC NC N C U
NC NC NC
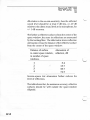
Table4-4
Tbistable sbous3D curuespacing interaction. For
interaction arneng otberparameters, seepreuious
tables.
4-35
Sound Lab TDS::
Parameters Menu
=
\-
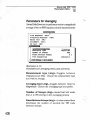
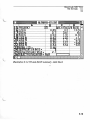
Parameters for Averaging
Sound Laballows you to perform a vector or magnitude
average of two to 999 frequenry or time measurements.
Tine
(ETC)
Fesponse
(TDS )
Frequenca
Fesponse
(Hc)
Hoise
Test
(STI )
STI./EASTI
3d
Test
(3D)
EEE@
Aueraging
llunber
Peuse
Test
T!,F€
of
]lasnitude
SueeFs
betseen
5OO
SseeFs
O s
Sequ€ncing
lTTt--EIGe
lfFft=imfo
fiutoHatic
I
Illustration 4-19
Parametersfor Aueragingmenu and sub-menu.
Measurement type (Avg)-Toggles
between
Frequencyand Time. Choosethe measurementtype
you wish to avenge.
Averaging fYpe (Avg)-Toggles between Vectoror
Magnitude. Choosethe averagingtype you prefer.
Number of Sweeps (Avg)-Soznd Lab will make
from 2 to 999 s\ /eeps in the averagingprocess.
Pause Between Sweeps (Avg)-A value enteredhere
determines the number of seconds the TEF waits
between sweeps.
4-36
Sound Lab TDS-:
Parameters Menu
=
(Avg)-\fhen
you choose Tesl
Test Sequencing
Sequencing, a sub-menu allows you to select one of
fourways to start the sweep. The choices are Automatic,
Keltboard, DC Sbirt Triger, and Pulse Triger
Automatia-\X|hen you choose Automatic,
Sound Lab makes each sweep with the pause
between them the number of seconds set in
Parameterc...3D Test...Pause between curaes .
you choose Keyboard" the
Keyboard-vhen
software waits for you to press a key before
making the next ssieep.
DC Sbifi Triger-This
option is available to
work with a remote push button accessory
connected to the TEF through the exemal
trigger conflector. 'When DC Sbifr TrigS;eris
selected, the software begins the measurement
when signaled by a push button. (See schematic in analyzer user manual)
Pulse tdger:This
option was designed
specifically to be used with an accessory
furntable connected to the TEF through the
extemal trigger connector. For specific furntable details, refer to the instructions from the
manufacturer.
\-
+37
Sound Lab TDS--:
Parameters Menu
=
Guidelines for averaging
Vector avetaglng
'$Zith
vector averaging, the complex data (real and
imaginary) is averaged for corresponding points in the
multiple sweeps. Use vector averaging for improved
signal to noise ratio. This improvement is somewhat
reduced if the signal moves in time due to air curents.
Magnitude averagi.mg
\fith magnitude averaging, the magnitude of the
complex data (real and imaginary) is averaged for
corresponding points in the multiple sweeps. Magnitude
averaging is useful for finding an average sound level
for a region of the roomwhen the microphone placed
in several locations and then moved between sweeps.
4-38
SoundLabTDS :
Parameters Menu -:_
Output
The options under Outputenable you to command the
-Wbite
TEF to generate Pink or
Noise, or a Sine'Waue
Toneup to 24000 Hz.
Pink Noise is activated by choosing the Pink Noise
'lYbite
option. White Noise is activated by choosing the
Noise option.
To speci$r a frequency fo r the Sine Waue Tone, choose
Frequencyand enter a valuefor Hz. \fhenyou choose
SinewaueTone,the tone will be heard. The Enterkey
will toggle on and off any of the selected options.
L
TEEEIES
Frequencu
Fesporr=e
(1{C)
l{oise
Test
(STI )
STI./FfiSTI
3D Test
, (3D)
(fDS)
Jlrreraging
Output
Fink
Hoise
l,lhite Hoise
S inE l{evE T.'ne
Frequenca
|n-F:eT6se
off
off
off
O.O Hz
I
\_-
Illustration 4-20
Tbe Output sectionof tbe Pararnetersrnenu.
+39
Sound Lab TDS :
Display Menu
=
Display pull-down menu
In the Display menu, you controltheway data
is displayed on the screen. You set the parameters for
each display, but you do not need to do this every time
you make a measurement. Instead, you can change the
display after the measurement is done. Also in the
Display menu, you can:
. Turn On and Off display modes such as
Cursor, Difference and Overlay.
. Turn On and Off the mouse and the warning
beep
. Enter noise data into noiseless STI and RASTI
data, or add new noise into measurements
already taken with noise.
. Change the display colors
Display options
EEilEIII
Frequenca
3D
(TDS)
Respan=e
(llaterfal
I )
HC
Graph
STI
fidd Hoise
[l]rer lau
Tab le
ts
STI./EHSTI
Ct r I -Fe
Difference
Hlt-Fe
Cursor
FZ
ET6O eursor
Shift-F?
Alt-l'louse
TETI=c-Tose
Off
Off
Off
t]n
Alt-Eeep
ffdjust
Of f
The options for the display
of data from measurements
are aranged under the
Displaysub-menuaccording
to measurement rype such
as Time and Frequency
Response,3D, NC, and STI/
RASTI.
Off
Golors
I l-ETt=iitrio
I
Illustration 4-21
Display rnenu
441
SoundLabTDS:
Display Menu
=
Display options by measurement
Time Response-Displays
of a system vs. time.
time response or the output
There are two types of time response displays which
you can select under the menu item called Time
Response.
Magnitude: Shows energy vs. time.
Heyser Spiral: Shows the complete system
response in one view-a three-dimensional
curve in which the three projections are the
polar, real, and imaginary planes.
Frequency
response.
Response-Displays
the frequency
There are five types of frequency response displays
which you can select under the item called Frequency
Response.
Phase Ptnrevs.frequency,orphase
response.
Magnitude: Magnitude vs. frequency, or the
f amiliar frequency response
Magnitude and Pbase: Displays both the
frequency fesponse and phase fesponse on the
same scfeen.
Nyquist: A rotating vector showing magnitude
vs. phase angle on a polar plot.
Heyser Spiral: Shows the complete system
response in one view-a three-dimensional
curve in which the three projections are the
polar, real, and imaginary planes.
4-42
\-
Sound Lab TDS :
Display Menu
=
frequency response vs. time
3D (WaterfallFDisplays
in successive time slices.
contour graph showing
NC (Noise Criteria)-Noise
pressure
levels vs. frequency in
octave band sound
eight octave bands.
SII (Speech Transtnission
Index)-A
the intelligibility of a sound system.
measure of
L
443
Sound Lab TDS :
Display Menu
=
Displav oations-Time
Response...magnitude
t
IIEIilEtrIT]rril
llagn
i tude
tiEsct-t&r
t
When you select Time Response...Display type a
submenu allows you to choose rwo different ways to
view the measurement dat^-Magnitude
or Hqtser
Spiral. The parameters which can be set for the Time
Response- M agnitu d e display are :
Top of Scale
Bottom of Scale
Auto Scaling
fc-i-t-EIE5e]
ITilEil
Illustration 4-22
Time response(ETC)
sub-menu
l'lasnitude
EEIIIEtrME
l'lagn
i tude
ToF
of
BottoF
scale
of
ScEle
6('
dB
-.|,O
dE
ScEling
Auto
On
T€-lT=Ci6;ilTr-i-f:G-afol
(]n
Alt-l'louse
Alt-Eeep
Adjust
On
Colors
T€-ai-ElE;Jlf
€-iE:Enf;l
Illustration 4-23
Display. . . Time Responsesubmenu
Top of Scale:The
Top of Scale value (in dB)
determines the value that will be displayed at the top
of the vertical scale. This data entry value will be
rounded to the nearest 10 dB increment.
444
Sound Lab TDS :
Display Menu
=
Bottomof Scale:The Bottomof Scalevalue (in dB)
determines the value thatwill be displayed at the bottomof
the vertical scale. This data entry value will be
rounded to the nearest 10 dB increment.
Auto Scaling on or off. If
Auto Scaling:Toggle
Auto Scaling is On, the software will automatically
scale the datato display the full magnitude range of
the measurement. The highest data value is placed
in the top 10 dB of the graph, and the scale
annotation is adjusted accordingly. The new Top of
Scaleand Bottom of Scaleswill be updated when the
data is redisplayed. Manually entering a value for
Top of Scaleor Bottom of Scaleattomatically toggles
Auto Scaling Off.
'We
recommend that Auto Scalingbe left on for most
measurement tasks. If Auto Scaling is off and all the
data is out of the selected r^nge,you will not see any
data on the screen.
Auto Scaling can be toggled off if you don't want the
graph's Top of Scalevalue to change with data level
from test to test. This is a requirement if you are
going to use Oueilay to create a family of curves on
the screen resulting from several tests. Seeadditional
comments in Ouerlay command description.
445
SoundLabTDS:
Display Menu =
:
Display optionsTime Flesponse...HeyserSpiral
The Heyser Spiral display shows the complete system
response in one visv/-2 three-dimensional curve in
which the three projections are the polar, real, and
imaginary planes. \7hen the display is on the screen,
you can press Fl to open a sub-menu which gives key
combinations for various manipulations of the display.
Illustration 4-24
TbeHeyserSpiral
display of a Time
Responsetest.
]IEIT.ET
Illustration 4-25
TheHelp rnenLt,
appearswben you
pressFl.
Fotate
Tilt
left
Flot
plot
up or
llove
Flot
uE
l'loue
Flot
left
right
doun
or
right
IDcrrase
rotstion
and
Fove
steFg
Decrease
rotation
and
Eoue
steps
ExEEnd
tihe
Conpress
Feturn
M6
or
or
doun
tiFe
to
Ehd
frequenca
and
original
press
ang
ExiE
frequencg
€xis
position
keg
to
continue
Errou
Left
or Fight
Up or Doun arrou
PageUF or PageDoun
< o r >
AIt-I
AIt -D
Alt-t{
Alt -c
Hone
Sound Lab TDS :
Display Menu
=
Display options-Frequency Flesponse
'S7hen
you
select
Display... Frequency
Response...Display Type, you may choose one of five
display types:
Phase (vs. frequency)
Magnitude (vs. frequency)
Magnitude and Phase
Nyquist
Heyser Spiral
ITdEil
TiEe
FesFonse
(ETC>
llagnitude
and
Ptrase
Ptrase
llegn
i tude
so
dE
ztt
dB
On
Hgquist
He!'ser
Spirel
I-Ei-F-TE;i]
'.g{l
-l8O
DEgs
Degs
{]n
0n
Hr,quist
Top
of
Eotton
Auto
Scale
?o
dB
of
eo
dE
Scale
Sceling
GreFir
L inee
DisFla!,
Horizontal
Octaue
[EfFeTrrFe
On
Eotatir'n
Seale
Snoothing
r
O Degs
Log
E.E
2
I l-r-iE=Enaiol
Illustration 4-26
FrequencyResltonse
Display sub-menu
447
SoundLabTDS:
Display Menu
=
Display optionsFrequency Flesponse...
Phase
The parameters that affect the Pbasedispl^y arc Top of
Scale, Bottom of Scale, Auto Scaling, \Y'rap and
Horizontal Scale Ghown in
grafl.
EEdEUtru
I
iasni
ihe
(ETC)
Fe3Fonse
tude
ToF
of
Bottoh
of
Auto
ToF
Scale
Scal
of
bttoF
tuto
Scare
ine
Scale
of
Scele
Sc.line
Graph
Di3Flas
Octle.
Rotation
SEoothing
TETFETG-aT|TTF-I]
i-l
Wrap is toggled
Wrap-When
Onthe phase curve willwrap ot
start over at the top of the scale
as frequency progresses. The
top of the graph will be 180
degrees and the bottom will be
-180 degrees. Vith Wrap off ,
the phase curve will be
continuous, without any sudden
360-degree phase jumps or
transitions.
If you edit the Top of Scale or
'Wrap
turns
Bottom of Scale,
off.
Illustration 4-27
Parametersfor tbe
Pbase display of tbe
frequency response
444
Horizontal Scale-Choose a bnear or logarithmic
display to set the horizontal frequency display scale.
Display the data on a Log scale to see a traditional
frequency response; :use Linear to display signaldelay problems such as comb filtering.
Sound Lab TDS :
Display Menu =
-
Display optionsFrequency Response...M agnitu de
The parameters that affect the Frequency ResponseMagnitude display are Top of Scale, Bottom of Scale,
Au to Scaling, H oriz ont al Scale, and Octaue Smootb ing.
EEdEil
Tihe
Top
of
Eotton
Auto
BesFonse
(ETC)
Scale
of
Scale
Scaling
l,l r5p
Hgqu ist
Top
of
Bottoh
nuto
Scele
of
Scale
Scaling
Eraph
DisFlag
FotEtion
Illustration 4-28
Parameters for Frequency response magnitude display
Octave smoottring-Enter
a percentage value for
desired amount of octave smoothing to be performed
on the datato be displayed. The value may be entered
as a fraction, but it will be displayed in the menu as a
pefcent.
449
Sound Lab TDS::
Display Menu
=
Display options-Frequency Hesponse...
MagniEudeand Phase
The options that affect the Frequency ResponseMagnitudeand Pbase display are:
. Magnitude-Top
of Scale, Bottonx of Scale,
Auto Scaling, Octaue smootbing
. Phase-Top of Scale, Bottom of Scale, Auto
Scaling, Wrap, Horizontal Scale,
Seeprior descriptions for Magnitudeand Phasedisplays.
ITTEil
Tine
Ngqu
Responsr
(ETC)
ist
Top
of
Bottoh
Auto
Scale
of
Scale
Scaling
GrEFh
Displag
TATt--cT@
Fotation
lTAlr]ffiil
16-l
Illustration 4-29
Display parameters for Magnitude and Pbase display
4-50
Sound Lab TDS :
Display Menu
=
DisplayoptionsFrequencyBesponse...
Nyquist
The options for the Nyquist data display are Top of
Scale, Bottom of Scale, Auto Scaling Grapb and Display
Rotation, and Octaue smootbing.
IIEEIEil
Tihe
FesFonse
(ETc)
IEEil@
l{agn
i tude
ToF
of
BottoH
Auto
Scele
of
ScEle
Scaling
Phas€
Top
of
EottoH
Auto
Scale
of
Scele
Scsling
Hrap
Horizontel
Scele
fEft:ElEse-l
Log
ft
ffi,Wffi-#Hi#ltl
ffi,HH
fTIT{jnAol
Illustration 4-30
Nyquist displayparam.eters
4-51
Sound Lab TDS :
Display Menu
=
The Nyquist display plots magnitude versus phase
angle. It can be thought of as the tip of a vector that
is changing in both length and angle as the frequency
sweeps. The length of the vector is proportional to the
magnitude of the data, and the angle of the vector
repfesents the phase of the data.
When the data cursor (F2) ts used, a readout appears
in the lower left corner of the display showing the
frequenry, phase,magnitude, andthe real andimaginary
values.
Graph-Toggle
to choose d.B or Linear data in the
Nyquist display.
Display Rotation-Data
entry for the degrees of
counter clockwise rotation you want in the Nyquist
display, starting from zero degrees.
Illustration 4-31
TbeNyquist display
4-52
SoundLab TDS:DisplayMenu =
:
DisplayoptionsFrequencyFlesponse...
HeyserSpiral
The amplitude of a complex waveform is the result of
two factors called the real partand the imaginary p^rt.
Inaplane progressive wave in the free field (i.e., before
reflections occur) the real part is proportional to
potential energy and the imaginary p^rt is proportional
to kinetic energy.
The amplitude is equal to:
Amolitude
=
2
^ l
2
V(real part) + (imag. part)
and the magnitude is Magnitude =
Magnitude
=
10 log V(real part| + Qmag.part)
The phase response can be found by
Phase="r.t"r,
(H+#)
The Heyser spiral reveals that amplitude and phase are
simply two different viewpoints of the same event.
'S(hy
measure phase?
\a
a
Phase is a more sensitive parameter to find the
center frequency of filters.
Phase reveals driver displacement, something
amplitude can only do very coarsely. (i.e.
inverse square law) whereas phase can show
minute fractions of an inch.
Phase is a clear detector of polarity.
Phase reveals non-minimum ohase behavior.
4-53
Sound Lab TDS :
Display Menu =
::
Illustration 4-32
Electrical impedance of a two
utay Eteaker.
Illustration 4-33
Etectrital imltedance of a 2O
microfarad capacitor
Illustration 4-34
Elect4cal impedance of an B obm resistor
4-54
SoundLabTDS:
Display Menu
=
Display options-3D
(WaterfallJ
The 3D display shows frequency-response curves vs.
time in successive time slices. Each curve is offset
slightly from the previous one in the same display.
The parameters that can affect the 3D display are:
PeTspectiue,Curue Order, Top of Scale, Bottom of Scale,
Auto Scaling, Horizontal Scale.
EEGTEil
T ir.re
(ETC)
FlesFonse
Frequerrcu
FlesFon=e
(TDS l
E@EIE
R ieht
Currre
Top
tlrder
of
Btrttol.r
ffLrto
Front
o
Scale
On
Scelingr
Horizorrtel
lTTt--Eltrse
Eack
1.1t]
Scale
of
to
LOG
Scale
I |TT[=iinrio
I
Illustration 4-35
TbeDisplay JD Waterfallsubmenu
4-55
Sound Lab TDS :
Display Menu
=
Perspective -Toggles between Left and Rightviews
of the display. \7hen viewed from the left perspective,
the lower frequencies are nearest you, when viewed
from the right perspective, the higher frequencies are
neafest you.
Curve Order-Toggles
between Front to Back and
Back to Front, describing the placement on the graph
of the first curve measured. The first curve is the one
that is measured at the time set by Start ReceiueDelay.
Front to Back-The first curve measured
(curve 001) is placed in the front of the graph.
Back to Front-The
first curve measured
(curve 001) is placed in the back of the graph.
Illustration 4-J6
The3D Waterfall dkplay
4-56
Sound Lab TDS :
Display Menu
=
Display options-NG (NoiseJ
NC-Toggle this command to display the noise data as
a Table or Grapb.
HOISE
TABLE
TEF
Level
Octaue
Illustration 4-37
NC data dhplayed as a table
(rigbt) and grapb (belou).
63
54
dB
r25
51
dE
25t}
49
dB
st]t)
46
dB
.t.t]t}t]
4('
dB
zt]t'(l
39
dB
4tltl(l
33
dB
aooo
2?
dB
H C = 4 5
EEET
o
J
HC
?o
u
65
a 2
F
60
55
I
50
= i
6 s
45
^
40
U
35
o
E
30
F
25
zo
$o
Freqcnca
soo
(E )
4-57
Sound Lab TDS::
Display Menu
:
:::::
Display opEions-9Tl
STI-This
command toggles to display
measurements as a Table or GraDb.
IEEU
b
'T I
Illustration 4-JB
Table displays tbe STI
ualuefor eacb band
plus the ouerall STI
ualue.
250
Ht
RTSO
E4Y
o,55
o,55
L,20
L,4
o,a5
o,6
SA
MT I O
r.5
dE
ro.4
dB
STI = O.?1
E*ival6t
S/N btio
=
Ewtq!6t
E.rle
:
--
Ftt.!
surqrr
IE
o."
il
o'"
Fl6O
4.O dB
O.95
s
--
F*hTIoN
Sffiffi.Stt
=
Xot3.3arc.
LO
z
Illustration 4-39
Graph displays
the STI ualues
on a grapb.
STI
o,?l
kdur.
TE
@
I
t'
l
g o'"
I
o.6
c
E
o,5
E
o.4
L
o,3
o.a
o.!
o.o
les
FILE:
4-58
ssffi,srr
250
500
looo
Frquenca
aooo
(Hz)
ilotse
4000
aooo
sourcc:
n.asure
Sound Lab TDS:Display Menu
=
Other Display optionsAdd Noise to STI RASTI
ftdd
Hoise
The Add Noise to STI/RASZoption provides
a way to process noise with noiseless STI
or RASTI data. If you have no STI data on
the screen, you will be given a message:
fron:
IIETEEI
Tab le
lTlt--E'Trrse
I
Obtain STI data before adding noise. Press
any key to continue...
Illustration 4-40
Add Noise To SW
RASTI submenu
Illustration 4-4L
Add noiseoptions
under tbe Display
menl.t:(a)from afile
(b) from a table.
\fhen you have STI data displayed on the screen,
choosing Add Noise to STI/RASTIopens a sub-menu
that allows you to choose noise values from an NC
file or Table. If you choose NC File, a sub-menu
opens showing available files from which to extract
noise data. If you choose Table, a sub-menu will
appear allowing you to enter noise values on octave
band centers from the keyboard and command the
software to Recalculatethe data. The software will
perform an FFT on the data with the noise included
and redisplay the results.
Fi le
Hoise Table
Octave
EEUIIEI=ilil
CFAHOH.HC
CFAHOHAS,HC
t..r
li-fFEEEe
li-fFFuT-f-l
li-iT=rnr-o
rE*iE:FFffi€-l
I
I
G-fl
b3
c:
d:
e:
f:
l?5
25O
stl('
'OOO
zt]tltl
9: 4OOO
h: aooo
Reca lcu late
l-FI FCI
o;e_l
dE
5?
55
53
44
eA
3
-3O
dB
dE
dE
dB
dB
dE
dB
?o dB
l-ET{=nnJo_l
4-59
Sound Lab TDS :
Display Menu =
-
Other Display Options-Overlay
Sound Lab TD.l allows you to overlay time, frequency
or NC measurements. Oueday allows multiple curves
of the same type to be placed on the screen at the same
time. If Oueilayis On,the screenis not erasedbetween
each measurement. Each new measurement curve is
simply drawn over the curves of the previous tests.
Data stored on disk may be overlaid by turning on
Ouerlay and choosing Open Old... from the File menu.
Ouerlay only works for data gathered for common
measurement types. For example, if a time response is
onthe screen,you cannotoveiay afrequenry response.
Any command that erases the screen will destroy any
multiple curves built up on the display. For example,
if Ouerlay is On, and a series of frequency response
curves is displayed on the screen, performing a time
response test will erase the screen.
The overlaid curves exist visually only on the screen.
If the cursor is turned on when multiple curves are on
the screen, the cursor will read only the data from the
most recent test. Auto scalingls ignored when Ouerlay
is turned On.
Parameters may not be changed while Oueilay is
turned on. However, data files of the same type may
be overlaid even if the parameters are different.
Ouerlay is turned off if you change the file type.
Note: The print command does not print overlaid
curves. It prints the last curve drawn on the screen.
4-60
SoundLab TDS:DisplayMenu
=
Other Disp Iay optio ns-D iffere nce
Sound Lab allows you to difference time and frequenry
measurements. The Dffirenre mode is toggled on or
off. \7hen differencing measurements, you first establish
a reference curve. The reference curve can be the
currently displayed measurement, a recalled file or a
new measurement. The reference curve will be
subtracted from the next measurement performed and
the differenced data will be displayed on the screen.
You can also recall a file from th e File. . . Open Oldmenu
to difference against the reference.
'$7hen
using the Dffirencemode, each measurement
can be stored on disk under the File...Saue as submenu. \7hen saving the measurement, a sub-menu
allows you to save either the (a) Dffirence Data or (b)
Lastfile or last rneasurement. If you choose Dffirence
Data,you will save the data as it is currently displayed.
If you choose Lastfile or last nrcAsurelnent, you will
save the data from the last measurement or recalled
file.
\7hen the Dffirencemode is on, Sound Labwill not
allow parameters of the current measurement type to
be changed. If you attempt to make a change, a
message box will appear announcing:
Parameters rna.y not be cbanged wbile Ouerlay or
Dffirence modes are on.
If no data exists in memory, you can't turn the
Dffirencemode on.
4-61
SoundLab TDS :
DisplayMenu :
:
The Dffirence modelets:you remove the frequenry
response of the loudspeaker when you measure a
microphone response:
L. Measure the response of the loudspeaker with
a flat-response lab-calibrated microphone.
2. Tum on Difference mode.
I
'
l
3. Measure the response of the loudspeaker with
the microphone under test.
4. (1) will be subtracted from (3), leaving only
the microphone response.
+62
Sound Lab TDS :
Display Menu
=
Other Display options-Cursor
Turn the cursor ONto readvalues of the data points on
the graph. The F2key also turns on the cursor. Move
the cursor along the graph by clicking the mouse or
pressing the Arrow keys.
The Arrow keys move the cursor as follows:
r:t
It*ll
e-Jj
Move left one datapoint
m
(C-\J
Move right one data point
Move rightloo/oof the display
ln
la-! I
r--.-)
of the display
It+ ll Moveleft 10o/o
(i3
L
ctrl +lffl I Uo.r. L0 datapoints to the left
te-aj
ctrl +
lG
I Move LO datapoints ro the right
r2--4
Illustration 4-42
Amoutkeystbat mouethe curcor
4-63
Sound Lab TDS :
DisplayMenu =
:
l-,
P€raheters
DisFleg
h
30
2t'
F
1|'
L
T
0
-to
-2|J
IJU.UU
ESh
-l s 6 -. s : r- f t-i i lEEt-ti.=l
FIE:
liEs
-
p=rJil
BnEoHy.flc
- E-
j
lsp st'
i
it h
6
e.hel
{E i
i6
t=o e"-a o-a;"f
_-
TIHE (htlfiaeconds)
=
Freq.
Stsrt
1?SO.o
Stop
Freq.
Illustration 4-43
|
Tirne responsedisplay sbowing tbe cu$or data windous
+64
=
z?eO.O
Sound Lab TDS :
Display Menu
=
Other Display options-Helative cursor
The relative cursor mode is available for both the time
and frequency cursors. The relative cursor is used to
find curve data values relative to a reference point on
the curve. To use the relative cursor, first turn the
cursor on and position the it on the point you want to
designate as the reference point.
Select the relative button at the bottom of the screen
(click on it or press R) to make this the reference point.
As you move the cursor, you will note that a "phantom
cursor" is left behind at the reference point and the
cursor values are now referenced to that point. For
example, if the cursor is on a data point that is 10 dB
below and 100 Hz to the right of the reference point,
the value in its data window will read -10 dB and 100
Hz. If you choose the Units cursor button, the cursor
data windowwill show the magnitude in your chosen
Reference Units as set in the Inpit...Calibration submenu.
reference point
Illustration 4-44
Relatiue cursor
cufsof buttons
-l
FaatG-l fu-tts
4-65
Saund LabTDS :
Display Menu
=
HTEAcursor
The RT6ocursoris toggled on or off. The SbifrF2key
also activates the RT6ocursor.
'$fhen
the RT6ocursor is On, Sound Lab performs an
integration on the time response data and displays it in
a second color. Three cursors can then be moved
across the data to process RT6o calculations and a
%oALcoNs
calculation. Sound lab displays the RT5o,the
direct-to-reverberant ratio, the %oALcoNs,and the
difference in level between the left and right cursors on
the integrated curwe.
lnformation boxes
'
|
TDS
\
Fi le
{lEE
fRrJi
-
Heasure
s;l
Displae
Par.Eeters
lEd;7Etu;*-.6-eE-l
ltACF6#-
Input
t's]
ld-i;oM-=
60r........-
ro r I
o
-10
+o
30
6
u
zo
i r o
E
-
o
Cursor
data
windows
+
ITN H;g|
fsr+l
FILE:
EALCONY.SC
l3tEd
n
t
s
rujil
o
o
D
|3ffiffi?
s
(hilliseconds)
rItsE
:
St5rt
Freq.
h
N
@
a?AO,O
Stop
Freq.
=
ZZZO,O
Illustration 4-45
Time response(ETC)display witb RT6ocursorsactiue
4-66
Sound Lab TDS :
Display Menu
=
(*As the active cursor moves across the screen, each
of these values is updated.
All three cursors can be manipulated with mouse or
the Arrow keys
On the ETC graph the cursors select:
L Left end of the RT6ocomputation
D Division between the early and late sound
used in the calculation of early-to-Iate energy
ratio for a o/oAlcotts measurement
R Right end of the RT6ocomputation
The text in the data readout of the active cursor is a
different color than the other two. To select a different
active cursor, press the prefix letter (2, D, or R).
The RT6ocursor-ls active only for time response data.
+67
Sound Lab TDS :
Display Menu
Other Display options-Adjust
=
colors
Sixteen colors are available for Sound Lab displays and
menus. \When you select Adjust Colors, a list appears
showing various display elements along with their
current colors. Highlight the item in the left-hand list,
then press Enterto open another sub-menu with a list
of color choices. Make your selection and pressEnter.
Sound Lab will update the color sample in the submenu.
SoundLabwill not allow color
combinations that will cause
display elements to disappear.
'Windou
For instance, if
backgroundis black, you may
not set Window text to black.
EEEEil
T ihE
Frequenca
3D
(ETC)
Respdse
(TDS)
Fespon3.
(3D)
Heterfall
troise
DisFtag
T$le
STI/BASTI
Displas
ed
to
Noise
Table
STI/RASTI
Owertas
Ctrl-Fz
Differene
RT6O
OIJ
Alt-FZ
eursor
Off
FZ
Cursor
Shift-FZ
Alt-rouse
Oll
Off
Color
Hindou
akcrnd
{indor
Tdt
trindou
Ke
Hindou
Data
Coror
Color
Color
Color
arue
Elue
c:
Greerr
d:
CltErr
e:
Fled
I
f :
l{agertta
I
9:
Brack
Red
Brue
I
Color
{hitc
Graph
2
eolor
LiehtBed
Gr€Fh
Grtd
eolor
Broun
h:
blor
LightGrag
i:
j:
6rae
DerkGralt
I
L lghtGreg
Graph
Cursor
ElEck
b:
off
Backer@nd
lE@d
Factore
e:
On
Alt-BeeE
I
I
L i9htGrae
{hite
Sc-le
f ETFET6=-ITarr--j;ii6l
LightElue
k:
LishtGreen
l:
LightCuan
Fr: LiglhtEed
Illustration 4-46
Submenuto adjust display colors,
n:
LightHagenta
o:
Yel lolt
F:
Hhite
fE-ft-CIEFe-l
4-68
Illustration 4-47
Sound Lab dtsplay colors
Sound Lab TDS :
Display Menu
=
Summary of Display menu options
Top of Scale-The
Top of Scale value (in dB)
determines the value that will be displayed at the top
of the vertical scale.
Bottom of Scale-The Bottom of Scale value (in dB)
determines the value that will be displayed at the
bottom of the vertical scale.
Auto Scaling-Toggle Auto Scalingon or off. If Auto
Scalingis On,the TEF will automatically scale the data
to displaythefull magnitude range of the measurement.
The highestdatavalue is placed in the top 10 dB of the
graph, andthe scale annotation is adjusted accordingly.
The new Top of Scale and Bottom of Scale will be
updated when the data is redisplayed. Manually
entering a value for Top of Scale or Bottom of Scale
automatically toggles Auto Scaling Off.
'$7e
recommend that Auto Scaling be left on for most
measurement tasks. If Auto Scaling is off and all the
data is out of the selected range, you will not see any
data on the screen.
4-69
Sound Lab TDS :
Display Menu
=
Auto Scaling can be toggled off if you don't want the
graph's Top of Scale value to change with data level
from test to test. This is a requirement if you are going
to use Ouerlayto create afamily of curves on the screen
resulting from several tests. See additional comments
in Overlay command description.
Wrap-When
Wrap is toggled on, the phase curve
will wrap or start over at the top of the scale as
frequency progresses. The top of the phase graph will
be 180 degrees and the bottom will be -180 degrees.
With Wrap off, the phase curve will be continuous,
without any sudden 360-degree phase jumps or
transitions. If you edit the Top of Scale or Bottom of
Scale, the Wrap feature turns off.
Graph-Toggle
to choose dB or Linear data in the
Nyquist display.
Display Rotation-Data
entry for the degrees of
counter clockwise fotation you want in the Nyquist
display, starting from zero degrees.
Horizontal Scale{ho
ose a Line ar or Log display to
set the horizontal frequenryscale infrequency response
displays.
Octave smoothing-Enter
a percentage value for
amount of octave smoothing to be performed on the
data in (a) magnitude and (b) magnitude and phase
displays. The value may be entered as a fraction, but
it will be displayed in the menu as a percent.
Saund Lab TDS :
Display Menu =
Perspective (3D) -Toggles
views of the display.
between Left and Rigbt
Curwe Order (3D)-Toggles between Front to Back
and Back to Front, describing the placement on the
graph of the first curve measured. The first curve is the
one that is measured at the time set by Start Receiue
Delay.
Front to Back (3D)-The
first curve
measured (curve 001) is placed in the front of
the graph.
Back to Front (3D)-The
first curve
(curve
placed
measured
in the back of
001) is
the graph.
NGToggle this'command to display noise data as a
Tableor Grapb.
STI:This command toggles the type of displayfor STI
measurements. Table displays the STI value for each
band plus the overall STl value. Grapb displays the STI
values on a gtaph.
Oveflay-allows multiple time, frequency or NC
measurementsto placed on the screen at the same
time.
Differenc#Time
or frequency measurements can
be differenced. The Difference mode is toggled Onor
Off, AfIer a reference curve is established, it is
subtracted from succeeding curves and the differenced
data is displayed on the screen.
4-71
Sound Lab TDS :
Display Menu
=
'\Cursor-Turn
the cursor Onto readvalues of the data
points on the graph. Move the cursor along the graph
by clicking the mouse or pressing the Arrow keys.
RT60 cursof
The RT6o cursor is toggled on or off.
\7hen the RT6ocursor is On, Sound Lab performs an
integration on the time response data and displays it in
a second color. Three cursors can then be moved
across the data to perform RT6o calculations and a
%oALcoNs
calculation.
Alt-Mous#Turns
Alt-Beep:Turns
off the mouse operation.
off the beep warning.
Adiust Colors-.4 d.just Colors allows you to choose
from sixteen colors for the various elements of the
display. Current colors-are shown along with a list of
color choices.
+72
\-
Sound Lab TDS :
:
Input Menu
lnput menusetting the hardware and
software to work Eogether
In the Inputmenq you select the microphone preamp or
line level inputs, specify the reference unit values you
wish to use, and the computer port that communicates
wirh the TEF.
. To set the input options, pull down the Input
nrcnu and select Settings
. To calibrate the display, pull down Input and
select Calibration
. Communicationselects communications options.
I@
EGrcEI
Ca I ibrat
Conltun
ion
icat
ion
l-TT-f--elose-l
Illustration 4-48 Inout sub-menu
+73
Menu
lnout
'
:=
Sewingssub-menu
Input:Toggles
between Lineand Preamp. The TEF
has fwo inputs for each channel: BNC connectors are
for line-level inputs and three-pin )OR connectors are
for microphone inputs. The microphone input is
connected to a microphone preamp to amplify the
signal levels.
I@
preant,
I@
eh€nnel
A
LoaslEack
PreaFF
Off
GEin
A
6(l
PreaEFGainB
fFi-FEI
dE
OdB
oFe I fETt --iinri6-]
Illustration 4-49
Settings sub-menu
4-74
Channel--Toggles between channel.4 and
B-the channel on which the TEF receives
data. This applies to both line and
microphone inputs.
The TEF analyzer can accept input from
one of four signal sources (Cbannel ALine or Preamlt or Cbannel B-Iine or
Preamp).
Loopback:Toggles
between Loopback On and Off.
Sound Lab TDS can test the TEF hardware with an
internal loopback connection from output to input. To
veri$r that the TEF is working, turn on loopback and
perform a frequency response test. The resulting
display shows the internal frequency response of the
TEF.
tnput "Menu
'e"-
"'r--
:
=
:::::
Preamp Gafn-Preamp GainA: To set the gain of the
microphone preamp for Channel A, elect Preanxp Gain
A, and enter the number of dB of gain you wish the
microphone preamp to have. A typical value is 40 to
60 dB. Use the same method to set Preamp Gain B.
Sound Lab accepts gain changes in 4 dB increments
'When
from 0 to 60 dg (0, 4, B, etc.)
serring the input
gain, use as much gain as possible in the preamp
(just like in a sound system, put the gain up front).
Once you start measuring, adjust the gain up or
down until it is as high as possible without getting
an overload indication from the soffware.
If the overload (ovld) LED on the TEF lights during the
measurement, either the Preamp Gain or the system
output level is too high. A good practice is to set the
output level of the amp to obtain a test-signal level of
about 70 dB SPL (conversation level). Then, if the
overload light comes on, reduce the microphone
preamp gain.
Note: It is not a good practice to set the output level
with the output level knob on the TEF since some tests
require this knob to be in the calibrated position to get
calibrated results.
4-75
Inout
Menu
,
:=
Calibration sub-menuCalibrating the display
The amplitude reading you get in a display is always
accurate in a "dB relative" sense. If you need to
know the absolute amplitude of a measurement
relative to 0 dB SPL, the numbers will be incorrect
unless you have first calibrated the instrument.
To display data, Sound Lab software uses reference
units, volts per reference unit, propagation speed,
distance units and a 0 dB reference. Without this
information, Sound Lab would show data only in
terms of volts and seconds, and not the more familiar
units of sound pressure level and feet.
I@
Reference
Zero
dB
Reference
Ualue
SFeed
FroFagation
DistEnce
Pescal
Unit
l13o.o
feet
LJnit
TETt=c-ro*lf-Alr--i
O.OOOOa
jnzc-l
Illustration 4-50 Calibration sub-menu
4-76
lnput Menu
:
=
To enter these units, choose Input and select
Calibration The first time vou use the software,try
thesevalues:
Reference unit..........
Volts per reference unit
\__
pascal
... .00225 (Typically B&K
4007 microphones are
.00226 volts/pascal. See
your microphone data
sheet under the
specificatio n Sensitiuity )
Zeto dB Reference Value
corresponds to 0 dB
SPt.)
Propagation
speed
sound traveling in at at
Distance uni1..........................
3:;:] Feet: thisco*elates
with the propagation
speed. The propagation
speed will change as you
change the Distance Unit.
For example, if distance
unit is set at IL30 feet/
second andyou change to
meters, the value will
artomatically change to
344.4 meters /second.
Table4-5 Initial calibration settings
+77
tt?ut Menu
:
:
Reference Unit-Enter the name (up to 10 characters)
for the reference unit you want to use. To set the
reference unit, choose ReferenceUnitand enter the new
value. The pascal is the standard reference unit for
acoustic measuring. Ifyou are measuringvoltages, type
Volt; for impedance measurements enter Obm.
Volts per Reference Unit- Enter the sensitivity value
from your microphone or transducer data sheet. This
value indicates hsw much voltage your transducer
generates when one reference unit is applied to it.
For measurements with a microphone, this value indicates
how much voltage the microphone generates in a
sound field of one pascal (or 94 dB SPL). For the B&K
40075 microphone available from Techron, a qlpical
value is 2.25 millivolts per pascal (entered as 0.00226).
If you are measuring electronics, and the reference unit
is one volt, rype 1.
Zeto dBReference Value - This value indicates the
zero dB reference value for your measurements in terms
of your chosen reference unit. Choose Zero dB Reference
Valueandtype in the value that you want to coffespond
to the 0 dB line on the measurement graph.
For acoustics, this value is 20 micropascals,
which coresponds to 0 dB SPL.Enter 0.00002
for this value.
For other measurements, enter the value that
yields 0 dB. For example, enter 1 volt for dBV.
4-74
Sound Lab TDS :_
:
lnput Menu
=
Propagation Speed - Highlight Propagation Speed
and enter the propagation speed for the media in the
system you are testing. For example, sound travels
1130 feet per second in air. The number entered
represents the distance awave travels in one second in
terms of your chosen distance unit. For sound systems,
the distance unit is usually meters or feet. Sound Lab
software uses the propagation speed setting in several
places to convert befween time and distance.
Media
Air
'Water
(fresh)
'Water
(salt)
Glass
Gypsum board
Concrete
'Wood
(soft)
Aluminum
Mild steel
Lead
Plexiglass
Human body
Meters/Second
344
1480
1.520
5200
5800
3400
3350
5L50
5050
1220
1800
L558
FeeVSecond
1128
4855
4987
L7060
2231.0
111.55
10991.
16896
15568
4002
5905
511'1
Table4-6 Speedof sound in uarious media (at 21'C)
4-79
Sound Lab TDS :
lnout
Menu : =
,
Distance Unit - Sound Lab allows four distance units.
Usually this unit will be Feet or Meters, depending on
whether you want to use the English or Metric system
of measurement. The propagation speed automatically
changes to match the units.
'$7hen
you choose Distance Unit, a sub-menu appears
allowing you to choose feet, incbes, nleters, or
centimeters.
To keep Distance Unit setting as displayed, press AltClose.
IEII
Set t ings
EEIETTil
Fleference
Unit
Uolts
Feference
Zero
Per
dB
Pascal
Reference
ProFagation
Unit
Uallre
Speed
feet
incheg
tsreters
rneter
[FfE=EIEse
I
Illustration 4-51 Distance unit sub-menu
4-BO
O.OOOOa
113O.O
reet
@E!@
centi
O.tl[I226
Sound
LabTDS :
,''tput Menu
,
::
L
Communication sub-menu
Usethe Communicafrbnsub-menuto matchhardware
and softwaresettingsfor communicationbetweenthe
TEF and your PC. Sound Lab lets you choose serial
(COM1 or COM2), HI (host interface) or parallel
communications(LPTI or LPT2).
To use sedal communication:
1. SetBaud Rateto
match the serial interface
IET
settingsmade on the
analyzer. For more
Sett
irrgs
information,
see Section5
Cal ibrat
ion
in the TEF20 Analyzer
User'sManual.
2. Connectthe analyzer
Eaud Fate
5?6tltl
eoHl-to a serial port connector
IEr
designatedas either
HI
COM1or COMZon your
EIII
PC.
Seeyour computer
r
coHe
installationmanual for
LPTI.
the locationof COM1or
LPT2
COM2.One of these
ITIT:E:ESe
I
ports may be used for the
mouse. Make the same
selectionin the Communication sub-menu.
Illustration 4-52
Settingsub-menu
+g'l
SoundLab TDS :
lnput Menu :
-
To use HI (host interface) communication:
1. Instructionsfor installing the HI PC card can
be found in Section5, Pages5-7 to 5-9, in the
TEF20 Analyzer User'sManual.
2. Connectthe TEF analyzerto your PC with the
cable that came with the HI PC card.
3. SelectHI in the Communicaflon sub-menu.
I@
Sett inqs
CaI ibrat ion
Baud
llate
5?6tl0
HI
Port
3os
riI-EEGr
a:
b:
c:
d:
e:
f.
9:
h:
.l.OA
144
188
1c8
2OS
248
288
3t8
Illustration 4-53
HI BaseAddress
sub-menu
rEfl
j:
344
k:
388
ITTFE'Iose
+82
4. Select the HI Base address
with the HI Base Address submenu. The address set on the HI
computer board must match the
address you select with the HI
Base Address sub-menu. The
manufacturer's setting for the
base address is 308. To change
these settings, see the page
reference above.
I
lnput Menu
:-
To use parallel port communication:
To use the parallel port, be sure the parallel cable is
connectedto your computer and simply choose
LPTI or IPTZ to match the port connectionon your
computer.
I@
Sett
Cal
Baud
ingls
ibrat
Fate
Id
L
ion
5?6t}tl
LPrI.
HI
col.t1
colte
rrErrr
LPTz
fFii-:E-iEf€-l
Illustration 4-54
Sub-menu for selectingparallel communications
\-
+83
SoundLab TDS::
Performinameasurements .-Timeand FrefruencyBesponse
Section 5: Performing measurements
Introduction
Sound Lab TDS software combines with the TEF
analyzer and your computer to form a complete
measurement system. The TEF analyzer generates a
signal into a device or environment under test, and
then retrieves, analyzes and visually displays the many
Time, Energy, and Frequency relationships of the
associated data.
Sound lab performs traditional measurements such
as the time and frequency response, Noise tests, STI/
RASTI intelligibility tests, and 3D tests. Many options
for display of the data are easily accessed from the
Display
To make Sound Lab TDS tests
This section of the manual reviews the basic steps for
making Sound Lab TDS measurements. Before you
attempt thesemeasufements,be sureyou are thoroughly
familiar with Section J, Nauigation,which details how
to navigate around the program, work with menus and
enter parameters. For more details about the software
and setting parameters, see Section 4, Menus.
\-
E 4
Sound Lab TDS :
Performina measurements
:
Time and FreQuencyBesponse
To make Sound Lab 7D.Smeasurements,you may need
an MS-DOS-basedcomputer, a TEF 20 analyzer,Sound
Lab TDS software, an amplifier, a speaker, auipod and
a high quality microphone. An alternative to using a
microphone is a sound level meter with a line-level
output. See TEFSystem20 Analyzer User'sManual for
hardware details.
Performing a time response test on a
loudspealier
Speaker
1. Connect the system as described in the TEF20
Analyzer User'sManual. Put the loudspeaker
and microphone on stands, several feet from any
reflective surface. Put the microphone 1 meter
from the speaker, on
axis. On the TEF
analyzer, set the output
level knob about 1/4
of the way up. Set
your power amplifier
level control about 1.2
of the way up. These
low settings prevent a
loud burst of noise
when you run a test.
A test signal that is too
loud can damage a
speaker or cause
distortion.
Illustration 5-1
Equip ment al'ra.ngenxent fo r p erfo rm i ng
Time and Frequency testof a loudspeaker.
5-2
Sound Lab TDS :
:
Performina measurements
:
Time and Fre(uency Besponse
2 . Start the Sound Lab program.
4
Set the input parameters. Go to the Input
menu and select Settings. Select the settings
and gain to match your equipment arrangement.
4 . From the Input menu, select Calibration and
enter the proper values and calibration constant for your transducer.
5
i
From the Inputmenu, select Communication
and enter the proper values.
a. If you do not have a TEF-HI card installed,
enter 57600 for the Baud Rate of the com po/'t.
If you do have a TEF-HI card installed, the
baud rate doesn't matter.
b. If you have a TEF-HI card installed, select
F{Iport. Otherwise, select COML or COM2,
depending upon the pofi to which you connected the TEF.
'the
c. Use
HlBasedefault-3)9.
6 . Setting the Display. From the Display Menu,
choose Time Response, then from the Display
Tlpe submenu, select Magnitude. Turn Auto
Scaling On,
7. Setting the measurement parameters. Go to
the Parameters rrrenu, and select Time Responsetest. Enter the parameters under which
you want the test conducted. For more information on setting parameters, see Section 4,
Menus, Guidelines for setting pararneters
5-3
Sound Lab TDS :
Performino measurements
:
Time and FreQuencyHesponse -
8. At this point you may run the test by selecting
Do Time Testunder the Measuremenu, or by
pressing function key F5. You will see the
display on the screen and be able to examine
:+
lL.
Illustration 5-2
ETC Display of a Time Response Test
9 . Refinethe time scaleif the first reading is too
coarse for clarity. SeeAppendix A, How TEF
worksfor more information on resolutions.
1 0 . From the Display menu, select TimeResponse
to experimentwith other ways to display the
data.
5-4
\-
Sound Lab TDS :
Pefformina measurements
:
Time and Frefruency Besponse
11. Printing the display. If you wish, you can
print the graph. From the File menu, choose
Printer Settings. Try using the default settings.
'S7ith
your printer turned on, select Print to
print the display.
L2. Savng the settings. You can save any settings
you used in testing andload them later by
selecting Configuration and entering a name
in the dialog box which appears.
13. Saving the data. To save the test data, select
SaueAs from the File menu. Select Clear All to
set up the dialog box for your information.
Enter File Name and anv other information vou
desire. Select Binaryunder Format,select
Saue and close the dialog box to continue with
your next measufement.
i
E E
Sound Lab TDS :
Performinqmeasurements
:
Time and Frefiuency Besponse
Performing a frequency response test
5-6
1.
See equipmenl affangement for Time Response
test.
2.
Start the Sound Lab program.
3.
Set the input parameters. Go to the Input
menu and select Settings. Select the settings
and gain for your equipment affangement.
4.
From the Inputmenq select Calibrationand
enter the proper values and calibration constant
for your transducer.
5.
From the Inputmenu, select Communication
and enter the proper values.
6.
Perform a time response test (ETC) to find the
direct sound.
7.
Turn on the Cursor in the Display menu by
selecting Cursor On or pressing function key
F2. Position it over the exact time of the first
energy anival at the microphone. Press F4 or
select the TDSDelayb$ton at the bottom of
the screen to enter the receive delay into your
measurement pafameters for the Frequency
Responsetest.
8.
Setting the measuremeru parameters. From the
Parametersmenu, select Frequency Response.
Enter the parameters under which you want the
test conducted.
\_.
Sound Lab TDS :
Performinqmeasurements
:
Time and Frejuency Besponse
c)
At this point you may run the test by selecting
Do Frequency Testunder the Measure menu.
1 0 . Refine the receive delay to flatten the phase
response by pressing F4and entering the
incremental changes you desire. Press Enter
and retest.
1 1 . From the Display menu, select Frequency
Resltonse to view thre data in other displays.
You can choose Pbase, Magnitude, Magnitude
and Pbase, Nyquktand HE)ser Spiraldisplays.
TDS
ET
B F T B T 9 R rT i Ti fi fd E
f l T T B
i
N
MEUftY
Dlst,
ks.
(K)
=
LO
Fre!,
Fs.
=
lSO.a
Illustration 5-3
Magnitude Display of tbe Frequency Response test.
5-7
Sound Lab TDS :
Performina measurements
:
t\otse tesE :-
Noise criEeria measurements
NC (Noise Criteria) Curves are a standard method of
characterizing noise loudness. The NC rating has been
used extensively in noise and vibration measuring.
Noise Criteria measurements (NC) can provide important
information for designing a sound system or evaluating
a noise problem. NC measurements are made with
ANSI Type 2 filters.
Equipment needed
To make NC measurements you will need an MS-DOS
computer, a TEF 20 analyzer, Soundlab TD.lsoftware,
a tripod and a high quality microphone. An alternative
to using a microphone is a sound level meter with a
line-level output.
NC measurements with a microphone
The microphone inputs of the TEF 20 are wired to
accept industry standard 3-pin )CR-type connectors.
The microphone connector provides phantom power
for condenser microphones.
EElig
Illustration 5-4
-,A
\J- OF@F@B
Equipment affangenxent for microphones
5-9
Sound Lab TDS :
Performinameasurements
:
Noise Test :
If you are using the built-in TEF preamps, adjust the
gain in the preamp until you get an overload, then
lower it one step to get the proper level.
Note: Be aware that all microphones have inherent
self noise, and if you are measuring an extremely quiet
room, the self noise of the microphone could adversely
affect your measurement. Check your microphone
specifications forthis information. It may help to have
your measurement setup in a different room from
where the NC is being measured.
NC measurements
with sound level meters
If you are using a sound level meter and the line level
input, the output of the sound level meter must be in
the range of 1 millivolt to 1 volt to perform valid NC
measurements. To connect a sound level meter,
connect the output of the meter to the TEF 20line input
and ser the AC/DC switch to AC.
65
EFH
B
A
_cr. _a.
/A\/A\
u- OF@E@
9 (F/
Illustration 5-5 Equipment arrangenxentfor sound leuel rneters
5-10
Sound Lab TDS :
:
Performinq measurements
:IYotselest
Setting the AC/DC switch to ACwill prevent small dc
voltages (generated by the sound level meter) from
causing premature and otherwise unexplained inputovedoad errors.
Additionally, be sure to understand how the meter
nrzngesettings affect the output level. Consult the
technical manual supplied with the sound level rneter
before attempting afl accurate calibration
Making NC measurements
This section details the basic steps for making an NC
measurement. Formore details aboutthe software, see
the section titled l/C n'renus
To make an NC measurement, follow these steps:
1. Choose Settingsfromthe Input menu. Choose
the input setting and garn for your equipment
arrangement. To insure accvtate readings,
adjust the preamp gain until you get an
overload, then lower it one step to arrive at
the proper level.
2. Choose Calibrationfrom the Input menu.
Enter the calibration constant for your
transducer.
3. In the Parameters menu, choose Noise Test
(NC) and enter a value beween 1.-9999
seconds for the Integration Time.
4. Choose Do Noise Test (NC) from the Measure
menu, or press F'7.
NC will start the test and measure the noise in eight
octave bands. \fhen the test is complete, the data will
be displayed on the screen.
E
4 4
Sound Lab TDS-:
Performinameasurements
:
Noise Test :-
TDS
-lE@
Prr.het-r-
Displae
o
)
Hf
f
U
7C
I U
= n
6S
6 1
6C
u , ^
5:
t
5f
i
4:
4t
t
r
3:
U
3t
t
zt
I
2t
l:
Illustration 5-6
NC curue
,r.",,"r,*"";
J:;ffi#,,;;
byNCisthe
highest curve that is not exceeded by data in any
octave-band. This implies that noise in a single octave
determines the NC rating since the effects of the
different bands are not additive.
The lower boundary of the family of NC curves (NC15)
represents the point at which noise is perceived by
most people to be objectionable. The highest curve
(NC70) represents noise in which people can
communicate only by shouting in each other's ears.
The curves are spaced 5 dB apart through the midfrequencies because the average listener will not react
to a change in the noise that is less than 5 dB (even
though smaller changes can be detected.) The shape
of the curves accounts for low frequency noise being
less annoying (or noticeable) than high frequenry
noise.
5-12
SoundLab TDS :
Performino,measurements
:
STI/HASTI :
lntroduction to 5Tl
The speech transmission index (STI) is an evaluation of
howwell the amplitude modulation patterns of speech
afe preserved when passed from their source to a
listener.
STI and RASTImeasurements
Sound Lab TDSmakestwo types of speech intelligibility
measurements based on the Speech Transmission
Index (STI).
STI measuresin the octavesfrom 1.25Hz to 8
kHz.
RASTI,a shortenedversion of the STI procedure, measuresonly at the 500 Hz and 2 kIIz
octaves.
Sound Lab SZc6"llects data from a noise measurement
and several time response tests which are processed to
yield an overall speech intelligibility prediction. The
resulting data,is displayed on the screen ina graph or
table. The software default measures with noise
included, although it can be tumed off. Practical STI/
RASTI results, however, have noise dataaddedintothe
calculation, and Sound Lab TD.l allows you to add
noise later.
5-'13
Sound Lab TDS-:
Performinameasurements
:
g1,/BASTI
_
Sound Lab 7DS allows you to make STI measurements
by using a calibrated talker/speaker placed in the
location and position where a human speaker would
be. This talker/speaker must be flat (under free-field
conditions) within plus or minus 10 dB between B kHz
and I7.2 kHz. A test microphone is placed in the
position of the listener.
Forvalid speech intelligibilityresults, the talkerlspeaker
should be calibratedto a level that simulates the voice
level of a person speaking and equalized to eliminate
any deficiencies of the speaker. This operation preceeds
the STI test.
The Calibration procedtre is set up in the
Parameters...Sn sub-menu and the SpeakerEQ test
option automatically follows calibration. The calibration
and equalization tests automatically precede the STI
test when you choose Do STI Testunder the Measure
menu. A series of dialog boxes will lead you through
the procedure, and then the software will proceed
directly into measuring the STI.
See Calibration orocedure to follow.
5,-14
Sound Lab TDS :
Performina" measurements
:
STI,/BASTI
Performina the measurement with
caIib rated-ta Iker,/ sp eaker
This section details the tasic steps for making an STI
measurementwith noise included and assumesyou are
going to perform the accompanying calibration and
equalization tests of the talker/speaker. To make an
STI measurement, follow these steps:
Equipment arrangement for calibration
1. Place test microphone and talker loudspeaker
one meter apar| on axis. An alternative
distance placement is 1,/2 meter apaft.
2. Connect the input of the test amplifier to the
test output of the TEF. Connect the output of
the test amplifier to the talker loudspeaker.
Connect the test microphone to either channel
A or B of the TEF.
Illustration 5-7
Typical equipment affangelnent to perform STI
calibration pro cedure .
5-15
Sound Lab TDS :
Performina
:
- measurements
.:
STI/BASTI
Setting up parameters
1. Under the Input rnenLt,check that your input
settings, gain, calibration and communication
values and are set appropriately for your
equipment setup.
2. Choose table or graph in the Display...STl
menu.
3. Choose Measure Noise On in the Sn/RASn
option in the Parameters menu.
4. Turn Source Calibration O/V in the SWRASTI
option in the Parameters menu.
5. Choose Do STI Testfrom tl:reMeasure menu.
The Calibration procedure will start automatically. The
TEF will start repeating a 500 Hz, octave-band frequency response sweep, and a dralog box will appear
announcing that the Source Calibration procedure is
starting.
After each sweep, the dialog box is updated with
current level at the talker loudspeaker. The rycle time
of this test is approximately one second.
:EEE@
Test
Starting
Adjust
Source
until
ing
Calihration
leuel
is
( 6?
eurrent
Fress
ler.rel
E=c
to
is
61
at
Frocedure.
at
1 neter.
O .5
rreter
)
?5,O
continue...
Illustration 5-B
SourceCalibration dialog boxfor setting leuel
5-16
Sound Lab TDS :
:
Performinomeasurements
STI,/BASTI :
6. As you monitor the level on screen, manually
adjust the gain of the test amplifier until the
value in the dialog box reads 51,(67 for'J./2
meter test.)
7 . After the correct level is attained, press Escape
to continue to the Eq.ualization procedure. A
message box will appear with the message:
Testing Speaker EQ
The TEF is running a standatdfrequency response test
from 88 Hzto Lt.3 kHz (one-half octave below 125 Hz
and one-half octave above SkHz), and then stores the
measured equalization value.
Note For all subsequent intelligibility tests, keep the
gain control of the test amplifier at the setting that you
determined in this calibration procedure. If the gain
control of the amplifier is changed, perform the
calibr ation procedures again.
5-17
50uno
:
LdD luD
Performinqmeasurements
STI/BASTI
:
.:
Following the EQ test, the test is paused and a dialog
box informs you:
. Source Calibration procedure is completed
. Source Calibration is being turned off
o You may arrange equipment for the STI/RASTI
test.
You continue the procedure by pressing any key. See
Illustration 5- 10 below..
IiEEEtrT
Scurce
Ca I ibrat
Turnirrg
of f
Arrange
Press
D isFlau
PE rEFre te rs
ion
Source
equielnent
an!'
ke!,
to
eortp leted
Frocetfure
Cal ibrat
for
cont
STI./RASTI
irrue.
'
ion.
test.
. .
Illustration 5-9
Dialog box preceeding STI sweqs.
house speaker
house amolifier
house
microphone
talker
loudspeaker
Illustration 5-10
5-18
Equipment alTa.ngernentfor SWRASTI test
Sound Lab TDS :
Performinq- measurements
:
:
STL/BASTI
Arrange the equipment for STI
1. Place the source loudspeaker where the orator
will speak and adjust the height of the loudspeaker to be about head high.
2. Place the test microphone in the position of a
human listener.
3. Turn on the house system and set the levels
for normal operation
4. Press any key to resume the STI/RASTI tests.
E-@
Ft l.
E@E
Ftl.
rilG
ht.
lB@
.STI
osmJ/
Lln
I
LiG
a
Forut
l-6l€:fl6-s
1994
!2 : 15 : S
blh-rs
I fArE:U-tr6-]
Pressing any key causes a
SaueAs dialog box to pop up
allowingyou to name the STI
measurement and create
notes
testing
before
continuing. You must choose
Measure from the dialog box
to start the test.
Sound Lab will continue the
STI/RASTI test and first measure any noise in eight octave
bands. When the noise tests
are complete, STI then performs seven ETC tests (two
'When
for RASTI).
all of the
ETCs are complete, the software then calculates the overall STI and displays the results in the activewindow in
a table or graph, depending on your choice made
under STVRAST inthe Display sub-menu.
Illustration 5-L1
SaueAs dialog box allouing
you to narne tbe testand start
tbe STIsweEts.
L
5-19
Sound Lab TDS :
Performinq- measurements
:
::::
STL/BASTI
Since calibration and equalization are complete, to
measure at other listener positions, you can simply
initiate the SWRASZsweeps from under the Measure
menu in your usual manner. The level calibration and
equalizatton procedure should be performed every
time a differentloudspeakerormicrophone is used and
any time the gain controls are altered in the measurement setup.
Driving the system directly
If you do not use the talker/speaker arrangement, but
prefer to go through the house system directly, the
levels again should be set the same as for a person
speaking. In this affangement, of course, you do not
perform the calibration procedures. Make certain that
the reinforcement system level is predominant either
by listening or by making a Time Response test and
checking the signal streiigth of the reinforced sound
and the time of arrival.
5-20
Sound Lab TDS :
Performinameasurements
:
"
sTt,/BASTt -
an
Nc
i:{: !":::':^E^7:
!#:::#:#:X??""'
(noise criteria) measurement or from atable. The Add
Noise to SWRASZoption in the Displaymenu provides
noise with noiselessSTI or
i":rfl#Jost-process
\fhen you have STI data displayed on the screen,
choosing Add Noise to STI/RASTIopens a sub-menu
that allows you to choose noise values from an NC file
or Table.
If you choose NC File, a sub-menu opens showing
available files fromwhich to extract noise data. If you
choose Table, a sub-menu will appear allowing you to
enter noise values on octave band centers from the
kevboard.
The softurare will perform an FFT on the data with the
noise included and redisplav the results.
Illustration 5-12
Noisecan be
added to STARASTI
n'reasure/nents
from afile (A) or
a table (B) under
tbe Display rnenu.
TtrS
Fi le
iloise
EEilIIIlEi!ilIil
CFAHOH.HC
CFAHOI.IAS.HC
t..r
ITTFc-Tose I
ITTFE]I-*-l
l-E'Tt=TnFo I
rETr:F?frT-l
Table
atctaue
dE
125
=7 dB
55 dE
e:
25O
53
dB
d:
5t1tl
44
dE
e:
J"OOO
28
dE
f:
2t]t1t1
dE
9:
4OOO
3
-3O
h:
aooo
2(}
dB
GtEil
b:
Fleca lcu
lete
TI-I-F:EI os;l
A.
.lB
TETi=iiftiE-l
B.
5-21
SoundLabTDS:
Performina
:
- measurements
:
STI,/BASTI
l:Elyatins
the STIgraphand summary
You may choose befween two displays - a graph or a
table display.
An STI graph plots the individual STI scores in octave
bands.
OUEFALL STI
o .23
BND
l.o
TEf
o.9
o.a
o.7
o.6
o,5
o.4
o.3
.T
""'T'
o.2
.I
I
o,1
I
o.o
5(,(]
1(l.'0
Frtquercg
Illustration 5-13
STI data displayed as a graph.
5-22
2000
(Hz)
4('.]t1
Noise
source
sooo
= treesure
Sound Lab TDS :
Performina" measurements
.-
sTt,/BASTt -
5TI surnmary table display
The STI table display shows numeric values of the
individual and overall STI data. Shown are the STI
scores, the equivalent eady reverberation time and the
equivalent signal-to-noise ratio (S/N Ratio).
TEF
SPEECH
IHTELLIGIEILITY
EARLY
125
Hz
25O
Hz
o .5t
o.42
o .34
o,e?
o .16
o.a1
o.o:!
5OO Hz
LOOO Hz
2OOO Hz
4OOO Hz
SOOO Hz
TEST
BT6(}
S/H
l.5l
--
TEF 2t}
FATIO
o.3
-2.5
dB
2.44
e.99
-3,?
dB
5.21
-6,9
dB
LO .77
-to,2
da
?.o3
-s,6
dB
47.97
-14.3
dB
dB
ouEnALL -=
stl
O,23
= -6.6 dB
FT6O =11.13 s
Equiu_E-lent S/H Ratio
Equiualent
--
Earle
SUBJECTIUE
EUALUATIOH
--
BAD
Hoise
source
= l'le5sure
Illustration 5-14
Summary STItable display
5-23
Sound Lab TDS :
Performina" measurements
:
:
STI,/BASTI
STI subjective score
The subjective evaluation-:The
correlates with spoken word articulation tests. These
testsare conductedwith a speakerreciting a phonetically
balanced word list for a oanel of listeners who record
what they hear.
STI score
Subjective evaluation
Bad
Poor
Fair
Good
Excellent
to
0
to
0.3
0.45 to
to
0.6
0.75 to
0.3
0.45
0.6
0.75
1.0
column indicates the
Signal-to-noise ratidThis
signal-to-noise ratio that would yield the STI score if no
reverberation wefe present. This assumes that only
noise, without the effects of reverberation, is present in
the transmission chain to degrade intelligibility.
Table 5-1
SWRASTI to
AICONS
conuersion table
early RT6o column indicates the
Eady RT6fThe
value of the early decay time that would yield the STI
score if no noise were Dresent. This assumesthat only
reverberation effects ire present in the transmission
The reverberation
chain to degrade intelligibility.
process assumed in this calculation is a perfectly linear
decay (on a dB basis) but with no noise.
Converting
RASfi measufefirents
RASTI
Bad
Poor
Fair
Good
Excellent
5-24
0.20-0.22
0.24-0.34
0.36-0.50
0.52-0.64
0.66-0.85
0.BB-1.0
to o/oAL"oo*
%o[.o*,
57.7-57.8
45.5-27.0
24.2-77.4
10.2-5.3
4.8-1,.6
1.4-0.0
\-;
Sound Lab TDS :
Performina" measurements
:
:
STI,/BASTI
About the STI measurement process
The modulation transfer function (MTF) is a measure
of the preservation of speech modulation patterns
necessary to maintain high speech intelligibility when
a signal passes through a system. Classical methods
directly measure the MTF with sinewave amplitude
modulation of a bandlimited, random noise, carrrer
signal. These methods make a series of modulation
transfer measurements with carrier frequencies on
octave centers ftom I25 Hz to 8 kHz. The carriers are
modulated with speech modulation frequencies of 0.5
'L5
to
Hz, at one-third octave intervals.
These measurements result ina data set containing 98
modulation reduction indexes which are, in turn,
converted into a single index called the Speech
Transmission Index (STI). The STI value is a single
number that indlcates the effect of a transmission
system on speech intelligibility.
An alternate method for computing the MTF measures
the impulse response of a system without having to
directly measure the modulation transfer characteristics
at each individual modulation frequency. This method
derives the MTF by calculating the frequency spectrum
of the squared impulse response of the system.
TDS measurements are a slightly modified version of
the impulse response method. Because the TDS
process for the ETC measurement yields the complete
analytic signal response (both real and imaginary
parts) of the system under test, this complete signal
information is used to calculate the MTF.
5-25
Sound Lab TDS :
Performinqmeasurements
:
STI,/BASTI
Overall STI and RASTI values are derived by making
MTF measurements at all the octave bands between
l25Hzand9kHzfor STI andatonlv 500 Hzand2kHz
for RASTI.
Affi,.,
B
Illustration 5-L5
Diagram A sbowsa sineutauemodulating random
frequencieswbicb are cbaracteristicof the buman
uoice. Tltis modulationpattern is an exampleof
perfect modulation utbicb equalsan MTF of 1.0.
Themodulationpatteftt'in Diagram B illustratestbe
effectsof noiseand reuerberationin tbe room. The
modulation in tbe receiuedsineuaue is reduced by
comparison,because,ofthe effectsof noiseand
ecboes.
5-26
SoundLab TDS :
Performinameasurements
lntroducina3D :
lntroduction to 3D measurements
Sound Lab 3Dmeasurements made by theTEF analyzer
are composed of 2 to 100 individual TDS frequency
response measurements. Each sweep is offset in time
'When
alI of the individual
by a constant amount.
sweeps are displayed on the screen, they form a three
dimensional display that plots the frequency and time
behavior of a system. A 3D measurement shows how
the frequency response of a system changes as the
system response decays.
Ifyou have not made frequency responsemeasurements,
we reconlmend that you become familiar with the
material in this manual on making frequency response
measufements.
Use the lD display to simultaneously examine the time
and frequency characteristics of rooms, loudspeakers
or electronic devices such as equalizers and filters. For
example, you can see frequencies that ring; they have
a longer decay time than other frequencies.
5-27
Sound Lab TDS :
:
Performina" measurements
lntroducing 3D
Measuring loudspeakers with 3D
Arrange the measuring microphone and loudspeaker
in an area that is free of nearby objects. The distance
to the nearestobject will determine the lowest frequency
you can measure (see Spacewindow considerationsin
Appendix B , HolD WF uorks) . Position the microphone
on-axis with the loudspeaker. The following suggestions
assumes a distance of five feet befween microphone
and loudsoeaker
1
Make an ETC. Set the ETC parameters for a
short time span (about 20 milliseconds) to
determine arrival of the direct sound and the
first reflection and when the sound from the
speaker decayed into the noise of the room.
2 . Set tbe Start Delay. Turn on the RT60 cursor
(Shift F2) and press L to make the left cursor
active. To set the start delay, position the left
cursor just before the direct sound arrival and
enter the value, into the JD parameters by
pressing .S.
4
5-28
Set tbe End ReceiueDelay. Make the right
cursor active and set the End Delay by placing
it at the point where the direct sound decays
into the noise or iust before the arrival of the
first reflection-whichever occurs first. Press
Eto enter the value into the JD parameters.
The time between the Stal't and End Receiue
Delay is typically 2 or 3 milliseconds when
measuring a tweeter or high frequenry horn.
Sound Lab TDS:Performina- measurements
:
.:
lntroducina 3D
4. Set tbe Time Resolution. In the Parameters
menu, under JD Test, set Time Resolutionto a
value five times longer than the ReceiueDelay
Step (set by the start and end receive delay).
The ratio of time resolution to ReceiueDelay
Stepis called the overlap ratio.
5. Perform tbe measurernent . Start the 3D
measurement by pressing F9 or Quick kty 3.
Examine the display, and repeat the measurement with different Darameters. if desired.
Illustration 5-16
A Sound Lab 3D
display of a small
speaker system.
5-29
Sound Lab TDS :
:
Performina- measurements
lntroducing 3D
Measuring rooms with 3D
\fhen measuring a roomwith 3D test, excite the room
in a manner typical of its use. For example, suppose
you want to examine the low frequency behavior of a
concert hall. Setthe loudspeaker in the location where
bass sound originates, and place the microphone in
the listener's position. Set the frequency span of the
measurement to cover the range of the bassfrequencies
of interest.
1,. Make an ETC. Set the parameters for a long
time span (about 5 to t0 times longer than the
time it takes for sound to travel from front to
back in the room). Use the cursor to examine
the ETC and determine when the direct sound
arrived and where the sound decayed into the
noise of the room.
2 . Set tbe Start Receiue Delay. Turn on the RT60
cursor (Shift F2) and press Z to make the left
cursor active. Position the left cursor to the
point where the direct sound begins to rise
and enter the value into the JD parameters by
pressing S.
5-30
7
Set tbe End. ReceiueDelay. Press Rto make the
right cursor active. Move it to the right to
where the sound decays into the noise.
I
Set Time Resolution. In the Parameters menu,
under 3D Test,enter a value five times longer
than the ReceiueDelay Step in small rooms and
to the same value as the ReceiueDelay Stepin
Sound Lab TDS:Performina- measurements :
:
lntroducina 3D
large rooms. The ratio of time resolution to
the space between sweeps is called the overlap ratio. As explained later, these settings will
give a smooth 3D display with good frequency
and time resolution.
5. Perform the measurement and examine the
display. If desired, repeat the measurement
with different parameters.
Overlap ratio in 3D displays
For each offset in a 3D measurement, a single TDS
sweep is performed having a time window as
determinedbythe sweep
rate and IF bandwidth.
In most cases, the time
resolution of each curve
will be longer than the
time spacing berween the
curves. The ratio of the
time resolution to the
36 37 receive delay step is called
the overlap ratio. The
overlap
of the TDS sweeps
Illustration 5-17 In tbis illustration, tbe utide
is used to obtain a good
uertical lines representtbe time offsetsof tbe
compromise between
indiuidual TDSsueeps. Tbe ouerlap ratio in
time
resolution and
3D measurementsrefersto time resolution
frequency resolution. It
settingstbat are longer tban tbe time spacing
will
also produce a JD
betweencun)es. In tbis example, the time
w
i
t
h
a
smoother
resolution of eacb fl)eep is tbree times longer
appealance.
tban tbe spacing.
_u
A good starting overlap
ratio for loudspeaker measurements is 5 to 1. That
5-31
Sound Lab TDS :
:
Performina measurements
:lnEroouclng.7u
Illustration 5-18
A JD display uitb lou time resolution and bighfrequency
resolution. It sboulsgoodfrequency detail, but uery little
time inforrnation.
s
z
a
?o
Illustration 5-L9
A JD display witb excesstime resolution. Tbereis
excellent time resolution, but uery littlefrequency detail
5-32
Sound Lab TDS :
Performinameasurements
:
"
:
lnnoducino 3D
U
Illustration 5-20
A JD display tbat sbowsa good compromisebetween
tbe ntsopratious exanples. In tbis lrreasLtrernentue
cnn seedetail infiotb time andfrequency data.
5-33
Sound Lab TDS :
Practice measurements
:
-
Section 6: Practice measurements
Two basic tests
This section of the manual details the sequence
necessary for making two fundamental TEF
measurements in atypical setup, and gives suggested
startingparameters. The object of this section is to help
you to design a simple experiment to produce these
measurements and get typical displays on the screen.
For information on how to enter data or use the menus.
see the Menu section.
About the ETC
Two fundamental TEF measurements in TDS are the
Time Response (ETC) and the Frequency Response.
The Time Response test is a fundamental data gatherer
for many other TEF measurements. Time Response
information is used in setting parameters for Frequency
Responsemeasurementsand in calculating intelligibility
information, For these reasons, it is customary to make
a Tkne Respo4se (ETC) measurement the first task.
Time response measurements are used to:
.set up the frequency response test
.measure the delay of a signal applied to a system
under test
.find the direct sound arrival in a room
.find reflections
L
.find reflections that fit a pattern, such as flutter
echoes
.observe the decay rate.of sound in a room
.check the coverage in a room
. calculate the RT6o and o/o.ArLcorss
of a room
6_1
Sound Lab TDS :
:_
Practice measurements
:
The Time Responsetest displays an Energy Time Curve
that shows how energy from a system or device is
released after it is excited with a sudden application of
input energy confined to a given frequency band over
a ceftain time span. The results are displayed on an
ETC graph with time shown on the horizontal axis, and
energy on the vertical axis.
An ETC shows the
amplitude of the
sound energy that
arrives at arry instant
in the time span.
The Time Response
quickly reveals not
only the amplitude
and time of arrival,
but also the density
of the field, its approach toexponential growth and decay, and the initial
signal delay.
Illustration 6-1 is a typica.lETC. TLtetall "spike"near tbe left edgeis tbe
direct soundfrom a testloudspeaker. Thebeigbt of tbe spikeis not tbe
bigbestpoint on tbe loudspeaker's
frequency responsecurae. It
representstbe total energJ/arriuing at that pat'ticular time-in tbis case,
from tbe loudspeaker.Furtber to the rigbt (later in time) reJlections
may be seenarriuing. Tbeybauea lower total energl,ttban tbe direct
sound due to absorptionand.inuersesquarelau losses.
o-c.
\-'
Soundl-6foffr$:Practice measurements =
:::::
To make Time Response (ETC) tests, the TEF analyzer
sends a frequency sweep signal through the system
under test (in this case the system is a speaker,
microphone and air). The electronic sweep tone fed to
the loudspeaker will, in effect, represent all possible
frequencies in the chosen sweep runge. The TEF
analyzer then listens for the sweep via a microphone.
The frequency range of the sweep, the sweep tate, and
the delay time, plus other factors set by the operator,
all determine the characteristics of the ETC test display.
Reading an ETC display
The first tall peak from the left represents the direct
sound from the loudspeaker. This is the sound that has
traveled directlyfrom the loudspeaker to the microphone
in a straight line without having been reflected by some
object. The horizontal position of the direct sound on
the display indicates its time of arrival (the horizontal
scale is time in milliseconds). Its height indicates its
level (the vertical scaleis amplitude in dB). Immediately
following the, direct sound in Illustration 6-1., and
continuing out to about 5 milliseconds is the decay of
the loudspeaker. The various peaks extending from
about 5 milliseconds out to the right side of the display,
represent reflections in the room.
The time spa.non an ETC display (full scale from left to
right) is dependent onthefrequency spanof the sweep
and the numberof santples. The computer changes the
start ^nd stop frequencies to provide the frequency
span that, combined with current number of samples
selected,provides the requested Time Span. Remember
the inverse relationship between the units of time and
frequency; avalue that is wide in one domain will be
narrow in the other domain. Avery narrow pulse in the
SoundLabTDS:
Practice measurements =
:
time domain results in a very wide spectrum in the
frequency domain. A wide sweep in the frequency
domain results in a short full-scale time in an ETC. For
more information, seeAppendix A : Hout tb e TEF Works.
You set the time span for ETCs in the ParametersTim,eResponsemenu. \7hen you enter a time span, the
computer automatically changes the start and stop
frequenciesto provide the requested time span. Vhen
long time spans are needed-as when measuring the
acoustics of a reverbefant roorn-you
will sweep
'Sfhen
narrow frequenry bands.
short time spans are
needed-as when examining the fine detail in a
loudspeaker's time response-you will sweep wide
frequencybands. Keep in mind the inverse relationship
between Time and Frequency.
Doing a Time FlesponseTest (ETCJ
Equipment arrangement
The physical arrangpment for these measurements
consists of a room approximately 15' x 10' with a
hard-surface folding table, a 4-inch single driver
speaker andaB & K 4007 measurement microphone.
(You should get similar results with any convenient,
single-driver speaker.) The microphone and speaker
are mounted on stands approximately L 1/2 feet
above the table, 5 1/2 feet apafi, on axis. Connect
the output of the TEF to the input of a power
amplifier. (Keep in mind that the TEF 20 will output
a one-volt signal when the knob is set to the cal
position.) Connect the output of the amplifier to the
loudspeaker. Plug the measuring microphone into the
mic A connector of the TEF.
6-4
Sound Lab TDS :
Practice measurements
:
:
Start the Sound Lab TDSprogram. Sound Lab TDSwill
remember the settings that you used when you last
exited the program, but if you have not yet used the
program, the default settings will appear. To become
familiar with measurement pafameters, we are going to
set each p rameter for an ETC measurement.
Setting Sound Lab TDS software to work with a
microphone requires setting the input hardware and
calibrating the display. The Input parameters menu
includes machine settings that govern the operation of
the TEF measurements. Settings for the TEF input vary
with the type of microphone and the type of systemthe
TEF is analyzing.
Setting the input parameters
,} Go to the Input menu and select Settings.
Set your TEF to the settings shown:
,} Return to the Inlrutmentl
FTruE-.l
InFUt
Elranne
Preanp
I
LoopEsck
l@l€-C-E-l
PreenEGainB
TE-iT::Aios-Ell-Ti-F:Unaftl
A
Off
e4
dE
OdB
Illustration 6-2
Input p ararnetels sub-menu
6-5
Sound Lab TDS :
Practice measurements =
-rnFuFl
Ileference
Uolts
Zero
lJnit
Per
dB
Feference
Reference
Propagation
SFeed
fTTFf€nEE-T;i-f-l
feet
inEhes
heters
cent
iEetEr
fr-i-t-:c-I-d;Fl
Illustration 6-3
Calibration sub-menu
Calibrating the display
The amplitude readingyou get
in a display is always accurate
in a "dB relative" sense. If you
pEsEals
need to know the absolute
(],t]t]2?6
uoit
amplitude of a measurement
Ualue
O.OOOOa
113O,O
relative to 0 dB SPL, the
feet
numbers will be incorrect
unlessyou have first calibrated
the instrument. Sound lab
7DS software uses Reference
Units, VohsPerReference Unit,
Zero dB Reference Value,
Propagation
Speed, and
Distance Unitsto show data in terms of sound pressure
'$Tithout
level and distance.
this information, Sound.
Lab TDS would show data only in terms of volts and
seconds.
,} To calibrate the display, select Input...Calibration
and enter the values shown in Illustration 5-3. The
Reference Unitwill rdflect the units entered in the edit
field. i.e., pascals.
The VoltsPerReference UnitvaLue is different for each
microphone. Please see your microphone data sheet
for the correct value. The Zero dB Reference Value of
.00002 will calibrate the display for sound pressure
level.
The default forthe PropagationSpeedis 1130. Changing
the Distance Unit will update the propagation speed
accordingly.
,} Close the Calibration and Inputmentt; return to the
Mainmenu.
6-6
Sound Lab TDS :
Practice measurements
-
:::::
Setting Eheparameters for the Time
Flesponsetest
)
Go to Parameters menu and select Time Response
(ETC). Enter the following settings:
I-EEE!E|
ffi
Start
Frequencll
?OO.O
Stop Frequencu
Eenter
Frequenc!,
Freq|.renclt
Sj.OO.O
SFarr
Tine
Hunber
\-
l.O
De lart
e2.2[]4l
Sarrples
Illustration 6-4
Settingtrtararneters
for Time Response
test.
L
Hs
51?
HEnnirrsr
|TEAor,rl
fETT=CIEse-l
s
O . OOOO rts
Span
of
Hz
9€}OO,O Hz
Sureep Tine
Eece icre
Hz
I.OOOO.O Hz
lTTFatn.io
I
The centerfreQuencywill be automatically set by the
computerwhenyou selectthe startand stopfrequencies.
The time spanwill be automatically set by the number
of samples.
Note: The time spanof 22.2 mrlliseconds means that
the display following the Time Response test will read
from 0 millesceonds on the left edge to 22.2 milliseconds
on the right.
)
Close the Parameters menu.
6-7
SoundLabTDS :
Practice measurements =
:::::
Setting up the screen display
.} Open the Displaymenu, and select Time Response.
Select Magnitude under Display Type, and turn Auto
Scaling On if it is not akeady on. The Auto Scaling
feature insures that the screen fills with the data you
have selected.
,} Close the Display menu.
f-pi-sETar4 I
Heltser
Seiral
Ittasnr'tffil
Helrser
Spiral
l-EIT=CTEse
I
Illustration 6-5
test
Displayparametersfor tbe TimeResponse
6-8
Sound Lab TDS :
Fractice measurements
:
:_
Flunningthe Time Responsetest
) \(ze are now ready to perform the Time Response
measurement. Open the Measure menu and choose
Do Time Test. You will hear the sweep last for
approximately one second, and will see the ETC
display appe r on the screen.
You should get a display that looks similar to Illustration 6-6, depending on the similarity of your physical
room setup to ours and the levels. Press,F2to activate
t}:re data cursor.
Note: Excessivedrive is not necessaryto getvaliddata.
Set the volume to a comfortable level.
r
B
@
50
ao
E
s
J
I
m
lo
n
FILE: rtil.Ec
o
TrrE
(trilrilc)
Illustration 6-6
Tbedirect sound is tbe bighestpeak in this ETC.
6-9
SoundLabTDS:
Practice measurements =
:
\-'
Thepower of the data cursor
Sound Lab TDSforms a data cursor with horizontal and
vertical lines that extend across the data window. The
data cursor displays the value of the data at the
intersection of the lines in an information box in the
margin of the data window as shown in Illustration 67.
,} Turn the Cursor Oninthe DisOlaymenu.
Fi le
FILE:
TIiI.gC
Illustration 6-7
Tbedata culsor
6-10
DtsFlag
Paraheters
TIHE
(nillise@nds)
Start
Freq.
.
2OO.O
StoF
Freq.
=
IOOOO.O
Sound Lab TDS :
Practice measurements
=
:
Using the cursor to examine the data
Position the cursor exactly on the first large spike in the
display, as in Illustration 5-7. This point represents the
direct sound anival atthemicrophone. The information
boxes at the edge of each coordinate of the cursor give
important information for evaluation of the data.
Recall that your numbers may vary from this somewhat,
depending on the similarity of your testing setup to
ours. The vertical coordinate information box in our
test displays the dB of the amplitude of the direct sound
at67.3 dB. The horizontal coordinate information box
shows the distance this sound traveled 6.41 ft) and the
exact time in miiliseconds that it took to travel from the
loudspeaker to the microphone (4.79 milliseconds).
Note: This number (4.79 milliseconds) represents the
receiuedelaythatyou will enter in the parameters to set
up for the Frequenry Response measurement we will
do next.
By using the powerful cursor in Sound Lab TDS, you
can enter the receive delay directly into the Param
Frequency Responsemenu. To do this, place the cursor
on the peak of the direct sound and press F4. The
receive delay is now entered into the ParametersFrequency Responsemenu for the Frequenry response
test.
6-11
Sound Lab TDS :
Practice measurements
=
:
Finding reflections
Move the cursor over to the second peak to the right
of the direct sound. The information box tells us that
at 5.9l milliseconds
after the test signal,
energy at an amplitude of 50.4 dg arrived, 6.68 feet out.
If you stbtract 5.4I
feet (direct sound)
from 5.68 feet, you
see that there is a
reflecting surface
about 1.2 feet beyond the microphone. Looking at
our set up, the hard
surface a little over a
foot away would
likely be the table
top. Another way
to do this would be to use the relatiue cursor.
Place the cursor on the direct sound and choose
tlre Relatiue cursor button at the lower left hand
corner of the display by pressing R or clicking on
the button with the mouse. Then move the cursor
to the second peak and read the relative values in
the cursor data window.
Par*eters
Displag
I
FILE:
TINl.gC
Illustration 6-8
Finding reflections
6-1e
TItrE
I
Inpul
N
N
(Filliseeonds)
Start
Freq.
=
2OO.O
Stop
Freq.
=
IOOOO.O
Sound Lab TDS :
Practice measurements
:
:
We can confirm this by placing absorptive material on
the table top between the speaker and microphone;
press ,F5to repeat the test.
You should note a drop in
level of the second arrival.
Our test, as shown in
Illustration 6-9, showed the
new level to be 53.6 dB,
verifying that the peak was
caused by a reflection off
the table top.
Paraheters
Sttrt
Displag
Some other things we see
in this display are two small
peaks-one 56.3 dB high
at 5.78 feet, and a 53.3 dB
peak at 6.1.3feet.By looking
at ourphysicalsetup again,
there is nothing closer than
the table top. Therefore, it appears that they are caused
by reflections inside the speaker box.
Ft4,
=
2OO.O
Stop
Freq,
=
lOmO.O
Illustration 6-9
Measurement
perforrnedwitb sound
absorptiuematerial on
'We
)Press F2 a second time to turn the cursor off.
are
tbe reflection.
now ready to do a Frequency Response test.
6-13
Sound Lab TDS::
Practice measurements
=
::::
Doing a Frequency FlesponseTest (TDSJ
\-'
The Frequency response test shows how the output of
a device is related to a frequency range of interest for
a given amount of time. It is displayed on a graphwith
frequency displayed on the horizontal axis; magnitude
and phase on the vertical axis.
I
g
'+
\-/
-i-.zf
vii
--+-1.-!
i\
in
lf"-r-i"i-i
"^,iii
- vt liii ...\..
..
--r
/ i t i
ri"'l'l
-t'
i : t t : :
i....1t.j...1.i
i :li^/i
i--i 1if i-i
t i i i
: t :
-i"i'i
.-l\..- -.i..--.
:\'\
ili
ft{
h
ii.i' l
u.[
q
R
;E?:'i::.':"
f
i
3.a
E
Freq.
f
FE . :
l
3oo.o
Illustration 6-10
A typical, logaritbmic display offrequency/pbase data.
Use the Frequency Response (TDS) measurement to:
. find comb filters,
. exarnine the direct sound frequenry response,
. set crossover points in speaker systems,
o ver& manufacturer's claims
. equalize the sound system
. confirm polarity of microphones and speakers,
. and to measure impedance over a wide
frequency span.
F.14
\
Sound Lab TDS :
Practice measurements
:
-
u
As before, we will send a sweeping test signal into the
loudspeaker and examine the data that is returned to
the analyzer. lWhen we make frequency response
measurements with the TEF, we set the tracking filter
of the analyzer tolisten at the right time. SeeAppendix
A: Hou the TEFuorks. This "time" is the time offset, or
receive delay, we confirmed in the Time Response
(ETC) test just performed.
Eetting the parameters for the Frequency
FlesponseTest
,} Open the Parameters-Frequency Responsemenu
and look at the parameters. You will see that the
ReceiueDelay of 4.91,milliseconds (or whatever number
that you measured for your particular setup) is already
entered (when we pressed F4in the Time Response
display with the'bursor on the direct sound).
\-
The first decision we need to make is which
frequencies we're interested in examining, and we
will set the Star"t and Stop Frequencies accordingly.
Because of the small size of the room, we cannot set
the StafiFrequencytoolow because of the correlation
between wavelengths and the size of the space.
Recall that from the Time Response(ETC) display, we
saw that there was 1,.2feet of space before the first
reflection appeared, so we need to set the Distance
Resolution small enough to keep the reflection out
of the measurement.
6-15
Sound LabTDS :
Practice measurements =-
)
Enter the following settings in the Parameters-
Frequency Responsemenu.
fPrlgil-teF;l
Tihe
(ETC)
Fesponse
ffi
ChEnges
Start
Frequencg-
stop
Set by
sweep
time md
frequency
span
Entered
viaF4
Tihe
Sueep
Flate
-
lut
ion
Hz
Hz
I
Hzls
;
.113(] . O Hz
*-.
r.o rt
I
T iEe
tf--------------
Best
Frequenc|J
Delag
Banduidth
of
2OO.O
eoooo.o
1(}31e.5
lpi;t*;-l
Feceive
Data
2,8
Frequencg
Nunber
SaEEles
Bandwidth is autorotically
entered when you set the
distance resolution
Illustration 6-11
Settingparametels
for tbe Frequency
Responsetest.
Current
Frequen.r----J-Fttquencyspan
Sueep
Reso
Delete
O .885(}
Refolution
|
hs
Off
4.9lle
|
9.1
|
512
Hs
Hz
Frequency and dme resolution
change as the disance
resolution is changed
We want to measure within a sDacethat will exclude
the first reflection that occuried I.2 feet from the
'$7e
direct sound (verified in the ETC).
will enter 1
foot Distance resolution to attenuate everything
over 1 foot from our measurement. Notice how this
entry automatically changes the Frequency and
Time Resolutionto correlate, as these parameters are
interrelated. It also changes the bandwidth to 9.1
Hz. Setting the analyzer in this way will cause the
TEF to attenuate the reflection by 15 dB.
Note: You rarely have to set the SweepRate and
Banduidtb to do a frequency response. They are
automatically set for you when you select the Sweep
Time and Resolutions.
6-16
Sound Lab TDS :
Practice measurements
:
:
Setting the screen display
\7hen we measure frequency with the TEF analyzer,
both magnitude and phase data arc recorded during
the frequency sweep. Magnitude and phase are two
different ways of looking at the same data. The data
from a Frequenry Response measurement can be
displayed showing phase, magnitude, magnitude and
phase, the Nyquist, or Heyser Spiral,depending on the
settings you choose in the Display menu.
Open the Display menu, and make the following
settings:
EEdEil
TiFe
Festronse
(ETC)
@
DisFlsg
Tl,Fe
l{agn i tude
tlagn i tude
ToF
of
BottoH
Auto
Scale
ao
of
5t1 dB
Scale
Scaling
dB
[]n
Phas€
Top
of
EottoH
Auto
Scale
of
l.EO
-lgtl
ScElr
Scaling
Degs
Degs
On
l,l raFr
off
Hgqu ist
ToF
of
Botton
Auto
ScEle
9(1 dE
of
6.l
ScBle
Scaling
tiraFh
dB
DisFlatl
Fotation
frt;Fircnt-5T-EEET;]
Octave
dB
On
al Degs
L ineE r
Sfoothing
l-ETt=d-Io+
tr,o '/!
I l-ETt--iimi-o--]
Illustration 6-12
parameters
Display-Frequency Response
e'-17
Sound LabTDS :
Practice measurements
=
:::::
Running the test
,} Close the Displajt menu; open the Measure menu
and chooseDo Frequency Test. Again,you will hear the
sweep last for approximately two seconds. (It will
sound different this time because we are sweeping
over a different frequency band), and the display will
^ppear. It should look similar to Illustration 6-13,
depending on how similar your physical setup is to
ours. Press -E2 to read the data with the cursor and
determine the magnitude and phase signatures.
Magnitude
Phase
aoo
450
EO
9(l
60
30x
o
v
-30
+o
-9(I
-I2t1
- 15t]
-1AO
N 9R 8 F H 3 F T N t :
i
i
FrLEr
Trlr,..TDs
t
Ri El $
FFEQUEH.Y (Hz)
Dist.
Fes. =
Illustration 6-1J
Pbase/magnilude data display.
6-18
a.o
s
i
d
t
i
Freq.
s
i
o
l
\
Fes.
6
0
l
=
ll30,O
i
Sound Lab TDS :
Practice measurements
:
-
The vertical scaling on your display may be different
since we are using auto scaling. Recall we set up for
a Linearscale, which shows most of the detail in the
high end of the frequenry response where it occurs.
The log scale, however, compresses the high end,
obscuring this detail. With a linear scale, certain
problems, such as comb filtering, are more evident.
Adjusting Ehe receive delay to tune in to the
phase
The phase display is a most sensitive time measurement
(remember that phase is both time and frequency
dependent). \7hen measuring phase, the correct
ReceiueDelay is critical. \7e see that the phase display
slopes upward from left to right. This slope is the
signature of excessive receive delay.
Although in thaprevious test we had set the filter to
compensate for this delay with the ETC cursor, that
setting is only near the correct delay. Sound Lab TDS
allows you to use phase data for precise adjustment of
the receive delay-anaccurate way to determine if you
are aligned to the acoustic origin of a speaker.
A correct delay would be shown in the phase signature
as relatively flat in those areas where the magnitude
curve is relatively flat. A slope to the left or right would
indicate that the delay is imprecisely set. You could reopen the ParametetyFrequency
Responsemenu and
manually experiment with different receive delays to
get the desired results. Sound Lab 7DS offers a quick
wav to do this.
6-19
Sound Lab TDS::
Practicemeasurements
'.AO
15(l
12|]
9(]
611
3 0 $
(t
lrl
a
-"o $
-6.t
-9|]
-1211
-15('
-1AO
rl
lr:
$
t-
A
O
O
i
i
i
i
N
FnEQUENCY (Hz)
Dist.
Res. =
i
o
i
i
!t
,.
1.O
i
Ll
i
S
i
li
O
N
Cr
=
SEoottring
=
Freq.
Fes,
O
O.Oz
113O.O
Illustration 6-14
PressingF4function kqt enablesa dialog box tbat allow
precision incremental adjustm.entsto the receiuedelay.
6-20
=
::::
Sound Lab TDS :
Practice measurements
:
:
'When
you press F4 a data dialogbox will appear atthe
top of the display. The present setting for the Receiue
Delayis highlighted and can be edited to several places
from the keyboard. Use the Left and Right arrow keys
to move to the place value you want to edit. You simply
type in the delay that you want and then press Enterto
have your selection entered into the parameters. You
can then re-test and repeat the above procedure until
the desired display is accomplished.
For most pu{poses, adjustmentsby tenths or hundredths
of a millisecond are effective. The following series of
illustrations shows the progression of adiustments to
arrive at a precise receive delay.
Minor errors in the setting of the receive delay have
virtually no effect on magnitude measurements.
However, as w€ shall see, phase measurements are
extremely sensitive and the receive delay must be
properly set. For many devices, a two-way loudspeaker
for example, there is no one correct receive delay for
phase measurements. Unless the microphone isprecisely
the same distance from the acoustic origins of both
drivers, the signals from each of the rwo drivers will
arrive at the microphone at slightly different times,
requiring two different receive delay settings for each
of the drivers individuallv.
6-21
SoundLabTDS:
Practicemeasurements =
:
Illustration 6-15
Fre quen cy/p b ase response
data with tbe receiue
delay entered directly
from tbe ETC at 4.91
millisecond.s. The upuard
slope of tbe pbase data
indicates tbe delay is set
past the correct time.
rDs
Er
H--su..
oirpl-e
P.r:ict.rs
150
t20
90
si
-150
" : 5
E
i
f i d
E
E
i
E :
FFEO|HCY
FrLEr
Illustration 6-16
Frequency/phase response
data witb tbe receiuedelay
set 0.1 millisecondearlier.
Tbis information utas
enteredinto tbe
pararnetersfrom tbe
information box. The
downward slopeof tbe
pbasedata indicatestbat
tbe settinguas toofar
beforethe correcttime.
rDs
ftil'tDs
Dtit,
i l [
6
F
r
E
aes.
=
a.o
Freq.
Fe5,:
tr3o.o
@
30i
-90
-lao
. e R t e t 3 F t t E : ! * - t
Dt3t.
6-22
I ( f i V
<Hz)
aeg.
=
l.o
FFe.
H.3.
g E g E H
:
ll3O.O
Sound Lab TDS :
Practice measurements
:
-
\-
Illustration 6-17
Frequency/pbase response
data witb receiuedelay
set 0.05 millisecondlater
tban Illustration 6-14.
!o3
x..surr
EE
t50
.oD
o
o
o
o
o
o
o
o
o
o
o
o
o
o
o
o
o
o
o
o
o
o
o
o
o
o
o
o
o
o
o
o
o
o
o
o
o
o
o
o
o
o
o
N eR r e B 3 R r r g
! Eq I q q Eq q R
Illustration 6-18
A O .O1millisecond
adjustment to
measurementin
Illustration 6-15 creates
an euenJlatterphase
response.
rDr
IAE
k-u.r
f@
t2a
$
!
-
'o!
o,
-
*
j
-30 i
!
:!a
-so
n eF r e r 3 R r n E : E E ! q g E E E R
F1L!i
Ir-Ij-:I_oj.
mEdEw
6rsL
E..r
(&t
| ,L
FEq.
G.
1
aE..
6-23
Sound Lab TDS :
Practicemeasurements
Illustration 6-19
In tbis illustration, we
returned to tbe
Parameters-Frequency
responsemenu, and
cbanged tbe distance
resolution to actually
include tbe reflection tbat
was identffied at tbefirst
peak of tbe ETC test ue
performed. Setting tbe
Resolution-distance to 2
feet, and re-ntnning tbe test
caused this display, sbouing
tbe comb filtering produced
W the reflectiontspresence
in tbe rneasurenlent.
6-24
=
::::
E
:
i
:
i :
i
i
li ^i
:
:
:
:
:
:
i
i
l
i
iliVTi
l
'i"-
:
i
i
i
i
'i1r\
J
i..-..i....-i.-...i.^-.i---..i...--i,....i,.,..i.,...i.....i.
. ; : :/th; : : n i ;
o;t
:
"r\ii ii{\: Ml\i
v t i ^ l I t / ' !V ' l l '
:-1 tr:7 ll-_r__v
r'-i--r'1:-_I
t l Y i
I
i
i
i
: \
l
i
:
i
i
i
:
i
ll i
1 :
:......11...i.....11.........l.tr+/:i.: I-il
i
! ^ I
r\I-i-
i
: :
i
-i--:--i-i
:
: \ f
i-i--i
\
-i
{o!
Sound Lab TDS:Practice measurements
:
BT60 %ALcoNs :
Making o/oALcorus
and RT6o measurements
For the purposes of this exercise, we are assuming
the user to be a contractor or designer with a
fundamental understanding of navigation in Sound
Lab TDS software. The task is to calculate %oALcoNs
and RT6o data out of a valid ETC measurement in
order to
.meet a bid specification
overify the reverberation time of the room
.determine if the decay is appropriate for the
functions that are going to occur in this environment.
Sound lab TDS performs two common acoustic
calculations useful to the designer, consultant, and
RT6o and %oALcoNs. Both are
contractor-the
calculated from data collected in a Time Response
(ETC) measurement. It follows, then, that to yield
valid RT6oand0/oALcowsnumbers, you need to have
appropriate ETC data.
Terms to know
To have a working knowledge of the exercise to
follow, here are terms to know:
o/oAlcox#The
measured percentage of Articulation
'lfith
TEF methods,
Loss of Consonants by a listener.
afticulation scoresare measured aspercent of articulation
loss of consonants in speech. A %oAlcousof 0 indicates
perfect clarity and intelligibility with no loss of consonant
understanding, while 1,00/oand beyond is growing
toward bad intelligibility , and|5j/otypically is considered
the maximum allowable.
6_zb
Sound Lab TDS :
Practice measurements
:
HT6O %ALcor'ts :
Early Decay Tim#The
time for a rev erberant sound
field to decay 10 dB below the level of the direct sound.
Short decaytimes cause music and speech to sound dry
or muffled. Long decay times make speechunintelligible
and difficult to understand. It is the figure that most
closely approximates how the decay time "sounds" to
the ear.
RT6o (Reverberation time)-The
time in seconds for
the reverberant sound field to decay 50 dB after the
sound source is shut off. It is calculated by measuring
the rate of decay over as much decay as possible in the
curve (ideally, the first 25 dB to 30 dB of decay) and
extrapolating what the RT6o would be if the decay
continued at that nte.
An appropriate ETC
RT6oand %oALcoNs
calculations beginwith an appropriate
ETC measurement-either an individual measurement
or one taken as a paft of an STI data set.
There are three fundamental requirements to have an
ETC that is valid to calculate RT6o and o/oAlcoNs.
. The room must be large enough to have a
statistical reverberant field.
. The ETC display on the TEF analyzer must be of
sufficient duration to see the reverberant field.
. The sweep must be slow enough to excite the
room and allow the reverberant sound to return
to the TEF analyzer. To be certain you sweep
slowly enough, you should set the sweep time to
be 3-4 times longer than the time you want
displayed on the screen.
6-26
Sound Lab TDS :
Practicemeasurements
:
BT6O %ALcoNs -
ETC display example
To see an example of an appropriate ETC from which
to calculate RT6oand %oAlcorls,open the datafile called
SNCTONLY. ETC from the data which accompanied
your Sound Lab TDS software. This display is a Time
Response (ETC) showing the first second of decay in a
room with the sweep centered at 2000H2.
ID3
EGI
FrE:
SiCTOf,V,ETC
This ETC display is representative of a reasonablywellbehaved 200 seat room. A general look at the display
without the cursors indicates coherent, direct sound,
approximately 8 dB in level above the nearest reflection. V7esee a reverberation time that is less than one
second, with no significant arrivals later
intime. Justbylooking at the time responserawdata, the
foom appears to be
very good. The
o/oAlcoxscalculation
we will do takes all
the above considerations, and puts
them into one number.
rIE
(nillise@nds)
=
Fr.q,
St.rt
l?ez.O
StoF
Frq.
ata.o
Illustration 6-20 Time Response(EfC)
6-27
Sound Lab TDS :
Practicemeasurements
:
BT6O %ALcoNs -
Parameters
If you note the parameters used to set up for this
display, you will see that the start frequenry of this test
is 1782 and the stop frequency is 22'1"8.This gives a
center frequency of 2000. The 2 kHz octave band
contains approximately 7/3 of all intelligibility in
speech. Since we are examining speech, these settings
will center the information around 2 kHz, a typical
starting point for the first sweep you would do.
The time span of approximately one second was
estimatedby "testing" the roomwith a simple handclap,
and listening to how long it took the sound to decay.
Power of the cursor
Sound Lab TDShas powerful cursors you can activate
that automatically analyzeand report RT6oand %oALcoNs
data. Make the cursor active by pressing Sbift F2.
You will now see the following new information on the
screen.
The smooth line above the original data is an
integration of the time response data, which
smooths the decay curve. (Schroeder curve)
Three cursors, L, D, and R across the bottom of
the display, each with accompanyng information. The I and R cursors represent the left
and right points of the reverberant field that will
be used for determining the early decay time.
6-28
Sound Lab TDS : ::
Practice measure me nts
HT6O %ALmNs :
The third cursor, labeled D, sets the division
befween early (direct sound) and late (reverberant field) energy.l Sound Lab TDS software
uses this information to compute the Direct to
Reverberant Energy ttatio.
Cursor buttons at the bottom of the display.
Slope displays the line which best fits the data
befween the left and right cursors. (Linear
regression line.)
TDS Delay automatically enters the value at the
point of the active cursor into the rhe Receiue
Delay option of the Parameters for the Frequency Response test.
3D Start Delaybutton attomatically enters the
value at the point of the active cursor into the
StartReceiueDelay option of the Parameters for
the 3D test.
3D End Delaybutton automatically enters the
value at the point of the active cursor into the
End Receiue Delay option of the Parameters for
the 3D test.
6-29
Sound Lab TDS :
Practice measurements
RT6O %ALmrus :
Addition aI information
You will also see additional information in boxes across
the top of the displaywhich represent the software's best
estimate for placing the cursors.
. RT60 : 0.62 Sec Geverberation
timeor earlydecaytime)
. EDir/ERev : -2.5 dB (earlydirect-teearlyreverberant
soundratio)
o ALcoNs = 3.81o/o(the %oALcoNs),
. dB down : 10.5 (the differencein level on the
integration line between the left and right cursors.)
TD$
Fire
neGure
PEr$.t.rs
DisFllg
| | l r c | E | M | : z M
|ae;Hd:t
@
$
4
o
!
-30
o
U
3
F
a
E
'"
I
o
-to
These initial cursor
positions and values in the information boxes representthe computer's
best estimate regarding placement.
Inspect the display
carefully and make
adiustments as necessary.
-8
n
t
o
lsb;l
l-55-5E]e6-l
lo=bil;t;l
F'LE: s*croNlv'Et"
o
o
n
ffiryl
fs
tt1t.t:.".t:'":'T'?"r."
s
n
N
u
stop Freq.
=
zzra,o
Illustration 6-21
Data cursors analyze and reltort RT60 and 0/oAlcous data.
6-30
Sound Lab TDS :
Practice measurements
:
HT6O %ALcoNs -
ClassicalHT6o
You can manipulate the cursors on the analyzer to
accomplish a more classical RT6ovalue by manually
placing the cursors on the display such that the left and
right cursors span the longest and smoothest linear
range possible. This includes as much dynamic range
as possible in the calculation.
To move the cursors manually, you must select them
and move them with the mouse or arrow keys
) Place the Rcursor to the right end of the linear range
^t 7 20.52 milliseconds.
) Place the Zcursor to the starting point of the linear
portion of the decay on the ETC, at 192.75 milliseconds,
)The reverberation time shown in the RT6oinformation
box now reads 0.92 seconds.2 See illustration on next
page.
Note: At any point when the RT6ocursors are active,
you can see the acttal linear regression line by
choosing the Slopebuttonor pressing the Quickkelt O.
You can see an illustration of this on the next page.
6-31
Sound Lab TDS :
Practice measurements
:
BT60 %ALmNs -
TDS
Fi
le
PEraneterg
He€sure
lEre {:eat;l
_---7d---
le-vEh,
#.sel
InFut
Displag
ItA
d;tl
|TB-Mi3
60
-ao
ffi
50
40
30
u
z
=
20
,l
lo
o
-10
-20
-30
L | 192
i
-?5
=4.37
h
N
lsro@I l-ds-TEGs;l l=dst;-;Gtl
FILEI
SilCTOHLY.trC
l5-6e-hG;1
TIilE
(ililliseconds)
start
FrE.
=
L?az,o
stoF
Freq.
=
z?la.o
Illustration 6-22
Classical RT6o numbers calculated by the TEF analyzer.
6-3e
Sound Lab TDS :
Practicemeasuremenrs :
BT60 o/oALnNs .:
\-
Early Decay Time
The Early Decay Time is a number that corresponds to
perceived decay time.
) To find the EarlyDecay Time, put the left cursor on
the direct sound at 50.48.
) Move the right cursor until the dB down information
box shows as close as possible to 10 dB (9.8). The RT6o
information box at the top of the screen will now
indicate the Early Decay Time (RT6o) of 0.58 seconds.
rDS
File
tr€asure
P:rseter3
DtsFl4
l|.@l
Fre
-----f]:: #EJ
50
$
+o
s
?o
to
o
-lo
-zo
n
o
N
O
o
l=N;ril;hel
FILEi
SNCTSNLY.trC
N
h
fs
rIHE
n
u
ffi;A
(iillisecon&)
Start
Freq.
=
,?&.O
Stop
Freq.
:
?21e.O
Illustration 6-23
Usingtbe cursor tofind the early decay time.
6-33
Sound Lab TDS :
Praciice measurements
:
BT6O %ALcor,ts
Finding the o/oALcaus
) To find the %oALcoNs,
place the left and right cursors
as for the Early Decay Time. Look at the first 20
milliseconds after the direct sound for the presence of
any significant reflections. Since such reflections will
be perceived as direct sound, you must include them
in the direct sound portion of the calculation. To do
this
)Place the Dcursor on56.54, one point to the right of
the reflections
)The %oALcoNs
in the %oALcoNs
information box reads
3.37.
If no strong reflections are present,
) Place the Dcursor one point to the right of the direct
sound and read the %ofcoNs.
TDS
Fi
le
ileasure
Parahet€rs
Input
Displas
60
-lo
5(]
40
! 3 0
u
2
= o
F
E t o
o
-10
-20
h
F
o
lsi+;l
lips
FILE:
pd;;l
Ts
l
shiler"il
SNCTOilLY.ETC
Ts
rIXE
6.34
h
S
€
n
Effi;tl
(Filliseconds)
StErt
Illustration 6-24
Finding tbe o/oAlcor'rs
o
O
FrEq.
=
l"Sa.O
Stop
Freq.
=
2244,tr
Sound Lab TDS-:
Basics of Sound :
-
AppendixA: Basicsof sound
Waves
To produce sound, something vibrates agairrst air
moleculeswhich pickup thevibration and pass it along
'When
these vibrations strike our ears,
as sound waves.
we hear sound.
Let's examine how sound waves are created. Suppose
a speaker cone in a guitar amp is vibrating - moving
'S7hen
the cone moves out, it pushes
rapidly in and out.
the adjacent air molecules closer together. This forms
FAREFACTION
o
o
a
a
a
a
a
a
a
a
a
a
a
a
a
a
a
a
o
O
a
a
a
a
a
a
a
a
a
a
a
a
a
a
a
a
a
a
a
a
a
a
a
a
a
a
a
a
a
a
a
a
a
a
a
a
o
o
a
a
a
a
a
+
a
a
a
a
a
a
a
a
a
a
o
a
a
a
o
a
a
a
a
a
a
GrH-------------),1
RAREFACTIoN
k-WAVELEN
COMPRESSION
+
aaaaaaaaaaaa
aaaaaaaaaaaa
aaaaaaaaaaf.
aaaaaaaaaaaa
aaaaaaaaaaaa
aaaaaaaaaa aa
aaaaaaaaaaaa
aaaaaaaaaaaa
aaaoooaaaaaa
aaaaaoaaaaaa
aaaaaaaaatoa
aaaaaaaaataa
aaaooaaaaaaa
aaaaaaaaaaaa
aaaaaaaaaaaa
aaaaaaoaaaaa
oaaaaaaaaaaa
aaaaaaaaaaaa
aaaaaaaaaaaa
aaaaaaaaaaaa
aaaaaaaaaaaa
a
a
a
a
a
a
o
o
a
a
a
a
o
a
a
a
a
a
a
a
a
a a
a a
o a
a a
a a
a a
o a
a a
a a
a a
a a
a a
a a
a a
a a
a a
a a
a a
a a
a a
a a
<-D
*a
a
a
a
a
a
o
a
a
a
a
a
a
a
a
a
a
o
a
a
a
a
a
a
a
a
a
a
a
a
a
a
a
a
a
a
a
a
a
a
a
a
COMPIESSION
r
aaaaaaaoaaaa
aaaaaaaaaaaa
aaaaaaaaaaaa
aaaaaaaaaaaa
aaoaoaaaaaaa
aaaoaaaaaaaa
aaaaaaaaaaaa
aaaaaaaaaaaa
aaaaaaaaaaaa
aaaaaaaaaaaa
aaaaaaaaaaaa
aaaaaaaaaaaa
aaaaaaaaaaaa
aaaoaaaaaaao
aaaaaaaaaoaa
aaaaaaaaaaaa
aaaaaaaaaaaa
oaaaaaaaaaaa
aaaaaaaaaaaa
aaaaaaaaaaaa
aaaaoaaaaaao
a
a
a
a
a
a
a
a
a
a
a
a
a
a
a
a
a
a
a
a
o
AIF MOLECI,LEMOTION
WAVEMOTION
-
Illustration A-1 A sound waueis made of bigb-pressure
compressionsand low-pressurerarefactions.
L-
'When
the cone moves in, it pulls the
a compression.
molecules farther ap rt, forming a rarefaction. As
illustrated in Illustration A-1, the compressions have a
A-1
Sound Lab TDS :
Basics of Sound
=
higher pressure than ambient atmospheric pressure;
the rarefactions have a lower atmospheric pressure
than normal.
These disturbances are passed from one molecule to
the next in a spring-like motion to pass the wave along.
The sound waves travel outward from the sound
source at about 1130 feet per second.
At some receiving point, such asan ear oramicrophone,
the air pressure varies up and down as the disturbance
passes by. Illustration A-2 is a graph showing how
sound pressure varies with time. It fluctuates up and
down like a wave; hence the term "soundwave," The
high point of the graph is called a peak; the low point
is called a trough. The horizontal center line of the
graph is normal atmospheric pressure.
PEAK
tiJ
cr
f
U)
U)
uJ
tr
n
ABOVENORMAL
NORMAL
TIME
IT
BELOWNORMAL
+
TROUGH
Illustration A-2
Soundpressu.reus.time of one cycleof a sound rDaue.
A-2
Sound Lab TDS :
Basics of Sound
=
Characteristics of sound waves
Illustration A-3 shows three successive cycles of a
wave. One complete vibration from high to low
pressure and back to the starting point is called one
cycle. The time between the peak of one wave and the
peak of the nefi is called the period of the wave. One
cycle is one period in time long.
eenroo
rruruef
l*orr
l
ONE CYCLE
ONE CYCLE
ONE CYCLE
Illustration A-3 Tbreecyclesof a uaue.
Amplitude
At any point on the wave, the vertical distance of the
wave from the center line is called the amplitude of the
wave. The amplitude of the peak is called the peak
amplitude. The more intense the vibration, the greater
the pressure variations, and the greater the peak
amplitude. The greater the amplitude, the louder the
sound.
A-3
Sound Lab TDS::
Basics of Sound
=
Frequency
The sound source (in this case, the loudspeaker)
vibrates back and forth many times a second. The
number of cycles completed in one second is called the
frequency. The faster the speaker vibrates, the higher
the frequency of the sound. Frequenry is measured in
hertz (abbreviatedHz., One Hertz equals one cycle per
second.
The higher the frequency, the higher the perceived
pitch of the sound. Low-frequency tones (say, 100 Hz)
are low pitched; high-frequency tones (say, 10,000Hz)
are high- pitched. Doubling the frequency raises the
pitch one octave.
Wavelength
'When
a sound wave travels through the air, the
physical distance from one peak (compression) to the
next is called a wavelength. (This was shown in
IllustrationA-J.) Lowfrequencies have long wavelengths
(several feet); high frequencies have shorlwavelengths
(a few inches or less).
Phase and phase shift
The phase of any point on the wave is its degree of
progression in the cycle - the beginning, the peak, the
trough, or anywhere in between. Phaseis measured in
degrees, with 350 degrees being one complete rycle.
The beginning of a wave is 0 degrees; the first peak is
90 degrees (1,/4 cycle), and the end is 360 degrees,
A4
Sound Lab TDS :
Basics of Sound ::::::
::
Illustration A-4 shows the phase of various points on
the wave.
AMPLITUDE
oo tlrolto^3l.=tuo"
Illustration A-4
Thepbase of uarious points on a. uAae.
L
If there are two identicalwaves, but one is delayedwith
respect to the other, there is a phase shift between the
tq/o waves. Ttl€ more delay, the more phase shift.
Phase shift is measured in degrees. Illustration A-5
shows two waves separated by 90 degrees (L/4 qrcle)
of phase shift.
le+l
, 900,
AMPLITUDE
i
0 0 9 0 ' 1 8 00 2 7 0" 3 6 0"
PHASEANGLEOF SOLIDWAVE
Illustration A-5
Tuo utaues90 degreesout-of-phase. The dasbed
waue lags tbe solid utaueby 90 degrees.
A-5
Sound Lab TDS::
Basics of Sound
=
'When
there is a 1,80-degreephase shift beween two
identicalwaves, the peak of onewave coincideswith the
trough of another. If thesetwo waves are combined, they
cancel each other out. This phenomenon is called phase
cancellation.
Harmonic content
The type of wave shown in Illustrations A-2 and A-5
are called sine waves. A sine wave is a pure tone of
a single frequency, such as produced by a tone
generator. However, most musical tones have a
complexwaveform, which hasmore than one frequenry
component. Yet no matter how complex, all sounds
are combinations of sine waves of different frequencies
and amplitudes.
FUNDAMENTAL
Illustration A-6 shows
sine waves of three
frequencies combined to
form a complex wave,
The amplitudes of the
variouswaves are added
algebr aically at the same
point in time to obtain
the final complex
waveform.
"o"r,-lr"
*rar,-r,"n
WAVEFORM
(ALGEBRAIC) SUM OF
THE THPEE WAVES
ABOVE
Illustration 4-6 Addition offundamental and
barrnonics toform a conxplex waueform.
A-6
Sound Lab TDS :
Basics of Sound
\-
=
The lowest frequency in a complex wave is called the
fundamental frequency. It determines the pitch of the
sound. Higher frequencies in the complex wave are
called overtones or upper partials. If the overtones are
integral multiples of the fundamental frequency, they
are called harmonics. For example, if the fundamental
frequency is 200 Hz, the second harmonic is 400 Hz (2
x 200); the third harmonic is 600 Hz (3 x 200), and so
on.
The number of harmonics and their amplitudes relative
to the fundamental partly determine the tone quality or
timbre of a sound. They identiSr the sound as being
'$fhite
from a trumpet, piano, org n, voice, etc.
and
pink noise contains all audible frequencies andhasan
irregular, non-periodic waveform.
Behavior of Coundin rooms
So far we've covered the characteristicsof sound waves
traveling in open space. But since most music is heard
in rooms. we need to understand the acoustic
phenomena created by the room interior surfaces.
Echoes
A sound source vibrates against air molecules, creating
soundwaves that travel outward in all directions. Some
of the sound travels directly to the listener (or to a
microphone) and is called direct sound. The rest
strikes the walls, ceiling, floor, and furnishings of the
recording room. At those surfaces, some of the sound
energy is absorbed, some is transmitted through the
surface, and the rest is reflected back into the room.
A-7
Sound Lab TDS::
Basics of Sound
=
Sincesoundwavestravelaboutlfootpermillisecond,the
sound reflections arrive after the direct sound reachesthe
listener. The delayed arcival of a reflected sound causes
a repetition of the original sound called an echo, asshown
in Illustration A-7 ). In large roolns we sometimes hear
discrete single echoes; in small roolns we often hear a
short, rapid successionof echoes,evenly spaced in time,
called flutter echoes.
U
--,'/
'
@L
Directsound
Echo
A
/
Room surlace
A
B
A-8
Illustration A-7 Echo (A) Ecboform.ation.
(B) Amplitude us.time of direct sound and echo.
\--'
Sound Lab TDS :
Basics ofSaund
=
Parallel walls or diagonally opposite corners create
flutter echoes by reflecting sound back and forth
between them many times. You can detect flutter
echoes by clapping your hands next to one wall and
listening for a fluttering sound. Since echoes can
reduce the clarity of sound, they should be eliminated
by adding patches of absorbent m teri^l or diffusors to
one or both of the offending walls. Putting the material
in patches, rather than all together, promotes an even
distribution (diffusion) of sound in the room.
Fleverberation
Sound reflects not just once but manytimes fromall the
surfaces in the room. These sonic reflections sustain
the sound of the instrument in the room for a short time
even after the sound source is stopped. This
phenomenon is called reverberation - the persistence
of sound in a room after the original sound has ceased.
For example, reverberation is the sound you hear just
after you shout in an empty gymnasium. The sound of
your shout persists in the room and gradtally dies away
(decays).
In physical terms, reverberation is a series of multiple
echoes, decreasing in intensity with time, so closely
spaced in time as to merge into a single continuous
sound, eventually being completely absorbed by the
inner surfaces of a room. Echoes increase in number
as they decay. Illustration A-B shows reverberation as
a decay-in-time of room reflections.
Note that reverberation is a continuous fade-out of
sound, while an echo is a discrete repetition of a sound.
A-9
Sound Lab TDS :
Basics of Sound
=
"X;
/ \ ;
A
@
tur.
oro*rm ffi*
B
Illustration A-8 Reuerberation. (A) Reuerberation
fonnation. (B) Amplitude us.time of direct sound,
early reflections, and reuerberation
A-'to
Sound Lab TDS :
Basics of Sound
=
Fleverberation time
The time it takes for sound to decay to 60 dB below the
original steady-statesound level is called reverberation
time (abbreviated T or RT6o).
Floom modes
If you play an amplified bass guitar through a speaker
in a room, and do a bass run up the scale, you will hear
some notes at which the room resonates, reinforcing
the sound. These resonant frequencies, most noticeable
below 300 Hz, are called room modes or normal
modes. Resonancepeaks of up to 10 dB can occur.
They give a tubby or boomy coloration to musical
instruments and should be minimized. Room modes
occur in physical patterns called standing waves.
Standingwaves are uneven sound-level distributions in
a room causedby soundwaves continuously reinforcing
themselves as they reflect between opposing surfaces.
Opposite walls (or the ceiling and floor) can support
standingwaves between.them, as shown in Illustration
A-9 . \Teaker modes can occur between other surfaces.
A-1'l
Sound Lab TDS :
Basics of Saund =
;:
A.
1m
150
2(x,
ffiouENcY (lLl
Illustration A-9 Standing-uauepb enonlen*.
A. Pressuredistribution betueen tuo opposing
walls,forfirst tbree room modes.
B. Example offrequency responseof a room uith
standing waues.
A-lt
Sound Lab TDS :
Basics of Sound
=
The frequencies at which the room resonates depend
on the dimensions of the room- its length, width, and
height. The formula for the most basic room-mode
resonance frequencies is
f=(Nx55)/D
where f = resonance frequency, inHz
N = 1,2,1...
D : room dimension, in feet.
For example, a room 12 feet long will have room modes
at 47 Hz,94Hz, and so on. Those frequencies or notes
will be over-emphasized in the music unless there is
sufficient bass trapping in the room to dissipate them.
Other frequencies will be reinforced by other room
dimensions. If the height, width, and length of the
room are identical, the same modal frequencies will be
reinforced in all three dimensions, greatly emphasizing
certain low frequencies. On the other hand, if the
dimensions are not multiples of each other, the modes
will be different for each dimension. Then, each room
mode will be reinforced in only one dimension and
there will be a more even distribution of resonance
frequencies.
A-13
SoundLab TDS :
How TEFworks
=
AppendixB: How TEFmeasurements work
The TEF analyzer generates a sine-wave frequency
sweep which is played through a sound system and
returned to the TEF. The change in frequency of the
sweep is linearwith time. The microphone signal is fed
through a filter that tracks the sweep. The tracking filter
is in sync with the generated frequenry sweep; however,
it is offset in time to compensate for the propagation
delay of sound traveling from speaker to microphone.
By varying the bandwidth and time offset of the
tracking filter, you can study the spectrum of the direct
sound by itself, certain reflections, or both.
10 kHzisec- ;-)
F-[r
ll|
f
T=0
f
T=1
millisecond
n
lIl lIl
t
T=2
Illustration B-1
Afilter sweqing ouerfrequency of interest.
B-1
Sound Lab TDS :
How TEF works
=
::
For example: A 20 Hz-wide filter sweeps along at
10,000 Hz/second. (For clarity, the filter is drawn with
a rectangular shape. The edges of the rectangular filter
correspond to the 3 dB down points of arealfilter.) At
the left edge, the frequency of interest (f) is just entering
the filter's bandwidth. At the center of the Illustration
B-1, the filter has swept higher in frequency and is
tuned to the frequency of interest. At the right, the
frequency of interest is leaving the filter-the filter
having swept still higher. Quite simply, the TEF puts
an exactly measured signal into a system, it knows
exactly when to listen for it to emerge, and knows
exactly how to figure out what these results mean.
Fleflections can be kept out of
measurement
Suppose a 1000 Hz tone is swept to the microphone
through the air. At that instant, the tracking-filter
center frequency is set to 1000 Hz. Now suppose that
the loudspeaker's sound reflects off a wall and enters
the microphone after a certain delay. By the time the
reflection enters the microphone, the tracking filter will
have swept to a higher frequency than the reflection,
as shown in IllustrationB-2. If the filter bandwidth is
sufficiently naffow, the reflection is rejected or filtered
out. No reflection signals are received by the TDS
analyzer. In otherwords, an anechoic measurement is
made in an ordinary room.
B-2
\v
Sound Lab TDS :
How TEF works
=
Reflected
sound
800 Hz
15'
speakerKL-)
./
Directpath
1000Hz
^
Microphone
Direct
sound
only
Tracking
filter
Illustration B- 2
A reflection isfiltered out of a TEF measurernent.
Flelationship betrarcenTime,/Frequency
Any method usedto measure frequencyrequires a time
interval in which to measure it. For example, if we
want to describe the motion of a pendulum, we might
say that the pendulum swings from right to left and
back again in I/2 second. That is, it has a period (of
time) of 1/2 second This is a description in the time
domain. Alternatively, we might say that the pendulum
moves from right to left and back again with a
frequency of 2 Hz (2 cycles per second). This is a
description in the frequency domain. Both are correct,
and each is required to measure the other. A time
interval is required to measure frequency regardless of
the measuring method used.
B-3
Sound Lab TDS :
HowTEFworks
=
Fourier transform
Frequenry information is mapped into time information
by means of a calculation called the Fourier transform.
The Fourier transform relates time and frequency for
TEF's sweeping oscillator.
The unit of frequency is defined as the reciprocal of the
unit of time; then mathematically, the unit of time is the
reciprocal of the unit of frequenry. The mathematical
descriptions of this relationship befween time and
frequency are:
Time = 1/Frequency (T = 1/F)
where T is the period in seconds and F is the
frequency in hertz, and
Frequency = 7/Time (F=1/T)
where F is the frequency inhertz and T is the
period in seconds.
The product of time (period) versus frequency will
always equal one;
Time x Frequency : 1 (T x F =1)
For example, if we have a 20 Hz sine wave, we can
calculate its period as being 1./20or.05 second. If we
measure the period of a ryclic process to be .1 second,
then its frequenry is 1/0.1 or 1.0Hz This reciprocal
relationship is always presentand needstobe considered
when setting parameters.
g4
\
Sound Lab TDS :
How TEF works
=
Measurement resolution
'$7hen
any quantity is measured, it is always limited in
its resolution, or how much detail we can see, or
resolve. Resolution is the degree of clarity with which
we can observe or measure something. For example,
you can look at a butterfly with the unaided eye and
observe its coloration and veining, and you can see that
it has intricate markings.
If you examine closerwith amagnffyrne glass,you will
be able to see more fine detail of its markings because
you have increased the resolution of yourview. If you
place a butterflywing under a microscope, you would
possibly be able to see or resolve its cellular structure
becauseyou have increased the resolution dramatically.
Note, that as you increase resolution looking at the
wing, you know less about the total picture, i.e. how
big it is, what color the body is, etc.
If we make a time-domain measurement with a
resolution of one millisecond, then we will be unable
to see any fine details that occur faster than one
'$7e
millisecond.
will have a frequency resolution of
1,/,001 or 1000H2. The details will not disappear
completely, but they will be blurred or smeared, in
much the same way as viewing the butterfly unaided.
In order to measure 10 Hz, we require 1/1,0 or .1.0
seconds or longer to measure one full period. In order
to measure one second, we need a frequency of 1,Hz
or greater.
The same is true in the frequency domain. If we make
a frequency domain measurement with a resolution of
1.kHz, then we will be unable to see any fine details that
B-5
SoundLabTDS:
How TEF works =
::
occur less than 1, kHz ap rt. The effect of this on a
frequency response curve is to smooth it out and
minimize the peaks and vallevs.
A
B
Illustration B-J
Tutodffirent resolutions of afrequency response.
IllustrationB-A is a frequencyresponsemadewith 500
Hz resolution. The samefrequency response,made
with 1 kHz resolution, is shown in Illustration B-3b.
Notice the smoothingeffectwhen measuringat lower
B-6
Sound Lab TDS : -::
How TEF works
:
frequency resolution (lkHz). The fine detail is still
there in reality-we just can't see it.
Trade-off beErnreen
time and frequency
Becausetime and frequency resolutions are reciprocals
of each other, we can trade away resolution in one
domain for resolution in the other. However, there is
always an inverse trade-off when converting from one
domain to another; this means that as the resolution in
one domain goes to infinity, the resolution in the other
domain must approach zero. The product of resolution
in time and resolution in frequency will at best equal
'$rith
one.
TEF it is always one.
For example, if we wish to measure a loudspeakerwith
a resolution in frequency of 20H2, then our resolution
in time is t/20 or .05 seconds. At the speed of sound,
.05 seconds is eqtiivalen tto 55.5feet. Reflections from
objects within that distance will be included in our
measurement yielding false results. If we now reduce
our resolution,in frequenry to 500 Hz, our resolution
in time increases to t/500 or .002 s€conds. This
corresponds to a distance resolution of 2.25 feet and
true anechoic measurements are easily performed in
smaller spaces.
L
Note that the limits on frequency resolution are not
unique to TDS, as TDS measurements perform at the
theoretical limits of time-frequency resolution. The
limits are a direct consequence of frequency resolution
being the inverse of time resolution and applies to all
measufement systems.
+7
Sound Lab TDS :
HowTEFwarks
-
By deriving one domain from the other we do not learn
'We
anything new about the thing we are measuring.
have merely converted our description of it from one
domain to the other. The description in either of the
domains is sufficient to describe the other. The factors
that should determine which domain to measure are
those of convenience. If, for example, one domain
permits measurements in seconds rather than minutes,
then the domain providing the faster measurement
should be used. Because the TEF Analyzer measures
in the frequency domain, it is able to achieve significant
increases in signal-to-noise ratio over equivalent time
domain techniques.
The accuracy and acuity of the measurement depends
entirely on the sensitivity of the measuring instrument
and the resolution of its display. In general, when
measuring a system, rnake initial measurements in
wide bands of frequency or wide slices of time, then
narrow these bands to increase the resolution of the
measurements.
Interrelated para meters
Sweeprate
Slow sweeps can be used to provide high resolution
TDS measurements in noisy environments of
environments where the sweep level must be below
the perceptible level of the noise.
A zero sweep rate is mathematically equivalent to a
single fixed frequency. At slow rates, any amount of
frequency resolution is available at the expense of time
information. Conversely, high sweep rates are used to
B-8
Sound Lab TDS-: ::_
How TEF works
increase time resolution at the expense of frequency
resolution.
Frequency span
The second parameter to set is the frequency range of
the sweep. This range should roughly correspond to
the range over which useful operation of the system is
to be expected. Stimulus should not be applied for
long durations which might damage the system.
Sweeping through zero Hertz is generally desirable
when doing ascending TDS sweeps if you want
improved resolution at low frequencies.
Most
transducers will not be damaged by this practice if you
avoid very slow sweep rates at high power levels.
Receive(signalJ delay
'$7hen
making measurements involving a signal delay,
the third setting is the receive (signal) delay. Normally
you set the receive delay equal to the travel time of
sound from loudspeaker to microphone.
T =D/C
where T = receive delay in seconds,
D = distance between speaker and microphone in
feet and
C : the speed of sound, 1130 feet per second.
For energy vs. time curves or ETCs, the usual practice
is to use a zero receive delay between the test and
analyzer oscillations. This is not necessary, if it is
&9
SoundLabTDS:
How TEF works :
known that no signal arrives at the analyzer before a
certain delay. If you program this value of delay, the
ETC display will start at this value of delay instead of
zefo.
Bandwidth/Sweep rate
'$7hen
making measurements with Sound Lab, you set
the desired time, distance and frequency resolutions in
the Parameters menu. The TEF will then set the
combination of sweep rate and bandwidth of the
tracking filter accordingly. \fhile sweep rate and
bandwidth can be set manually, it is easiest to set a
frequency resolution and a sweep time and let the
computer automatically set the sweep rate and
bandwidth for you.
There are an unlimited number of combinations of
sweep rate andbandwidth that will result in a given set
of resolutions. The choice should be governed by the
environment noise levels because, as the bandwidth is
narowed, the probability of interference is reduced.
Slower sweep rates mean lessbandwidth in the tracking
filter, thus less noise getting into the measurement.
\7ith a slower sweep rz:te, gteater total energy is put
into the test, creating improved signal to noise ratio.
As bandwidth is reducedandresolution remains fixed,
the time to take the measurement is increased because
Sound Lab will change the sweep time to keep the
parameters valid. If the testing environment is relatively
free of noise, fast sweeps can be used. If noise is a
oroblem. slow sweeos should be used.
&10
Sound Lab TDS :
How TEF works
=
This capability is one of TEF's greatest advantages over
'When
other systems.
there is little noise present, you
can sweep very rapidly and measure from 0 Hz to 20
kHz in less than one second. If there is a high level of
ambient noise, you can slow the sweep, thereby
narrowing the bandwidth of the filter in order to
maintain resolution and reiect the noise. The noise is
rejected by the narrowness of the filter. Very little of
the noise signal is going to be present in a 2 Hz wide
filter
Measurement repeatability should be used as a criteria
to select the highest reasonable sweep rate. If the noise
or sweep rate is too high, the measurementwill change
from one sweep to the next.
"time
The wider the bandwidth setting, the greater the
window," or range of time over which signals are
accepted by the anzlyzer.
The relation between time window, bandwidth, and
sweep rate is:
T:B/S
where T = width of time window in seconds
B = bandwidth in Hz and
S = sweep rate in Hzlseconds
Since sound travels a cerrain distance within a time
"space or
interval, the time window corresponds to a
distance window". The space window is an ellipsoid
space around the speaker and microphone, inside of
which sound reflections ^re included in the
B-11
Saund LabTDS :
How TEF works
=
measurement. The speaker and microphone are at the
foci of the ellipsoid.
Sound reflections originating
outside the space window are excluded from the
measurement. Actually, they are attenuated 3 dB at the
edge of the space window ellipsoid, and by greater
amounts outside that.
For example, suppose you had a two millisecond time
window. Since sound travels at 7130 feet/second,
during a two millisecond time window, it will travel
2.26 feet. Therefore, we have a 2.26 feet distance
window. This means that any signal that has a total
path length that is within plus or minus 1.73 feet (1'/2
of 2.26 feet) of the direct sound will be included in our
measufement.
Space window considerations
On the TDS analyzer,the space window is determined
by the settings of the bandwidth and sweep rate. For
example, a 10-foot space window would correspond
to a bandwidth setting of 88.5 Hz at a sweep rate of
10,000Hz/second.
Here is the appropriate formula:
D = BCIS, where
B = bandwidth setting of tracking filter in Hz
S = sweep rute inHz/second
D : space window in feet
C : speed of sound, 1130 feetlsecond
The larger the space window, the lower the frequency
that can be measured accurately. That is, the lowest
frequency that can be measured without interference
decreasesas the sDacewindow increases.Therefore a
B-12
SoundLab TDS :
How TEFworks =
Reflecting
(Reflected
Illustration B-4
The space uindou, or TDS ellipsoid.
relatively large, empty room is needed for low-frequenry
measurements.This applies to all measurement systerns.
As stated before, reflections from surfaces at the edge
of the space-window ellipsoid arc attenuated 3 dB.
This attenuation may be inadequate to achieve sufficient
measurement accuracy. Reflections 3 dB below the
direct sound level can cause sizeablepeaks and dips in
the measured response due to phase interference with
the direct sound.
For the peaks and dips caused by reflections to be less
than L dB, the reflected sound level should be more
than9 dB belowthe direct sound level at the output of
the TEFrs filter.
For example, suppose you're measuring the rear (LBO
degree) frequency response of a cardioid microphone.
If the rear sensitivity of the cardioid microphone is -20
B-13
Sound Lab TDS :
How TEF works :
-
dB relative to the on-axis sensitiviry,then the reflected
sound level should be at least 9 dB less, or -29 dB
relative to the direct sound level at the microphone, for
+/- 7 dB accuracy.
The farther a reflective surface is from the center of the
space window, the more its reflections are attenuated
by the tracking filter. The table below shows reflection
attenuation versus the distance of the reflective surface
from the center of the space window:
Distance of surface
to center space window,
in number of space
windows.
1
2
3
4
Attenuation of
reflection, dB
1 ?
73.7
33.7
7?S
Inverse-squ are law attenuation further reduces the
level of reflections.
The table shows that, for maximum accuracy, reflective
surfaces should be well outside the soace-window
ellipsoid.
B-14
\-
Sound Lab TDS :
How TEF works
=
The relation between resolution frequenry and space
window is:
F:C/D
where F is the resolution frequency in hertz
C is the speed of sound in feet per-second
D is the space window in feet.
If we want to measure down to 100 Hz, we need a
space window of roughly 10 feet, or a clear space 5 feet
around the microphone and loudspeaker (from the
formula F = C/D). Check that the path length of each
room reflection exceeds the direct-sound path by more
than one wavelength of the lowest frequency to be
measured.
Directsound
'-'
Distance
Twospacewindows
Illustration B-5
Thespacewindow
B-15
Sound Lab TDS :
Data lnterpretation
=
:
t*-
Appendix C: Data interpretation
ls it reasonable?
It has been said that in order to properly measure a
device, you must know all there is to know about it.
But, if you already know all there is to know about it,
then why do you need to measure it? Obviously, when
we measure something, we don'tknow all there is to
know about it. That's why we are measuring it.
\-
Becausewe don't know itall, we must be carefulwhen
we measure. Sfle must convince ourselves that the
results of our measurements are real and correct. \f'hen
interpreting the data presented by the TEF Analyzer (or
any measurement system for that matter), you must
always ask youpelf: "Is this reasonable?" If you are
measuring the low frequency response of a 4-inch
loudspeaker,anda huge bump appearsat60Hz, is this
reasonable? Most likely it is not.
'When
you see something like this, your first thought
should be: "'What did I do wrong?" In the above
example, you would probably start looking for a
source of 60 Hz hum in your measurement setup.
If you have checked and double checked and are
convinced that your measurement is correct, it probably
is. However, it should take a lot of convincing to
believe that a 4-inch loudspeaker is putting out large
amounts of 60 Hz.
G1
Sound Lab TDS-:
Data lnterpretation
=
ls iE repeatable?
One test thatcan and should be made to determine the
legitimary of a measurement,is to check its repeatability.
You should be able to recreate and repeat a valid
measurement of a real phenomenon with the same
results each time. The TEF Analyzer provides a very
handy tool for checking the repeatability of a
measurement-the Difference mode.
To check a measurement that you have 1'ustmade, turn
on the Difference mode and repeat the measurement.
If it is repeatable, the difference should show virtually
no variation between the two measurements.
Illustration C-1is a difference with poor repeatability.
There are variations of over 6 dB across the entire
screen.
]{ME:
DIFF
TlmE (Hillisecs)
Illustration C-l A dffirence uitb poor rqeatubility
VC
Sound Lab TDS :
Data lnteroretation
=
Illustration C-2 is a difference showing good
repeatability. There is very little difference anywhere
in the display.
ao
@
5
U
3
o
J
* - s
L
c
-10
-15
n
]IODE:
DIFF
Illustration
o
.
n
TIflE
o
(Hillis.ca)
C-2 A difference with good rqea.tability
Another way to check for repeatability is to turn on
oveday mode and make several measurements. The
data from each of the measurements should lie right on
top of each other.
G3
SoundLabTDS:
:
Data lnterpretation
'..-:
Some things to watch for
The are some coff]rnon errors which can easily creep
into our measurements. If we can learn to rccognize
their telltale signs, we will be able to immediately spot
them and take action to eliminate them.
\Thenever two similar signals arrive at our measuring
microphone with nearly the same level, but at slightly
different times, they will interfere with each other and
cause anomalies in the measured response. This will
be the situation when we have set too large a time
window and a reflection is measured along with the
signal we are really interested in.
o 6 5
u
3 . o
E==
Illustration C-3
shows the telltale
signature of two
being
signals
measured at once.
Notice that the
peaks andnotches
are evenly spaced.
Each notch is
ap proxim ately
1.389Hz apart as is
eachpeak. Widely
spaced notches
o
o
indicate that the
{
n
o
signals are arriving
f airly
close
together. Notches close together indicate that the
signals are separated farther in time.
FREqUENCY
Illustration C-3
Tu.n signals being
measured a.t once
G4
(Hz)
1--
Sound Lab TDS :
Data lnterpretation
=
:::::
Illustration C-3 has a linear scale. On a logarithmic
scale,this signature of two interfering signals,would be
very difficult to see. This is one of the reasons for the
growing popularity of linear scales.
This type of interference pattem may be caused by the
direct sound from a loudspeaker and a reflection, or it
could be the result of two drivers covering the same
frequency range but emitting their sounds at slightly
different times.
\7hen making frequency response measurements,you
must take the frequency resolution into account.
Rememberthat in order to reliably measure a frequenry,
you must have enough time to observe atleastone full
period. If we have a frequency resolution of 500 Hz,
the resulting time resolution is 2 msec. The period of
a 500 Hz sound wave is 2 msec. This means that with
500 Hz of frequenry resolution, all frequencies below
500 Hz are not being reliably measured.
The analyzerwill display what may look like reasonable
data below 500H2 and, infact, we can consider a part
of it to be reliable. A rule of thumb is that from a
frequenry that is equal t o 1,/ 2 of the f requency resolution
on up, the data is reliable. Nffth 500 Hz of frequency
resolution, we can consider everything from250 Hz on
up to be reliable.
Noise is another problem to watch out for. TDS is
highly immune to noise and, unless you are using high
sweep rates in avery noisy environment, noise should
not be a problem in TEF measurements. However, the
ETC measurcment is more susceptible to noise due to
the wider filter bandwidths that are used.
Sound LabTDS :
Data lnterpretation
:
:
Illustration C-4 shows a noisy ETC. Although the direct
sound is easily seen at a level of 42 dB, the rest of the
display is noise. If allyou were interested in was the
time of arrival and the level of the direct sound, it's
there. However, if you were trying to measure the
room, you would have to increase the level from the
loudspeaker in order to bring the room's reflections up
out of the noise.
D isF
Heasure
FILE:
FIGUFE46,ETC
TIHE
tae
(nilliicconds)
Start
Freq.
=
IOO.O
Illustration C-4
A noisy ETC sbouing tbe direct sound at 42 dB.
G6
StoF
Frea,
= 24OOO,(
\-
Sound Lab TDS :
On-screen messages =
:::::
Appendix D: On-screen messages
This appendix lists some on-scieen messagesthat you
may encounterwhile us rng Sound Lab. Other messages
may also appear with possible solutions. Follow the
on-screen instructions that accompany these messages
to resolve problems. Messages listed in this section
appe r in alphabetical order, according to the first
word in each message.
'
Awaiting TEF trigger
TEF is waiting for trigger signal at the external trigger
connector.
Bandwidth should be >= sqft[sweep rateJ
A bandwidth that is gre ter than the square root of the
sweep rate is not a TDS measurement and therefore
does not reject reflections.
CanT differince...Number of points doesn't
match
Both files must contain the same number of data points
in order to difference them.
Can't difference...Different file type
You can't difference a time and a frequency file.
Can not save +7 this file type
You can't use Saue +1 with STI, RASTI nor 3D.
D1
Sound Lab TDS :
On-screen messages =
:::::
Check Communications or
Check Communication Port
This message appears when the host PC fails to
communicate with the TEF anaTyzer. Check the match
befween the hardware settings (Section 5, TEF 20
Analyzermanual), and the selectionsmade under the
Com mun i cati on sub- menu.
For serial communications, check the baud and COM
port settings. For HI, check the base address setting.
Also, either interface could have a faulry cable.
Turn ac powerto the TEF offandthen onor pressReset
on the analyzer front panel after making changes.
Cursor is Off or Cursor is On
These messagesare seen only when the data screen is
empty and the cursor status has changed, or when test
parameters have changed. Cursors are not visible
when the screendata does not match the test parameters.
Delay before test ## seconds
The amount of time that remains before the test begins.
Disk emor
Path was not found
Check the validity of the entries under drive and
directory.
Drive was not found
Check the validity of the entries under drive and
directory.
D-2
Sound Lab TDS :
On-screen messages =
:
Disk is write protected
Remove write protection.
Drive is not ready
Be sure disk is in drive.
Write fault
Possibly abad disk or a faulty disk drive.
Disk is full
Change disks or delete files.
Doing Noise Test 63 . . . . SOOOHz
This message appears during an NC test and the NC
portion of STI and RASTI measurements.
Drive not ready or illegal file information
Check under dNueand directory to see that driue and
patb are correct.. Is there a disk in the drive?
Error file was not saved
Most likely there was no file name entered. Use Saue
As.
Error in data file
There is an error on a parameter value. This error
should never occur, but, if it does exit the program and
begin agatn.
Error writing data file
There was an error in writing to disk. The disk may be
full or not available.
D-3
Sound Lab TDS-:
On-screen messages =
:
lnsufficient disk space
Not enough space on disk. Change disks or delete
some files.
lnvalid path
Check the validity of the entries under Driue and
Directory.
Loading will delete cument data
Loading a configuration file will change the parameters
thus invalidating the current data; therefore the data
will be deleted.
Measure halted. Path is invalid
Check the validity of the entries under Driue and
Directorv.
Measurement interrupted with ### curves
saved
\rhen the 3D measurement is interrupted choosing the
Continuebutton will continue the set of measure at the
curve number that was interrupted. Choosing the Stop
button will causethe measurement to ceaseand update
the number of curves to match the number that have
already been made. Choosing Easewillerase all of the
curves that have akeady been saved for this
measurement.
Min=OMax=6O.O
This message is seen only in the Settings sub-menu.
Input gain cafitange from 0 to 50 in 4 dB increments.
D4
Sound Lab TDS :
On-screen messages =
:
Mode: Diff
Appearsin thelowerleftof thescreenwhen
DffirenceOnhas been selected in the Display menu.
Mode: Ovr
Appears in the lower left of the screen when OuerlayOnhas been selected in the DisDlay menu.
No TCF files Found
Sound lab didn't find a configuration file in the current
path.
Obtain STI data before adding noise
You can't add noise to an STI measurement before one
has been made or a file opened.
Overload Occured
The input signal was too high. Reduce gain at the
input, or lower the signal from the system under test.
Path/filename exists. Overwrite tY/Nl?
Appears anytime a file in the current path has the same
name entered in the SaueAs menu. If you answer {
the old data will be deleted and the new data will be
saved.
Answer l/and then change the name in the Saue As
menu.
No data curcent
Some instructions can not be executed without data
existing in memory.
Sound Lab TDS-:
On-screen messages =
:
No data available
There was no data in memory to save.
Not enough memory for the phase cursor
There was not enough free RAM found to createthe
phasedataarray. Add more RAMto your computeror
remove background programs such as memory
managersor print queues.
Not enough memory for the file
Disk is too full. Usea differentdisk or deletesomefiles.
Not enough memory for Nyquist
Not enoughmemoryto createNyquistdata. Add more
RAMto your computer or get rid of backgroundtasks
such as memory managersor print queues.
Not enough memory for cursor
Not enough memory to createcursor data.Add more
RAMto your computer or get rid of backgroundtasks
such as memory managersor print queues.
Not enough memory for smoothing
Not enough memory to create smoothed data. Add
more RAMto your computer or get rid of background
taskssuch as memory managersor print queues.
Not enough memory for test
Not enough memory to contain the data for this test.
Add more RAM to your computer or get rid of
background taskssuch as memory managersor print
queues.
Sound [6fi fp$:On-screen messages =
:
Parameters may.not be changed while overlay
or difference mode is on
Tvr;rnoff Dffirence
parameters.
and Ouerlay mode before changing
Performing FFf
This message appears during STI or RASTI
measufements. An FFT is a complex operation which
may take several minutes on computers without math
co-processors. This message also appears when
changing the noise with Add Noise.
FleceivingData
This message indicates the PC is receiving test data
from the TEF over the HI or serial port.
Resolution mtfst be greater than O
A resolution of zero is a physical impossibility.
HT6O cursdr is on or PT6O cursor is off
These messagesare seen only when the data screen is
empty and the cursor status has changed. Cursors are
notvisiblewhenthe screendatadoes not matchthe test
parameters.
HT6O out of Hange
This message is seen when Sound Labplaces the RT6o
cursors in a way that would result in an increasing
slope. If this condition were true, the sound field
would be increasing, not decaying. To correct this
problem, manually place the cursors as described in
the section titled Making o/oAlcons and RT6o
mea.surements.
D-7
Sound l-6fi fP$-:
An-screen messages =
:::::
Staru frequency should be >= Bandwidth
A Bandwidtb that is less than the bandwidth will cause
an invalid response for the low frequency end of the
measurement.
Test Interrupted
During STI calibration, this indicates the automatic
sweep for calibrating level has been stopped by the
user. Press Enterto proceed to the equalization test,
During ETC or TDS sweeps, this indicates Escapewas
pressed.
Testing
This messageappears during a TEF sweep. It is usually
followed by Receiuing Data.
Test Timed Out
The PC did not receive the test data fromthe analyzer
in the required amount of time. See the Check
Communicationssection found on previous pages of
this section.
The printer is not ready,/check the printer
and try again
Be sure the cable is connected to the printer, it is turned
on, on line, and plugged in.
D-8
Sound l-6tuffi$-:
On-screen messages
=
TheTEFis not responding! Besetthe TEFand
try again
You have lost communications with the TEF. Make
sure the correct cable is connected and the
communication settings are coffect for the cable used
and the hardware switch settings.
There is not data availahle to print
Make a measurement or load data with Open Old
before printing.
Time span should not exceed sweep time
Reduce time span or increase sweep time.
Sound Lab TDS :
File formats
=
Appendix E: ASCII file formats
TEF ASCII file formats consist of two or more blocks of
information. Usually, these consist of a header block
and a data block. Information in both of these blocks
is needed to process TEF data with spreadsheets and
high level programs such as BASIC or Pascal.
Header block format
L
Each line of information within the header blocks is
usually in the following format:
. A parameter label in double quotes
. An ASCII tab character (hexadecimal 09)
. A value. The value is in double quotes if it is
alphanumeric
. An ASCII carriage-return character (hexadecimal 0D) for Macintosh files and a carriageretum and line-feed for MS-DOS files (hexadecimal0D 0A).
Macintosh line format:
"Parameter label"<tab>numeric value<cr>
MS-DOS line format:
"Parameter label"<tab>numeric value<cr><lf>
Data hlock format
The data block is usually stored as avoltage measured
by the TEF. Most files store the voltage as complex
number pairs. See the data section for each file type for
the exact storage format.
E-1
SoundLabTDS:
File formats
-
ETC file format
The ETC header
The first part of the ETC file is the header block. The
header is a record of allanalyzer settings that went into
making the test. Also included in the header are
operator comments, test location, and the date the test
was made.
The ETC header has 29 lines.
"Data =".
Line 29 is always
The ETC data
The second part of the ETC file is the collected data.
The data is stored as the voltage measured by the TEF
independent of the preamp gain. The number of lines
in the datapartof the file always equals the number of
samples selectedwhen $re test was made (572, 1'024,
2048, 4095, or Bl92lines). Each line consists of the
following items:
. A real number in scientific notation
o A tab character'(hexadecimal 09)
. An imaginary nunrber in scientific notation
An ASCiI carriage-return character (hexadecimal 0D) for Macintosh files and, a catriagereturn and line-feed for MS-DOS files (hexadecimal0D 0A).
E-2
Sound Lab TDS :
File formats
\-
=
Notes on ETC fites
Parameter label
Value
"ETC"
"Title :
"Name = "
"Date =
"Location = "
"Description= "
"SaveRate
"
G) =
"Number of Samples= "
"StartFrequenry= "
"StopFrequency="
"SweepTime="
"SweepRate="
"Bandwidth = "
"ReceiveDelay= "
"ETC Data Window Type = "
Comments
I Always use this key word for
'"
'"
47
1.024
1.78E+03
2.22F.+03
4.01E+03
9.57n+93
0.00E+00
0.00E+00
I
I
I
I
ETC measurements
Maximum of 50 characters.
Maximum of 50 characters
Maximum of 50 characters.
Maximum of 50 characters
I Maximum of 1.28characters
"FIAMMING"
I ETC supports only five types of
data windows. All must be
entered in upper case letters
"BI/.CKMAN"
"FIAMMING"
"FIANNING"
"KAISER"
"RECTANGUU.R"
"ETCData Window Beta = "
2.008+00
"ReferenceUnit= "
"Volts Per Reference Unit = "
"Zero dB Reference Value : "
"PropagationSpeed= "
"Pascal"
| Beta is used onlv for Kaiser
windows and must be a value
between 2 and 15. Beta is
always present regardless of the
window type.
2.26E-03
2.00E-05
7.73E+03
E-3
Sound Lab TDS :
File formats
Parameter
"Distance Unit = "
Value
Comments
"FEET"
Distance Units can only be
expressed in one offour key
words. Note all are upper case.
"FEET"
"INCH"
.METER"
"CENTIMETER"
"Channel = "
E4
0
1
2
J
"Preamp Gain A =
"Preamp Gain B =
"Output Level = "
60
0
-4.0007
"Data format =
"DataLype = "
"ASCII"
"SINGLE"
"Data count = "
1023
"DaIa ="
=
=
=
=
=
Line input B
Microphone input B
Line input A
Microphone input A
This is the output level used for
this ETC. The output level value
c4nnot be positive, and is
expressed in dB below 1.0 volt
rms. This value is valid only
when the front panel level
control is in the Calposinon.
Data types can only be
expressed in two key words,
"SINGIE" and "DDOUBLE".
There is currently no support for
"DDOUBLE".
This is a zero based count.
"Data count" is always equal to
"Number of samples" -1.
This is always the last line of the
header and precedes the data.
SoundLabTDS:
File formats
=
:tr=
HTTHHFE-ETC.TIIT
=n:
B
A
I
5
4
5
ETE
Title=
Htme=
Date=
Locttion=
ETCTakenToShor F
J5/JAB
3 l 7 1 9t l 5 : 4 9
oalbushf,hurch5o
6
,Delsripti-o-l
=
I SecondETC.Ce te
z
SaveRrte(k) =
i
qf Srmpl,e!
I 024
I
Humbeq
:
=
I .?8E0
+5
I
StartFreouencu
=
t o StoFFrequencu
Z . Z Z EO+ 3
4 . 0 1E +0 0
t l SveepTime=
9 . 5 ? E0+5
t 2 S"+'eep
Rate=
=
t 5 Bandvidth
0 . 0 0 E0+0
0 . 0 0 E0+0
t 4 Receive
Delau=
t 5 ETI Dttt Wi ndovTttpe=
HAI'{T{ING
2 . 0 0 E0+0
t 6 ETCDttt WindovBeta=
t 7 Reference
Unit =
Prscal
I E '/oltsFer Reference
Unit=
2 . 2 6 E0- 3
2 . 0 0 E0- 5
t 9 ZerodBReference
Value=
=
2 n Fropaqatjon
l.l5E+
Speed
feet
e l Distance
Unit =
5
2 2 C h a n n e=l
60
z t Preamp,Gai
nA =
0
?.4 PreamD
GtinB =
0
z5
ASCtI
z 6 Dataformat=
5I NGLE
7.7 Datatuoe=
I 025
Z 8 Datacount=
2 9 Dtta =
3 . 8 3 E0- 6
2 . 5 ? E0- 6i
50
?
L
| 053
U
5 .I 5 E -0 6
5 .I 5 E -0 6
ln
4 . 5 9 E0- 6
4 . 5 9 E0- 6
I f.lEt
Illustration E-1 ETCASCilfile displayed uitb a
spreadsbeet. Thespreadsbeetdoesnot display tbe
double quotesin tbe beader.
E-5
Sound Lab TDS :
File formats
=
NC ASCIIfiles
The NC header
The first part of the NC file is the header information.
The header is a record of all analyzer settings that
contributed to the test. Also included in the header are
operator comments, test location, and the date the test
was made. See Header information forrnat at the
beginning of this section.
"Data :" .
Line 16, the last line of the header, is always
The NC data
The second block of the NC file is eight lines of
collected data. The data is stored as sound pressure
level, expressed in dB. These values include factors
entered in the Calibrationsub-menu of Sound Lab.
Each
.
.
.
.
line of NC data cJntans the following items:
A sound pressure level in scientific notation
A tab character (hexadecimal09)
Zero, expressed in scientific notation
An ASCII carriage-return character (hexadecimal 0D) for Macintosh files and a carriageretum and line-feed for MS-DOS files (hexadecimal0D 0A).
E-6
Sound Lab TDS :
File formats
-
Notns on NC files
Parameter label
"NC"
"Tide = "
"Name = "
"Date = "
"Location = "
"Description = "
"Integration time ="
Value
4
"Number of Samples =
"Volts Per Reference Unit = "
"Channel = "
8
"PreampGainA="
"PreampGainB="
"Data f.ormat= "
"Datatype = "
"Data couftt = "
"Data= "
60
0
*
"ASCII"
"SINGLE"
4.1.58+01.
4.00E+01
3.15E+01
2.708+07
2.228+01"
2.09E+01
1.33E+01
3.358+01
2.268-03
3
Always use "NC" as the test type
key word for NC measurements.
Maximum of 50 characters.
Maximum of 50 characters.
Maximum of 50 characters.
Maximum of 50 characters.
Maximum of L28 characters.
This value must be between 1
and9,999. Default setting is 4.
Number of Samples is fixed at 8.
0=
1=
2=
J =
Line input B
Microphone input B
Lrne input A
Microphone input A
Data count is fixed at 7.
Dara is in dB sPL.
0.0000008+053 uzband
0.0000008+01"25Hzband
0.000000E+025OHzband
0.000000E+0500 Hz band
0.000000E+01000Hz band
0.000000E+02000Hz band
0.0000008+04000Hzband
0.000000E+08000 Hz band
7
E-7
Sound Lab TDS :
File formats
A
I
z
5
4
5
6
?
I
!t
t0
E
Title=
Hoiref,riterial{ersurement
With C e i l i n qF r n sO f f
Nfrme=
Date=
Location=
LJ$/JAB
25
24
z5
LI
3l-?191I 4:52i
.
C o r l b u sChh u r c h : 5 o uBt e
h n dl N
p-tjq.t
l'1ic
Just
ln
Front
0f
Balconu
0n
l"Irin Floor
Q_ec_c_!:j =
nteqration
Time=
4
jlr.p.!
I
l1.U.ttr.
-b_q
I..qf._S..q
_q
_s=
VoltsFer Reference
Unit=
2 . 2 6 E0- 5
h t n n e l=
4
t 4 Q-alc
-tqp.q
=
t 5 Dttr count=
t 6 Data=
zI
zl
?z
D
HC
t l P r e a m o G a i n=A
l ? Preamp
GainB =
t 5 Dataformat=
t7
t8
t9
f,
=
60
0
ASCII
5IHGLE
7
4 . 16 E +0 1
4 . 0 0 E 0+l
3 . 15 E +0 I
2 . 7 0 E0+l
Z . Z Z E0+l
2 . 0 9 E +0 l
1. 3 5 8 +
BI
5 . 5 5 E0- 7
0 . 0 0 E0+0
E . 0 t l E0+[
0 . 0 0 E 0+0
0 . 0 0 E0+0
f f . 0 0 E0+0
0 . 0 0 E0+0
0 . U 0 E0+0
0 . 0 0 E0+0
n
Illustration E-2 NC ASCIITb displayed in a strtreadsbeet.Thedouble quotes
are not displayed by tbe spreadsbeet.
E-8
Sound Lab TDS :
File formats
-_
TDS ASCIIfiles
The TDS header
The first part of the TDS file is the header information.
The header is a record of all analyzer settings that went
into making the test. Also included in the header are
operator comments, test location, and the date the test
was made. Line 31, the last line of the header, is always
"Data =".
The TDS data
L
The second part of the TDS file is the collected data.
The data is stored as the voltage measured by the TEF
independent of the preamp gain. The number of lines
in the datapartof the file always equals the number of
samples selected when the test was made (5I2, L024,
2048, 4096, or 8192lines).
Each line consiJs of the following items:
. A real number in scientific notation
. A tab character (hexadecimal 09)
. An imalinary number in scientific notation
. An ASCII carriage-return character (hexadecimal 0D) for Macintosh files and a caniagereturn and line-feed for MS-DOS files (hexadecimal0D 0A).
E-9
Sound Lab TDS :
File formats
=
1
-E+
rE
?rr-
ralrrtnr4r-.rrl-.n.
:-=
#=.ti
fi
E
A
e
T i tl e=
5
4
5
Hf,me=
LJS/JAB
Date=
=
Location
5 / ? / 9 1I 8 : 0 1
SouthBend
f,hur ch
6
?
I
I
to
tl
Delqtipll_o_!r:
SrveRate{k} =
H u mb eor f S tmp l e=
s
I
't024
? . 8 0 E0+Z
$-!qfi[.!'.equettF-u.:
StopFrequEllctl=
St*eepTi me =
I . 5 0 E +0 4
I .9ZE+
00
=
Frequencg
Resolution
7.?lE+05i
4 . 6 5 E0+l r
3 . 3 3 E0+0
5 . ? 7 EE+ 0
5 . 0 0 EE+ Z
t 2 $vqqp[a-te=
t 5 Eandvidth=
t 4 T i meR e so l u ti o=n
=
t 5 Distsnce
Resolution
t6
i
t 7 Eritical Eand'riidth
0n =
OH
Receive
4 . 0 5 E0+l
Deltg=
t t t Reference
Prscal
Unit=
z . ? 6 E0-5
E O ToltsPerReference
Unit=r
=
u l Z e rod ER e fe re nVcea l ue i
2.0ilE- 05
t8
tz.
=
P r o p a g a t i oSnp e e d
a 5 D i sta n ce
U n i t=
=
Ehrnne'l
e 5 FreempGsinA =
E 6 Frq_t_Up_cqil
E=
Z ? 0utputLevel=
E 8 Dttt formtt =
E 9 Datttgpe=
5 u Dattcount=
5 l Dtta=
1. ' l3 E +0 5
i
FEET
5
40
0
0
74
45fl I
5I HGLE
10 2 5
t''l
Illustration E-9 mS ASCII beader displayed in a spreadsheet.
TItedouble quotesa,renot displayed by the spreadsbeet
E-10
Sound Lab TDS :
File formats
=
Notes on TDS files
Parameter la
"TDS"
L
"Title = "
"Name = "
"Date = "
"Location = "
"Description = "
"Save Rate (k) : "
"Number of Samples = "
"Start Frequency = "
"Stop Frequency = "
"Sweep Time = "
"Sweep Rate = "
"Bandwidth = "
"Time Resolution : "
"Distance Resolution = "
"Frequency Resolution = "
"Critical Bandwidth On =
"Receive Delay = "
"Reference Unit = "
"Volts Per Reference Unit : "
"Zero dB Reference Value = "
"Propagation
Speed = "
"Distance Unit = "
Value
,,,,,:,',,
Comments
Always use this key word for
TDS measurements.
Maximum of 50 characters.
Maximum of 50 characters.
Maximum of 50 characters.
Maximum of 50 characters.
Maximum of 1.28characters.
1c)
1.024
2.008-02
1..508+04
1..92E+00
7.71E+93
4.63E+01
3.33E+00
3.77E+00
3.00E+02
"oN"
If Critical Bandwidth is tumed
on, then use the key word "ON"
otherwise use the key word
"oFF".
4.058-07
"Pascal"
2.26E-03
2.008-05
1.13E+03
"FEET"
Distance units are key words
and can only be expressed in
four words. Note all are in
upper case letters.
"FEET"
"INCH"
"METER"
"CENTIMETER"
E-11
Sound Lab TDS :
File formats
Parameter label
"Channel = "
"PreampGainA="
"PreampGainB="
"Outputlevel="
0
1
2
3
40
0
0
Line input B
Microphone input B
Lrne input A
Microphone input A
This is the output level used for
this TDS. The output level val
cannot be positive, and is
expressed in dB below 1.0 volt
rms. This value is valid only
when the front panel level
control is in the Calposition.
"Data format = "
"Data type = "
"ASCII"
"SINGIE"
"Data count = "
1023
"Data = "
-2.678063e-6
-2.975732e-6
-5.953464e-6
7.765387e-7
-3.902505e-6
-2.588463e-6
E-12
=
=
=
=
=
Data types are key words and
can only be expressed in two
key words. There is currently
no support for "DDOUBLE"
"SINGLE"
"DDOUBLE"
[ this is a zero based count.
"Data count" is always equal to
"Number of samples" -1.
Sound Lab TDS :
File formats
:
-
Analyzer settings
Summarv table
tTI and HASTI file formats
STI and RASTI files are composed of several blocks of
data. Some of the blocks contain header information
and some contain data.
Noise data
STI analyzer se.ttings block
ETCL beader
ETC| data
a
a
a
Both RASTI and STI measurements store a record of all
analyzer hardware settings in the analyzer settings
block. Also included in the settings block are operator
cornments, test location, and the date the test was
made. These settings are cofirmon between the NC and
ETC measurements. The settings block has 14 lines.
ETCTbeader
L
ETCTdata
Illustration E-IO
Tbe blocksof tbe
Sn Ascnfile
format.
STI summary table block
The summary table block contains the column headings
for the STI display as well as the values for the display.
An ASCII tab chancter (hexadecimal 09) separates the
columns.
If the measurement is an "STI" oT "NOISELESS-STI",the
display block will contain data for all seven frequenry
bands. Ifthe measurementwas a "RASTI"ot "NOISELESS
RASTI' measurement, only two bands of data will
appear in the summary table block.
L
E-13
Sound Lab TDS :
File formats
=
STI ETC header block
The ETC header in STI and RASTI files contain only
those analyzer settings that would ^ppear in an ETC
Parameters sub-menu. The parameters used for the
STI and RASTI tests are tixed by the program and
cannot be changed by the operator.
The last line of the ETC header block is always
"Data =".
STI ETC data hlocks
The second pafi of the ETC file is the collected data.
The number of samples is different for each frequency
band of the STI measurement. The data is stored as
complex pairs, identical to the storage format for.ETC
files.
E-14
Sound Lab TDS :
File formats
:
-
(
ruotes on STI analyzersettings block
Parameter label
Value
Comments
"STI"
Always use this key word for STI
and RASTI measurements.
"FULL_STI"
Must be one of the following
four key words:
"FULL-STI"
"NOISEIESS-STI"
"FTILL_RASTI"
"NOISELESS_RASTI"
"NC-NOISE"
Can be one of the following
three key words:
"NC-NOISE''-If
L
thc
measurement was a "FULL_STI"
or "FULL_RASTI", and the noise
source was from an actual STI
RASTI measurement or the noise
was brought in from a NC
measurement, then use the
"NC-NOISE" key worc.
"TABI.ED-NOISE''-If
thc
measurement was a "FLILL_STI"
or "FULL_RASTI" with noise, and
the noise source was from userentered table list, then use the
"TABLED_NOISE" key word.
"NO-NOISE"-If the measurement was a "NOISELESS_STI"or
"NOISELESS-RASTI"(a measure-
L
ment without noise, then use
"NO_NOISE" key word).
E-15
Sound Lab TDS :
File formats
Parameter label
Value
"Name = "
"Date =
"Location: "
"DescriPtion = "
"Volts Fer Reference Unit = "
"PropagationSpeed= "
"Distance Unit =
.01
1130.00
'FEET"
,,Channel="
"PreampGainA="
"PreampGainB="
E-16
3
Comments
I Distance Units are kev words
arrd can only be expressed in
one of four key words. Note all
are uppef case.
"FEET"
"INCH"
"METER"
"CENTIMETER"
lO=LineinputB
1 = Microphone input B
2 = Ltne input A
I - Microphone input A
48
0
=
l-*
l
Sound l_6fufp$:File formars
i-#
:
nltnnrl}-.tl
t.tfll
4-=
:
E
E
A
=
ij
I
z
FULL-STI
i
5
4
H[-HotsE
T i t l e=
i
5
Nflme=
6
7
ff
I
to
tl
tu
L
Thr ouoh
A lar l"lic
rS TTsken
l
LJS/JAE
5/7/9.| I 5:49
=
Location
E o abl u s hE h u r c hS: o u t hB e n dI,N
Descri
l"lainSustemUsed
To ExciteTheRoom
Etion=
VoltsPer Reference
Unit =
0.01
=
Frouasation
Soeed
I 150
Date=
Distance
Unit=
=
Ehannel
t 5 PreampEtinA=
t 4 F r e a mn
Ga i nB =
FEET
3
40
0
Illustration E-l1 STI and RASTI analyzer settings block
E-17
Sound Lab TDS :
File formats
=
Notes on STIsummary table block
"FREQUENCY"
"STI"
L25Hz
0.85
250Hz
0.7
0.53
500Hz
1000Hz
0.47
2000Hz
0.49
4000Hz
0.35
0.34
8000Hz
. "OVERAILSTI = "
0.45
"EQUIVAIENTS/N RATIO =" 1
"EQUTVALENT
EARLYRT60=" 2.1
"SUBJECTIVEEVALUATION = ""FAIR"
E-1I
"EARLYRT60" "S/N RATIO"
10.5
0.3
6
0.61'
.09
7.13
-7
2.07
-.04
7.71.
-4.4
3.37
-4.8
5.34
Subjectiveevaluations are key
words and can only be
expressedin five key words.
"EXCELLENT"
"C'OOD"
"FAIR"
"POOR"
-BAD"
Sound Lab TDS :
File formats =
:
E-,=
= - : E r r E E r E - l r r ' - ' 4 -
E
A
t 5 FRESUEHCY
l6
5Tl
l25Hz
t ? 2 5 0 Hz
t f f 5 0 0 Hz
t 9 I 0 0 0H z
z o 2 0 0 0H z
e l 4 0 0 0H z
?2. 8 0 0 0H z
u5
0 V E R A L5LT l =
t 4 EQUIVALEI'lT
5/H RATI0=
? 5 EQUIVALEHT
EARLYRT60 =
= FAIR
z 6 SUBJECTIVE
EVALUATI0H
c
D
EARLYRT6O 5 / N R A T I O
0.ff5
0.5
10.5
0.?
0.61
6
0.55
1. 5 1
0.9
-1
0.4?
2.07
- 0.4
0.49
1. 7 1
- 4.4
3.37
0.55
- 4.ff
0.34
5.54
0.46
1
2.'l
Illustration E-12 STI and RASTI summary table block
E-1I
Sound Lab TDS :
File formats
=
Notes on STI noise data block
Parameter label
.T{OISE DATA =
Value
Comments
This is the key word for the start
of the noise data summary. The
eight values are always shown
regardless of whether a
"NOISELESS_STI"or
-NOISELESS-RASTI"
measurement was performed. If
a "NOISELESS_STI"or
"NOISELESS_RASTI"
measurement was performed,
the values are expected to be all
zero (0.000000e+0).
If the measurement is a
"FULL_RASTI" and the noise was
not input from a table or from a
NC file, then element four and
element six will be the only
elements with values as shown
below.
1.70E+01
2.90E+01
3.50E+01
3.408+01
3.00E+01
2.808+01
2.40E+0t
2.00E+01
"Integrationtime ="
E-20
Used only for RASTI
Used only for RASTI
The STI setting is always 4 for
integration time. If noise data
was imported from an NC file,
this value will always fall
between 1 and 9,999.
SoundLab TDS :
File formats
=
='-:
L
:tr=
HLTHHFE-ST|.T1|T
A
E
5 7 ETII
5ff SnveRate{k} =
B4
gI $qmpl_eq
5 9 ltlU_m
5l?
h_e_f_
=
4tl $-tqrl
il
il'eq$nc.u.
=
4 l S to oF re o u e n =
cu
?ZB
4Z St*eeoTi me =
4.01
45 Iu-e..ep..Eq-t-q..=
54.I
44 Eandvidth=
E
45 Receive
Delau=
u
46 !utp-u-t
2.5
Ls-vel
=
4? Dataformat=
A5flI
48 Dsta
tuoe=
5I HGLE
49 Datacount=
5lI
=
5 0 Data
- I .ftZE- 06
5l
I . 4 2 E0
-6
561
2 . 3 1E -0 6
56e
z . 5 lE -0 6
LT
2 . 5 4 E0- 6
? . 5 4 E0- 6
5 6 5 ETI2
Illustration E-14 STI and RAST ETC beader block.
E-21
SoundLabTDS:
File formats
=
Notes on STI ETC block
Parameter label
"ETC1"
"ETC3"
"ETC5"
"SaveRate(k) = "
"Number of Samples= "
"StartFrequency="
"StopFrequency="
"Sweep Time = "
"SweeP Rate = "
"Bandwidth = "
"ReceiveDelaY="
E-22
Value
Comments
This is the key word for the start
of the ETC data header. If the
measurement is a "FULL-STI" or
"NOISELESS-STI"there will be
six sets of headers and ETC data.
Each new ETC set will begin
with the "ETCx" key word. (x)
will be a number from one to
seven as shown below .
"ETC1"
"ETC2"
-ETC3"
"ETC4"
"ETC5"
"ETC6"
"ETC7"
If the measurement is a
"FULL_RASTI" or
"NOISELESS-RASTI"there will
be rwo sets of headers and ETC
"ETC3"
data. The first will be
"ETC5".
and the second
94
512
11.0
228.0
4.01
54.1
0.0
0.0000
Sound Lab TDS :
File formats
=
L
Parameter label
"Output Level = "
-)s
Value
"Data format =
"Datatype = "
"ASCII"
"SINGLE"
"ASCII"
"SINGLE"
Comments
This is a key word of the actual
output level used for this ETC.
This value contains both thre
BandGainlowerFactors coded
into the STI application to
simulate human voice and
SpeakerEQOctavesPl values
collected from the talker
equalization for the appropriate
band. The values cannot be
positive, and are in dB down
from 1.0 vrms.
Data formats are key words and
can only be expressed in two
key words.
Data types are key words and
can only be expressed in key
words. There is currently no
support for "DDOUBLE".
"Data count = "
"Data = "
577
-2.643692e-5
2.897838e-5
-1..943973e-5
-2.095901.e-5
3.975I30e-5
-3.417925e-5
This is a zero based count.
"Data count" is always equal to
"Number of samples" -1..
E-23
Sound Lab TDS :
File formats
Parameter label
Value
"ETC2"
"Save Rate (k) = "
"Number of Samples - "
"Start Frequency = "
"Stop Frequency = "
"Sweep Time = "
"Sweep Rate = "
"Bandwidth = "
"Receive Delay = "
"Output Level = "
"Datzformat= "
"DaIatype = "
"Data count = "
"Data='
47
5L2
141.0
358.0
2.01.
1496.0
0.0
0.0000
-9.101.4
"ASCII"
"SINGLE"
9.944027e-5
-1..224643e-5
7.479048e-6
=
Comments
511
2.511.552e-5
-2.657577e-5
1.377536e-5
"ETC3
"ETC "
.
"ETC5"
"wc6"
"ETC7"
o
E-24
SoundLab TDS :
File formats
=
3D file format
The 3D master file header
The 3D master file (with extension .3D) contains
information that is common to all individual tests in the
3D set, such as the test title, date and location,
descriptionof the test and number of measurernentsor
TDS files in the measurement. The lines for Tbird Axis
contain labeling and value information for Starttime,
Stoptime and Time step. The Max YDatavalue is the
largest datavalue in all TDS files.The Min YDataisthe
minimum data value in all TDS files.
The associated data for each of the measurements in
the set accompanies the file with the same name plus
the extensions.001, .002, .003...etc.
See TDS, Scilfiles, E-lOfor information on individual
TDS files.
Illustration E-15 3D masterfile in a spreadsheet.
E-25
SoundLabTDS:
File formats
=
Noheson 3D files
Parameter label
'3D2oN'
Value
File version number
"TDS'
Always use this key word for
3D measurements.
"Title ="
ttName =tt
tt 1'
"Date:"
-"Location:"
"Description :"
"Number of Measurements:"
"Third Axis Label :"
"Third Axis Start ="
'Third Axis Stop ="
"Third Axis Step :"
"Max Y Data:"
(("
rt "
"Min Y Data:"
E-26
Comments
t( "
36
TIME
0.009+00
1.62E+01
4.508-01
Maximum of 50 characters.
Maximum of 50 characters.
Maximum of 50 characters.
Maximum of 50 characters.
Maximum of 1,28characters.
From 2-100 measurements.
The Start time value.
The Stop time value
The Time step value.
7.00E+01 Largest data value in all
cufves.
-1.00E+01 lShallest data vahte in all
curves.
SoundLab TDS :
Glossary =
:
AppendixF: Glossary
acoustic center-The point in space of the origin of
sound; for a sound emitting transducer, the point from
whichthe sphericalwaves appearto diverge asobserved
at remote points.
acoustic origin-the
originates.
point in time at which the signal
o/oAl"o*r-The
measured percentage of Articulation
Loss of Consonants by a listener. In TEF, Articulation
scores are measured as percent of articulation loss of
consonants in speech. 7o{.o", of 0 indicates perfect
clarity and intelligibility with no loss of consonant
understanding, while 1.0o/oand beyond is growing
toward bad intelligibility, and 1.5o/otypically is the
maximum loss acceptable.
A-weighting
sea \Teighted.
arnbience-Room
acoustics, eady reflections and
reverberation. The audible sense of a room or
environment surrounding a sound source.
ambient noise-Background noise associated with a
given environment.
F-1
Sound Lab TDS::
Glossary
=
amplitude-In
TEF measurements, the total surnrnation
of all sound energy over the total time of the
measurement at all frequencies within the bandpass of
the instrument. The sound energy ata givenfrequency
over the entire time of the measurement. Amplitude
can be measured as the sound pressure at a given
instant of time at a given frequency. Amplitude is the
maximum value of a field quantity in space or time.
analyzet-A
device that divides a spectrum into a
finite number of frequency bands and determines the
relative magnitude of the energy in each band. TEF
analyzers combine the capabilities of a computer,
sweep oscillator, an accutate quartz timing clock, and
a sweepable bandpass filter system to make TDS
measurements.This hardware, coupledwith controlling
software, gives control of frequency, energy, andsignal
delay, along with the precision to measure and analyze
the results. In addition, TEF analyzers allow extensive
post-processing capabilities and storage of test data.
TEF analyzers can sweep linearly in time through
a specified runge of tiequencies. The characteristicsof
this oscillator ate its sweep rate in hertz per second, and
its starting and stopping frequencies. The analyzer in
the TEF systems linearly sweeps its tuning through a
range of frequencies. Its characteristics are its sweep
rate,bandwidth, and startfrequency and stop frequenry.
Since this bandwidth is sweeping in time, it can also be
described as a time window in seconds. The analyzer
time aperture equals the bandwidth in frequency
(hertz) divided by the sweep rate in Hertz per second.
This window is proportional to bandwidth and is
inversely proportional to sweep rate. In mathematical
terms: R, = B/S
Time Resolution = bandwidth/sweep rate
F-2
Sound Lab TDS :
Gtossary
=
anechoic-Literally,
without echo. A characteristic
describing an environment whose boundaries effectively
absorb all sound over the frequency range of interest,
thereby creating a free field condition. By filtering out
delayed reflections, the TEF can make anechoic (echofree) measurements in a non-anechoic room.
measure of
articulation
loss of consonants-A
speech intelligibility. The percentage of consonants
heard incorrectly, strongly influenced by noise or
excessive reverberation.
S€er o/o A\o",
lessening of the sound
attenuate, attenuation-The
signal level due to divergence, absorption, reflection,
refraction, diffraction, etc. expressed in decibels. The
decrease in sound level with distance in the direction
of propagation. The reduction of the level of a speaker.
filter that passes a specified
band-pass filter-A
frequency band while all frequencies above and below
this band ard attenuated. see: bandwidth, center
frequency.
bandwidtfThe
difference between the values of
the frequencies where the filter's response has fallen
by 3 dB. In TEF, the bandwidth of the tracking filter
can be preset. The wider the bandwidth, the greater
the "time window." see time window, band-pass filter,
center frequency.
F-3
SoundLabTDS:
Glossary
=
comb filter, comb filter effect-A sequence of evenly
spaced peaks or dips in the frequency response plot
when viewed on linear scale caused by |wo or more
identical signalswhich combine at near equal amplitudes
but at slightly different time intervals.
complexwave-Awave
component.
with more than one frequency
portion of a soundwave inwhich
compression-The
molecules are pushed together, forming a region with
higher-than-normal atmospheric pressure. Also, in
signal processing, the reduction in dynamic range
caused by a compressor.
coverage-the distribution of direct sound levels in a
listening area.
coverage angle-Th.
u.rgt. included between 6 dB
down points of a sound source.
crest factor-The
waveform.
ratio of oeak to rms values of a
critical distance--The distance from a sound source
at which direct sound and reverberant sound are at the
same level.
frequency below which
critical frequency:The
standing waves cause significant room modes.
dB-Abbreviation
F4
for decibel. see;decibel.
Sound Lab TDS :
Glossary
L
=
deadness-The lack of sound reflections in a room.
The subjective judgment of how a room "sounds",
dependent upon the initial time delay gap andthe ratio
of direct sound level to the early reflection level.
rate at which the
decay tate, decay time-The
reverberant sound field decays in a room, measured in
dBlsecond. Decay rate is related to reverberation time
by Ro: 50lRT6o.
decibel (dB)-A power ratio. The unit of measurement
of audio level. Ten times the logarithm of the ratio of
two power levels. Twenty times the logarithm of the
ratio of two voltages, cuffents or sound pressures.
dBV is decibels relative to 1 volt.
dBm is decibels relative to 1 milliwatt.
dBA is decibels, A weighted (see'$Teighted)
A decibel is commonly thought to be the smallest
change in sound pressure level that the trained human
ear can detect.
delay--The
time interval between two signals.
Delay can be:
1. the signal delaytime through a given component
2. the signal delay time from a loudspeaker to
listener
3. the signal delay between two transducers
(either microphones or loudspeakers.)
4. Any other signal delay in a sound system that
exceeds that normally expected from a minimum
delav svstem.
F-5
Sound Lab TDS :
Glossary
=
diffraction--The
bending of a wave front around an
obstacle in the sound fieId. see: reflection.
diffrrse field-Sound field in which the sound pressure
level is the same everywhere and the flow of energy is
equally probable in all directions.
diffirser-A
device to enhance the spreading of sound
for even distribution of sound in an environment.
diffrrsion--The
spreading of sound reflections to
achieve an even distribution of sound in an environment.
direct sound-Sound
that has traveled from the
sound source to the observer and has encountered no
reflecting surfaces. see:Q
ratio of the sound pressure
directivityfactor(q;="ry6e
squared, radiated directly ahead of a sound source, to
that sound pressure squared radiated in all directions.
arrivals at the
discrete sound affivals-Sound
microphone or listening position that are separated in
time.
domain:The
X axis or independent variable in a
measurement. see:time domain, frequency domain.
dopplereffect--The
change in the observed frequenry
of a wave caused by a change in the velocity of the
sound source. An example of the doppler effect is the
difference perceived in pitch of a car horn as it
approaches. As it approaches, it appears to rise; as it
passes and moves away, it appears to drop.
t--o
Sound Lab TDS :
Gtossary
=
L
doubling-A
special effect in which a signal is combined
with its 15-to-35 millisecond delayed replica. This
process mimics the sound of rwo identical voices or
instruments playing in unison.
early decay time:The
time for a sound to decay 10
dB from its original level. Short decay times cause
music and speech to sound dry or muffled. Long decay
times make speech unintelligible and difficult to
understand.
It is the figure that most closely
approximates how the decay time "sounds" to the ear.
eady sound, early reflections-Sound
ariving within
about 70 milliseconds of the direct sound.
echo-A
sound wave which has been reflected or
otherwise returned with sufficient magnitude and
delay to be percived as distinct from that directly
transmitted. Echoesare perceived as distinct repetitions
of the original sound. A sound delayed 90 milliseconds
or more, combined with the original sound is sometimes
considered an echo.
EFC, Energy Frequency
Curve-A
Frequency
Response. A "snapshot" of all the energy returned in
the frequency range of interest for a given amount of
time. Frequency is displayed on the horizontal axis;
magnitude on the vertical axis.
ellipsoid-a
three dimensional ellipse. In TDS, the
football-shaped space around the loudspeaker and
microphone coffesponding to points at which the TEF
test tone is attenuated by 3 dB upon returning to the
microphone. see: space window
F-7
SoundLabTDS :
Glossary
-
TEF
ETC (Tirne response)---cnergy
tirne curve-In
measurements, a display of all the energy returned
during the time span of interest. Time is displayed on
the horizontal axis; energy on the vertical axis. An ETC
shows that ttat this time, this much sound energy has
arrived." An ETC indicates how energy comes out of,
or is released from a system or device after it is hit with
a sudden application of input energy confined to a
given frequency band. ETC measurements quickly
reveal not onlythe amplitude andthe time of arrivalbut
also the density of the reverberant field, its approach to
exponential growth and decay, and the initial time
delay gap. An ETC contains no frequenry information
other than the knowledge of the range being swept.
far field-The
distribution of sound energy ^t a very
much greater distance from a source than the linear
dimensions of the souf,€e and in which the sound
waves can be considered to be plane waves.
FFT-Fast Fourier Transform. An algorithm for rapidly
computing the Fourier Transform.
flutter echo -A series of specific reflective returns
caused by large surfaces being parallel to each other.
focused reflections.-Sound energy concentrated by
a curved surface. Focused reflections are usually
louder than the normal reverberant field at a given time
after the excitation has ceased.They can be caused by
domed ceilings, curved surfaces, etc.
F-B
Sound Lab TDS:Glossary
=
\-
Fourier transform-A
mathematical description of
the relationship between functions of time and
corresponding functions of frequency. It is a map to
convert data from one domain into another. For
example, if we have asignalthat is a function of timean impulse response-for example, then the Fourier
Transform will convert that time domain data into
frequency data yielding a signal that is a function of
frequenry-a frequenry response. The inverse Fourier
Transform will do just the opposite. It will give the time
domain data from the frequency domain. The Fourier
transform is executed bythe computer in the TEFwhen
making Energy Time Curves.
L
free fielLAn
environment in which there are no
reflective surfaces within the frequenry region of
interest.
frequency:The
number of complete cycles or
vibrations per unit of time, usually per second. The
frequenry of a wave (measured inhertz (Hz) is equal
to the velocity divided by the wavelength. A lowfrequenry sound (say, 100 Hz) has a low pitch; a highfrequenry sound (say, 10,000 Hz) has a high pitch.
Frequency is a measure of oftenness. The units of
frequenry are reciprocal of the units of time.
frequency resolution-see.'
resolution, frequenry
\-
F-S
SoundLabTDS:
Glassary
=
frequency response-Amplitude
versus frequency
plot. In TEF measurements, energy density versus the
'When
stated as
frequency for a selected time window.
is
the
range
a device specification, frequency response
of frequencies that an audio device will reproduce at
an equal level (within a tolerance, such as +/- 3 dB).
frequency span-That region of frequencies, from
the lowest to the highest, over which the TEF sweeps
for analysis and display.
frequencies of interesf-sss;
frequency span.
graph of time and
FTC, Frequency Time Curve-A
frequency with magnitude displayed in the form of dB
contour lines.
frrllscaletime-The
tirne span shown onthe right end
of the screen of an ETC measurement. It is dependent
on the frequency span of the sweep and number of
samples.
fundamentalperiodic wave.
The lowest frequency in a complex
gain-an increase in power. The ratio, expressed in
decibels, between output power and input power of
a system.
see: decibel
harmonic-An
overtone whose frequency is a wholenumber multiole of the fundamental frequencv.
F-10
Sound Lab TDS :
Glossary
hertzJThe
second.
=
unit of frequency representing rycles per
heterodyning-Mixing
two frequencies together in
order to produce fwo other frequencies equal to the
sum and difference of the first two. For example,
heterodyning a 100 kHz and a 70 kHz signal will
produce a 1,1,0kHz (sum frequency) and a 90 kHz
(difference frequenry) signal. In TEF, it means changing
the frequency of the incoming signal (signal being
analyzed) so that it is at the I.F. filter's center frequency.
highpass filter-A
filter that passesfrequencies above
a certain frequency and attenuates frequencies below
that same frequency. A low-cut filter.
Hz-Abbreviation
for hertz.
*
irnpulse fesponse-Sound
pressure versus time
measurement showing how a device responds to an
impulse. A potential versus time measurement showing
how the potehtial of a system varies with time when
stimulated with a zero-width infinite amplitude pulse.
initialttme delaygap-Abbreviated
ITD, the time in
milliseconds (msec) between the arrival of the direct
sound at a listener and the arrival of the first significant
reflection. A reflection's significance is dependent
upon its level in dB compared to surrounding scatter
and its time interval. It is the first total spectrum
reflection containing substantial energy relative to the
direct sound.
r - t l
Sound Lab TDS :
Glossary
=
a
intensity (sound)-(sound
energy flux)-in
specified direction at a point is the average rate of
sound energy transmitted in the specified direction
through aunitareanormal to this direction at the point.
inverse squafe law rate of level change-An
attenuation of 6 dB for each doubling of distance from
a source of sound.
24-hotr Leq, except,
Ldn (noise measufement)-A
10 dB is added to all levels measuredbetween 10:00PM
andT:OOAM to account for the need for more quiet
during sleep hours.
24-hour Leq, except,
Lden (noise (neasurement)-A
5 dB is added to all levels measured between 7:00 pu
and t0:00 pnrand 10 dB is added to all levels measured
between 10:00 pnaand 7S0 AMto account for the need
for more quiet during sleep hours.
continuous
Ieq (noise measufe(nent)-Equivalent
sound level. The steady level which would produce
the same sound energy over a stated period of time as
the specified time-varying sound. Useful for studying
long-term trends in environmental noise. A single
number is used to define an entire measurement
session.
F-12
Sound Lab TDS :
Glossary
L
-
level exceeded No/o
Ln (noise measufement)-The
of the time,
of the time, e.g.L90,the level exceeded900/o
is commonly used to estimate ambient noise level.
level:The
degree of intensity in dB of an audio signal.
liveness-A
subjective description of a room related
primarily to the average reverberation time of the
middle octaves centered at 500 and 1000 Hzandto the
balance between the direct and reverberant sound
levels. It is also related to the volume of the room
relative to the audience area.
L
lowpass filter- A filter that passesfrequencies below
a certain frequency and attenuates frequencies above
that same frequency. A high-cut filter.
fliean free path-The
average distance traveled by
sound between successive reflections.
part of a sound field, usually within
near fielFThat
about two wavelengths from a sound source, where
there is no simple relationship between sound level
and distance.
NC cuvds)-Noise
criteria curves.
measure of how
modulation transfer functiorpA
well the amplitude modulation (variation of intensity
with time) of a signal is preserved when the signal is
sent through a particular transmission chain. Research
has shown that a good portion of the intelligence in
F-13
Sound Lab TDS :
Glossary
=
human speech is contained in the modulation of the
Preserwation of the speech
speech waveform.
modulation patterns is important to maintain high
intelligibility. Noise, echoes, and reverberation are
found to decrease the effective modulation of the
speech waveform and hence impair intelligibility.
,SeeSTI and RASTI
plot of the tip of a vector that is
Nyquist display-A
changing in both length and angle as the frequency
sweeps. The length of the vector is proportional to the
magnitude of the energy, and the angle of the vector
represents the phase of the signal. In 3-D space, the
Nyquist Curve is like a corkscrew, or a spiral when
viewed end-on, with the frequency axis pointing
directly towards us.
" .. Je I and imaginary components plotted as a
rotating phasor. These a'reextremely useful in showing
the partitioning of kinetic and potential energies
frequency by frequency. Energy lying on the imaginary
axis (vertical) is kinetic. Energy lying on real axis
(horizontal) is potential energy. The ratio of imaginary
to real is the ratio of kinetic to potential energy attl:rat
frequency." Don Dauis
interval befween any two frequencies
octave:The
where the upper frequenry is twice the lower frequency.
octave-the interval between any two tones whose
frequency ntio is 2:1,.
offset, time offsef-ssg;
F-14
receive delay
Sound Lab TDS :
Glossary
off-axis-Not
loudspeaker.
=
:
directly in front of a microphone or
off-axis coloratiorpln
a microphone, the deviation
from the on-axis frequency response that sometimes
occurs at angles off the axis of the microphone. The
coloration of sound (alteration of tone qualiry) for
sounds arriving off-axis to the microphone.
PFC (Phase Response)-Phase
versus frequenry display.
frequency curve. Phase
peak---On a graph of a sound wave or signal, the
highest point in the waveform. The point of greatest
voltage or sound pressure in a cycle.
peak amplitude-On
a graph of a sound wave, the
sound pressure ef the waveform peak. On a graph of
an electrical signal, the voltage of the waveform peak.
perioilThe
time between the peak of one wave and
the peak of thb next. The time between comesponding
points on successive waves. Period is the inverse of
frequency.
phase-Phase is the measure of progression of a
periodic 'wave. Phase identifies the position at any
instant which a periodic wave occupies in its cycle.
Phase describes the progress of a waveform in time
relative to some stafiing point. If amplitude is plotted
perpendicular to a time axis, phase may be represented
'When
cwo sinusoidal
as a position along the time axis.
signals of the exact same frequency track each other
F-15
SoundLabTDS:
Glossary
=
exactly in time, reaching their maximum, minimum
andzerovalues in synchronization, they are said to be
in-phase. If they are not synchronized, then it is as if
one signal is delayed with respect to the other and there
is a phase difference. Phase is measured in degrees or
radians. Phase is frequency and time dependent.
Phase measurements are the most precise indicators of
alignment.
phase interference:The
phase cancellation,
components of a
frequenry
cancellation of certain
signal that occurs when the signal is combined with its
delayed replica. At certain frequencies, the direct and
delayed signals are of equal level and opposite phase
(180 degreesout of phase), and when combined, they
cancel out. The result is a comb-filter frequenry
response having a periodic series of peaks and dips.
Phase interference can'occur between the signals of
two microphones picking up the same source at
different distances, or can occur at a microphone
picking up both a direct sound and its reflection from
a nearby surface. Phase cancellation also occurs when
two time-offset speaker drivers play the same frequency.
phase shift-Phase difference in degrees of phase
angle between corresponding points on two waves. It
is the fraction of a cycle by which one of the waves
would have to be moved along the time axis to make
the two waves coincide. One quantity is considered
leading or lagging the other by the phase difference.
F-16
Sound Lab TDS :
Gtossary
=
pink noise-A test signal containing all frequencies
(unless band-limited), with equal energy per octave.
Pink noise is a test signal, usedwith real time analyzerc,
for equalizing a sound system to the desired frequency
response, and for testing loudspeakers.
pitch--The subjective lowness or highness of a tone.
The pitch of a tone usually correlates with the
fundamental frequency.
polar pattern-The
characteristie- pattern of a
microphone and loudspeaker. A graph of microphone
sensitivity plotted vs. angle of sound incidence. Some
examples of polar patterns are omnidirectional,
bidirectional, and unidirectional.
Subsets of the
unidirection al pattern are cardioid, supercardioid, and
hypercardioid patterns.
polarity-The
positive or negative direction of an
electrical, acoustical, or magnetic force. Two identical
signals in opposite polarity are 180 degrees aparl at all
frequencies. Polarity is not frequency dependent.
post processing flaf4.-p166essing
results after performing test sweeps.
measurement
precedence effect-The
effect of two sounds,
approximately 20 milliseconds apart, that are coming
from two places but which we localize to be at the
location of the earlier arriving sound.
pre-delay4hort
for pre-reverberation delay. The
delay (about 30 to 100 milliseconds) between the
F-17
Sound LabTDS :
Glossary
=
arrival of the direct sound andthe onset of reverberation.
Usually, the longer the pre-delay, the greater the
perceived room size.
propagation-The
medium.
travel of sound waves through a
purewaveform-A
waveform of a single frequency;
a sine wave. A pure tone is the perceived sound of such
a wave.
Q :The ratio of the sound pressure squared at a
distance r in front of a source to the sound pressure
squared, averaged over a1l directions. A source that
radiates equally in all directions (spherical source) has
a directivity factor Q of 1. A hemispherical source has
Q of 2; a source in a corner (which radiates into onequarter of a sphere) has"a Q of 4, etc.
RASTI-Rapid Speech Transmission Index expressed
"Excellent."
in a decimal range of 0.2 for "bad' to 1.00for
This method of evaluating speech intelligibility is based
upon the method of the Speech Transmission Index
(STI). Perfect transmission of speech implies that the
speech envelope at the listener's position replicates the
speech envelope at the speaker's mouth. Speech
intelligibility can be quantified in terms of the changes
in the speech envelope as a result of noise and
reverberation in the room. In TEF, an equivalent of the
RASTI method is achieved by testing only at the 500H2
and 2 kHz octaves.
F-1I
Sound Lab TDS :
Glossary
=
RT.o (Reverberation
time)-The time in seconds for
the reverberant sound field to decay 60 dB after the
sound source is shut off. It is calculated by measuring
the rate of decay over at least the first"25 dB to 30 dB
of decay and extrapolating what the RTuowould be if
the decay continued at that rate.
portion of a sound wave in which
rarefaction:The
molecules are spread apart, forming a region with
lower-than-normal atmospheric pressure. The opposite
of compression.
receive delay-In TEF, the difference in time between
the start of the sweep and when the analyzer starts
looking for it.
reflection-The
bouncing or return of a sound wave
from an object lryer than one quafter wavelength of
the sound. \7hen the object is one quarter wavelength
or slightly smaller, it also causes diffraction of the
sound (sound,bending around the object).
refraction-The
change in direction of a sound wave
that occurs when sound passes from one medium to
another (from air to glass, to air or through layers of
air with different temperatures).
reinforcement-Seer
sound reinforcement
relative phase--The phase of one sine wave compared
with another.
resolutior#The
amount of detail we are able to
resolve, or see, in the quantlty that we are measuring.
F-1I
SoundLabTDS:
l?lneeanv
t
:
-
resolution, frequency-Amount
of detail we are able
to resolve, or see, in the frequency domain. Measuring
with 1 kHz of resolution will smear any details that have
a repetition in less than 1 kHz. The effect of poor
resolution on a frequency response curve is to smooth
it out and minimize peaks and valleys. If we wish to
increase frequency resolution to its highest possibility,
we would use a receiver of infinite bandpass and
infinite time window and a transmitter of pure sinewave signals. The receiver could then, at any time
during the measurement, hear any single frequency,
butwould have zero time information.
resolution, time-The amount of detail you are able
to resolve, or see, in the time domain. Increasing the
time resolution (making the time window smaller) will
have the effect of decreasing the space-window ellipsoid.
This will decrease the frequenry resolution, since the
units of time and frequency are reciprocals of each
other. In making TEF measurements,time and frequency
resolutions are adjusted by selecting appropriate
combinations of sweep rate and filter bandwidth. This
limits us to those frequencies that develop at least one
wavelength within that time span.
lss6nanss-A
maximum response to an applied
frequency; a peak in the frequency response. Resonance
exists between a body or system and an applied force
if any small change in frequency of applied force
causesa decreasein amplitude of the respondingbody.
F-20
Sound Lab TDS :
Glossary
=
frequency at which
resonance frequency:The
resonance occurs. Of a traveling wave, resonance
frequency is the change in amplitude as the frequency
of the wave approaches or coincides with a naln;ral
frequency of the medium.
reverberant
sounL,See:
reverberant sound field.
persistence of sound in a room
reverberation:The
after the original sound has ceased. It is caused by
multiple sound reflections (echoes) that decrease in
intensity with time, and are so closely spaced in time
as to merge into a single continuous sound, which,
eventually, is completely absorbed by the inner surfaces
of the room. The timing of the echoes is random, and
the echoes increase in number as they decay.
An example of reverberation is the sound you
hear just after you shout in an empty gymnasium. An
echo is a discrete repetition of a sound, while
reverberation is a continuous fade-out of sound. Artificial
reverberation is reverberation in an audio signal created
mechanically or electronically rather than acoustically.
sound field made of
reverberant
sound field-A
reflected sounds in which the time averageof the mean
square sound pressure is everywhere the same and the
flow of energy in all directions is equally probable.
This requires an enclosed space with essentially no
acoustic absorption.
L
F-2'l
SoundLabTDS:
Glossary
=
reverberation
time-See.' RTuo(Reverberation time).
room mods5 -plsqusncies at which sound waves in
a room resonate (in the form of standing waves), based
on the room dimensions.
room titne-See:
RTon(Reverberation time).
root (nean square:The effective dc voltage of an ac
signal. The square root of the mean value of the
squares of the instantaneous values of a varyrng
quantity. In periodic variatron, the mean is taken over
one period.
Sabin-a unit of absorption equal to the absorption of
1 squarefoot of surfacewhich is totally sound absorbent.
Schroeder
integration
of reverberation-An
integration of reverberant data in which the last energy
is integrated first and the initial arrival is integrated last,
all ofwhich is normalized by the total. The integration
simulates the effect of taking many time measurements
and averaging them together.
signal delay{commonly,
but inaccurately called
time delay) The difference in arrival times between two
signals. A signal delay is also a device for delaying a
signal.
F-22
SoundLab TDS::
Glossary =
:
ratio in decibels between
signal-to-noise ratio-The
signal and noise. An audio component with a high
signal-to-noise ratio has little background noise
accompanying the signal; a component with a low
signal-to-noise ratio is noisy.
sine wave-A wave following the equation y : sin x,
where x is degrees andy is voltage or sound pressure
level. The waveform of a single frequency.
sone-a unit of loudness. It is defined as the loudness
of a 1000 cycle tone 40 dB above threshold. A millisone
is one-thousandth of a sone and is often called the
loudness unit.
sound-Energy that is transmitted by pressure waves
in air or other materials and is the objective cause of the
sensation of hearing. Longitudinal vibrations in a
medium in the frequency range 20 Hz to 20,000 Hz.
sound absofptior#The
change of sound energy into
some other form-usually heat-in passing through a
medium or on striking a surface.
sound decay-The
equilibrium.
dying of sound energy to
rate of flow of sound energy
sound intensity:Ihe
through a unit areain a specifieddirection. The watt
per squaremeter is the unit of sound intensity.
L
F-23
Sound Lab TDS:Glossary
=
sound level-a
term applied to data taken on
instruments which meet the specifications for sound
level meters drawn up by the American National
Standards Institute (ANSI).
apparatus for estimating the
sourrd level meter-an
equivalent loudness of noise by an objective method.
soundpower:The
by a source.
total sound power in watts radiated
sound pressrre level (SPL)-Sound pressure level,
in decibels, of a sound is 20 times the log to the base
10 of the ratio of the pressure of this sound to the ref
oressure Pref.
dB SPL : 20 log (P/P ref.),
where P ref : 0S0002 pascal.
The value of pref should always be stated. A common
reference pressure used in connection with hearing
and the specification of noise is 0.00002pascals.
sound reflections-See:
refl ections
periodicvariations in sound pressure
soundwav#The
radiating from a sound source.
spacewindow-An
ellipsoid spacearound the speaker
and microphone, inside of which sound reflections are
included in the measurement. The speaker and
microphone ^re at the foci of the ellipsoid. Sound
reflections originating at the edge of the space window
arc attenuated 3dB and more distant reflections are
attenuated by greater amounts.
F-24
Sound Lab TDS :
Glossary
L
=
On the TEF analyzer, the space window is determined
by setting the bandwidth and sweep rate. For example,
a 1O-footspace window corresponds to a bandwidth of
BB.5Hzat a sweep rate of 10,000Hz/second at a sound
velocity of 1130 feet per second at room temperature.
Formula: B = SD/C where B = bandwidth of the
tracking filter in Hz
S : sweep rate in Hz/sec
D : space window in feet
C = speed of sound, 1130 feet/sec
The larger the space window, the lower the frequenry
that can be measured accurately. That is, the frequency
resolution increases as the space window increases.
Therefore a relatively large, empty room is needed for
low-frequency measurement.
measure of sound clarity
speech inte[igibility-A
that indicates the ease of understanding speech. It is a
complex function of psychoacoustics, signal-to-noise
ratio of the sound source, and direct-to-reverberant
energywithin the listening environment. It is a function
of signal level even in the presence of noise or
reverberation. Intelligibility is at a maximum with
sound pressure levels from about 70 to 90 dB, with a
small decline in intelligibility at higher levels. Below 70
dB, intelligibility begins to decline, and it falls off
rapidlywith sound pressure levels below about 40 dB.
L
F-25
Sound Lab TDS :
fllnqqanr
l
:
-
:
distribution of effective sound
spectrum-The
pressures or intensities measured as a function of
frequency in specified frequency bands; the display of
a signal in the frequency domain. The output vs.
frequency of a sound source, including the fundamental
frequency and overtones.speed (of sound)-1110
feet per second at20 degreescentigrade.
refl ections of sound
specular reflections-Mirrorlike
from a flat surface. Reflections that do not spread out.
speed (of sound)-in
degrees centigrade.
ak,1130 feet per second at 20
use of a sound system
speech reinforcement:The
intelligibility or
increase
speech
in an environment to
sound power level.
SPL-.See; sound pressure level.standing wave-An
apparently stationary waveform, created by multiple
reflections between opposite room surfaces. At certain
points along the standingwave, the direct and reflected
waves cancel, and at other points the waves add
together or reinforce each other. These are sometimes
called room modes.
starting frequency of a sweep.
start frequency-The
Traditionally noted in equations as F1.
ending frequency of a sweep.
stop frequency-The
Tradttionally noted in equations as F2.
F-26
Sound Lab TDS :
Gtossary
=
single number
STI Speech Transmission Index-A
that indicates the effect of a transmission system on
speech intelligibility. A full STI test is accomplished by
measuring seven individual one-second time-span ETC's
at each of seven octave center frequencies between1,25
Hz and 8 kHz. After each ETC test, the modulation
transfer function (MTF) is calculated and the STI in each
octave band is computed. The TEF test generator level
at each octave band is adjusted to match the average
spectral content of speech. At the conclusion of the
test, the overall STI value is computed by taking a
weighted average of the individual octave band STI
values. see : speech intelligibility.
L
STC-Standard Transmission Class. A single number
rating for describing sound transmission loss of a wall
or partition.
rate in Hz/second of a TEF sweep.
sweep rat#The
It is the measure of howfastfrequenry is changingwith
respect to time.
sweep time--The
duration of a TEF sweep.
swept sine wave-A sine wave made to vary uniformly
in frequenry from low to high or high to low. A
frequency-modulated sine wave.
F-27
SoundLab TDS :
Glossary =
-
method, conceived
TDS tirne delay spectfometry-A
by Richard Heyser, that permits a spectrum that has
been delayed to be measured with the signal delay
removed. TDS measures in the frequency domain,
then transforms the results mathematically for
interpretation in the energy, frequency or time domains.
In general tems, TDS is a way to measure energy
passing through a system. TDS measurements describe
what effect the system has on the energy passing
through it. The results tella greatdeal about the energy
as well as the system. The princip al advantagesof TDS
measurementsare superior noise and distortion rejection
properties, fast data gathering capability, and the
ability to make acoustical measurements under actual
use situations. In addition, TDS measurements easily
handle test situations in which signal delays and
nonlinearity are an inherent part of the system. Accurary
in TDS measurements depends on accurate
measurement of both energy and time. Time delay
spectrometry measurements include the frequency
response, phase response, and time response data
associated with other techniques, plus energy-time
curves, and energy+ime-frequency curves (3-D graphic
display.)
metaphor for envisioning how TEF
TEF cube-A
displays time, energy, and frequency data.
TEF measurements, the 3-D display
l-D display-In
shows the change in magnitude/frequency response
versus time for a number of individual TDS sweeps.
Each sweep is offset in time by a constant amount, and
on the screen form a three dimensional surface display.
The three dimensions are time, energy and frequency.
F-28
SoundLab TDS :
Glossary :
-
\-
time delay gap-A
signal delay. The subjective
judgment by a listener of how live or dead a room is
does not depend on the reverberant sound field but
rather on the initial time delay gap and the ratio of
direct sound level to the earlv reflection level. See:
initial time delay
time domain-In
TEF measurements, that portion of
the "TEF cube" in which time is the independent
variable. Time domain measurements are made with
time runninghorizontally along the axis.
time resolutiott-See:
L
resolution, time.
time span--The time during which we listen for the
effects of the signal on the device under test, and vice
versa. It is shown in TEF (ETC) measurements as the
amount of time on the X axis on the screen. It is
dependent on the.frequency span of the sweep and the
number of data points displayed.
timewindow-Arange
of time overwhich signals are
accepted by the analyzer. The relation between time
window, bandwidth, and sweep rate is T= B/S, where
T : width of time window in seconds; B : bandwidth
inHz, and S= sweep rate in Hz/ sec. see..space window
two-port fneasufemenf-Nlg25rlrement
of a system
by comparing its output signal to its input signal.
velocity-distance
elapsed.
traveled, multiplied by the time
F-2S
SoundLab TDS :
Glossary =
::::
wavelengthA wavelength is the distance traveled
by a wave in a time of one cycle. The distance
measured along the direction of propagation between
two points which are in phase on adjacent waves. Low
frequencies have long wavelengths; high frequencies
have short wavelengths.
graph of a signal's sound pressure or
waveforrn-A
voltage vs. time. The waveform of a pure tone is a sine
wave.
weighted-Referring
to a measurement made through
a filter with a certainspecified frequenry response. An
A-weigtrted measurement is taken through a filter that
simulates the frequency response of the human ear at
low levels.
F-30
I
Sound Lab TDS :
Best Resolution and the :
:lEr resoluElon v
Appendix G: Best FrequencyBesolution
and the TEFBesolution V
Fanel M. Becker
Turning on Best Frequency Resolution in the TDS
module's Frequency Parameters menu causes the
computer to automatically set the TDS parameters such
that your measurements will always have the best
possible frequency resolution for the sweep time that
you have selected. The longer the sweep time, the
better the frequency resolution will be. To understand
why this is so, let's review some terms and then look
at what we call the TEF Resolution V.
The frequencyresolution of a measurement determines
the lowest frequencythatwe can measurewith accuracy
as well as how much detail we can see. A lower
If we make a
number yields better resolution.
measurement with a frequency resolution of 1000 Hz,
then anyfeature (a notch orbump) that is lessthan 1000
'S7e
will not see it
Hz wide will not be fully resolved.
it
It
may
up,
but
may appear
accurately.
sti1l show
smoother than it really is. If we change the frequenry
resolution to 500 Hz Oower number therefore better
resolution), we will get a clearer image.
Remember that aswe increase the frequency resolution
(smaller number) the timeresolution decreases(bigger
number). Sowhile we have better frequency resolution
andcan see more detail, we are no longer able to reject
reflections quite as well. In practice we must always
G1
Sound Lab TDS :
Best resolution and the :
TEF Hesolution V ':
find a huppy compromise between the time and
frequency resolutions.
As you change the frequency resolution in th e Frequency
Parameters ntenL!' you will notice that the Bandwidth
value changes as well. Remember, that the frequency
resolution is notequalto the bandwidth of the filter. In
the TDS process, the bandwidth of the sweeping filter
along with the speed at which it sweeps-the sweep
rate-determines the resolution of the measurement.
For TDS the frequency resolution (R) is equal to the
sweep rate (SR) rnHz/s (hertz per second) divided by
the bandwidth (BV) inHz:
RT=sR/B\r
As you change the resolution, the computer calculates
a new bandwidth that will yield the resolution you
requested for the current sweep rate. (The sweep rate
being determined by the Start Frequency, Stop
Frequency and Sweep Time). The better the frequency
resolution (smaller number), the larger the bandwidth.
Intuitively, you would think that to increase the
frequency resolution you would have to reduce the
bandwidth of the filter. This would allow you to look
at a narrower portion of the spectrum. This is true for
conventional swept spectrum analysis but not forTDS.
Let's look at what goes on as you change the
bandwidth of the filter.
G2
Sound Lab TDS :
Best Besolution and the :
::::
Itrr resotuuon v
In Illustration G-1 the TEF Resolution V is a graph, in
the shape of the letter V, that shows how the frequency
and time resolutions vary with the bandwidth of the
sweeping filter and a fixed sweep rate. The vertical
scale of the graph shows frequenry resolution in Hz on
the left side and time resolution in seconds on the right
side. The horizontal scale is the bandwidth of the filter.
Note that the horizontal scale is logarithmic. This is
done sothe Vshaped curvewill appearto be symmetric
about the center of the graph. The bandwidth at the
center of the horizontal scale is equal to the square root
of the sweep nte and is marked Sqrt(SR). This
particular graph uses a sweep rate of 10,000 Hzls.
Therefore, the bandwidth at the center of thehorizontal
scale is 100 Hz-the square root of 10,000. Bandwidth
values to the left of center are less than the square root
of the sweep rate and values to the right are greatet.
o
6
d
tr
<sqrt(sR)
lF Bandwidh
Illustration G-I
Tbe TEF Resolution V
|
>sqrt{sR)
0og scal6)
G3
Sound Lab TDS :
Best resolution and the :
:
lEl- HesoluElonv
The frequency resolution is shown by the V shaped
curve marked Rf that starts in the upper left corner,
curves down to the center of the graph and then curves
back up to the upper right corner. The time resolution
is shown by the curve marked Rt and follows an
exponential path (becauseof the logarithmic horizontal
scale) from the lower left side of the graph to the upper
right (actually lying directly below the frequency
resolution curve to the right of the square root of the
sweep rate). This tells us that the time resolution
decreases(number gets bigger) linearly asthe bandwidth
increases.
The frequency resolution however behaves differently.
As you can see in the graph, if we start with a
bandwidththat is lessthan the square root of the sweep
rate, the frequency resolution will increase (smaller
number) as we increasethe bandwidth until we reach
the point where the bandwidth is equal to the square
root of the sweep rate. As we continue to increase the
bandwidth beyond the square root of the sweep rate,
the frequency resolutio n decreases. The BestFrequency
Resolutionis equal to the square root of the sweep rate
and occurs where the bandwidth is also equal to the
'Why?
square root of the sweep rate!
Notice that the left side of the graph is labeled TDS and
the right side is labeled Conventional with the square
root of the sweep rate being the dividing line. This
indicates that as long as the bandwidth is less than or
equal to the square root of the sweep rate we are doing
TDS. If however, we set the bandwidth to a value that
is greater than the square root of the sweep tate, we are
no longer doing TDS but are instead performing
G4
Sound Lab TDS :
Best Besolution and the :
I Er resoluaon v
conventional swept spectrum analysis. On the TDS
side we have the advantage of a time resolution that is
the reciprocal of the frequencyresolution (the frequency
resolution is equal to 1 divided by the time resolution)
and allows good time selectivity. On the conventional
side, while we can still get the same frequenry resolutions
that we can on the TDS side, but we cannot get good
time resolution.
By turning on Best Frequency Resolution in the
Frequency Para.rnetersrnenu,you automatically set the
bandwidth to the square root of the sweep rate and
obtain the best possible frequency resolution for the
cuffent sweep rate.
Suppose t1ireBest Frequency Resolution isn't good
enough. How can you get a better frequenry resolution
than the "Best?" Jou simply increase the sweep time.
As you increase the sv/eep time, and therefore decrease
the sweep rate, the bandwidth will automatically be
feset to the square root of the new, slower sweep rate
yielding a new "better" frequency resolution..
\fhen should you use Best Frequency Resolution?
Generally, for acoustic measurements, loudspeaker
frequency responses, etc., you would not use it.
Looking at the graph you can see that when you have
a very high frequency resolution (small number) the
time resolution is very poor (large number). This
usually allows reflections into the measurement. So,
for acoustic measurements, you will generally set the
time/frequency resolutions to reject any reflections.
G5
Sound Lab TDS : ::
Best resolutian and the
TEF Besolution V -
For electronic measurements, frequency responses of
equalizers, loudspeaker impedances, etc., you will
almost always want to use Best Frequency Resolution.
You always want the Best Frequency Resolution yort
can get. In acoustic measurements we are limited by
the arrival of reflections. In electronic measurements
the are no reflections! Nowwe can turn BestFrequency
Resolution on and set the sweep time to get the
frequency resolution that we want. This way we get the
desired frequenry resolution with the shortest possible
sweep time.
one final note on sweep rate and bandwidth. The
current values are always shown at the bottom of the
Frequency Parameters rnenu. You can set them
manually if you want to. There really is no reason to
do so however. What we are really interested in is the
time/frequency resolution that results from the sweep
rate andbandwidth. Set the sweep time and resolution
that you want and let the computer do the work of
setting the sweep rate and bandwidth.
G6
Sound 16fo:
Bibtiography
=
Bibliography
The following bibliographyreferences materials on the
subjects of acoustics, measurement, time delay
spectrometry, perception, and recording techniques.
Glen M. Ballou., ed. Handbookfor Sound
Engineerc. Tbe New Audio Cyclopedia. Carmel,
Indiana: Howard \[r. Sams, 1991.
Bruce Bartlen. Introduction to Professional
Recording Tecbniques. Carmel, Indiana: Howard
'S7.
Sams, 1987.
Leo L. Beranek. Acottstical MeasLtrements,Reu. ed.,
Cambridge, Massachusetts: Published for the
Acoustical Society of America by the American
Institute of Physics. 1988.
Lothar Cremer, Helmut A. Miller, Theodore J.
Schultz. Prirtciples E Applications of Room
Acoustics. Essex, England: Applied Science
Publishers, Ltd., 1.978.
MalcomJ. Crocker. Noise Control. New York, New
York: Van Nostrand Reinhold Co.,1982,
L
Don Davis and Carolyn Davis. Sound System
Engineering. Indianapolis, Indiana: Howard W.
Sams,1989.
Sound Lab :
Bibliography
=
J.R. Hassail, and K Zaveri. Acoustic Noise
Measuremeafs. Narom. Denmark: K. Larsen &
Sons, A/S. 1979.
Richard C. Heyser. Time Delay Spectrometry,An
Antbologl,t of tbe Works of Ricbard C. Heyser on
Measurement, Analysis, and Perception. New York,
New York: Audio Engineering Sociefy, Inc., 1988.
Peter Mapp. Tbe Aud.io SystemDesigner Tecbnical
Reference by Klark-Teknik Plc.
Harry B. Miller. Acoustical Measurenlents, Volume
L6, Meth ods and Instruntentation. Stroudsburg,
Pennsylvania: Hutchinson Ross Publishing Co.,
1982.
Michael Rettinger. Acoustic Design E Noise Control,
Volume 1. New York, New York: Chemical
Publishing Co., Inc., 1.977.
Earl D. Schubert. Psycbological Acoustics, Volume
-23. Stroudsburg, Pennsylvania: Dowden,
Hutchinson & Ross,Inc.,1979.
\/
Sound Lab TDS-:
tndex
=
Index
L
Symbols
(more) 4-2
3D (\raterfall)
Auto Scaling 4-55
Bottom of Scale 4-55
Curveorder 4-55
display 4-43
measurements 5-27
Parameters 4-30
Perspective 4-55
Top of Scale 4-55
3D End Delay
cursor button 5-29
3D StartDelay
cursor button 5-29
A
About 4-1, 4-9
acoustic
center,origin F-1
action buttons 3-7
Add Noise to STI RASTI 4-59
Adjust colors 4-66
Alcons 5-25
definition F-3
measuring with ETC 5-34
setting the cursor 6-30
Alt-Beep 4-72
Alt-Brief 4-3
Alt-Close 3-7, 4-3
Alt-Full 4-3
Alt-Info 4-3
Alt-Mouse 4-72
Alt-Prinr 4-3
Alt-Undo 3-7, 4-L5
ambient noise F-1
amplitude, peak F-1.5
analyzer F-2
anechoic F-3
Arow keys 3-2
articulation loss of consonants. See
ALcons
ASCII
3D file format E-25
ETC file format E-2
NC ASCII files E-6
RASTI file format E-13
Saving TDS files as 4-5
TDS file format E-9
attenuate F-3
Auto Repeat 4-1,3
Auto Scaling 4-45, 4-69
4-55
3D (Vaterfall)
'
Frequency Response 4-48, 449, 4-50, 4-51
Time Response 4-44
Average 4-13
Averaging
Magnitude 4-38
Measurement type 4-36
Number of Sweeps 4-35
Pause Between Sweeps 4-35
Test Sequencing 4-37
Vector 4-38
index-1
Sound Lab TDS:: -:
.
lndex
:
::
B
Back to Front, JD 4-56, 4-71.
band-passfilter F-3
Bandwidth
6(3D) 4-32
(TDS) 4-22, 4-25
definition F-3
Optimum 4-21,
sweeprate B-10
Baseaddress 4-82
Baud Rate 4-81
Best FrequencyResolution
(3D) 4-31.
(TDS) 4-2r, 4-25
Binary, savingTDS files as 4-5
Bottom of Scale
3D (Vaterfall) 4-55
FrequencyResponse4-48,
4-49, 4-50
Time Response 4-44, 4-45
c
Calibration 4-76
equipment arrangement 5-15
talker/speaker 5-1.4
CenterFrequency(ETC) 4-1,6
Channel 4-74
ClearA11 4-5
Colors 4-65
COM port 2-3
coMl 4-81.
coM2 4-87
comb filter F-4
commands 3-1,
index-2
Communication 4-8I
complex wave F-4
compression F-4
Configuration 4-1, 4-7
coverage F-4
coverage angle F-4
crest factor F-4
critical
distance F-4
frequenry F-4
Cursor 4-53
rclative 4-55
to examine data 5-1,1,
Cursor is OFF D-2
Curve Order
3D (Waterfall) 4-55, 4-56, 4-71.
Customer support 1-5
D
data
display options 4-41.
irtterpretation C-1
storage
disk, directory 4-4
dB. Seedecibel
DC Shift Trigger 4-34
deadness F-5
decay rate F-5
decay time F-5
decibel F-5
delay F-5
destination drive:\path 2-2
Difference 4-41, 4-5L
diffraction F-6
diffuse field F-6
Sound Lab TDS:lndex
L
L
diffuser F-6
diffusion F-6
direct sound F-6
Direct to ReverberantEnergy
Itario 6-29
disk drives. Seedrive and directory
display,calibrating 6-5
Display menu 4-41,
3D (\Taterfall) 4-55, 4-56
Add Noise to STI RASTI 4-59
Adjust colors 4-68
Alt-Beep 4-72
Alt-Mouse 4-72
Cursor 4-53
Difference 4-61,
FrequencyResponse4-42,
4-47, 4-48, 4-49, 4-50, 4-51.
NC 4-57
Overlay 4-60
RT60cursor 4-66
STI 4-58
Time Response 4-42, 4-44, 4-45
Display Rotation,Nyquist 4-5I,
4-70
Distanceresolution
€D) 4-31
(TDS) 4-2L
DistanceUnit 4-77, 4-80, 5-5
Do 3D Test 4-1,3
Do Average 4-I3
Do FrequencyTest 4-1.1.
Do NoiseTest 4-I1, 4-43
Do RASTITest 4-12
Do STITest 4-12
Do Time Test 4-1,1,
Doing Noise Test D-3
=
:
domain F-5
doppler effect F-6
Drive & Dir 4-1,, 4-4
drive and directory
changing 4-4
default 2-2
E
early decaytime 6-25, 5-28,
5_33,F_7
ear$ RT60 5-24
early sound F-7
Echoes A-7, F-7
edit field 3-5
EE,EEPROM 4-1,
EFC F-7
ellipsoid B-12, F-7. Seealsospace
window
6nd ReceiveDelay
(3D) 4-32, 5-28, 5-30, 6-29
Energy FrequencyCurve F-7
Enter key 3-7
Equipment arrangement
ETC 5-4
STI calibration 5-15
STI/RASTI tests 5-18
TDS 6-4
Erase 4-I, 4-7
Error codes. SeeMessages
Escapekey 3-7
ETC
definition F-B
display 5-3
file format E-2
measurement 5-2
Extensions 4-5
index-S
Sound Lab TDS:tndex
F
far field F-B
FFT B-4, F-8
File format
3D files E-25
ETC ASCII files E-2
NC ASCII files E-6
STI and RASTI E-73
TDS ASCII files E-9
File menu 4-1.
About 4-9
Configuration 4-7
Drive & Dir 4-4
Erase 4-7
Go to 4-9
Open Old 4-2
Printer settings 4-B
Quit 4-9
Save as 4-4
file size 4-3
filenames, extensions 4-2, 4-6
filter
bandpass F-3
highpass F-11
lowpass F-1.3
flutter echo F-8
focused reflections F-8
Fourier transform B-4, F-9
free field F-9
Frequenry
Center (ETC) 4-76
defined A-4
Limits, Start and Stop 4-17
Resolution F-9, F-20
index4
(3D) 4-31
(rDS) 4-21.
Best(TDS) 4-21.
responseF-10
Span B-9, F-10
(ETC) 4-17
Start F-26
(3D) 4-30
(ETC) 4-T6
(TDS) 4-20
Stop F-26
(3D) 4-30
(ETC) 4-15
(ms) 4-20
Frequency Response
(TDS) Parameters 4-20
Bottom of Scale 4-5L
Display
Heyser Spiral 4-42
Magnitude 4-42
Nyquist 4-42
,'Phase
4-42
Graph, Nyquist 4-51,
Nyquist 4-51,
Iest )-o
Top of Scale 4-51.
Front to Back, 3D 4-55
FTC F-10
full scale time F-10
function keys 3-7
fundamental F-10
=
Sound Lab TDS :
lndex
\-.
G
Gain definition F-10
Go to command 3-8, 4-9
Graph
Nyquist 4-51.
Size 4-B
H
Hamming window
4-IB
harmonic F-10
Help from Techron 1.-5
hertz F-11
heterodyning F-11
Heyser Spiral
FrequencyResponse 4-53
Time Response 4-42, 4-46
Heyser spiral display 4-53
HI base address 2-4
HI communication 4-82
highpass filter F-11
Horizontal Scale
3D (sraterfall) 4-55
FrequencyResponse 4-48,
4-49, 4-50
Linear, Log 4-48
Host Interface 2-3
F-11
Hz-Abbreviation
I
impulseresponse F-11
input hardware,setting 6-5
Input menu 4-73
Calibration 4-75
DistanceUnit 4-80
PropagationSpeed 4-79
=
Reference Unit 4-78
Volts per Reference Unit 4-78
Zero dB Reference Value
4-78
Communication 4-81
Baud Rate 4-81.
HI Base 4-81
Port 4-BI
Settings 4-74
Channel 4-74
Input 4-74
Loopback 4-74
Installing 2-1.
Integration Time, Noise Test 4-27
interrelated parameters 4-20, B-B
J
job description, printing
4-3
K
Keyboard, test sequencing
4-34
L
Lden F-tz
Ldn F-72
Leq F-I2
level F-13
Line Output, Noise Test 4-27
Linear regression line, RT 50 5-29
linear scale 4-48
liveness F-13
Ln F-1,3
logarithmic scale 4-48
Loopback 4-74
loudspeakers, measuring 5-28
lowpass filter F-1.3
SoundLabTDS:
tndex
=
M
Magnitude. See alsoFrequency
response: magnitude
Averaging 4-38
Measure menu 4-77
Do 3D Test 4-13
Do Average 4-1,3
Do Frequency Test 4-1t
Do Noise Tesr 4-J,1,
Do RASTI Test 4_1.2
Do STI Test 4-12
Do Time Test 4-1.1
Measure Noise, STI/RASTI 4-29
Measurements
3D 5-28
Alcons 6-25
first time 6-1,
Frequency Response 5-6
RT50 6-25
STI/RASTI 5-75
Time response 5-2
two-port F-29
menu title
selecting 3-3
Menus
Display 4-47
File 4-1"
Input 4-74
Measure 4-1I
Parameters 4-75
Message boxes 3-B
Messages
Awaiting the Trigger D-1
Bandwidth D-1
index-6
Can not save +1 D-1
Can't difference D-1
check communications D-2
Cursor is off D-2
Delay before test ## seconds
D-2
Disk eror D-2
Doing noise test D-3
Drive not ready D-3
Error file... D-3
Error in data ftle D-3
Error writing D-3
Files not found D-5
Insufficient disk space D-4
Invalid path D-4
Loading... D-4
Measure halted D-4
Meaeurement interrupted D-4
Min : 0 Max : 60 D-4
No data available D-5
No data cuffent D-5
Not enough memory D-6
Obtain STI data D-5
Parameters changed D-7
Path/filename exists D-5
Performing fft D-7
Receiving data D-7
RT50 out of range D-7
Startfrequency should be D-8
Test Interrupted D-B
Test Timed Out D-B
Testing D-8
The printer is not teady D-B
The TEF is not respondingl D-9
Sound Lab TDS :
tndex
There is not data ... D-9
Time span should not exceed
sweep time D-9
modulation transfer function 5-25
modules, changing 4-9
mouse 3-2, 4-41,
MlF. Seemodulation transfer
function
N
NC (Noise)
about the display 5-1.1.
curves 5-1,2
display 4-43, 4-57
file format E-6
measurements 5-1,0
Parameters 4-28
r^ting 5-L2
table or graph 4-57
near field F-13
Noise
adding to STI/RASTI 4-41
ambient F-1,
pink F-17
signal-to-noise ratio F-23
Noise criteria measurements. See
NC (Noise)
noiselesstest 4-I2
Number of Curves (3D) 4-33
Number of Samples
GD) 4-33
(ETC) 4-r7
(TDS) 4-22
Nyquist F-1,4
=
FrequencyResponse 4-51
o
octave F-1,4
Octavesmoothing 4-51,,4-70
FrequencyResponse4-49,
4-50, 4-51
Nyquist 4-51.
off-axis F-15
On-screenmessages D-1
Open Old 4-2
Output
Pink noise 4-39
Port 4-8
Sine'Wavetone 4-39
\fhite noise 4-39
Overlap ratio 5-31,
Overlay 4-4L, 4-60
overload 4-75, 5-11.
P
Parameters 4-1,5
guidelines
FrequencyResponse 4-24
sTr 5-15
Time Response 4-18
interdependent 4-1,5
Menu
3D test 4-30
Averaging 4-36
FrequencyResponse4-20
Noise Test 4-27
STI/RASTI 4.29
Time Response 4-1.5,5-3
parent directory 4-2
index-7
Sound Lab TDS :
lndex
Path, changing 4-4
Pause
Between Curves (3D) 4-33
Between Sweeps, Averaging
4-36
pull-down menu 3-7
Pulse trigger, test sequencing
pure waveform F-18
4-34
o
a F-18
Quick keys 3-2
Quit 4-9
peak amplitude F-15
percent Alcons. SeeAlcons
Performing FFT D-7
Perspective,JD 4-55, 4-71,
R
Phase. SeeFrequencyResponse:
F-1.9
nrefaction
Phase
RASTI
cancellation F-16
converting to ALCONS 5-24
definition F-15
definition F-18
interference F-1,6
file format E-13
relative F-19
Receive Delay B-9
shift F-I5
(ETC) 4-17
Phase and phase shift A-4
(TDS) 4-22
Pink Noise 4-39, F-17
defirfition F-19
polar pattern F-17
sening wirh phase 6-19
polarity F-17
Start (3D) 4-31"
Port 4-81,
Step (3D) 4-32, 5-30
post processing data F-I7
Receiving Data D-7
pre-delay F-77
Reference Unit 4-77, 4-78, 5-6
Preamp Gain 4-75
Reflections A-7
precedence effect F-17
definition F-1.9
Print 4-L, 4-B
eliminating B-2
Printer
finding 6-12
Graph Size 4-8
focused F-8
Resolution 4-B
refraction F-19
Settings 4-1, 4-B
reinforcement F-19
printing
speech F-26
job description 4-3
relative cursor 4-65, 6-12
propagation F-18
relative phase F-19
Propagation Speed 4-77, 4-79, 5-5 required files 2-6
index-B
=
:
Sound Lab TDS :
tndex
Resolution
(3D) 4-31
Best Frequency
(3D) 4-31
(TDS) 4-25
Distance
(3D) 4-31.
(ms) 4-21.
Frequency C-5, F-9, F-20
(3D) 4-31
(ms) 4-21.
measurement B-5
message D-7
printing 4-B
Time F-20
(3D) 4-31.
(TDS) 4-21.
resonance F-20
response
frequency F-10
impulse F-l1
' phase F-15
reverberation A-9, F-21,
Reverberationtime 6-26, A-11.,
F_19
room
measuringwith 3D 5-30
modes A-lL, F-22
time F-22
root mean square F-22
RT60 6-3t, 6-32, p-l.g
calcularion 6-35
cursor 4-55, 4-72
cursor button
=
3D End Delay 6-29
3D StartDelay 6-29
Slope 6-29
TDS delay 5-29
early decay time 6-28
ear$ RT60in STI 5-24
Linear regressionline 5-29
measurements 6-26
out of rangemessage D-7
Schroedercurve 5-28
settingthe cursor 5-28
RT60cursoris on...off D-7
S
Sabin F-22
Save +1 4-6
SaveAs 4-L, 4-4
Schroeder integration 6-28, F-22
serial communication 4-81,
Serial port 4-81.
signal delay. Seereceive delay
sine wave F-23
Sine Wave Tone 4-39
SL directory 2-6
command tree 2-5
SI.BAT 2-6
Slope cursor button 6-29
sone F-23
sound
absorption F-23
decay F-23
definition F-23
discrete arrivals F-6
e iy
F-7
intensity F-23
Sound Lab.TDS::
Index -
level F-24
near field F-I3
power F-24
reverberant field F-zI
speed of F-26
sound level meter F-24
SourceCalibration,STI/RASTI 4-29
space window
B-1,2, B-1,4,
F-24. Seealso ellipsord
span, frequency F-10
Speaker EQ, testing 5-I7
specular reflections F-26
speech intelligibility F-25
Speech Transmission Index F-27
SPL F-24
Standard Transmission Class F-27
Standing waves A-72, F-26
Start Frequency
(3D) 4-30
(ETC) 4-1.5
(TDS) 4-20
Start Receive Delay
3D Tesrs 6-29
3D tests 5-28, 5-30
STI F-27
about the measurement 5-25
Add Noise to STI RASTI 4-59
display 4-43
graph 5-21.,5-22
table 5-21, 5-22
Early RT60 5-24
equipmentarrangement 5-I9
file format E-13
graph or table 4-58
index-1O
noiselesstest 4-1,2
score 5-24
Signal-to-noiseratio 5-24
Stop Frequency
6(3D) 4-30
(ETC) 4-76
(TDS) 4-20
SweepRate B-8, F-27
GD) 4-30
(TDS) 4-20
SweepTime F-27
(3D) 4-30
(ETC) 4-17
(TDS) 4-20
Sweepingthrough zero B-9
swept sine wave F-27
T
TDS
definition F-28
file format E-9
measurements 5-6
parameters 4-20
TDS Delay cursor button 6-29
Telephone numbers 1.-5
Test sequencing
Automatic 4-33
Averaging 4-37
DC Shift Trigger 4-34
Keyboard 4-34
Pulse trigger 4-34
Testing D-8
l-D display F-28
Sound Lab TDS :
tndex
=
Time
delay spectrometry F-28
delay gap F-29
domain F-29
offset F-14
Resolution
3D tests 4-3I, 5-29
TDS 4-27, F-20
Response
(ETC) Parameters 4-1,5
Span F-29
(ETC) 4-17
calculating 4-I8
window
F-29
Time and frequency 6-3
Time Response
center frequency 6-7
display options 4-42
equipment arrangement 6-4
Heyser Spiral 4-46
Magnitude 4-44
parameters 6-1,
set up, loudspeaker 5-2
uses for 5-1,
viewing 6-3
toggle choices 3-6
Top of Scale 4-70
3D (\Taterfall) 4-55
FrequencyResponse4-49,
4-50, 4-51.
Time Response 4-44
V
Vector averaging 4-38
velocity F-29
Volts Per Reference Unit
4-77, 5-5
W
warning beep 4-41"
waveform A-1, F-30
wavelength F-30
weighted F-30
\rhite Noise 4-39
'$Tindow
* (ETC) 4-17, 4-18
space F-24
time F-29
\Vrap
Phase 4-48, 4-50
z
Zero dB Reference Value
Zero sweep rate B-B
4-77, 5-5
L
index-1'l