1
Viewing Historical (Trend) Data
ION Enterprise Administrator’s Guide
Using WebReach
1.
Open Internet Explorer.
2.
Type one of the following into the address bar:
http://<computerName>/ION or
http://<IPAddress>/ION
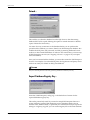
This loads the Network.dgm as the default diagram. There are one or more
labelled grouping objects on the page.
The default virtual root name is ION. If you chose a different virtual root name
when installing WebReach, use that particular name in place of ION.
3.
Click the desired grouping object to load the page containing the links (icons) to
all the meters belonging to that group.
4.
Click the appropriate meter icon. This loads that meter's Vista user diagram into
your browser.
Viewing Historical (Trend) Data
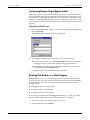
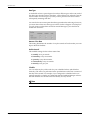
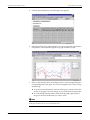
The WebReach application contains a powerful graphing utility for viewing
historical data. This utility allows you to select the date range and the data that you
want to view.
Viewing historical data graphically
1.
Launch your web browser and load the meter diagram whose data you want
to view.
2.
Go to the appropriate page with a link to the trending information you want to
view (e.g. Trending section on the Volts/Amps page).
3.
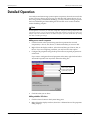
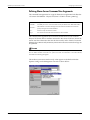
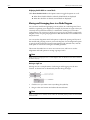
Click the
icon that corresponds to the data you want to view.
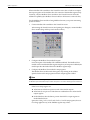
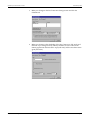
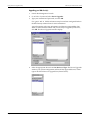
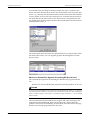
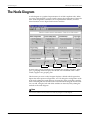
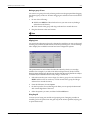
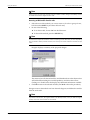
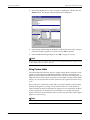
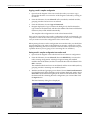
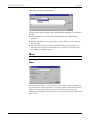
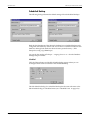
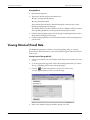
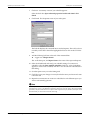
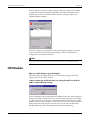
A screen appears where you select your date range:
4.
Page 166
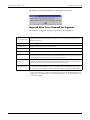
Select one of the date ranges provided or specify your own.
Chapter 7 - WebReach