1
ComBridge Studio
Visual Editor
V 1.6.6
User Manual
Revision: 2009-07-13
I P A S
C o m B r i d g e
S t u d i o
V i s u a l
E d i t o r
Copyright Notice
The software and this documentation material is copyrighted and protected by
international treaties. ComBridge Studio Suite (CBSS) and all other IPAS GmbH product
or services names are registered trademarks of IPAS GmbH. Other brand and product
names are also registered trademarks or trademarks of their respective organization.
You may duplicate the documentation within the limits of the license agreement.
2009, IPAS GmbH
S e i t e
Version 1.6.6
2
I P A S
Änderungen vorbehalten
G m b H
©
2 0 0 9
I P A S
C o m B r i d g e
S t u d i o
V i s u a l
E d i t o r
Content
1. Preface ............................................................................................................................. 6
2. Introduction ....................................................................................................................... 7
2.1. System requirements ................................................................................................. 7
2.2. What’s new?............................................................................................................... 7
2.3. Basic settings ............................................................................................................. 8
2.3.1. Microsoft® Internet Explorer “Text size“.............................................................. 8
2.3.2. Microsoft® Internet Explorer “Access to web pages“.......................................... 8
2.3.3. Microsoft® Windows display properties .............................................................. 8
2.3.4. Internet Explorer Web Browser Applet Control ................................................... 9
2.3.5. Using special characters ................................................................................... 10
3. System overview............................................................................................................. 10
4. IPAS ComBridge Studio Visual Editor ............................................................................ 11
5. Visual Editor Installation ................................................................................................. 12
6. Working with Visual Editor.............................................................................................. 12
6.1. Creating a new project ............................................................................................. 12
6.1.1. Visual Editor and Visual Director are located on a PC...................................... 14
6.1.2. Visual Editor and Visual Director are located on a local network...................... 16
6.1.3. Visual Director via Internet ................................................................................ 19
6.2. Deleting projects ...................................................................................................... 20
6.3. Creating and administering users ............................................................................ 20
6.3.1. User “General“................................................................................................... 20
6.3.2. User “Login“....................................................................................................... 21
6.3.3. User “Presence” ................................................................................................ 23
6.3.4. User administration “configuration“ ................................................................... 24
7. Projecting an EIB visualisation ....................................................................................... 26
7.1. Importing ETS group addresses .............................................................................. 26
7.2. Creating empty web pages ...................................................................................... 28
7.3. The navigation layout............................................................................................... 30
7.3.1. Creating main menu and submenu ................................................................... 31
7.3.2. Connecting the menu points with web pages.................................................... 33
7.3.3. Global sensitive link........................................................................................... 34
7.3.4. Playback of alarm sounds ................................................................................. 35
7.3.5. Integrating a logo............................................................................................... 38
7.3.6. Menu export....................................................................................................... 38
7.3.7. Testing the menu settings ................................................................................. 39
7.4. Creating an individual navigation ............................................................................. 40
I P A S
G m b H
©
2 0 0 9
S e i t e
Änderungen vorbehalten
3
Version 1.6.6
I P A S
C o m B r i d g e
S t u d i o
V i s u a l
E d i t o r
7.5. Web Design ..............................................................................................................42
7.5.1. Designing web pages........................................................................................ 42
7.5.2. Positioning control elements ............................................................................. 47
7.5.3. Connecting the control elements ...................................................................... 51
8. Project installation on the target PC............................................................................... 55
9. Control and function elements in Visual Editor .............................................................. 57
10. Non-EIS objects ........................................................................................................... 69
11. ComBridge graphic module.......................................................................................... 73
12. Online scene module ................................................................................................... 76
12.1. Web configuration scene trigger.............................................................................77
12.2. Web configuration action elements ........................................................................80
12.3. Web configuration scene definition ........................................................................83
12.4. Web config export...................................................................................................86
12.5. Creating the configuration page for scenes............................................................86
12.6. Online scene configuration .....................................................................................87
12.6.1. Online Scenes update..................................................................................... 89
12.7. Loading scenes from a website ..............................................................................90
12.8. Scene installation on the server .............................................................................91
13. Online scheduling programmes ................................................................................... 93
13.1. Online page weekly schedules ...............................................................................96
14. Appendix ...................................................................................................................... 97
14.1. Apache Web Server ...............................................................................................97
14.2. Windows Firewall....................................................................................................98
14.3. Visual Editor FTP Service Program........................................................................99
14.4. Connect / disconnect server .................................................................................100
14.5. Starting data transfer from and to the server........................................................101
14.6. Befehlstasten im Überblick ...................................................................................101
14.7. Configuring FTP@x ..............................................................................................102
14.7.1. General ......................................................................................................... 102
14.7.2. Transfer......................................................................................................... 102
14.7.3. File extension................................................................................................ 103
14.7.4. Remote Data Transfer connection................................................................ 104
14.8. Server profile ........................................................................................................104
14.8.1. Server-Profile Erstellen/Auswählen .............................................................. 104
14.8.2. Server profile login settings........................................................................... 105
14.8.3. Server profile initialisation settings ............................................................... 105
14.8.4. Server profile Firewall ................................................................................... 106
S e i t e
Version 1.6.6
4
I P A S
Änderungen vorbehalten
G m b H
©
2 0 0 9
I P A S
C o m B r i d g e
S t u d i o
V i s u a l
E d i t o r
14.8.5. Server profile Extras...................................................................................... 106
14.9. Language selection.............................................................................................. 107
14.10. ETS export of group addresses ......................................................................... 108
14.11. Explorer display ................................................................................................. 109
14.12. Overview of EIS types........................................................................................ 111
14.13. Table of Figures ................................................................................................. 113
I P A S
G m b H
©
2 0 0 9
S e i t e
Änderungen vorbehalten
5
Version 1.6.6
I P A S
1 .
C o m B r i d g e
S t u d i o
V i s u a l
E d i t o r
P r e f a c e
IPAS ComBridge Studio Visual Editor is part of the IPAS ComBridge Studio Suite
Software. It is the engineering tool for the web-based EIB-visualisation ComBridge Studio
Visual Director. Apart from network resources, web-based visualisations also use other
resources, which are integrated in the operating system. Therefore the user should have
knowledge of:
-
Microsoft® Windows™
-
FTP
-
HTML
-
IPAS ComBridge Studio Configuration Manager
-
Internet Explorer and other web browsers
Text characteristics in this manual are to be understood as follows:
-
Normal text: Arial 10p
-
File names and Directories: Bookman Old Style italics.
Data entry: Bookman Old Style bold.
-
A frame marks a selection button .
-
Window names “Arial 10p“.
-
References to other parts of this documentation:
.
References to third party documentation are marked by this symbol.
Advice or tips.
Attention: Avoid errors
Error messages and related information
Information worth reading
S e i t e
Version 1.6.6
6
I P A S
Änderungen vorbehalten
G m b H
©
2 0 0 9
I P A S
2 .
C o m B r i d g e
S t u d i o
V i s u a l
E d i t o r
I n t r o d u c t i o n
2.1. System requirements
ComBridge Studio Visual Editor requires the following operating systems and web
browser:
-
Microsoft® Windows 2000, XP;
-
Microsoft® Internet Explorer from version 5.5 upwards
Attention: The use of ComBridge Studio Suite with Microsoft Windows VISTA is limited as
special knowledge is required to install the operating system. IPAS recommends Microsoft
Windows XP and XP Professional.
ComBridge Studio Visual Director requires:
-
IPAS ComBridge Studio Core Services
-
Microsoft® Windows 2000, XP
-
Web Server (Apache)
-
PHP4 (www.php.net)
-
For the client:
o
Microsoft® Internet Explorer from version 5.5 upwards
o
Firefox from version 1.5 upwards
ComBridge Studio Suite, Web Server PHP, Java and Apache are, if necessary,
automatically installed on the server during the installation of ComBridge Studio Suite.
2.2. What’s new?
The Visual Editor software that is illustrated in this manual offers a range of new functions
compared to the previous version 1.6.4. The following functions are new:
I P A S
•
Event-dependent playback of sound files
•
Modified website for the setting of online scenes
•
Projection of online weekly schedules
•
Operating elements to create individual navigations
•
New functions in the Tech Edition
•
Configuration of the device series Linea Talento
•
Live test function for IP devices
•
Graphic module to display values
G m b H
©
2 0 0 9
S e i t e
Änderungen vorbehalten
7
Version 1.6.6
I P A S
C o m B r i d g e
S t u d i o
V i s u a l
E d i t o r
2.3. Basic settings
Before creating a visualisation project the following settings should be performed:
2.3.1. Microsoft® Internet Explorer “Text size“
Start Microsoft® Internet Explorer. Select View and then Text size / Medium . With this
setting, function elements, pop-up windows, etc are usually displayed correctly on the
browser. If any elements of the Visual Editor are not displayed correctly, you may have to
adjust the text size.
2.3.2. Microsoft® Internet Explorer “Access to web
pages“
Start Microsoft® Internet Explorer and select Tools and then Internet options . Select
Settings
in the window “Internet options / Temporary internet files“. The window
”Settings“ opens. Under “Check for newer versions of stored pages“ select “Every visit to
the page“. The standard setting is “Automatically“. However, with this setting it is possible
that changed web pages are not shown correctly as the previous version may be shown,
which is saved on the computer as a temporary file.
Figure 1:
“Settings“ in Internet Explorer
2.3.3. Microsoft® Windows display properties
To ensure that all control elements are displayed correctly in the browser, go to Internet
Explorer Extras/Internet options and select the tab Advanced. The parameter “Activate
visual styles on pushbuttons and control elements“ in the settings field under Browser
must not be selected. This will ensure that all operating elements provided by the Visual
Editor, are displayed correctly on the browser.
S e i t e
Version 1.6.6
8
I P A S
Änderungen vorbehalten
G m b H
©
2 0 0 9
I P A S
Figure 2:
C o m B r i d g e
S t u d i o
V i s u a l
E d i t o r
Activating visual styles on pushbuttons and control elements
2.3.4. Internet Explorer Web Browser Applet Control
In Internet Explorer certain settings need to be performed which ensure that Java (Sun) is
active. Java is automaticall installed when installing ComBridge Studio Suite. Settings
which are important for Java (Sun) are described subsequently.
Start Internet Explorer. Select Tools and then Internet options . Select “Advanced“.
Figure 3:
”Internet options/Advanced“
Make sure that “Java (Sun)“ is selected in the settings.
I P A S
G m b H
©
2 0 0 9
S e i t e
Änderungen vorbehalten
9
Version 1.6.6
I P A S
C o m B r i d g e
S t u d i o
V i s u a l
E d i t o r
Go to the window “Internet options/Security“ and select
Custom level... .
Figure 4:
Internet options ”Security settings“
Make sure that “Scripting of Java-Applets“ is enabled.
2.3.5. Using special characters
Depending on the country setting of the operating system, different unicodes are used for
the display of special characters. HTML editors usually use unicodes which do not contain
an umlaut (ä,ö,ü) so that characters are displayed correctly. When web pages or
navigation menus are created, no umlaut or special character must be used for names.
3 .
S y s t e m
o v e r v i e w
Modern visualisation concepts need to fulfill multiple requirements such as multiple site
control, remote observation and remote control, intuitional operation, alarm and recording
function. In addition, these concepts should be future proof. The web-based visualisation
concept Visual Director meets all these requirements. Visualisation projects consisting of
web pages are made available to the user on a server, similar to an internet provider. The
pages are loaded with Internet Explorer exactly like web pages on the internet. As a result
of the wide spread use of the internet, the loading and operation of such visualisations is
usually very easy even for a lay person. Another major advantage of web-based
visualisations is the unlimited number of users who can use the system at the same time.
IPAS ComBridge Studio Visual Director can be used for individual and local as well as for
multiple and distributed EIB installations by using the EIB/KNX protocol EIBnet/IP.
S e i t e
Version 1.6.6
1 0
I P A S
Änderungen vorbehalten
G m b H
©
2 0 0 9
I P A S
C o m B r i d g e
S t u d i o
V i s u a l
E d i t o r
See documentation of ComBridge Studio Suite
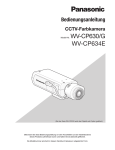
EIB installations are connected through the IP by using the IPAS ComBridge EIBnet/IP
Gateways and compatible devices. Figure 5 shows the principal structure of such
EIBnet/IP networks.
Figure 5:
EIBnet/IP networksIPAS ComBridge Studio Visual Director
IPAS ComBridge Studio Visual Director is the user application, with which the object
status is displayed and EIB functions are performed. This application is installed and
performed on the web server. The application can be projected with the Visual Editor. The
Visual Director Web Browser Client accesses the application from any network PC.
4 . I P A S
E d i t o r
C o m B r i d g e
S t u d i o
V i s u a l
IPAS ComBridge Studio Visual Editor is the engineering tool for the web-based EIB
Visualisation ComBridge Studio Visual Director.
The ComBridge Studio Visual Editor enables in particular the following functions:
I P A S
1:
Project administration
2:
Full graphic creation of visualisation pages
3:
Creation of web site navigation
4:
Integration of dynamic EIB operating and display objects
5:
Allocation of EIB object names or group addresses
6:
Creation of user guidance
7:
User administration and access rights
8:
Project provision via file manager or FTP
G m b H
©
2 0 0 9
S e i t e
Änderungen vorbehalten
1 1
Version 1.6.6
I P A S
5 .
C o m B r i d g e
V i s u a l
S t u d i o
E d i t o r
V i s u a l
E d i t o r
I n s t a l l a t i o n
The installation of Visual Editor is part of the ComBridge Studio Suite installation.
See: ComBridge Studio Suite Setup
6 .
W o r k i n g
w i t h
V i s u a l
E d i t o r
Start Visual Editor with “Start”, “Programme”, “ComBridge Studio Suite", “Visual Editor”.
Figure 6:
Program window Visual Editor
The screen is divided into two parts. On the left is the directory (Folder Bar), on the right
the work space. The DEMO project is shown by default and corresponds to the path:
C:\Programme\IPAS GmbH\ComBridge Studio\VisualEditor\projects\demo
In this project, top.htm is available to the user as an empty start page.
6.1. Creating a new project
After selecting the project dialogue via “file” and then “project”, new projects can be added
or deleted. Projects should be saved in the sub-folder:
C:\Programme\IPAS GmbH\ComBridge Studio Web
S e i t e
Version 1.6.6
1 2
I P A S
Änderungen vorbehalten
G m b H
©
2 0 0 9
I P A S
C o m B r i d g e
Figure 7:
S t u d i o
V i s u a l
E d i t o r
Creating new projects
After pressing Add the project name Project0 is saved by default under the path:
C:\Programme\Ipas GmbH\ComBridge Studio\VisualEditor\projects\Project0\
These standard values can be edited.
In Figure 7 the project name IPAS01 has been allocated after pressing Add. After this the
field Root path has been selected with the mouse. The system has automatically copied
the path
C:\Programme\Ipas GmbH\ComBridge Studio Web\IPAS01
if
into the field. The path name can be edited directly via the browser dialogue box
the project is to be saved in another location. No new folders can be created with the
browser dialogue box. New folders can be created by entering text in the text field
Root path. If they do not already exist, they are created automatically after pressing
Accept .
The server settings in the “server“ dialogue box are used later on for data transfer and
synchronisation, so that the projection environment can remain strictly separated from the
application. The visualisation object created with Visual Editor is saved on a server. A web
server is active on this server, which retains the project web pages for all authorised users.
During the installation of ComBridge Studio Suite the web server Apache is also installed.
See: ComBridge Studio Suite Setup
The user starts the project from a browser (e.g. Internet Explorer) by loading the IPAddress of the server together with a port number. As previously mentioned, projects
should be saved in the directory C:\Programme\Ipas GmbH\ComBridge Studio Web.
In ComBridge Studio Suite the port number range begins with 32000, as normal internet
applications do not use this range.
I P A S
G m b H
©
2 0 0 9
S e i t e
Änderungen vorbehalten
1 3
Version 1.6.6
I P A S
C o m B r i d g e
S t u d i o
V i s u a l
E d i t o r
The port number 32000 is reserved for the program ComBridge Studio MCG Configurator,
so that port numbers from 32001 onwards are available for visualisation projects.
The project directory and the port number have to be set on the web server. These
settings are performed in Visual Editor. Principally a distinction is made between projection
and commissioning structures.
6.1.1. Visual Editor and Visual Director are located
on a PC
Figure 8:
Visual Editor and Visual Director are located on a PC
Figure 8 shows the structure of the network. In this case the project is both projected and
started on the server PC. Accordingly root path and target path can be identical.
Figure 9:
Root path equates to target path
In Figure 9 the project has been given the name IPAS01. It is saved in the directory
C:\Programme\Ipas GmbH\ComBridge Studio Web\ for projection. After entering the
S e i t e
Version 1.6.6
1 4
I P A S
Änderungen vorbehalten
G m b H
©
2 0 0 9
I P A S
C o m B r i d g e
S t u d i o
V i s u a l
E d i t o r
project name, selecting the field Root path is enough to accept the standard settings. In
the Virtual Host field the PC name is automatically entered. This is used to later start the
visualisation in the browser with the url: http://localhost:<portnummer>. As IPAS01 is the
first project in this example, 32001 is defined as port number.
The style template chosen is the IPAS Template .
An already existing project can be read in Visual Editor with the use defined template. The
IPAS template is chosen when a new project is created.
Under Server settings select Local . As projection and application are both saved and
edited on the server, Root path and Target path are identical.
.
Additional projects can be given consecutive port numbers, e.g. the project Project2 is
given port number 32002, etc.
The settings are saved with Accept. Visual Editor creates the file IPAS01.conf in the
directory C:\Programme\Ipas GmbH\ComBridge Studio Web\__vhosts with the
settings for the virtual host and the corresponding port.
Visual Editor stops and starts Apache automatically, in order to accept the current settings
on the web server. Sometimes Apache might have to be started manually.
(
Appendix 12.1. Apache Web Server)
The new project is initiated in Visual Editor with Activate.
Important: If Activate is not pressed after Accept , the project folder will keep showing
the currently active project.
I P A S
G m b H
©
2 0 0 9
S e i t e
Änderungen vorbehalten
1 5
Version 1.6.6
I P A S
C o m B r i d g e
S t u d i o
V i s u a l
E d i t o r
6.1.2. Visual Editor and Visual Director are located
on a local network
Figure 10:
Projecting PC and server on the network
Figure 10 shows a common intranet network, which is connected with EIB systems via
ComBridge MCG EIBnet/IP Gateways. The visualisation project IPAS01 is to be created
with the PC in the control room and executed on the ComBridge Studio Server. The
network administrator has released the visualisation directory as a virtual drive so that it
can be reached directly from the projecting PC via the network. ComBridge Studio Suite is
installed on the ComBridge Studio Server. The directory for the project entitled IPAS01 is
to be saved on the server under
C:\Programme\Ipas GmbH\ComBridge Studio Web\IPAS01
The settings shown in figure 11 are performed on the projecting PC
Figure 11:
S e i t e
Version 1.6.6
1 6
Root path does not equate to target path
I P A S
Änderungen vorbehalten
G m b H
©
2 0 0 9
I P A S
C o m B r i d g e
S t u d i o
V i s u a l
E d i t o r
With these settings the visualisation project is saved on the local projecting PC under the
rootpath
C:\Programme\Ipas GmbH\ComBridge Studio Web\IPAS01
However, the visualisation is to be started on the ComBridge Studio Server. This means
that the visualisation project with local settings needs to be transferred to
\\ComBridge_Server\Ipas GmbH\ComBridge Studio Web\IPAS01
After pressing Accept the target path is saved on the ComBridge Studio Server if the
network is connected. By pressing
in the Visual Editor the projection files can now be
transferred to the server.
For technical reasons, the web server file, which contains information for the Apache web
server, cannot be transferred in this way. The web server file is located on the projecting
PC in the directory
C:\Programme\Ipas
GmbH\ComBridge
Studio
Web\__vhosts
and
is
called
Projektname.conf, i.e. in our example IPAS01.conf. Before the visualisation can be
loaded, the file IPAS01.conf needs to be copied to the directory G:\Programme\Ipas
GmbH\ComBridge Studio Web\__vhosts - this time, however, on the ComBridge Studio
Server.
During the installation of ComBridge Studio the website ComBridge Studio Suite
Configuration Upload was also installed which allows for copying processes to be
performed easily. If the URL http://localhost:32100 is entered in the browser of the
ComBridge Studio Server, the ComBridge Studio Suite Configuration Upload page is
started.
Figure 12:
I P A S
ComBridge Studio Suite Configuration Upload page
G m b H
©
2 0 0 9
S e i t e
Änderungen vorbehalten
1 7
Version 1.6.6
I P A S
Click on
C o m B r i d g e
Search
IPAS01.conf
in
S t u d i o
V i s u a l
E d i t o r
and the file selection window opens. From the server, the file
the
directory
C:\Programme\Ipas
GmbH\ComBridge
Studio
Web\_vhosts on the projecting PC is selected.
Figure 13:
File selection window
Click on Open and the selection is accepted. By clicking on Press on the web page, the
file is copied to the server.
The copying process is now completed.
Figure 14:
S e i t e
Version 1.6.6
Press copies the system file
1 8
I P A S
Änderungen vorbehalten
G m b H
©
2 0 0 9
I P A S
C o m B r i d g e
S t u d i o
V i s u a l
E d i t o r
Apache needs to be started manually to activate the current settings on the web server.
(
Appendix 12.1. Apache Web Server)
After pressing Activate the new project is initiated in Visual Editor.
6.1.3. Visual Director via Internet
Figure 15:
ComBridge Studio Server via Internet
Figure 15 shows the network structure if the projecting PC reaches the ComBridge Studio
Server via the internet. In accordance with this structure, the following settings need to be
performed in the window “Choose Project”. The project transfer to the ComBridge Studio
Server via the internet is performed by means of File Transfer Protocol (FTP). Visual
Editor is equipped with an FTP server. In the work environment of the FTP server
connection profiles can be defined, which can be retrieved under the server settings.
(
Appendix 12.3. Visual Editor FTP Service Program)
If the FTP server is configured, the file transfer is similar to the copying of files. If there is a
connection to the server, choose the target directory and transfer the project from the root
directory.
Figure 16 shows the settings: Chose Internet Provider in the “Server” window. Enter your
target IP address or the DynDns address in the field Domain. Under FTP Profile enter the
profile, which you have created on the FTP server of the Visual Editor
I P A S
G m b H
©
2 0 0 9
S e i t e
Änderungen vorbehalten
1 9
Version 1.6.6
I P A S
C o m B r i d g e
Figure 16:
(
S t u d i o
V i s u a l
E d i t o r
Accessibility of the ComBridge Studio Server via the Internet
Appendix 12.3. Visual Editor FTP Service Program)
6.2. Deleting projects
Non-active projects can be selected and deleted. Activate a project, which you do not want
to delete. Then use the mouse to select the project you would like to delete. Press Delete.
The selected project is removed entirely from the projecting PC.
6.3. Creating and administering users
In general, different people operate a visualisation. Depending on access rights, some
users can only observe, whilst others can observe and operate. Other users should
perhaps operate the visualisation only at certain times. If you would like to set this mode,
choose Administration from the directory. The window “WebAccess User Administration“
opens.
6.3.1. User “General“
Select “General“. Depending on the style template, standard users are set up in this
window, which can be changed or deleted by the project designer. Should you wish to
delete a standard user, for example Visu&Alarm, you must first select the user and then
press Delete Selected User.
Should you wish to enter a new user, press Add New User. A new user with the name
Anonymous appears in the entry field. You can select and rename the field. The new user
is saved by pressing Enter.
S e i t e
Version 1.6.6
2 0
I P A S
Änderungen vorbehalten
G m b H
©
2 0 0 9
I P A S
C o m B r i d g e
Figure 17:
S t u d i o
V i s u a l
E d i t o r
User administration “General“
In the user access control, a certain access level can be allocated to any selected user.
The access level can be defined from 0 to 20. Thus, the possibility exists to create a scale
of access rights for the visualisation project. The following rule applies: The higher the
access level, the greater the user rights.
In Figure 17 two users, guest and administrator, have been created. Guest has access
level 5 and Administrator has access level 20. The administrator has therefore more
access rights than the guest.
Access levels from 0 to 20 can be allocated to all user elements in Visual Editor. A user
with access level 5 cannot operate an element with access level 7. (
Chapter 10.
Control and Function Elements in Visual Editor)
6.3.2. User “Login“
If you select Login, you can set the conditions, under which a user can operate the
visualisation.
I P A S
G m b H
©
2 0 0 9
S e i t e
Änderungen vorbehalten
2 1
Version 1.6.6
I P A S
C o m B r i d g e
Figure 18:
S t u d i o
V i s u a l
E d i t o r
User administration “Login“
You can set a user password in the field Password . Only with the right password can the
user operate the visualisation.
An individual image can be allocated to each user. This image should be saved in the
corresponding project directory. A path to the image is entered in the field User image .
Images should be saved in JPG, GIF, WMF, BMP or PNG format. The image size must be
adjusted to the resolution. The resolution should be low, so that the picture is uploaded
rapidly.
In the field User starting page you can enter the web site, which is to appear after the user
has logged in. Clicking on
opens an Explorer window, from which a starting page can
be chosen.
You can choose from different style templates for the visualisation in the window “layout”.
Visual Editor offers three different style templates:
Simple visualisation
This template contains an empty web page. The page is specifically prepared for EIB
communication. You only need to define the design and the functions. This style template
does not contain any site navigation as this needs to be created by the user.
Visualisation with menu
This style template offers an empty web page and the IPAS navigation layout which can
be edited in Visual Editor. Main and sub-menus can be defined and a logo can be
integrated (
S e i t e
Version 1.6.6
Chapter. 8.3. Navigation Layout)
2 2
I P A S
Änderungen vorbehalten
G m b H
©
2 0 0 9
I P A S
C o m B r i d g e
S t u d i o
V i s u a l
E d i t o r
Visualisation with alarm
This template offers an empty web page and the IPAS navigation layout, which can be
edited in Visual Editor. In addition, all alarms, which have been edited in Info Point
Configurator, are displayed on a special alarm page and the last alarm is shown in a
special alarm line of the menu layout. The alarms are equipped with an acknowledgement
button. All alarms are saved in a data base.
See: ComBridge Studio Suite Alarm Service
6.3.3. User “Presence”
Select “Presence“, in order to set the time window, within which the user can operate the
visualisation.
In the example in Figure 19 the user has access rights from 10:00 to 14:00. You can
delete a time window by pressing Delete time period and define a new time window by
pressing Add Time Period. If you enter 00:00 to 23:59, the user has 24-hour access
rights.
Figure 19:
User administration “Presence“
The time window is saved by pressing Apply settings .
I P A S
G m b H
©
2 0 0 9
S e i t e
Änderungen vorbehalten
2 3
Version 1.6.6
I P A S
C o m B r i d g e
S t u d i o
V i s u a l
E d i t o r
6.3.4. User administration “configuration“
Select “Configuration“, in order to determine system settings such as the start screen of
the visualisation.
Figure 20:
User administration “Configuration“
The entries in the field Key describe the function, the entries in the field Value correspond
to the parameters. The individual meanings are as follows:
PORT
This entry defines the port for connection with the ComBridge
Configuration Manager. The port for connection with the Client
Manager is 3013.
See: ComBridge Studio Suite Client Manager
NEEDPASSWD
true: User access is protected by password
false: User access is not protected by password
NEEDTIMESLOT
Decides whether the access time is limited
WELCOME
Includes the title of the welcome page.
SKIPLOGIN
true: Login via login page is not required
false: Login via Login page
true: error messages from Client manager are displayed
SHOWMSG
false: No error messages are displayed
KEYPAD
If the user has been allocated a password, a number field appears for the
password when logging in. In this case the password can only be a
number.
S e i t e
Version 1.6.6
2 4
I P A S
Änderungen vorbehalten
G m b H
©
2 0 0 9
I P A S
C o m B r i d g e
S t u d i o
V i s u a l
E d i t o r
When operated via Touch Screen the key „KEYPAD“ = true has to be set, so that the
password can be entered as a series of numbers via the keyboard number pad
true: language selection active
LANGSEL
false: language selection inactive
MAINLAYOUT std: The display does not use the full screen size, so that the IPAS standard
logout function can be used
fullscreen: The visualisation pages are displayed on the full screen. The
standard logout function cannot be used.
MSGFOOTER Footer on the login page
MAINHEIGHT Height of the main browser window
TIMEOUT
Displays the time in minutes after which the visualisation jumps from a loaded
web page to the one defined under FALLBACK. (Entry in minutes)
FALLBACK
Defines the action to be performed after TIMEOUT has expired.
None: After the fallback time has expired, no action is taken.
Logout: After the fallback time has expired, the user login is loaded.
Back: After the fallback time has expired, the last open page is loaded.
User: After the fallback time has expired, the user start page is opened.
Page:/xxx.htm: After the fallback time has expired, the web page defined
with page:/xxx.htm opens.
LANG
Shows the language in which the visualisation is started by default
FLAGSIZE
Shows the size of the country flag symbol for the choice of language
DBCONN
Shows the DSN Name of the ODBC data base, in which the alarm data
are saved.
Press OK to accept settings.
Figure 21:
I P A S
Start screen after users have been configured
G m b H
©
2 0 0 9
S e i t e
Änderungen vorbehalten
2 5
Version 1.6.6
I P A S
C o m B r i d g e
S t u d i o
V i s u a l
E d i t o r
Figure 21 shows the start screen after users have been configured. In the upper right hand
corner of the screen the language for the visualisation can be chosen with the country flag
symbol. Administrator and guest are the two users. By pressing the user image the
projected web page (Start.htm in the example) is loaded.
7 .
P r o j e c t i n g
a n
E I B
v i s u a l i s a t i o n
After a new visualisation project has been saved and the users have been defined, you
can begin the actual visualisation. We will describe this process subsequently by using
the example of a visualisation with “IPAS Navigation with Alarm”. Principally the projection
is performed in four steps:
1. Importing the group addresses
2. Creating the planned empty web pages
3. Building the menu navigation
4. Web Design
If you use a style template other than the one with navigation and alarm, you should still
follow the above steps. If no navigation is used, you must build your own. This requires
knowledge of HTML programming. If you use the style template with navigation, the
alarms defined in Info Point Configurator are not displayed.
See: ComBridge Studio Suite Alarm Service
7.1. Importing ETS group addresses
An ETS export has previously been performed with the ETS. (
Appendix 12.10.
ETS group address)
With the right mouse button select ETS group objects and then Properties from the
folder list on the left of the Visual Editor.
Figure 22:
S e i t e
Version 1.6.6
Loading group address properties
2 6
I P A S
Änderungen vorbehalten
G m b H
©
2 0 0 9
I P A S
C o m B r i d g e
S t u d i o
V i s u a l
E d i t o r
The window “Properties“ opens.
Figure 23:
Importing ETS group addresses
Select “Details“. In this view you must enter the path and the file name as well as the ETS
language of the export. All other settings remain unchanged.
In the value field next to the key field etslang you can select the language.
If you select the value field next to the key field etsdb , a file explorer window opens, in
which you can choose the path and the file name of your ETS export. If you confirm your
selection with OK , the group addresses are imported by the Visual Editor.
The Configuration Manager should be running actively, so that the connected and loggedin gateways can also be imported.
See: ComBridge Studio Suite Configuration Manager
Now the group addresses are read from the export file. The connected gateways are read
via the Client Manager connection and displayed in the folder list on the left. By clicking on
the
symbol the group address tree is opened. Now the group addresses are
available for further use.
I P A S
G m b H
©
2 0 0 9
S e i t e
Änderungen vorbehalten
2 7
Version 1.6.6
I P A S
C o m B r i d g e
Figure 24:
S t u d i o
V i s u a l
E d i t o r
View of group addresses after being imported
7.2. Creating empty web pages
In general a visualisation consists of several pages, which can be loaded via a navigation.
At first you must determine the number of pages required. ComBridge Studio Visual
Director pages differ from other web pages because of certain program elements, which
are important for EIB communication. The ComBridge Studio Visual Director concept is
based on static pages (floor plans, images, etc.), which are supplemented by dynamic
elements, such as switch units and status displays. This means: If the status of an
operating element changes, not the whole web page is up-dated (as would happen
usually) but only the changed element. This makes the page uploading very fast and
avoids lengthy processing. Once you have created and activated a new project, this
project will always contain the web site top.htm, which has been specifically prepared for
EIB communication.
Select Project from the folder list and double click the file name top.htm. In the right editor
window the file top.htm opens. This page serves as template for all other pages.
S e i t e
Version 1.6.6
2 8
I P A S
Änderungen vorbehalten
G m b H
©
2 0 0 9
I P A S
C o m B r i d g e
S t u d i o
V i s u a l
E d i t o r
Folder list “Project“ with active top.htm
Figure 25:
By choosing File and then Save as you can copy and save the file top.htm under a
different name. For example the page may be called Start.htm. All required web pages
are created in this way.
In Figure 25 the additional pages Frontview.htm, Office.htm, Alarm.htm, Scene.htm
and Heating.htm have been created in the same way.
Attention! Do not use any umlaut in website and menu names.
It is always possible to add additional pages later on. Via “File” and New you can create
a new web page and save it with “File” and Save as under any name.
I P A S
G m b H
©
2 0 0 9
S e i t e
Änderungen vorbehalten
2 9
Version 1.6.6
I P A S
C o m B r i d g e
S t u d i o
V i s u a l
E d i t o r
7.3. The navigation layout
Hauptmenü
Untermenü
Aktueller Alarm
VE-Bedienelemente
Bereich für Logos
Figure 26:
Aktuelle Arbeitsfläche
Visual Director Standard Navigation with Alarm
Figure 26 shows the standard style template Navigation with Alarm. The top left-hand
corner contains a space for a project specific logo. The upper middle part contains a field
for the navigation elements consisting of two lines. The top line is for the main navigation
elements, for example the floors of a building. If an element of the main navigation is
selected, a web page can be loaded and the corresponding sub-navigation (if available)
appears. For better orientation within the navigation levels the text with yellow background
provides
a
description
(
).
If,
under
“User
administration”
and
“Configuration” the MAINLAYOUT is set on std, the screen appears in the standard
display and the IPAS logout element
(
is shown.
Chapter. 7.3.4. User administration “configuration“)
When pressing the logout element
, the start screen is displayed with the user
access elements.
Individual site navigation can be built easily with the Visual Editor. Select Edit web menu
S e i t e
Version 1.6.6
3 0
I P A S
Änderungen vorbehalten
G m b H
©
2 0 0 9
I P A S
C o m B r i d g e
S t u d i o
V i s u a l
E d i t o r
from the left folder list. The IPAS standard menu appears which can be changed to the
desired navigation menu through simple editing.
Figure 27:
Folder list Edit Web Menu
A menu is edited in five steps, which are described in the following chapters.
7.3.1. Creating main menu and submenu
Move the mouse to the menu field and press the right mouse button.
The window to the right of the text opens. It will be re-opened for
each of the following steps. Select an existing menu entry with the
right mouse button as shown in Figure 27 and choose Rename in
order to edit the entry or Delete in order to delete it. If you choose
Insert menu item, a new menu point is inserted below the position of
the mouse. If you choose Add menu item, a new menu point is
added at the end of the menu list. If you have selected a menu point
and pressed the right mouse button, you can Add a sub-menu below
the selected element. All elements can be edited by selecting the
respective menu point with the right mouse button and then pressing
Rename.
An alarm button on the main menu is added with Add alarm menu .
A click on Alarm opens the alarm report page, which lists all alarm events recorded in the
database. The following figure shows the structure of the alarm page.
I P A S
G m b H
©
2 0 0 9
S e i t e
Änderungen vorbehalten
3 1
Version 1.6.6
I P A S
C o m B r i d g e
Figure 28:
S t u d i o
V i s u a l
E d i t o r
Alarm overview after pressing Alarm
All alarm events are listed line by line with their specifications. In the Quit/Date alarms
can be acknowledged with a time/date stamp. Fields marked in blue show that alarms
have not been acknowledged in this line. Fields marked in green show with their time/date
stamp the point in time when the alarm was acknowledged. The line below the menu field
shows the last alarm event with Current Alarms .
If
Add Config Menu
visualisation (
is selected, the scene configuration can be loaded in the
Chapter 11.6. Online scene configuration).
If Add Logout Menu is selected, a logout button appears in the main menu. By clicking
this button the login page is loaded.
The optimal navigation display is achieved if you use no more than one line for each the
main navigation and the sub-navigation. This means that you should describe the menu
points with short words or few letters. If you use more than one line for a menu point, the
whole lay-out might change and the operation may not be performed correctly.
S e i t e
Version 1.6.6
3 2
I P A S
Änderungen vorbehalten
G m b H
©
2 0 0 9
I P A S
C o m B r i d g e
S t u d i o
Open the navigation tree by clicking on the + symbols:
V i s u a l
E d i t o r
.
7.3.2. Connecting the menu points with web pages
Select the top menu point with the right mouse button and select Properties . The window
“Menu properties” opens.
Figure 29:
Menu properties
The field Name contains the name of the menu point. The name can be changed at this
point. Title refers to the entry for a menu point, which is shown in the navigation with a
yellow background. This entry has no meaning for submenus and only serves for
commenting the entry. In the Reference field the web page is displayed which is to be
loaded when pressing the menu point. In the Access field the access level is defined. It
needs to be lower than the access level of the user for the page to open.
If the window “menu properties“ is open, select Project from the folder list. On the left
side of the Visual Editor the folder entries of the project are shown. In order to connect the
already created web pages with the navigation menu, use the left mouse button to select
the web site which is to be allocated to the menu point in the window “Menu Properties“.
Move the web site into the Reference field with the mouse button pressed down and then
release the button. The file name of the selected website is now displayed in the
Reference field. In Figure 29 this is the site Frontview.htm. Press Accept, in order to
save the settings. In order to allocate the other sites, press the upwards arrow symbol in
the window “Menu Properties“ in order to move up one menu point or the downwards
arrow symbol in order to move one menu point down.
Save your settings with Accept before you select the next menu point. Save the settings
of the displayed menu point with OK before closing the window “Menu properties”.
I P A S
G m b H
©
2 0 0 9
S e i t e
Änderungen vorbehalten
3 3
Version 1.6.6
I P A S
C o m B r i d g e
Figure 30:
S t u d i o
V i s u a l
E d i t o r
Example of a projected site navigation
In the example (Figure 30) the main menu IPAS was connected with the website
Frontview.htm, the sub menu Office was connected with the website Floorplan.htm, the
sub menu Scene with the website Scene.htm and the main menu Heating with the
website Heating.htm.
7.3.3. Global sensitive link
In the web menu configuration a global sensitive link can also be projected. In contrast to
the local sensitive link, which can be selected in the Tech-Edition and can only be
activated on the web page where it was saved, the global sensitive link is active in the
whole visualisation independent of the page that has been opened.
S e i t e
Version 1.6.6
3 4
I P A S
Änderungen vorbehalten
G m b H
©
2 0 0 9
I P A S
C o m B r i d g e
Figure 31:
S t u d i o
V i s u a l
E d i t o r
Projecting a global sensitive link
To create the link, select the menu point Sensitive Link with the right mouse button under
Edit web Menu and then press Add Sensitive Link . To configure the sensitive link, select
the newly created link with the right mouse button and choose the menu point Properties
.
The field Reference is used to show the website from the Project menu, which is to be
opened when pressing the sensitive link. Name and Object describe the group address
or the object, which activate the sensitive link, if the value in the Obj. Value field is sent.
In Figure 30 the site Alarm.htm is opened in a popup window if the group address 1/2/25
has the value 1.
Please remember that when pressing a global sensitive link a web page is opened which
is not embedded in the standard navigation. You need to ensure that this page contains
functions which make it possible to return to the original visualisation (e.g. fallback). The
example in Figure 31 shows how the global sensitive link opens a popup window, which
displays
the
desired
web
page.
In
order
to
load
Alarm.htm,
the
code
javascript:top.PopupDialog('/Alarm.htm',50,50,300,300,2); needs to be entered
in the field Reference . If the sensitive link has been activated, the Alarm.htm opens at
the position x= 50px and y=50px with a size of x=300px and y=300px for 2 seconds
(
Chapter 10. Control and Function Elements in Visual Editor).
7.3.4. Playback of alarm sounds
A special global link is the playback of an event-dependent sound file. ComBridge Studio
offers a range of sound files that are included in the delivery. The sound files are accessed
from within a website. This means that the playback of a sound file under ComBridge
Studio happens via a special website which is saved together with the sound files under
Projectdirectory/_sound.
I P A S
G m b H
©
2 0 0 9
S e i t e
Änderungen vorbehalten
3 5
Version 1.6.6
I P A S
C o m B r i d g e
S t u d i o
V i s u a l
E d i t o r
Sound files under ComBridge Studio are in the wave format *.swf and can be created with
the appropriate programs. The sound files included in the delivery have been generated so
that they can play infinite sounds. With the correct software, additional sound files can be
created. However, the creation of sound files is not intended with ComBridge Studio. If you
have questions about the creation of sound files, please contact [email protected].
The playback time can be set as follows. In the Visual Editor open the HTML page with the
desired sound.
Figure 32:
Open HTML page sound2.htm
Figure 32 shows the open HTML page Sound2.htm. Select Extras/Document Properties
from the Visual Editor’s menu bar to open the Properties Window. The value 6 in the key
field http-equiv:refresh shows the play-back time in seconds (Figure 33, left). If the entry is
deleted, the sound is played in an infinite loop (Figure 33, right).
S e i t e
Version 1.6.6
3 6
I P A S
Änderungen vorbehalten
G m b H
©
2 0 0 9
I P A S
Figure 33:
C o m B r i d g e
S t u d i o
V i s u a l
E d i t o r
Setting the playback time: left 6 sec., right infinite
Figure 34 shows the properties window of a global sensitive link for sound playback.
Figure 34:
Properties to playback a sound file
The command “playsound:“ in the reference field starts the website sound1.htm. The
name of the link is defined in the name field. In Figure 34 the sound with Obj.value 1 of
virtual object ”A1“ is played. Figure 35 shows the settings to stop the sound with another
global sensitive link. The virtual object A1 with value ”0“ executes the Stopsound
command.
I P A S
G m b H
©
2 0 0 9
S e i t e
Änderungen vorbehalten
3 7
Version 1.6.6
I P A S
C o m B r i d g e
Figure 35:
S t u d i o
V i s u a l
E d i t o r
Settings to stop a sound
7.3.5. Integrating a logo
Before you integrate a logo in the visualisation, the logo should be adjusted to the format
and saved in the project directory in an appropriate format, for example *.BMP. An
appropriate directory is:
C:\Programme\Ipas GmbH\ComBridge Studio Web\Vd1\images\custom
The standard size for a logo in the navigation menu is 193 x 55 pixels (x,y).
In order to integrate a logo in the layout, press the right mouse button in the field Edit Web
Menu and then choose Logo.
Figure 36:
Logo Dialogue
You should now change to project view in order to drag the logo file to the field Path by
keeping the left mouse button pressed down. Confirm your setting with OK.
7.3.6. Menu export
Once you have connected all menu points with the corresponding web sites and edited
and named all menu points, you only need to export the menu. Press the right mouse
button when the cursor is above the field Edit Web Menu and press Export in order to
integrate the new menu into the lay out.
S e i t e
Version 1.6.6
3 8
I P A S
Änderungen vorbehalten
G m b H
©
2 0 0 9
I P A S
C o m B r i d g e
S t u d i o
V i s u a l
E d i t o r
7.3.7. Testing the menu settings
Start Internet Explorer and enter http://localhost:32001 in the address line in order to start
the visualisation.
32001 is the port number of the first project in this manual. If a different port number has
been defined for your project, you must enter this number instead of the one used in this
example.
Begrüßungszeile
Benutzer
Startschalter
mit
Benutzerbild
Figure 37:
Sprachauswahl
Angelegte
Benutzer
Visualisation login screen
Select the image of the user login in order to open the visualisation. After a few seconds
the visualisation is started and you can test the current settings. Check the format of the
logo, the navigation display and the corresponding web sites. Should you wish to make
any changes, simply repeat the steps described above and check your changes in Internet
Explorer.
I P A S
G m b H
©
2 0 0 9
S e i t e
Änderungen vorbehalten
3 9
Version 1.6.6
I P A S
C o m B r i d g e
Figure 38:
S t u d i o
V i s u a l
E d i t o r
First test of the visualisation
Attention! Remember that the web sites are static and are not automatically updated. If
you want to test your changes, you need to use the update function in Internet Explorer
.
7.4. Creating an individual navigation
If you prefer not to use the ComBridge Studio standard navigation, Visual Editor offers
operating elements to create an individual navigation. The operating elements can be
found in the menu Operating elements /Navigation.
Figure 39 shows the 4 navigation elements that are currently available.
Figure 39:
Navigation menu
This button opens a new page
S e i t e
Version 1.6.6
4 0
I P A S
Änderungen vorbehalten
G m b H
©
2 0 0 9
I P A S
C o m B r i d g e
S t u d i o
V i s u a l
E d i t o r
Go to HTML attributes and enter the page that is to be opened when pressing the button in
the value field. Enter the page in the “/page.htm“ format.
This element opens the previous page. No settings are
required.
This button is used to log out. No settings are required.
This button changes the page depending on the user’s
access level.
I P A S
G m b H
©
2 0 0 9
S e i t e
Änderungen vorbehalten
4 1
Version 1.6.6
I P A S
C o m B r i d g e
S t u d i o
V i s u a l
E d i t o r
The different access levels can be entered in the value field of Attribute levels. The pages
that you wish to open on pressing the button can be entered in the value fields of
Attributes url0, url1, url2.
Example: The current user has access level 10. On pressing the button, page
"startpage12.htm“ opens.
If an individual navigation is created, the project designer needs to make sure that another
page can be accessed from each page that is created.
7.5. Web Design
Now that you have saved the project, determined the users, created empty web pages and
defined the navigation, your next step is the design of the individual web pages. This
process can be described in three steps.
1. Web page design
2. Positioning the control elements
3. Connecting the control elements
7.5.1. Designing web pages
Before graphic or image files can be integrated in Visual Editor, they should be edited in
such way that they are suitable for web application. The templates can have different
formats which are suitable for web display such as GIF, JPG, BMP etc. It is particularly
important that the resolution is adjusted to the screen resolution so that the picture file is
not too large, which would prevent rapid image uploading, especially if the visualisation is
S e i t e
Version 1.6.6
4 2
I P A S
Änderungen vorbehalten
G m b H
©
2 0 0 9
I P A S
C o m B r i d g e
S t u d i o
V i s u a l
E d i t o r
operated via the internet.
The image files can be located in any folder or drive. Select Insert/Picture in order to start
the “Open picture file” dialogue.
Figure 40:
Dialogue box Open Picture File and Search Folder
A dialogue box appears and asks you to copy the image into the project directory. Select
the respective folder. You can save it in images or in images\custom. You should try and
avoid the folders images\ipas and images\face, which should be retained for animation
graphics or framework graphics.
The image properties window opens. Please make sure that the path remains related to
the document by selecting Reference Related to Document . The image dimensions can
be adjusted if Retain Side Proportions is selected.. If you enter a different measurement
in the field Width , the height changes proportionally.
I P A S
G m b H
©
2 0 0 9
S e i t e
Änderungen vorbehalten
4 3
Version 1.6.6
I P A S
C o m B r i d g e
S t u d i o
V i s u a l
E d i t o r
Element properties of the image on the Start.htm page
Figure 41:
If you keep the window “Element Properties” open, the properties of the active (selected)
element appear in the work space. If the window is not open, you can open it at any time
by double clicking an element in the work space or via the context menu of the right
mouse button.
The floor plan of the office is to be displayed on the website Floorplan.htm. In order to so,
open the website Floorplan.htm and load the image Office_floor.gif The following
example shows how to change the background colour of the image. Use the right mouse
button to click the workspace outside of the currently loaded image.
Figure 42:
Element properties
The context menu appears, from which you select the entry Element Properties :
The “Element Properties” window reappears, in which you can now select, for example,
S e i t e
Version 1.6.6
4 4
I P A S
Änderungen vorbehalten
G m b H
©
2 0 0 9
I P A S
C o m B r i d g e
S t u d i o
V i s u a l
E d i t o r
the button for background colour. You can now choose a suitable background colour and
confirm it with OK.
Figure 43:
Choosing the background colour
To centre the floor plan, click once more on the image with the right mouse button. The
context menu appears. Select the entry Absolute Positioning . The anchor point of the
image remains the same but the image can be positioned freely and moved to the desired
position by using the mouse.
Figure 44:
I P A S
Absolute Positioning
G m b H
©
2 0 0 9
S e i t e
Änderungen vorbehalten
4 5
Version 1.6.6
I P A S
C o m B r i d g e
Figure 45:
S t u d i o
V i s u a l
E d i t o r
Detail Symbols
With “view”, Detail Symbols, the HTML symbols become visible. As shown in the picture
below, 3 HTML carriage returns are visible. Between the first two (upper) carriage returns
a small picture is shown.
This picture symbolises the anchor point of the image. The HTML Code for the image is
contained in it. If it is deleted, the here anchored image is deleted at the same time. This
needs to be remembered even if the image is freely positioned on the desktop through
absolute positioning
Figure 46:
Anchor point of an image
The length of time that it takes to open a website is primarily determined by the image
size. An image in JPEG format often has a size of several Mbyte. Screens with VGA
resolution can only display 840x640 pixels with a resolution of 90 DPI. Images that have a
higher resolution can therefore not be displayed in their original quality. It is better to
convert images or artwork to the above resolution. An image in VGA resolution has a size
of less than 100 Kbyte. An image whose resolution has been adjusted greatly reduces the
time it takes to open a page.
S e i t e
Version 1.6.6
4 6
I P A S
Änderungen vorbehalten
G m b H
©
2 0 0 9
I P A S
C o m B r i d g e
S t u d i o
V i s u a l
E d i t o r
7.5.2. Positioning control elements
Change to the folder User Controls in the left folder column in order to place a title on the
image and insert EIB objects.
Choose the object Label in the Tech Edition and move it to the work space. Objects can
only be deposited where an HTML marking permits positioning, e.g. between two carriage
returns, within text, tables, DIVs, etc. On other surfaces, the cursor changes accordingly
and dropping the object is not possible.
Figure 47:
Editing an object with element properties
If the object is positioned, the text can be edited. Text properties are set via the “Element
Properties“ window. The properties can be selected easily.
I P A S
G m b H
©
2 0 0 9
S e i t e
Änderungen vorbehalten
4 7
Version 1.6.6
I P A S
C o m B r i d g e
Figure 48:
S t u d i o
V i s u a l
E d i t o r
Changing font properties
Binary reporting: Open the HOME SILVER series and move the status display
(yellow/grey) into the work space, for example close to the window.
Figure 49:
Inserting control elements
Please make sure that absolute positioning is selected. In order to do so, click on the
object with the right mouse button and double-check the entry Position absolute
Now a
control switch and a value display for the actual dimming value are to be projected. A label
field gives these elements the name H1 . Figure 45 shows the result:
S e i t e
Version 1.6.6
4 8
I P A S
Änderungen vorbehalten
G m b H
©
2 0 0 9
I P A S
C o m B r i d g e
Figure 50:
S t u d i o
V i s u a l
E d i t o r
Projecting a control switch and value display
Attention! Buttons and other EIB control elements consist of several HTML elements.
Make sure that you always select the whole object. In order to be sure that the whole
object has been selected, you can choose View/Frame or <Ctrl + Alt + F> to make the
element frame visible.
For the switch-on button, the control element consists of a button and a graphic. If you
wish to select it, you need to select the button and not the graphic. Then the element can
be moved around freely.
I P A S
G m b H
©
2 0 0 9
S e i t e
Änderungen vorbehalten
4 9
Version 1.6.6
I P A S
C o m B r i d g e
S t u d i o
V i s u a l
E d i t o r
Here the whole object has been
Here only the graphic has been
selected correctly.
selected.
Tip: If the selection does not work with the mouse, use the TAB key or SHIFT + TAB combination in order to change the selection from object to objects.
If an object disappears beneath another during the positioning process, this is not an error
but an HTML property, which can be managed via the z-Index. Browsers work with levels
and therefore need information about the level on which the element is to be displayed.
Here is an example: The element appears to
have fully disappeared but, in fact, it is only on
a lower level than the floor plan. Therefore the
level of the element can be raised or the level
of the floor plan lowered. Under menu point
2D, you can define the level on which the
element is to appear. Choose
Forward
to
move the element to an upper level.
Die
Funktionen
der
verschiedenen
Bedienelemente sind im Anhang beschrieben.
(
Chapter. 10. Control and Function Elements in Visual Editor)
S e i t e
Version 1.6.6
5 0
I P A S
Änderungen vorbehalten
G m b H
©
2 0 0 9
I P A S
C o m B r i d g e
S t u d i o
V i s u a l
E d i t o r
7.5.3. Connecting the control elements
In Figure 46 switches and a status display are positioned.
Figure 51:
Position of control elements
Now the control elements are connected with EIB objects. First the control element is
selected and the properties window is opened with a double click or by using the right
mouse button and the context menu.
Figure 52:
Control element properties
In this properties window, control elements are connected with the installation’s EIB
I P A S
G m b H
©
2 0 0 9
S e i t e
Änderungen vorbehalten
5 1
Version 1.6.6
I P A S
C o m B r i d g e
S t u d i o
V i s u a l
E d i t o r
objects. The group addresses have been imported so that the group address of the current
project is listed in the left folder list under ETS Group Objects .
(
Chapter. 8.1. Importing ETS group addresses)
If you open the group address tree down to the lowest level all gateway names connected
to the configuration manager are displayed. If a group address with a valid gateway name
is selected, the object can be moved into the Name field of the properties window by
keeping the mouse button pressed down.
Figure 53:
Connecting group addresses
All information can also be entered manually in the element properties window by using
the following procedure:
- name:
The group address is entered together with the gateway name
- EIS Type:
Depending on the object type, the EIS Type (DP) is entered automatically.
A dimming object consists of three group addresses: Switching, dimming,
value setting.
Attention! For functions such as dimming or blinds, the EIS type needs to be doublechecked after connection.
S e i t e
Version 1.6.6
5 2
I P A S
Änderungen vorbehalten
G m b H
©
2 0 0 9
I P A S
C o m B r i d g e
S t u d i o
V i s u a l
E d i t o r
- Access code: If the access code is lower than the user level, the element can be
operated and observed (otherwise only observed)
- Confirm Action?: Is the operation to be confirmed once more with YES/NO. (0=No,
1=Yes)
- Check Status?: Is the status to be checked when the visualisation page is loaded?
(0=No, 1=Yes)
Tip: Dimming objects (EIS2) and blind objects (EIS7) consist of several group addresses.
These need to be entered as follows:
A dimming object consists of 3 group addresses: Switching, dimming, value setting. Enter
the objects for switching, dimming, value or status one after the other in the field Name
whilst keeping <Ctrl> pressed down. The separator is inserted automatically.
Figure 54:
Allocation in the case of dimming objects
If you wish to assign a blind function (EIS7), do this manually..
An overview of the different EIS types can be found in the appendix. (
Chapter
12.12. Overview of EIS types)
The connection of EIB object and operation or control element is now completed. Save the
project and start the browser. If you wish to start the visualisation, enter
http://localhost:32001 in the address line of the browser. The result is shown in figure 50.
I P A S
G m b H
©
2 0 0 9
S e i t e
Änderungen vorbehalten
5 3
Version 1.6.6
I P A S
C o m B r i d g e
S t u d i o
V i s u a l
E d i t o r
100
Figure 55:
Browser view of the visualisation
If the opening status of a window changes, the current status is shown in the status
display. If the light H1 is switched on, the current dimming value is shown in the value
display. In Figure 50 the current dimming value is 100% and the window is open. Please
pay attention to the display of the control element Status Display (yellow/grey).
Status “ON“ (Light on)
Status “OFF“ (Light off)
Status undefined; (the object does not exist in the EIB system or the subscriber
does not respond)
Figure 56:
S e i t e
Version 1.6.6
Status display
5 4
I P A S
Änderungen vorbehalten
G m b H
©
2 0 0 9
I P A S
C o m B r i d g e
8 . P r o j e c t
P C
S t u d i o
i n s t a l l a t i o n
o n
V i s u a l
t h e
E d i t o r
t a r g e t
After the project has been completed, it needs to be transferred to the web root directory
of the target PC in order to be executed. There are different ways of doing this:
1.) Manual copying of the files into the desired web-root directory
2.) Automatic copying of the files through Visual Editor
1: Copying data via FTP to an internet provider (
Chapter 7.1.3. Visual
Director via Internet)
2: Copying data within a local network or on the same PC (
Chapter 7.1.2.
Visual Editor and Visual Director are located on a local network)
We recommend automatic copying with support of the Visual Editor.
The following section describes the file transfer within a local network. (
Appendix
12.3. Visual Editor FTP Service Program).
At the beginning of the project you need to define the corresponding web server as well as
the later web-root directory as shown in the following figure:
Figure 57:
Target path to the network PC
You have the possibility to update the web-root directory at any time. To start this process,
use the globe in the upper tool bar.
I P A S
G m b H
©
2 0 0 9
S e i t e
Änderungen vorbehalten
5 5
Version 1.6.6
I P A S
C o m B r i d g e
Figure 58:
S t u d i o
V i s u a l
E d i t o r
Updating a project
After clicking on the symbol, the following dialogue box appears:
Figure 59:
Updating the start server
All data that have changed since the last update are listed in this dialogue box. By
pressing the start button the selected files are copied into the target directory.
Apache needs the corresponding file (e.g. IPAS01.conf) in order to be able to perform the
visualisation on the server. This file needs to be copied manually via the network into the
corresponding directory on the server.
(
Chapter 7.1.2. Visual Editor and Visual Director are located on a local network
S e i t e
Version 1.6.6
5 6
I P A S
Änderungen vorbehalten
G m b H
©
2 0 0 9
I P A S
C o m B r i d g e
9 . C o n t r o l a n d
V i s u a l E d i t o r
S t u d i o
f u n c t i o n
V i s u a l
E d i t o r
e l e m e n t s
i n
All functions that are required in EIB can be visualised with Visual Editor. Four design
templates are available for this, which differ in the Transparent, Gold and Silver editions
only in appearance. In the Transparent edition, the control elements can be fully hidden,
so that for example photos can be animated. The Tech-Edition contains additional
elements, which are independent of the design. The elements are described subsequently:
ON – switch
EIS-Type:
Value:
Function:
1: 1Bit
1
Switch ON
Gold-Editon
Silver-Edition
Tech-Edition
Transparent-Edition
Object properties / description:
Setting EIB-status to the value 1.
e.g. to switch on light or extractor fan
None
HTML Attributes
OFF – switch
EIS-Type:
Value:
Function:
1: 1Bit
0
Gold-Editon
Silver-Edition
Switch OFF
Tech-Edition
Transparent-Edition
Object properties / description:
Setting EIB status to the level 0.
e.g. switch OFF centrally
None
HTML Attributes
I P A S
G m b H
©
2 0 0 9
S e i t e
Änderungen vorbehalten
5 7
Version 1.6.6
I P A S
C o m B r i d g e
S t u d i o
V i s u a l
E d i t o r
Controller switch
EIS-Type:
Value:
Function:
1: 1Bit
0 or 1
Gold-Edition
Silver-Edition
Controller switch
Tech-Edition
Transparent-Edition
Display: On/Off
Object properties / description:
Setting EIB status to the value 0 or 1
e.g. to switch on or switch off lights, extractor
fan etc.
Set status request to 1, in order to obtain
current status of the next value
None
HTML Attributes
Controller switch with status display
EIS-Type:
Value:
Function:
1: 1Bit
0 or 1
Gold-Edition
Silver-Edition
Controller switch
Tech-Edition
Transparent-Edition
Display: On/Off
Object properties / description:
Setting EIB status to the value 0 or 1,
e.g. switch on and switch off lights, extractor
fan, etc.
Set status request to 1 in order to obtain current
status of the next value
Current status is displayed
None
HTML Attributes
S e i t e
Version 1.6.6
5 8
I P A S
Änderungen vorbehalten
G m b H
©
2 0 0 9
I P A S
C o m B r i d g e
S t u d i o
V i s u a l
E d i t o r
Blinds
EIS-Type:
Value:
7: 1Bit
Function:
0 or 1: up/down
Shutter, Blinds Control
0 or 1: slats
Gold-Edition
Silver-Edition
Tech-Edition
Transparent-Edition
Object properties / description:
1. Object OPEN/CLOSED, 2.Object: slats ,
StepCode: Number of brief key strokes to
change the slats
None
HTML Attributes
Dimming
EIS-Type:
Value:
Function:
2: 1Bit
0 or 1: ON/OFF
4 Bit
Dimming with Stop
1 Byte
Value setting 0-
Light switching, dimming value setting
100%
Gold-Edition
Silver-Edition
Tech-Edition
Transparent-Edition
Object properties/ description:
1. Object ON/OFF, 2.Object: Dimming
with stop telegram, 3. Object: Value
setting or status display, Status request
= 1 to obtain dimming status (1 Byte)
None
HTML Attributes
I P A S
G m b H
©
2 0 0 9
S e i t e
Änderungen vorbehalten
5 9
Version 1.6.6
I P A S
C o m B r i d g e
S t u d i o
V i s u a l
E d i t o r
Value Display and Value Setting
EIS-Type:
Value:
Function:
5: 2 Byte
All analogue values
6: 1 Byte
0-100%
Gold-Edition
Silver-Edition
Value setting and value display
Tech-Edition
Transparent-Edition
Entering value and
setting with “ENTER“
Object properties / description:
Stepcode shows the step size for value setting.
e.g. when setting the dimming value.10
corresponds to a step size of 10% Request
status =1: the current value is displayed
None
HTML Attributes
Value display
EIS-Type:
Value:
5: 2 Byte
All analogue values
6: 1 Byte
0-100%
Gold-Edition
Silver-Edition
Function:
Value setting and value display
Tech-Edition
Transparent-Edition
Entering value and
setting with “ENTER“
Object properties / description:
The values displayed correspond to the EIS
Type
None
HTML Attributes
S e i t e
Version 1.6.6
6 0
I P A S
Änderungen vorbehalten
G m b H
©
2 0 0 9
I P A S
C o m B r i d g e
S t u d i o
V i s u a l
E d i t o r
Status display
EIS-Type:
Value:
Function:
Display of binary status
1: 1 Bit
1 or 0
Gold-Edition
Silver-Edition
Tech-Edition
Transparent-Edition
See Properties
Object properties / description:
Tech-Edition: Each status is displayed
through individual images, which are
integrated under img0/1/X. Appropriate
template formats: JPG, GIF
Gold / Silver Edition: three types of status
reports:
ON/OFF = yellow/grey
ON/OFF = blue/grey
Alarm = Red
Alarm display blinking
None
HTML Attributes
Binary scene ON
EIS-Type:
Value:
Function:
Sending several 1 Bit objects
1: 1 Bit
1
Gold-Edition
Silver-Edition
Tech-Edition
Transparent-Edition
Object properties /
description:
Any number of 1 bit objects
can be entered in the field
Object Name. If the button
Action On is pressed, the
objects are sent one after the
other to the bus with the value
1.
None
HTML Attributes
I P A S
G m b H
©
2 0 0 9
S e i t e
Änderungen vorbehalten
6 1
Version 1.6.6
I P A S
C o m B r i d g e
S t u d i o
V i s u a l
E d i t o r
Binary scene Off
EIS-Type:
Value:
Function:
Sending several 1 Bit objects
1: 1 Bit
0
Gold-
Silver-
Edition
Edition
Tech-Edition
Transparent-Edition
Object properties /
description:
Any number of 1 Bit
objects can be entered
In the field Object Name.
If the button Action On is
pressed, these objects
are sent one after the
other to the bus with the
value 0.
None
HTML Attributes
Label field
EIS-Type:
Value:
Function:
Name field
Gold-Edition
Silver-Edition
Tech-Edition
TransparentEdition
Object properties / description:
If you press a label field, you can for
example change web sites or build an
internet connection in the browser
window. The corresponding link is set
in the field Target Address. External
Reference: e.g. internet connection.
Internal Reference: link is within the
project
In order to create the hyperlink, the
text in the label field must be selected.
(
See Info Box below)
None
HTML Attributes
S e i t e
Version 1.6.6
6 2
I P A S
Änderungen vorbehalten
G m b H
©
2 0 0 9
I P A S
C o m B r i d g e
S t u d i o
V i s u a l
E d i t o r
Info Box
If you enter top.PopupDialog(,/Link’,X1,Y1,X2,Y2,t) in the Target Address field,
you can open the hyperlink in the popup window.
,/Link’: Shows the hyperlink, which is to be opened in the popup window
X1,Y1: Left upper corner of the popup window
X2,Y2: Window size in direction x and y
T: Time in seconds after which the popup window closes automatically
This syntax can also be used for other elements such as Sensitive Link or Security Code
Lock.
Sensitive Link
EIS-Type:
Value:
1: 1 Bit
Function:
1
Opens a website or a link depending on a binary EIB
event
Gold-Edition
Silver-Edition
Tech-Edition
Transparent-Edition
Object properties /description:
If the value of the projected object is
1, a new hyperlink is loaded. Like the
hyperlink, the link is loaded in the
label field.
HTML Attributes
linkValue: shows the value (1 or 0),
when the link is to be performed.
Href: Shows the link, which is to be
loaded for the valid event.
If you want to open a popup window through a “sensitive link“, you need to enter the
following syntax in the field onclick :
Javascript:top.PopupDialog(http://Link,x1,y1,x2,y2,t)
X1,Y1: Left upper corner of PopUp window.
X2,Y2: Window size in direction x and y.
T: Time in seconds after which the popup window closes automatically
I P A S
G m b H
©
2 0 0 9
S e i t e
Änderungen vorbehalten
6 3
Version 1.6.6
I P A S
C o m B r i d g e
S t u d i o
V i s u a l
E d i t o r
Time display
EIS-Type:
Value:
Function:
3: 3 Byte
Time
Gold-Edition
Silver-Edition
Displays the time
Tech-Edition
TransparentEdition
Object properties / description:
The EIB time is displayed via the
projected object
None
HTML Attributes
Date display
EIS-Typ:
Wert:
Function:
4: 3 Byte
Date
Gold-Edition
Silver-Edition
Displays the date
Tech-Edition
TransparentEdition
Object properties / description:
The EIB date is displayed via the
projected object.
None
HTML Attributes
S e i t e
Version 1.6.6
6 4
I P A S
Änderungen vorbehalten
G m b H
©
2 0 0 9
I P A S
C o m B r i d g e
S t u d i o
V i s u a l
E d i t o r
Date and time display
EIS-Type:
Value:
Function:
3 and 4: 3 Byte
Date
Displays date and time
Gold-Edition
Silver-Edition
Tech-Edition
TransparentEdition
Object properties / description:
The EIB date and time are displayed
via the projected objects
None
HTML Attributes
Vertical and horizontal display bar
EIS-Type:
Value:
Function:
6: 1 Byte
0-100%
Displays the current percentage value in a bar chart
Gold-Edition
Silver-Edition
Tech-Edition
TransparentEdition
Object properties /
description:
The fill colour of the bar
changes in line with the value
of the EIB object.
HTML Attributes
Up to 3 threshold values are
shown in the field “BOUNDS“. In
the field “FILLCOLOURS“, colours
are displayed according to the
thresholds.
If the value is smaller than the
threshold, the respective colour is
displayed in the bar.
I P A S
G m b H
©
2 0 0 9
S e i t e
Änderungen vorbehalten
6 5
Version 1.6.6
I P A S
C o m B r i d g e
S t u d i o
V i s u a l
E d i t o r
Value setting
EIS-Type:
Value:
Function:
6: 1 Byte
Date
Sends a pre-set value to the bus
Gold-Editon
Silver-Edition
Tech-Edition
TransparentEdition
Object properties / description:
The pre-set value of the projected
object is sent to the bus
HTML Attributes
The desired value is entered in the
field xvalue. In the example the value
30% is sent to the bus.
Conversion Function
EIS-Type:
Value:
Function:
5: 2 Byte
Date
Gold-Edition
Silver-Edition
Calculates a value
Tech-Edition
TransparentEdition
Object properties / description:
A value is calculated in reference to a
function. The variable is the value of
the object.
HTML Attributes
The function used to calculate the
value is entered in the field “expr”.
“X“ is the value of the object. In the
example °C is converted to °F.
S e i t e
Version 1.6.6
6 6
I P A S
Änderungen vorbehalten
G m b H
©
2 0 0 9
I P A S
C o m B r i d g e
S t u d i o
V i s u a l
E d i t o r
Popup Window
EIS-Type:
Value:
Function:
Opens Popup Window
Gold-Edition
Silver-Edition
Tech-Edition
TransparentEdition
Object properties / description:
A value is calculated in reference to
a function. The variable is the value
of the object.
HTML Attributes
The hyperlink is entered in the field
“href“, Timeout shows the time in
seconds after which the popup
window closes if no action is taken.
h=height, w= width denotes the size
of the window. y,x, denote the
coordinates of the left upper corner
of the window
Security Code Lock
EIS-Type:
Value:
Function:
Opens a popup window when entering a code number
Gold-Edition
Silver-Edition
Tech-Edition
Transparent-Edition
Object properties / description:
If you press the field, the code number
window opens. If the correct code is
entered and
is pressed, a popup
window opens.
HTML Attributes
The hyperlink is entered in the field
“href“. The number code is entered in
the field “pwd“.
I P A S
G m b H
©
2 0 0 9
S e i t e
Änderungen vorbehalten
6 7
Version 1.6.6
I P A S
C o m B r i d g e
S t u d i o
V i s u a l
E d i t o r
Pulse Switch
EIS-Type:
Value:
Function:
1: 1 Bit
1 or 0
Gold-Edition
Silver-Edition
Performs a value sequence
Tech-Edition
Transparent-Edition
Object properties / description:
If you press the switch, a value
sequence of the projected object is
sent
HTML Attributes
The value entered in the field
“releaseValue“ is sent after releasing
the switch. In the field “pressValue”
the entered value is sent to the bus.
In the example, 1 is sent when the
switch is pressed, 0 when the switch is
released. “Delay“ shows the time in ms
after which the value is reset.
Live Test for IP Devices
The
ping
file
can
be
found
in
the
directory
C:\Programme\Ipas
GmbH\ComBridge
Studio\Automation\tasks. To edit the IP address that is to be monitored in the visualisation, open the
file with an Editor. For example a status report can be built into the visualisation. The virtual object
_PING_ IP-Address is projected under Properties. The automation service sends the ping command
periodically to the projected IP addresses. If there is a response, the value of _PING_IP-Address is
“1”. If there is no response, the object value is “0“.
S e i t e
Version 1.6.6
6 8
I P A S
Änderungen vorbehalten
G m b H
©
2 0 0 9
I P A S
1 0 .
C o m B r i d g e
N o n - E I S
S t u d i o
V i s u a l
E d i t o r
o b j e c t s
Some KNX devices use manufacturer specific data types which do not have a
standardised KNX data format. These could be 1 Byte status objects which define the
status of a controller or the maximum values of a test result which are transferred together
with the time and date stamp. ComBridge Studio Suite makes it possible to visualise such
specific data types. Via the Automation Service such data objects can be broken down into
any form. They can then be re-defined as KNX EIS types and made available as virtual
objects in the visualisation. In order to work with these specific objects, the integrator
needs to create a netlist that can be accessed by the Automation Service. During the
installation process an example netlist generic.net is installed which the integrator only
needs to adjust. The file generic.net is located in the directory C:\Programme\Ipas
GmbH\ComBridge Studio\Automation\netlists
and can be edited with any text editor. Figure 60 gives an example of the content of netlist
generic.net.
Figure 60:
Netlist generic.net
The following example of a data object that contains the maximum values of a weather
station together with the date and time, illustrates the working of a Non-EIS type. In the
example, 4 group addresses are used, each of which has a data length of 8 Bytes. All
group addresses are transferred to the Automation Service via a KNXnet/IP interface
called MCG_MA. Definitions are set with Ports, which describe the breaking up of objects
into different data types that can be interpreted by the Automation Service. In the following
Port an object (MCGA_MA:0/4/6) with a data length of 8 Bytes is broken down.
<ports>
<port ID="MCG_MA:0/4/6" dir="in" type="eib">
I P A S
G m b H
©
2 0 0 9
S e i t e
Änderungen vorbehalten
6 9
Version 1.6.6
I P A S
C o m B r i d g e
S t u d i o
V i s u a l
E d i t o r
<param name="alias" value="MaxWind"
<param name="eis" value="Generic" />
<param name="mask" value="0.0.5:2.0.3:5.0.4"
<param name="map" value="Value:Time:Date" />
</port>
The following table shows the meaning of the individual port parameters: the group
address MCG_MA:0/4/6 has a data length of 8 Bytes and contains information about the
date and time at which the maximum wind speed was measured. It is assigned the alias
name MaxWind.
The 8 Bytes of data is broken down into 3 new data objects with the parameter “mask“.
The latter gives the Byte and Bit position and the new data type. The new data types are
separated by a “:“ . In the parameter “map“ the new data types are assigned names in the
same order in which the parameters “mask“ are listed.
Port ID
MCG_MA:0/4/6
alias
mask
0.
: 2.
Description
1.Byte 1.Bit EIS5
map
Vir. Objekt
0.
5
MaxWind
0.
3
3.Byte 1.Bit
EIS3
: 5.
0.
6.Byte 1.Bit
Value
Time
Date
MaxWind.Value
MaxWind.Time
MaxWind.Date
4
EIS4
The corresponding virtual object that can be displayed in the visualisation consists of the
alias name and the new object name.
In the example the data type EIS 5 is assigned the name “Value”, the data type EIS 3 the
name “Time“ and the data type EIS 4 the name “Date”. This means that in the visualisation
the maximum wind speed value can be displayed with the virtual object “MaxWind.Value“.
This way of breaking down data types and allocation to virtual objects means that the
integrator is free to create and display the Non-EIS data types in any way in the
visualisation. The following illustrates a possible visualisation of the maximum wind speed.
In the Automation Service the object with the maximum wind speed is made available
through three virtual objects called MaxWind.Value (EIS 5), MaxWind.Time (EIS 3) and
MaxWind.Date (EIS 4). These objects are visualised as follows:
The date is displayed in the Tech.Edition’s date display element and is configured as
follows: The object name is “MaxWind.Date“. The corresponding source is “virtual“ and the
EIS type is 4. To make sure that the date display remains static and is not triggered by the
PC’s system time, “fixval“ = 1 and “peak“ = 0 need to be set.
S e i t e
Version 1.6.6
7 0
I P A S
Änderungen vorbehalten
G m b H
©
2 0 0 9
I P A S
C o m B r i d g e
Figure 61:
S t u d i o
V i s u a l
E d i t o r
Configuration of MaxWind.Date
The time is displayed in the Tech.Edition‘s time display element and is configured as
follows: The object name is “MaxWind.Time“. The corresponding source is “virtual“ and the
EIS type is 3. To make sure that the time display remains static and is not triggered by the
PC’s system time, “fixval“ = 1 and “peak“ = 0 need to be set.
Figure 62:
Configuration of MaxWind.Time
The value of the maximum wind speed time is displayed in the Tech.Edition‘s value entry
element and is configured as follows: The object name is “MaxWind.Value“. The
corresponding source is “virtual“ and the EIS type is 5.
Figure 63:
Configuration of MaxWind.Value
Standard EIS types can also be broken down in the Automation Service. In many
controller applications, for example, the operating status of the controller is coded in a 1
I P A S
G m b H
©
2 0 0 9
S e i t e
Änderungen vorbehalten
7 1
Version 1.6.6
I P A S
C o m B r i d g e
S t u d i o
V i s u a l
E d i t o r
Byte object, as shown below:
Status Controller
Bit 0: 1: Comfort operating mode active
Bit 1: 1: Standby operating mode active
Bit 2: 1: Night operating mode active
Bit 3: 1: Frost/heat protection (T < 5 °C)
Bit 4: 1: Controller disabled active
Bit 5: 1: Heating; 0: Cooling
Bit 6: 1: Controller active
Bit 7: 1: Frost alarm
To analyse the status information in the visualisation, the 1 Byte status object is broken
down into bits in the Automation Service. The corresponding port definition is listed below:
<ports>
<port ID="MCG_MA:0/5/6" dir="in" type="eib">// Gatewayname:Gruppenadresse
<param name="alias" value="RegStat" // Name für den Reglerstatus
<param name="eis" value="Generic" />
<param name="mask" value="0.1.1:0.2.1:0.3.1:0.4.1:0.5.1:0.6.1:0.7.1"
<param name="map" value="Kom:Sta:Nacht:Frost:Regaccess:Mode:RegStat:Frostalarm"
/>
</port>
The data types are defined in the line “mask“. For example, 0.2.1 means that the 3 Bit of
the 1 Byte is assigned the data type EIS 1. In the visualisation, this value can be displayed
in the virtual object Object RegStat.Night.
Figure 64:
Configuration of RegStat.Night
1 Byte objects can be either of type EIS 14 or EIS 6. The format of a 1 Byte status object
is manufacturer-specific.
Attention! Once the file generic.net has been created and saved, the Automation Service
needs to be re-started (
S e i t e
Version 1.6.6
7 2
CBSUserManualCore, 4.2. Service Control Panel)
I P A S
Änderungen vorbehalten
G m b H
©
2 0 0 9
I P A S
1 1 .
C o m B r i d g e
C o m B r i d g e
S t u d i o
g r a p h i c
V i s u a l
E d i t o r
m o d u l e
A user who has a ComBridge Studio alarm and database license, can use the graphic
module that is included in the standard setup to display recorded values. The alarm and
database service uses a Microsoft Access database where alarms or data points that have
been configured with InfoPoint configurator are saved in alarm or event tables (
see
Combridge Studio Suite manual). The ComBridge Studio graphic module only accesses
the event table of the Microsoft Access database. Figure 60 gives an example of a
Microsoft Access database.
Figure 65:
Example of an Access database
Popup windows for the graphic display of data from the Microsoft Access database can be
,
configured with Visual Editor. In the Tech Edition use the button
which can be found under operating elements, to configure the windows. The button can
be built into any page of the ComBridge Studio visualisation. The button is configured in
the HTML Attributes menu. Figure 61 shows the HTML Attributes window. The size of the
popup window is defined via the attributes w and h. In Figure 61 the size of the popup
window is 550x400 Pixels. The position of the window’s upper left-hand side corner is
x=50 Pixel and y=50 Pixel. The parameters for the display of values are set in the value
field of the attribute href. The database values of the group addresses that are displayed
are those that have been entered in the value field href with Gatewayname:groupaddress.
I P A S
G m b H
©
2 0 0 9
S e i t e
Änderungen vorbehalten
7 3
Version 1.6.6
I P A S
C o m B r i d g e
S t u d i o
V i s u a l
E d i t o r
Attributes such as Label or Title can be used to describe the values in the display.
Figure 66:
Attribute Element Dialogue of Trending Popup
The following attributes can be configured:
groupadr=:
This parameter specifies the group address that is to be displayed.
The group address is entered in the format Gatewayname:groupaddress.
Several values can also be displayed in one graph. In this case the data
points are separated by a comma. For example, for two values in one
graph the data points are entered as follows:
groupadr=WCI:0/4/10,WCI0/4/15.
label=:
This attribute describes the data points in the graphic. The first entry is
assigned to the first data point. The second entry is separated by a
comma and assigned to the second data point, etc. In the example, the
group address 0/4/10 shows brightness levels and the group address
0/4/15 temperature. The label=Brightness,Temperature is used to
describe
the
plots
in
the
graphic.
If
no
name
is
entered,
Gatewayname:Groupaddress appears as description.
title=:
This attribute is used to name the the graphic.
period=:
This attribute illustrates the time period in hours. The period shown is
based on the current date. Entering the number 24, for example, will
display the results of the last 24 hours.
since=:
This attribute shows the date, from which onwards results are displayed
(up to the current date). For example, Since=12/1/2009 shows all values
from 12th January 209 up to the current date. If no date is entered, the
values since the last period will be shown.
Figure 62 shows a possible graphic display of brightness and temperature values.
S e i t e
Version 1.6.6
7 4
I P A S
Änderungen vorbehalten
G m b H
©
2 0 0 9
I P A S
Figure 67:
C o m B r i d g e
S t u d i o
V i s u a l
E d i t o r
Value display using the ComBridge Studio Graphic Module
The name of the graphic is entered through the attribute “title“.
For each power phase values were entered in the database. The graphic shows the
values in three phases. The ticks at the bottom indicate that the corresponding plot is
displayed. A mouse click on the ticks will hide the corresponding plot. If the cursor touches
the plot, the corresponding value and time-stamp are displayed.
Figure 68:
Display of the zoom range
If a specific range of the graphic is selected with the cursor, the section is enlarged. A click
on
will bring back the whole graphic.
Figure 64 shows such a section for the graph Wirk2. The position and the section that has
been enlarged are displayed above the graphic.
I P A S
G m b H
©
2 0 0 9
S e i t e
Änderungen vorbehalten
7 5
Version 1.6.6
I P A S
C o m B r i d g e
Figure 69:
1 2 .
S t u d i o
V i s u a l
E d i t o r
Enlarged section of a plot
O n l i n e
s c e n e
m o d u l e
From the Visual Editor version 1.6.4 onwards the first of three additional modules is
available: the online scene module. Further modules will be the online time switch module
and the logic module. It is often desirable that light scenes can be changed online by the
user directly in the visualisation. However, the operational security must not be endangerd
by erroneous operation. The system integrator therefore principally determines the
objects, which can be allocated to scenes, in the Visual Editor. The user can then change
certain settings and allocations online in the visualisation.
The scene projection in the Visual Editor is performed in two steps:
1. step: web configuration
definition of the scene trigger and selection of EIB objects,
which are to be used in scenes. Allocation of EIB objects in
scenes.
2. step: definition of scene loading in the visualization
To use the scene module, a configuration manager license is necessary..
S e i t e
Version 1.6.6
7 6
I P A S
Änderungen vorbehalten
G m b H
©
2 0 0 9
I P A S
C o m B r i d g e
S t u d i o
V i s u a l
E d i t o r
12.1. Web configuration scene trigger
As soon as a new project has been created in Visual Editor, the start configuration is
performed under menu point
web configuration . If this menu point is selected, the
configuration menu opens with the two basic elements trigger and action elements.
Figure 70:
Web configuration trigger elements
The trigger elements define the conditions for loading a scene. Scenes can be loaded
through EIB objects, virtual objects and Modbus objects. If the trigger elements are
selected with the right mouse button, new triggers can be inserted by selecting New
Action .
Figure 71:
I P A S
Creating a new trigger
G m b H
©
2 0 0 9
S e i t e
Änderungen vorbehalten
7 7
Version 1.6.6
I P A S
C o m B r i d g e
S t u d i o
V i s u a l
E d i t o r
If instead of New Action , Add Elements is chosen, the following window opens:
Figure 72:
Number of Trigger elements
If several scene triggers are required, the number of elements, which are to be created,
can be entered under Number Trigger Elements . If all trigger elements are created,
select the first element with the right mouse button and go to Properties .
Figure 73:
Trigger properties
The field Section shows that trigger properties are defined in this window.
The name of the trigger is entered in the Name field.
If you now open the menu ETS Group Objects , you can connect an ETS group address
with the trigger. This is done by selecting the respective group address with the gateway
name and dropping it in the Object field.
S e i t e
Version 1.6.6
7 8
I P A S
Änderungen vorbehalten
G m b H
©
2 0 0 9
I P A S
C o m B r i d g e
Figure 74:
S t u d i o
V i s u a l
E d i t o r
Connecting a trigger with a group address
In Figure 59 the 1 Bit Object Sz_Nacht was connected with the gateway name WCI. In
the Type field Binary for a 1 Bit Object is automatically set. Therefore the object source
in the field Source is automatically EIB.
If a virtual object with the name Szene1 is entered in the Object field, you must select
VIRTUAL in the Source field and the corresponding type in the Type field.
The fields Obj. Value , Active and Delay are not configured as this step is performed
during the actual scene definition.
If several scene triggers are required, they must first be created in the Web Configuration
menu and then opened in the Trigger Properties window (Figure 58). Now open the ETS
Group Objects menu. Now you can connect the fields Object and Obj. Value , as
previously described. If all fields have been connected, you can use the arrows
to
retrieve the next trigger. If the field Automatically Accept Amendments on Change is
selected, the current settings are saved when changing to the next trigger. The settings
are also saved with Accept . If you want to cancel the process, press Cancel . OK
saves the last setting and terminates the process.
I P A S
G m b H
©
2 0 0 9
S e i t e
Änderungen vorbehalten
7 9
Version 1.6.6
I P A S
C o m B r i d g e
S t u d i o
V i s u a l
E d i t o r
Use the Type field to select the data type,
with which a scene is to be loaded.
According to EIB/KNX a scene can be
loaded, for example, via a 1 Bit as well as a
1 Byte Object.
The object source is selected in the field
Source : In addition to EIB as data type
virtual
objects
VIRTUAL
and
can
be
defined
with
modbus
objects
with
MODBUS in order to trigger a scene.
12.2. Web configuration action elements
After having defined the scene triggers, the next step is to define the action elements.
Group addresses, which are to be used in all scenes, are configured in the
Action
Elements menu.
Figure 75:
Web configuration action elements
Select the menu point Action Elements with the right mouse button, so that the selection
window opens as in Figure 61.
S e i t e
Version 1.6.6
8 0
I P A S
Änderungen vorbehalten
G m b H
©
2 0 0 9
I P A S
Figure 76:
C o m B r i d g e
S t u d i o
V i s u a l
E d i t o r
Creating new action elements
If New Action is selected, a new action element is inserted.
If instead of New Action , Add Elements is selected, the following window opens:
Figure 77:
Number of action elements
If several scene elements are required, the number of elements, which are to be created,
can be entered under
Number Action Elements
. If all action elements have been
created, select the first action element with the right mouse button and go to Properties .
I P A S
G m b H
©
2 0 0 9
S e i t e
Änderungen vorbehalten
8 1
Version 1.6.6
I P A S
C o m B r i d g e
Figure 78:
S t u d i o
V i s u a l
E d i t o r
Opening the scene properties window
The field Section shows that action elements are defined in this window.
The scene element’s name is entered in the Name field.
If you now open the menu ETS Group Objects , you can connect an ETS group address
with the action element. This is done by selecting the respective group address with the
gateway name and dropping it in the Object field.
Figure 79:
Connecting a trigger with a group address
In Figure 64 the Object field with the1 Byte Object Lightning Ceiling-Blue has been
connected with the gateway name WCI. . In the Type field 1BYTE[%] for a 1 Byte
S e i t e
Version 1.6.6
8 2
I P A S
Änderungen vorbehalten
G m b H
©
2 0 0 9
I P A S
C o m B r i d g e
S t u d i o
V i s u a l
Object is automatically set. Therefore the object source in the field
E d i t o r
Source
is again
automatically EIB.
The fields Obj. Value , Active and Delay do not need to be configured at this point.
To configure the next action elements, use the arrows
element. If the field
to retrieve the next action
Automatically Accept Amendments on Change
is selected, the
current settings are saved when changing to the next action element. The settings are also
saved with Accept . If you want to cancel the process, press Cancel . OK
saves the
last setting and terminates the process.
12.3. Web configuration scene definition
If all scene triggers and action elements have been
defined, the actual scenes can be put together. Press the
right mouse button in Web Configuration field to create
scenes by selecting New Scene .
In
Figure
65
three
triggers
have
been
used
(Sc_Groundbel, Sc_Cen_Off und Sc_Night), as well as six
action elements of Type 1 Byte (H1-H3, Red, Green and
Blue).
In addition three new scenes have been created, which
now need to be connected with the individual scene
elements and triggers.
Figure 80:
I P A S
Creating new scenes
G m b H
©
2 0 0 9
S e i t e
Änderungen vorbehalten
8 3
Version 1.6.6
I P A S
C o m B r i d g e
Figure 81:
S t u d i o
V i s u a l
E d i t o r
Connecting scene triggers with scenes
The configuration of the actual scene is performed in two steps by means of a drag-anddrop function. The first step is to connect the scene triggers with the scenes. For example,
Sc_Night is to be connected with the third scene. To do so, select Sc_Night with the
mouse and drag and drop the object onto the third New Scene . The name of the scene
trigger now appears in brackets next to the name of the scene. If you select the name with
the right mouse button, you can open the properties window (Figure 66).
In Figure 66 the scene was given the name Night lights in the field Name . As the
value 1 has been entered in the field Obj. Value , the scene will be started when the
scene trigger with value 1 is sent.
This process is repeated for each scene.
To configure further trigger elements, you can use the arrows
to retrieve the next
trigger element. If the field Automatically Accept Amendments on Change is selected, the
current settings are saved when changing to the next element. The settings are also saved
with Accept . If you want to cancel the process, press Cancel . OK
saves the last
setting and terminates the process.
The second step is to connect the action elements with the scenes. In the same way as
happened with the scene triggers, the action elements are now selected and dragged and
dropped to the respective scene with the mouse button pressed down. As with the scene
triggers, the object name of the action element now appears next to the scene object
name.
S e i t e
Version 1.6.6
8 4
I P A S
Änderungen vorbehalten
G m b H
©
2 0 0 9
I P A S
C o m B r i d g e
S t u d i o
V i s u a l
E d i t o r
If the action element is selected in the scene with the right mouse button and the
properties window is opened, the scene properties can be set.
In connection with the ctrl key, several action elements can be selected and dragged to
the desired scene with the mouse button pressed down.
Figure 82:
Allocation of action elements in scenes
Figure 83:
Setting scene properties
The name of the scene element, in our example H1, is set in the Name field and the
I P A S
G m b H
©
2 0 0 9
S e i t e
Änderungen vorbehalten
8 5
Version 1.6.6
I P A S
C o m B r i d g e
S t u d i o
V i s u a l
E d i t o r
scene value, in our example the light value of 40%, is set in the Obj. Value field. If the
next scene value is to be set with a time delay, you can enter the required time in seconds
in the Delay field.
This process is repeated for each action element in a scene.
To configure further scene properties, you can use the arrows
to retrieve the next
scene element. If the field Automatically Accept Amendments on Change is selected, the
current settings are saved when changing to the action element. The settings are also
saved with Accept . If you want to cancel the process, press Cancel . OK
saves the
last setting and terminates the process.
Object values and delays can be changed online by authorized users at any point later on
via a special configuration page.
12.4. Web config export
If all scene triggers, action elements and the actual scenes have been configured as
described, the configurations are exported. After the export the scenes are activated and
can be loaded for example from the installation with the respective scene trigger.
To export a scene configuration, press the right mouse button in the
menu Web Configuration and select Export .
The settings are exported to corresponding XML-files, which are
processed by the automation services in Client Manager.
With Load New the currently existing configuration can be read.
Figure 84:
Web config export
12.5. Creating
scenes
the
configuration
page
for
The scene settings can be changed online in the visualisation at any time. In order to
make this possible, a configuration menu needs to be activated in the menu Edit Web
Menu.
Open the menu Edit Web Menu . Press the right mouse button in the menu window to
S e i t e
Version 1.6.6
8 6
I P A S
Änderungen vorbehalten
G m b H
©
2 0 0 9
I P A S
C o m B r i d g e
S t u d i o
V i s u a l
E d i t o r
open the selection window. If you select Add Config Menu , a new menu point called
Config is created.
Figure 85:
Creating the web config page in the web menu
If the configuration menu has been created and selected with the right mouse button, you
can open the properties window. You can edit the menu point name in the field Title . Use
the Access window to enter the user level which authorizes opening the configuration
page (
Chapter 7.3.1. User ”General“).
The settings are saved with Accept If you want to cancel the process, press Cancel .
OK saves the last setting and terminates the process.
The web menu now needs to be exported (
Chapter 8.3.5 Menu export).
12.6. Online scene configuration
Once the configuration menu has been configured, scene parameters can be changed and
saved online by authorized users within the web visualisation. Figure 71 gives an example
of the configuration page view after the configuration menu has been selected.
I P A S
G m b H
©
2 0 0 9
S e i t e
Änderungen vorbehalten
8 7
Version 1.6.6
I P A S
C o m B r i d g e
S t u d i o
V i s u a l
Aufruf eines Nummernblocks
zur Eingabe von Szenenwerten
Setzen des neuen
Szenenwertes
Figure 86:
E d i t o r
Online scene configuration
In the “scene navigation“ window on the left-hand side the structure is the same as in the
Visual Editor. Under Scenes the permitted triggers and action elements are listed, which
can not be changed in this application. The projected scenes are listed below. If the
navigation tree below a scene is opened (e.g. Basic Lightning in Figure 71), all scene
object become visible. If a scene element is selected (in our example H1 ), the properties
of the selected scenes are displayed in the right window. In this view the user can change
the name of the object in the field Description . Other scene objects from the pool of
permitted action elements can also be allocated in the field Object . Moreover, the object
can be activated or deactivated in the field Active . The period of time, which is to pass
before the next scene value is set, can be determined in the field Delay in seconds. In
the
Scene Value
field a changed value can be entered. This value is set online by
clicking onto the symbol
. Thereby the user has the opportunity to control the set scene
value. The currently set scene value of the object is displayed in the field Value. If all
settings have been performed, they are saved by pressing Accept so that the next object
can be set. If through this process all scene settings have been performed, settings are
saved permanently in the project by pressing Send to Server .
S e i t e
Version 1.6.6
8 8
I P A S
Änderungen vorbehalten
G m b H
©
2 0 0 9
I P A S
C o m B r i d g e
S t u d i o
V i s u a l
E d i t o r
Attention! If for example the name of a scene object is changed in the properties window,
the change is only displayed after the website has been updated. (
in Explorer)
12.6.1. Online Scenes update
From ComBridge Studio Version 2.4.0 upwards an additional online scenes page is
available, which makes the updating of scenes easier.
Figure 87:
Alternative online scene display
Figure 82 shows the additional page. The projected scenes can be selected in the lefthand column. A clearly laid out table shows a list of the individual scene objects. The tab
„EN“ activates or de-actives the object for the scene. As on the Scene Setup page, use
Delay to enter the time in seconds by which the sending of the object value is to be
delayed. To enter a number, click on the value field. A new entry needs to be confirmed
with Enter. To accept the value as a scene value, press
this way, the scene can be invoked by pressing
. If new values have been set
. The settings are confirmed with
so that further scenes can be changed. Scenes are saved with
and refreshed with
.
I P A S
G m b H
©
2 0 0 9
S e i t e
Änderungen vorbehalten
8 9
Version 1.6.6
I P A S
C o m B r i d g e
S t u d i o
V i s u a l
E d i t o r
12.7. Loading scenes from a website
If scenes are defined with EIB trigger objects, they can be loaded from the installation with
the projected group address. If the scenes are also to be loaded from a website, special
control elements need to be projected.
The process for this is as follows: The TECH EDITION is opened under menu point
Control elements in the left menu.
Figure 88:
Inserting control elements to load scenes
A scene trigger element is selected with the left mouse button, dragged into the work
space and moved to the desired position. In Figure 72 three scene triggers have been
projected. Afterwards the scene menu on the left hand side is opened again. The new
scene trigger on the work space is selected and the properties window opened. Now
select a scene (in Figure 73 this is
SC_ Cen_Off ) from the left window of the web
configuration and drag it into the field Name (the
S e i t e
Version 1.6.6
9 0
folder must be selected).
I P A S
Änderungen vorbehalten
G m b H
©
2 0 0 9
I P A S
Figure 89:
C o m B r i d g e
S t u d i o
V i s u a l
E d i t o r
Projecting a scene trigger on the website
The gateway name together with the group address, which is to start the scene, is
automatically copied to the field Name . The settings such as Object Source and fixval
from the scene settings are also copied. The name of the scene is entered in the control
element through this process, so that the control element has a description. Now the
control element scene trigger is configured. After saving and exporting the settings, the
projected scene can be loaded from the website.
12.8. Scene installation on the server
If the projecting PC and the server are different systems, a number of system files need to
be transferred to the server in addition to the project data in order to ensure that the
projected scenes will run on the server. With regard to the scene control the file
scene_SCENE.env from the directory
C:\Programme\Ipas GmbH\ComBridge Studio Web\_ext needs to be transferred to
the server.
During the installation of ComBridge Studio the website ComBridge Studio Suite
Configuration Upload has also been installed sol that necessary copying processes can be
I P A S
G m b H
©
2 0 0 9
S e i t e
Änderungen vorbehalten
9 1
Version 1.6.6
I P A S
C o m B r i d g e
S t u d i o
V i s u a l
E d i t o r
performed easily.
If the URL http://localhost:32100 is entered in the browser of the ComBridge Studio server,
the ComBridge Studio Suite Configuration Upload page is loaded.
Figure 90:
ComBridge Studio Suite Configuration Upload page
By clicking on
Search
the file selection
window opens. From the server the file
scene_SCENE.env in the directory C:\Programme\Ipas GmbH\ComBridge Studio
Web\_ext on the projecting PC is selected.
Figure 91:
S e i t e
Version 1.6.6
File selection window
9 2
I P A S
Änderungen vorbehalten
G m b H
©
2 0 0 9
I P A S
C o m B r i d g e
S t u d i o
V i s u a l
E d i t o r
By clicking on Open the selection is accepted. By clicking on Press on the webpage,
the file is copied to the server.
Now all system requirements are met and the online scene control is activated.
Figure 92:
1 3 .
Press copies the system file
O n l i n e
s c h e d u l i n g
p r o g r a m m e s
Visual Ediitor can be used to project online weekly schedules which can be changed at
any time on the visualisation’s config page. The project designer determines the objects
that are to be switched on certain days and at certain times.
Go to the menu point Weekly Schedule to open the configuration window.
I P A S
G m b H
©
2 0 0 9
S e i t e
Änderungen vorbehalten
9 3
Version 1.6.6
I P A S
C o m B r i d g e
Figure 93:
S t u d i o
V i s u a l
E d i t o r
View of the weekly schedule menu
The tree structure allows for the individual objects to be aranged in groups. To create new
groups, click on the right mouse button in the Weekly Schedule window. To name the
group, select the group and use the right mouse button to choose the menu point
Rename. The same process is used to assign data points to the groups and events to the
data points. This way a tree structure is created. The following is an example of a possible
tree structure: Data points for night turn down and presence are assigned to the group
heating. Data points for exterior lighting and corridor lighting are assigned to the group
lighting. Several events can now be assigned to the data points. Night turn down for
example, requires an event to activate, and a data point to deactivate.
Figure 94:
S e i t e
Version 1.6.6
Data point properties
9 4
I P A S
Änderungen vorbehalten
G m b H
©
2 0 0 9
I P A S
C o m B r i d g e
S t u d i o
V i s u a l
E d i t o r
Select the data point and use the right mouse button to open the properties window and
configure the parameters. If the ETS group addresses are open, they can be dragged into
the object field via Drag&Drop. The name of the datapoint is taken over from the group
addresses. Min. and Max. Value limit the values of the data point. As is the case with web
scenes, the Type field defines the data format and the Source field defines the
communication.
Select the event underneath the data point to enter a day and time to switch the required
value.
Figure 95:
Event properties
The Active flag activates the event. If the Retrace flag is selected, the system will check for
example whether an action needs to be repeated after a power cut.
Once all settings have been performed, the weekly schedules
need to be exported, like the scenes. After the export, the weekly
schedules are active on the server.
I P A S
G m b H
©
2 0 0 9
S e i t e
Änderungen vorbehalten
9 5
Version 1.6.6
I P A S
C o m B r i d g e
S t u d i o
V i s u a l
E d i t o r
13.1. Online page weekly schedules
If the config menu is activated in the visualisation, the Schedules Setup page can be
opened.
Figure 96:
Setup page weekly schedules
Select a data point in the left-hand column to display the projected actions. This view can
also be used to change the settings. By pressing the
symbol the settings will be saved
and executed at the set time.
S e i t e
Version 1.6.6
9 6
I P A S
Änderungen vorbehalten
G m b H
©
2 0 0 9
I P A S
1 4 .
C o m B r i d g e
S t u d i o
V i s u a l
E d i t o r
A p p e n d i x
14.1. Apache Web Server
Apache is an http server. The internet browser connects with this sever in order to obtain
HTML pages. When installing IPAS ComBridge Studio Suite the web server Apache is
installed at the same time. Its configuration file httpd.conf is already prepared for
providing IPAS ComBridge Studio Visual Director web pages. Only the project specific
settings are performed in Visual Editor. Visual Editor creates port addresses depending on
the project name of the virtual host and defined by the project designer. These definitions
are saved on the projecting PC in the directory
C:\Programme\Ipas GmbH\ComBridge Studio Web\__vhosts
The file is called Projektnamen.conf. Apache reads the project specific file with the
Apache configuration file httpd.conf when the PC is started. In general Apache is
automatically restarted, when changes are made with Visual Editor. If the restart does not
happen automatically, it needs to be performed manually. The status of Apache can be
observed in the task bar of the PC.
Apache Symbol, wenn Apache gestartet ist.
Figure 97:
Status of Apache started
A double-click on the Apache symbol in the task bar opens the Apache service monitor. If
changes have been made, Apache can be restarted by pressing Restart .
Figure 98:
Apache Service Monitor
If Apache has been stopped, the symbol changes as in figure 79.
I P A S
G m b H
©
2 0 0 9
S e i t e
Änderungen vorbehalten
9 7
Version 1.6.6
I P A S
C o m B r i d g e
S t u d i o
V i s u a l
E d i t o r
Apache Symbol, wenn Apache gestoppt ist.
Figure 99:
Status of Apache stopped
The file httpd.conf can be opened in the directory
C:\Programme\Apache Group\Apache2\conf\httpd.conf if further settings need to be
performed.
14.2. Windows Firewall
Depending on the configuration of the operating system, port numbers can be blocked for
security reasons so that web applications cannot be started. In this case the ports, which
use the ComBridge Studio Suite, need to be cleared. Open the configuration window with
Start/System Control/Windows Firewall . In the “Exceptions“ window the ports can be
defined which are to open the Firewall.
Figure 100:
Windows Firewall
If you select Port... , the following window opens:
S e i t e
Version 1.6.6
9 8
I P A S
Änderungen vorbehalten
G m b H
©
2 0 0 9
I P A S
C o m B r i d g e
Figure 101:
S t u d i o
V i s u a l
E d i t o r
Port clearance in the Windows Firewall
In Figure 81 the port 32001 has been cleared for the visualisation project IPAS01
ComBridge Studio Suite uses the following ports, which might have to be cleared in
Firewalls:
Connection between Configuration Manager and EIBnet/IP Gateway
Port 3671
Connection to the Client Manager
Port 3013
Connection to web visualisations
depending on project
Connection to the web configurator
Port 3011
14.3. Visual Editor FTP Service Program
The FTP service program (File Transfer Protocol) supports the data and file transfer to
standard FTP servers. It helps in cases in which there is no automatic data transfer via the
upload function or where advanced functions such as for example download, create/delete
additional folders, etc. are needed. To start this component, click the FTP function key in
the administration folder list.
I P A S
G m b H
©
2 0 0 9
S e i t e
Änderungen vorbehalten
9 9
Version 1.6.6
I P A S
C o m B r i d g e
Figure 102:
S t u d i o
V i s u a l
E d i t o r
User surface FTP service program
The FTP service program’s user surface consists of three parts. The local directory is
listed in the upper left part. The current server directory is listed in the upper right part. The
bottom part contains command keys and message windows. The size of each part can be
adjusted according to requirements. In order to do so, move the cursor to the dark grey
window frames until the cursor symbol changes. Click the left mouse button and increase
or reduce the window size as required.
Time and duration of the connection as well as name and IP address of the contacted
server are shown in the status list. The lamp symbol
on the right side of the status
bar signals either an active connection (green) or an inactive connection (red) to a server.
14.4. Connect / disconnect server
Connection with the FTP server is made by pressing the command key with the open
lock symbol
. When connected, the symbol changes to a closed lock symbol.
The connection can be stopped again with the same command key.
The last activated server profile is used for the connection. The active server profile is
shown in the header of FTP@X. If no profile has been defined or if you would like to
contact another server, choose the desired server profile via the command key
S e i t e
Version 1.6.6
1 0 0
I P A S
Änderungen vorbehalten
G m b H
©
.
2 0 0 9
I P A S
C o m B r i d g e
14.5. Starting
server
data
S t u d i o
transfer
V i s u a l
from
and
E d i t o r
to
the
The data transfer is initiated via the command keys between the directory views. The
transfer is performed in direction of the pressed arrow button. The double arrow buttons
transfer the entire directory without considering any prior selection. Potentially existing
sub-directories are transferred at the same time. The single arrow buttons only transfer
the files/directories which have been selected in the respective window. Please remember
that they will also be transferred inclusive of all their sub-directories.
In addition to the transfer functions you can perform further functions via a popup menu.
Click on one of the directory windows with the right mouse button. The popup menu
appears as shown in figure 82. The following additional functions can be performed via the
menu:
-
Create directories
-
Rename files / directories
-
Delete files / directories
-
Open files
If you press Open File of a server file (the function is performed in the right list view), the
file is transferred from the server to the local work station and opened with a program
registered for this type of file. After closing the program, you will be automatically asked to
confirm the transfer back to the server.
If you press Open File of a local file (the function is performed in the left list view) the
program registered for this type of file in Windows is started to edit the file. If no
registration for this type of file exists, the file is opened in text editor.
14.6. Befehlstasten im Überblick
Open and execute FTP@x Script file
Open and close a server connection
Send ABOR command to the sever
Disconnect socket connection and thereby cancel transfer
Start server profile dialogue
Display log file via connection or disconnection
Start FTP@X configuration dialogue
Create internet connection via remote data transfer, if available
Terminate FTP@x
I P A S
G m b H
©
2 0 0 9
S e i t e
Änderungen vorbehalten
1 0 1
Version 1.6.6
I P A S
C o m B r i d g e
S t u d i o
V i s u a l
E d i t o r
14.7. Configuring FTP@x
FTP@x is configured via a dialogue which is loaded by pressing the command key
.
The dialogue which appears subsequently can be seen in figure 83.
The configuration dialogue for FTP@x is divided into several panes which are displayed
via the tabs “General”, “Transfer”, “File Code” and “Remote Data Transfer Connection”.
The entries for each dialogue pane are described in detail below.
14.7.1. General
In the “General” pane in figure 83 you can enter details regarding the e-mail address, the
standard file display program, the proxy server and the log preferences. The e-mail
address is needed in case you would like to contact an FTP server anonymously (guest
access). In this case the server usually requires the E-mail Address as a password. The
Display Program serves to display files if the command Open has been activated and no
application program is registered for this type of file. Should you wish to connect to the
target PC via an FTP proxy server, activate the control box Use Proxy
and enter the
Port and Host of the proxy server in addition.
FTP@x configuration
Figure 103:
14.7.2. Transfer
The „transfer“ pane in figure 84 is used to set the general transfer protocol. By using the
start mode you can set the position which the switch is to adopt for data transfer when
starting up the FTP component.
S e i t e
Version 1.6.6
1 0 2
I P A S
Änderungen vorbehalten
G m b H
©
2 0 0 9
I P A S
C o m B r i d g e
Figure 104:
S t u d i o
V i s u a l
E d i t o r
Data transfer settings
14.7.3. File extension
The “file extension“ is used to distinguish in the automatic transfer mode between binary
data transfer (e.g. image files) and ASCII text data transfer. No distinction is made
between small and capital letters in the file extensions. Enter all file extensions, which
describe an ASCII text file and are to be transferred in ASCII mode, in the list.
FTP@x configuration file extension
Figure 105:
I P A S
G m b H
©
2 0 0 9
S e i t e
Änderungen vorbehalten
1 0 3
Version 1.6.6
I P A S
C o m B r i d g e
S t u d i o
V i s u a l
E d i t o r
Depending on the operating system of the server the end of line symbols CR+LF
(DOS/Windows) are changed to simple LF (Unix) symbols in ASCII mode.
If you do not wish to transfer any data in the ASCII mode, delete all ASCII file extensions
and set the start mode to Binary. See figure 85.
14.7.4. Remote Data Transfer connection
You will only need the dialogue pane “Remote Data Transfer connection” if you have a
dial-up connection to the internet and would like FTP@X to automatically start this when
connecting to the server.
14.8. Server profile
A so-called server profile needs to be created for every server which you would like to
contact with FTP@x. FTP@x is able to administer any number of server profiles.
14.8.1. Server-Profile Erstellen/Auswählen
The server profile dialogue is started via the command key
and is used for profile
administration. This means you can add new profiles or rename, copy or delete existing
profiles. The dialogue is also used to change the server profile for connection. Select the
desired server profile and press Connect as in figure 86. The server profile remains
active until you choose a new profile via the same form.
Figure 106:
Creating a server profile
If you click inside the server profile list (i.e. select a server profile) you will see that the
name of the last tab changes to the name of the selected server profile. If you select this
tab you will be able to set the properties of the selected server profile.
S e i t e
Version 1.6.6
1 0 4
I P A S
Änderungen vorbehalten
G m b H
©
2 0 0 9
I P A S
C o m B r i d g e
S t u d i o
V i s u a l
E d i t o r
14.8.2. Server profile login settings
If you select the server profile tab (in the following figure 87 this is the “DEFAULT” tab ) the
following additional tabs become accessible at the bottom of the pane: “Login”,
“Initialising”, “Firewall” and “Extras”.
Server address, user name, password and port
number (initial port 21 = ftp) are entered in the “Login” form as essential access data to the
server.
Via the control box Anonymous you can determine whether you would like to create
guest access to the server. In this case the e-mail address entered in the “General” form of
the FTP@X configuration dialogue is sent to the server as access password. With the
control box Save you determine whether the password entered is to be saved. Even
though the password characters are hidden, you should avoid saving the password in a
multiple user work environment, as the profile may be misused to obtain access to the
server.
Figure 107:
Server profile settings
14.8.3. Server profile initialisation settings
You can enter file filter and initial folders, which will be set when connecting to the server,
in the initialization form. See Figure 88. Please pay particular attention to the box Use
Passive Transfer . In this mode the client (FTP@X) and not the server initiates the data
transfer. If there are frequent errors during data transfer, activate the passive transfer
mode.
I P A S
G m b H
©
2 0 0 9
S e i t e
Änderungen vorbehalten
1 0 5
Version 1.6.6
I P A S
C o m B r i d g e
Figure 108:
S t u d i o
V i s u a l
E d i t o r
Server profile initialisation
14.8.4. Server profile Firewall
You will need the “Firewall“ form in Figure 89 in case your PC is located in a LANenvironment (LAN = Local Area Network) and contacts the internet via a computer that
acts as Firewall. If login details for the firewall are needed, tick the control box Use
Firewall and complete the access details.
Figure 109:
Server profile Firewall
14.8.5. Server profile Extras
Additional optional transfer properties can be set with the configuration pane “Extras”.
S e i t e
Version 1.6.6
1 0 6
I P A S
Änderungen vorbehalten
G m b H
©
2 0 0 9
I P A S
C o m B r i d g e
Figure 110:
S t u d i o
V i s u a l
E d i t o r
Server profile Extras
14.9. Language selection
At present two languages are available. The user can choose between German and
English. See the following figure.
Figure 111:
I P A S
G m b H
Language selection
©
2 0 0 9
S e i t e
Änderungen vorbehalten
1 0 7
Version 1.6.6
I P A S
C o m B r i d g e
S t u d i o
V i s u a l
E d i t o r
14.10. ETS export of group addresses
A group export is created in ETS 2 V1.3 by selecting in the group address window the
main path of the addresses and choosing the command Project/Print . In the print window
choose Divert Export to File and enter the name and the path under which the export file
is to be saved.
Figure 112:
Creating a group export in ETS 2 V1.3
The export window is loaded in ETS 3 with the command File/Data Exchange .
If OPC Export is chosen, the group addresses are saved in an ESF file.
S e i t e
Version 1.6.6
1 0 8
I P A S
Änderungen vorbehalten
G m b H
©
2 0 0 9
I P A S
C o m B r i d g e
S t u d i o
Figure 113:
ETS 3 surface
Figure 114:
OPC export in ETS 3
V i s u a l
E d i t o r
A file explorer window opens in which the location for saving the export can be set.
ETS2 text and ETS3 OPC export can be read in Visual Editor.
14.11. Explorer display
The Internet Explorer window can be opened in different display formats. In standard
mode certain function menus are visible which are hidden in the full screen mode (key
F11). In order to start the visualisation without Explorer functions, you can create a
shortcut for loading your visualisation. To do so click on the active login page with the right
mouse button and select Create connection
I P A S
G m b H
©
2 0 0 9
S e i t e
Änderungen vorbehalten
1 0 9
Version 1.6.6
I P A S
C o m B r i d g e
Figure 115:
S t u d i o
V i s u a l
E d i t o r
Explorer information
Internet Explorer informs you that a shortcut has been created on the desktop.
With iexplore –k URL, Explorer is started in full screen mode. In order to close Explorer,
press the key combination [ALT]+[F4].
S e i t e
Version 1.6.6
1 1 0
I P A S
Änderungen vorbehalten
G m b H
©
2 0 0 9
I P A S
C o m B r i d g e
S t u d i o
V i s u a l
E d i t o r
14.12. Overview of EIS types
EIS 1
Description
Data Type
Data length
binary
Unit
Function
1 Bit
Switch On/Off
EIS 2
Description
Data Type
Data length
Unit
Function
Switch
1 Bit
Switch On/Off
Dimming
4 Bit
4 Bit Dimming
Percentage
5.001
1 Byte
%
Value
setting,
8
Bit
status
EIS 3
Description
Data Type
Time
Data length
3 Byte
Unit
Function
H:M:S
Time
EIS 4
Description
Data Type
Data length
Date
Unit
3 Byte
Function
DD.MM.YYYY
Date
EIS 5
Description
Data Type
Data length
Unit
Function
Temperature
9.001
2 Byte
°C
e.g. temperature
Temperature
9.002
2 Byte
°K
Temperature conversion
Light
9.004
2 Byte
Lux
e.g. brightness
Speed
9.005
2 Byte
m/s
e.g. speed
Pressure
9.006
2 Byte
Pa
e.g. water pressure
EIS 6
Description
Data Type
Percentage
5.001
Data length
1 Byte
Unit
Function
%
0 – 100 % e.g. relative
dimming value
Degree °
5.003
1 Byte
°
0 – 360 ° e.g. wind
direction
I P A S
G m b H
©
2 0 0 9
S e i t e
Änderungen vorbehalten
1 1 1
Version 1.6.6
I P A S
C o m B r i d g e
S t u d i o
V i s u a l
E d i t o r
EIS 7
Description
Data Type
Data length
Unit
Function
Blinds
1 Bit
Blinds up/down
Slats
1 Bit
Slats open/close
EIS 9
Description
Data Type
Data length
Unit
Function
Energy
14.031
4 Byte
Joule (J)
e.g. energy
Frequency
14.033
4 Byte
Hz
e.g. frequency
Mass
14.051
4 Byte
Kg
e.g. weight
Power
14.056
4 Byte
W
e.g. electrical power
Data Type
Data length
Unit
2 Byte
-
e.g. meter
2 Byte
-
e.g. meter
Data length
Unit
4 Byte
-
e.g. meter
4 Byte
-
e.g. meter
Data length
Unit
1 Byte
-
e.g. meter
1 Byte
-
e.g. meter
EIS 10
Description
Meter without
Function
plus/minus
sign
Meter
with
plus/minus
sign
EIS 11
Description
Data Type
Meter without
Function
plus/minus
sign
Meter
with
plus/minus
sign
EIS 14
Description
Data Type
Meter without
Function
plus/minus
sign
Meter
with
plus/minus
sign
S e i t e
Version 1.6.6
1 1 2
I P A S
Änderungen vorbehalten
G m b H
©
2 0 0 9
I P A S
C o m B r i d g e
S t u d i o
V i s u a l
E d i t o r
14.13. Table of Figures
Figure 1:
“Settings“ in Internet Explorer ......................................................................... 8
Figure 2:
Activating visual styles on pushbuttons and control elements........................ 9
Figure 3:
”Internet options/Advanced“............................................................................ 9
Figure 4:
Internet options ”Security settings“ ............................................................... 10
Figure 5:
EIBnet/IP networksIPAS ComBridge Studio Visual Director ........................ 11
Figure 6:
Program window Visual Editor ...................................................................... 12
Figure 7:
Creating new projects ................................................................................... 13
Figure 8:
Visual Editor and Visual Director are located on a PC ................................. 14
Figure 9:
Root path equates to target path .................................................................. 14
Figure 10:
Projecting PC and server on the network ..................................................... 16
Figure 11:
Root path does not equate to target path ..................................................... 16
Figure 12:
ComBridge Studio Suite Configuration Upload page ................................... 17
Figure 13:
File selection window .................................................................................... 18
Figure 14:
Press copies the system file ......................................................................... 18
Figure 15:
ComBridge Studio Server via Internet .......................................................... 19
Figure 16:
Accessibility of the ComBridge Studio Server via the Internet ..................... 20
Figure 17:
User administration “General“....................................................................... 21
Figure 18:
User administration “Login“........................................................................... 22
Figure 19:
User administration “Presence“ .................................................................... 23
Figure 20:
User administration “Configuration“ .............................................................. 24
Figure 21:
Start screen after users have been configured............................................. 25
Figure 22:
Loading group address properties ................................................................ 26
Figure 23:
Importing ETS group addresses ................................................................... 27
Figure 24:
View of group addresses after being imported ............................................. 28
Figure 25:
Folder list “Project“ with active top.htm........................................................ 29
Figure 26:
Visual Director Standard Navigation with Alarm ........................................... 30
Figure 27:
Folder list Edit Web Menu............................................................................. 31
Figure 28:
Alarm overview after pressing Alarm ............................................................ 32
Figure 29:
Menu properties ............................................................................................ 33
Figure 30:
Example of a projected site navigation ......................................................... 34
Figure 31:
Projecting a global sensitive link ................................................................... 35
Figure 32:
Open HTML page sound2.htm...................................................................... 36
Figure 33:
Setting the playback time: left 6 sec., right infinite........................................ 37
Figure 34:
Properties to playback a sound file............................................................... 37
Figure 35:
Settings to stop a sound ............................................................................... 38
Figure 36:
Logo Dialogue ............................................................................................... 38
Figure 37:
Visualisation login screen ............................................................................. 39
Figure 38:
First test of the visualisation.......................................................................... 40
Figure 39:
Navigation menu ........................................................................................... 40
I P A S
G m b H
©
2 0 0 9
S e i t e
Änderungen vorbehalten
1 1 3
Version 1.6.6
I P A S
C o m B r i d g e
S t u d i o
V i s u a l
E d i t o r
Figure 40:
Dialogue box Open Picture File and Search Folder......................................43
Figure 41:
Element properties of the image on the Start.htm page ..............................44
Figure 42:
Element properties ........................................................................................44
Figure 43:
Choosing the background colour...................................................................45
Figure 44:
Absolute Positioning ......................................................................................45
Figure 45:
Detail Symbols...............................................................................................46
Figure 46:
Anchor point of an image...............................................................................46
Figure 47:
Editing an object with element properties......................................................47
Figure 48:
Changing font properties ...............................................................................48
Figure 49:
Inserting control elements .............................................................................48
Figure 50:
Projecting a control switch and value display................................................49
Figure 51:
Position of control elements ..........................................................................51
Figure 52:
Control element properties ............................................................................51
Figure 53:
Connecting group addresses.........................................................................52
Figure 54:
Allocation in the case of dimming objects .....................................................53
Figure 55:
Browser view of the visualisation ..................................................................54
Figure 56:
Status display ................................................................................................54
Figure 57:
Target path to the network PC ......................................................................55
Figure 58:
Updating a project .........................................................................................56
Figure 59:
Updating the start server ...............................................................................56
Figure 60:
Netlist generic.net..........................................................................................69
Figure 61:
Configuration of MaxWind.Date.....................................................................71
Figure 62:
Configuration of MaxWind.Time ....................................................................71
Figure 63:
Configuration of MaxWind.Value ...................................................................71
Figure 64:
Configuration of RegStat.Night......................................................................72
Figure 65:
Example of an Access database ...................................................................73
Figure 66:
Attribute Element Dialogue of Trending Popup .............................................74
Figure 67:
Value display using the ComBridge Studio Graphic Module.........................75
Figure 68:
Display of the zoom range.............................................................................75
Figure 69:
Enlarged section of a plot ..............................................................................76
Figure 70:
Web configuration trigger elements...............................................................77
Figure 71:
Creating a new trigger ...................................................................................77
Figure 72:
Number of Trigger elements..........................................................................78
Figure 73:
Trigger properties ..........................................................................................78
Figure 74:
Connecting a trigger with a group address....................................................79
Figure 75:
Web configuration action elements ...............................................................80
Figure 76:
Creating new action elements .......................................................................81
Figure 77:
Number of action elements............................................................................81
Figure 78:
Opening the scene properties window ..........................................................82
Figure 79:
Connecting a trigger with a group address....................................................82
S e i t e
Version 1.6.6
1 1 4
I P A S
Änderungen vorbehalten
G m b H
©
2 0 0 9
I P A S
C o m B r i d g e
S t u d i o
V i s u a l
E d i t o r
Figure 80:
Creating new scenes .................................................................................... 83
Figure 81:
Connecting scene triggers with scenes ........................................................ 84
Figure 82:
Allocation of action elements in scenes........................................................ 85
Figure 83:
Setting scene properties ............................................................................... 85
Figure 84:
Web config export ......................................................................................... 86
Figure 85:
Creating the web config page in the web menu............................................ 87
Figure 86:
Online scene configuration ........................................................................... 88
Figure 87:
Alternative online scene display ................................................................... 89
Figure 88:
Inserting control elements to load scenes .................................................... 90
Figure 89:
Projecting a scene trigger on the website..................................................... 91
Figure 90:
ComBridge Studio Suite Configuration Upload page ................................... 92
Figure 91:
File selection window .................................................................................... 92
Figure 92:
Press copies the system file ......................................................................... 93
Figure 93:
View of the weekly schedule menu............................................................... 94
Figure 94:
Data point properties..................................................................................... 94
Figure 95:
Event properties............................................................................................ 95
Figure 96:
Setup page weekly schedules ...................................................................... 96
Figure 97:
Status of Apache started............................................................................... 97
Figure 98:
Apache Service Monitor................................................................................ 97
Figure 99:
Status of Apache stopped............................................................................. 98
Figure 100:
Windows Firewall ...................................................................................... 98
Figure 101:
Port clearance in the Windows Firewall .................................................... 99
Figure 102:
User surface FTP service program ........................................................ 100
Figure 103:
FTP@x configuration .............................................................................. 102
Figure 104:
Data transfer settings .............................................................................. 103
Figure 105:
FTP@x configuration file extension ........................................................ 103
Figure 106:
Creating a server profile .......................................................................... 104
Figure 107:
Server profile settings.............................................................................. 105
Figure 108:
Server profile initialisation ....................................................................... 106
Figure 109:
Server profile Firewall.............................................................................. 106
Figure 110:
Server profile Extras................................................................................ 107
Figure 111:
Language selection ................................................................................. 107
Figure 112:
Creating a group export in ETS 2 V1.3 ................................................... 108
Figure 113:
ETS 3 surface.......................................................................................... 109
Figure 114:
OPC export in ETS 3............................................................................... 109
Figure 115:
Explorer information ................................................................................ 110
I P A S
G m b H
©
2 0 0 9
S e i t e
Änderungen vorbehalten
1 1 5
Version 1.6.6