1
..
Setup
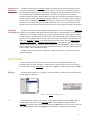
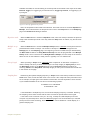
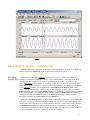
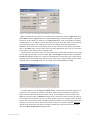
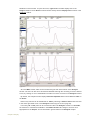
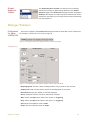
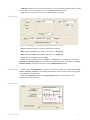
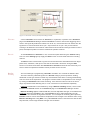
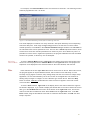
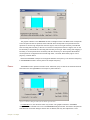
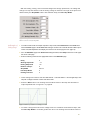
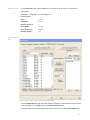
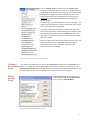
If baseline shifts are causing a loss of a Periodic function online proceed to the Functions
page in the Preferences dialogue window. To use Baseline Tracking, advance the Baseline
Tracking slide bar about 10% from the left side. Return to the Main window and check the
recording. If the Periodic function is still being dropped online, increase the amount of filtering
by moving the Baseline Tracking slide bar another 10%.
Activating
Periodic
Transforms
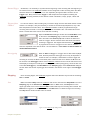
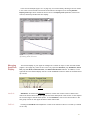
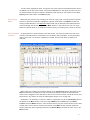
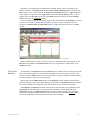
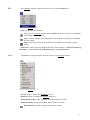
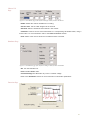
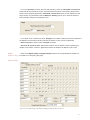
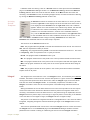
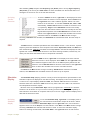
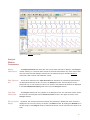
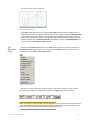
All Periodic functions are selected in the same manner. To use any of these
functions, right-click on the display area of the channel where the function is
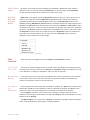
to be displayed. Select Periodic from the right-click menu and a submenu
appears. Select one of the functions in the submenu. By default, raw data will
be collected on the channel immediately above the calculated channel
(Channel 1 for calculated Channel 2, Channel 3 for calculated Channel 4,
etc.). Use the Set Raw Channel function at the bottom of the right-click menu
for the calculated channel to select a different channel as the source of raw
data. Click Start in the Main window to begin recording. AutoScale the raw data, then
AutoScale the calculated channel. No other setup is required.
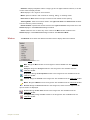
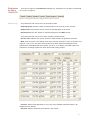
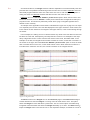
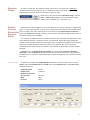
The functions in the Periodic submenu are:
Rate: The program takes the period in seconds and divides this value into 60. The result is a
rate, which is expressed in beats per minute
Frequency: The program takes the period in seconds and divides this value into 1. The result
is a frequency, which is expressed in Hz or cycles per second.
Period: The program takes the Period for each cycle.
Min: The program examines all of the points in the current period and finds the lowest value.
Max: The program examines all of the points in the current period and finds the highest value.
Mean: The program examines all of the points in the current period and finds the average of
all values.
RMS: The program examines all of the points in the current period and finds the Root Mean
Square value for all points
Integral
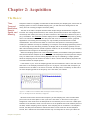
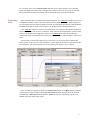
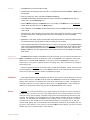
The integral is the area under the curve. The Integral function, as executed by the LabScribe
software, calculates a continuous sum of all the data points on a given channel and plots the
running total. Data points with values above zero make the Integral larger, those with values
less than zero make the Integral smaller. To successfully complete the calculation of the
Integral, the location of the zero-line and the portion of the data being examined need to be
known.
Setting the baseline of the raw data channel to zero is the more important of the two requirements since this function defines the difference between positive and negative areas of the
recording. If the baseline of the raw data record is in the positive range of amplitudes, then the
Integral will have a positive slope, even though no signal is present. Conversely, if the baseline
of the raw data is in the negative range, the Integral will have a negative slope.
The portion of raw data to be integrated should be a manageable size. If too much raw data is
integrated, navigating through the data and measuring changes in the Integral value is more
difficult.
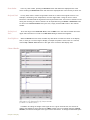
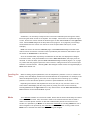
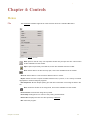
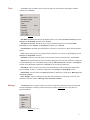
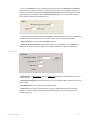
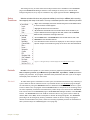
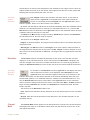
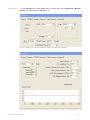
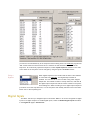
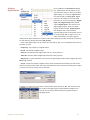
There are two parameters that can be set to control the Integral functions. These are found in
the Integral section on the Functions page of the Preferences dialogue window. All these
parameters are involved in setting or maintaining the zero-line for the Integral calculation.
Chapter 1: Analysis
53