1
..
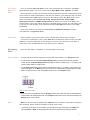
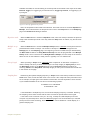
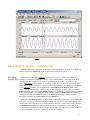
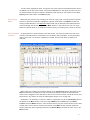
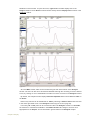
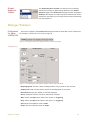
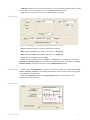
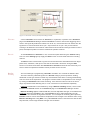
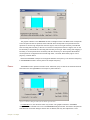
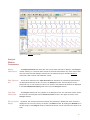
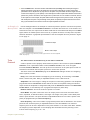
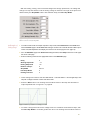
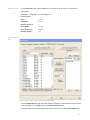
Tiled or Stacked By default, the sweeps selected for display are presented in Tiled mode. Each sweep is
Display
displayed in its own area. By clicking the Stacked box in the left margin of the ScopeView
window, selected sweeps can be overlaid on the same set of axes.
Right-Click
Menu in the
ScopeView
Window
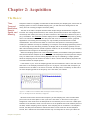
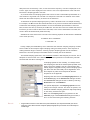
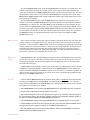
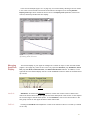
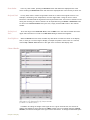
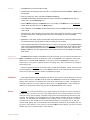
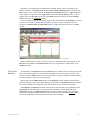
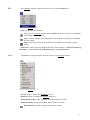
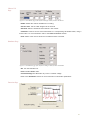
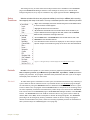
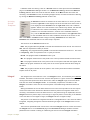
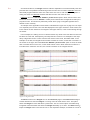
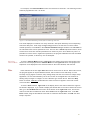
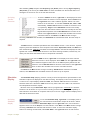
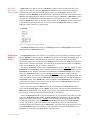
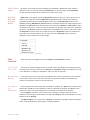
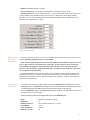
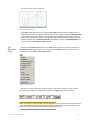
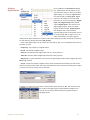
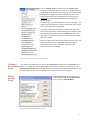
Right-click in the display area of the ScopeView window to bring up a menu like the one in
Figure 5-12 on page 65. Selecting Add Title to Journal sends the names of the analyses
(calculations) being performed (and displayed at the top of the ScopeView window) to the
Journal. Selecting Add Data to Journal sends the calculated values from these analyses to the
Journal. The right-click menu also gives the user the option to Zoom In or Zoom Out to refine
the selection. As before, cursors are used to determine the portions of the data to be zoomed to
full screen. The Zoom In function will expand the area between the cursors to full screen. When
the Zoom Out function is used, the original screen of the ScopeView window is positioned in
the middle of a 3X larger data set. So, for each click of the Zoom Out function, the time
displayed on the window is three times longer.
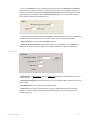
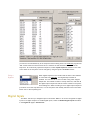
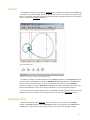
Figure 5-12: The ScopeView right-click menu.
Table
Functions
V1, V2, T1, T2,
V2-V1, T2-T1
These functions are available in both the Analysis and ScopeView windows.
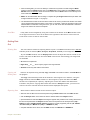
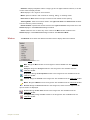
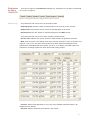
This group of functions simply reports the values in time and voltage for the data points intersected by each of the two cursors in the Analysis or ScopeView window. The difference in time
or the difference in voltage (or calibrated Y-value) can also be reported.
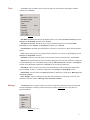
Max, Min, Mean, For this group of functions, all data points between the cursors are examined. The maximum,
the minimum, or the mean value in the data set are reported. The difference between the
Max-Min
maximum and minimum value can also be reported.
Area, Integral,
and
ABS_Integral
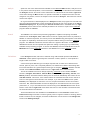
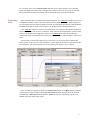
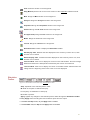
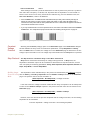
All the integral and area functions are calculated as integrals. The Area function uses the line
between V1 and V2 as the zero baseline, and then calculates the integral. The Area function
gives more control over which segments of a waveform are included in the integral.
For the Integral calculation, zero Volts (or zero calculated Y-value) is used as the zero
reference for the integral. Values above zero add to the Integral, and values below the zero-line
subtract from the Integral.
The ABS_Integral is very much like the Integral, except that the program takes the absolute
value of the raw data before performing the integral operation.
Chapter 1: Analysis
65