1
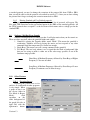
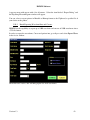
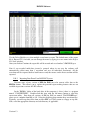
EMWIN 8.2.3
User’s Manual
Version 1.3
April 20, 2009
Version 1.1
0086
Page 49 of 44
LKC Technologies, Inc.
2 Professional Drive
Suite 222
Gaithersburg, MD 20879
301.840.1992
800.638.7055
301.330.2237 (fax)
[email protected]
www.LKC.com
Copyright © 2009, LKC Technologies. All Rights Reserved
LKC Technologies, Inc.
Customer Service/Support
800.638.7055 (US & Canada)
301.840.1992 (Worldwide)
301.330.2237 (FAX)
[email protected]
www.LKC.com
SOFTWARE LICENCE
The UTAS software is a copyrighted product of LKC Technologies, Inc. and is included with the UTAS
system under the following license agreement:
The software may be used in conjunction with the UTAS system only. The purchaser of the
UTAS system may make copies of the software for convenience of use, provided the LKC
copyright notice is preserved with each copy. This license specifically prohibits the use of this
software in a system that does not include an LKC Technologies, Inc. UTAS Interface Unit.
Additional copies of the software may be purchased to produce reports of UTAS data using a
stand-alone computer system.
Version 1.3
ii
INTRODUCTION
EMWIN 8.2.3 version can be installed on any EPIC-4000, UTAS- E 3000,
UTAS-E 4000 and UTAS systems running with Windows XP.
This manual will show picture of the software when in use on a UTAS system. Some
parameters windows will defer depending on which system the software is installed on
(amplifier, ganzfeld, averaging settings…)
Version 1.3
iii
1.0
Introduction............................................................................................................................... 6
2.0
Using the System ....................................................................................................................... 6
2.1
Starting and Quitting the System ........................................................................................ 6
2.2
The Main Menu..................................................................................................................... 6
2.3
2.4
2.5
2.3.1
2.3.2
2.3.3
2.3.4
2.3.5
Setting Preferences in Utilities............................................................................................. 7
Entering the Report Header ............................................................................................ 7
Creating the Storage Database ........................................................................................ 7
Selecting the Storage Database....................................................................................... 8
Selecting the Date Format............................................................................................... 9
Selecting the Screen Size ................................................................................................ 9
2.4.1
2.4.2
2.4.3
2.4.4
More on Utilities.................................................................................................................... 9
Backing Up Databases .................................................................................................... 9
Editing a Database / Patient Information ...................................................................... 10
Editing the Diagnosis List............................................................................................. 10
System Preferences ....................................................................................................... 10
2.5.1
2.5.2
2.5.3
Performing a Test ............................................................................................................... 11
Selecting a Test ............................................................................................................. 11
Patient Information ....................................................................................................... 11
Channel Information ..................................................................................................... 14
2.6
Icons and Menus ................................................................................................................. 14
2.6.1
Parameters..................................................................................................................... 14
2.6.2
Analyze ......................................................................................................................... 22
2.6.3
Undo.............................................................................................................................. 26
2.6.4
Graph Properties ........................................................................................................... 26
2.6.5
Retrieve ......................................................................................................................... 27
2.6.6
Record ........................................................................................................................... 28
2.6.7
Store .............................................................................................................................. 29
2.6.8
Step ............................................................................................................................... 29
2.6.9
Place Cursors ................................................................................................................ 29
2.6.10
Print............................................................................................................................... 30
2.6.11
Update Patient Information........................................................................................... 31
2.6.12
Change Eye ................................................................................................................... 31
2.6.13
Measure Interference .................................................................................................... 32
2.6.14
Red Background Light.................................................................................................. 32
2.7
Creating Reports................................................................................................................. 32
Selecting Patient’s Data ................................................................................................ 32
Selecting the Display View........................................................................................... 34
Adjusting the Data Display........................................................................................... 38
Retrieving data .............................................................................................................. 39
iv
2.7.1
2.7.2
2.7.3
2.7.4
Version 1.3
2.8
2.8.1
2.8.2
2.8.3
2.8.4
2.8.5
2.9
2.10
User-Defined Protocols (UDP) ........................................................................................... 39
Creating user-defined protocols.................................................................................... 39
Editing user-defined protocols...................................................................................... 40
Using user-defined protocols ........................................................................................ 40
Changing Standard Protocols........................................................................................ 40
Printing Standard and User Defined protocols ............................................................. 41
Sunburst / BigShot Error Sounds...................................................................................... 41
Other Features .................................................................................................................... 41
2.10.1
Exporting Images .......................................................................................................... 41
2.10.2
Batch Exporting Waveform Data and Cursors ............................................................. 42
2.10.3
Importing Data From Your DOS LKC System ............................................................ 43
Version 1.3
v
EMWIN Software
1.0 Introduction
The software permitting to run the system is called EMWIN; it handles all of the details
of performing a test – presenting a stimulus, collecting and analyzing the data, storing results,
and printing a report. This section of the manual details the use of the EMWIN software system,
version 8.2.0.
This manual assumes that you are familiar with the basic operations of Windows XP®. If you
are not, please refer to the manual that came with your computer.
2.0 Using the System
2.1
Starting and Quitting the System
To start using your system, first turn on the power of the MGIT-100 on (Medical Grade
Isolation Transformer). Then make sure all peripherals are on (pattern monitor, printer, user
monitor, CMGS-1/MGS-2 if applicable), and turn on the computer.
Once the computer boots the EMWIN software will automatically open up to the main menu.
To turn off the system click on QUIT in EMWIN main menu, turn off the computer by going to
Start -> Turn OFF Computer -> Turn OFF.
Once the computer has powered down, power off the MGIT-100 this will turn all the peripherals
off as well.
2.2
The Main Menu
The Main Menu is used to access all of EMWin’s features. The four sections are
Perform Tests, Create Reports, Design and Manage Protocols and Utilities.
While you may not use Design Protocols or Utilities on a daily basis, it is still necessary
to understand their functions.
TESTS: Clicking on this button will
allow you to perform all visual
electrodiagnostic tests that your
instrument is configured for. This
segment of the program allows you to
collect and store data and will be the
most frequently used function of
EMWin.
REPORTS: This module allows you to
not only print reports, but also analyze
your data. Stored data can be recalled
and displayed, before being analyzed
and the reports printed out.
Version 1.3
6
EMWIN Software
PROTOCOLS: EMWin allows you to design your own testing protocols. This part of the
program allows you to specify the individual parameters to create specific protocols.
UTILITIES: This section of the program allows you to change the practice information, edit data
and databases, and change the system setup.
2.3
Setting Preferences in Utilities
Although the software and hardware for your LKC Visual Electrodiagnostic Test System
are, for the most part, set up at our factory before shipping, there are a few tasks that you must
perform to complete the setup procedure.
2.3.1
Entering the Report Header
EMWin will print out up to four lines
of text at the top of each printed report. This
text is normally the name and address of your
practice, but it may be any other four lines of
text you want. In order for EMWin to print out
this information, you must give it the
information to print.
From the Main Menu, click on
Utilities and choose Change Practice
Information. A Text Fill-In menu will appear
that will allow you to specify the name and
address to appear at the top of the report. (If
you leave this information blank, no information will be printed.) Each line may have no more
than 32 characters in it, so you should plan your header carefully. Because this information will
appear at the top of every report that is printed, make sure that there are no errors.
Creating the Storage Database
2.3.2
EMWin allows you to create Access databases in which waveforms can be stored. All
of the waveforms in one database are hidden from the waveforms in another database. One
method for organizing your files is to create different databases to store them. EMWin will allow
you to specify which database is to be used to store and retrieve waveforms. All of the
waveforms in this database are unique and different from those in other database. For example, it
is possible to have several subdirectories called data2007, data2008, data2009, etc. Waveform
number 1 in data2008 is totally unrelated to waveform number 1 in data2009.
Although each database can theoretically hold an unlimited number of waveforms, the
search performance of the computer slows when there are more than a few thousand waveforms
in a single database. Therefore, you will need to take some time to decide how to organize the
storage of waveforms. Depending on how many waveforms will be recorded per month, you can
have a different database for each month or each year, or per different studies…
Version 1.3
7
EMWIN Software
Select Utilities from the Main Menu, and then choose Create New Database and
Standard Database from the popup menu. A screen will then allow you to type in the name of
your new database.
NOTE: that the database should only contains
letters A-Z or a-z or numbers 0-9 (no space allowed)
Once you have created your database don’t
forget to select it to start storing waveforms in the
created database. See next section for selecting a
database.
2.3.3
Selecting the Storage Database
EMWin allows you to store waveforms in different databases. To select which database
to work with, select Utilities from the Main Menu. Choose Select Database and Standard
Database from the popup menu. A screen appears that lets you choose the database that you
want to use and also lets you know what the current database is. This selection determines the
location where test data will be stored, as well as which database will be called when you create
reports.
EMWin’s Main Menu automatically displays the current database in use.
Version 1.3
8
EMWIN Software
2.3.4
Selecting the Date Format
The date format is defaulted to MM/DD/YYYY in factory however you can change the
date format to DD/MM/YYYY by going into Utilities and System Set-Up.
2.3.5
Selecting the Screen Size
The software can be matched to your current screen resolution to maximize the waveform
diplay. See preference windown in section 10.3.4
2.4
More on Utilities
Initial set up of preferences for Practice Information, Database and Date format are
covered on section 9.3.
We will now cover the rest of the
Utilities menu.
2.4.1
Backing Up Databases
Utilities -> Database Tools -> Backup Current Database. It is good practice to
frequently backup your data. How often depends on how much data loss you are willing to risk.
To backup a whole database go to Utilities -> Backup Database. Select the database to backup (if
you are not sure of the name of the database you currently use it is displayed on the bottom part
of the main menu).
Highlight the database to be backed up and then select which location you want to save it
by using the “save in” dropdown list at the top (floppy, CD, USB dongle…). You can burn the
data onto a CD or copy it to a memory USB dongle.
Version 1.3
9
EMWIN Software
2.4.2
Editing a Database / Patient Information
Utilities -> Database Tools -> Edit Current Database It is possible to change the
information in the database. You can delete waveforms and edit patient information. For
example you ran a patient and misspelled the patient’s last name. Go to edit current database,
find the waveform of the patient (by using the waveform number) click on edit patient
information. You can edit: first name, last name, date of birth, label of the eye (R, L, OD, and
OS), diagnosis and comments. Then proceed to the next waveform that needs editing.
2.4.3
Editing the Diagnosis List
When entering the patient information you can select a diagnosis to associate with the
patient data. You can directly type in new diagnosis from the patient information window and
they will automatically add to the diagnosis list. However if you need to edit or delete some of
diagnosis you will need to go to Utilities -> Edit the Diagnosis List.
2.4.4
System Preferences
The following can be changed to your preferences:
Print Font Style (Difference Row) - This specifies if you want the difference row of the cursor
printout in bold or italic. Note that the choice is possible only when Print Cursor with Label is
not checked
Print Cursor with Label
If “with label” is not selected then you won’t be able to place labels on your cursors. If it is
selected the labels will appear next to the cursors on the printout.
If “save to file” is selected then the cursors labels will be saved. Each time you open the cursor
window the last label you entered will automatically be written in the label area.
Version 1.3
10
EMWIN Software
Remote
This would enable the remote function.
This will allow you to automatically step
through steps of the protocols (your own
or the standard protocol).
This function has to be used wisely, if
not enough time is given for the
recording to occur or to save, the remote
function will not work properly
System Setup contains all the information specific to your system and should not be changed
unless indicated by an LKC Technologies engineer.
2.5
Performing a Test
This section covers procedures that are common to all tests run using the UTAS.
2.5.1
Selecting a Test
To perform a test with the EMWin system, click on Tests from the Main Menu, and
choose the test that you want to perform. Your options are:
♦ Electroretinogram
♦ Electro-oculogram
♦ Visual Evoked Response
♦ User Defined Protocol
After you have selected the type of test
that you wish to perform, another menu
will appear asking you for the specific test
that you wish to perform. Click on the
appropriate test from the menu.
Patient Information
2.5.2
After you have chosen a test to perform, EMWin will provide you with a screen to allow
you to enter patient demographic information.
It is important that you stay consistent in the format in which you enter information. Otherwise,
data analysis and retrieval could be difficult.
Version 1.3
11
EMWIN Software
If you are running more than one test, the demographic information from the last patient
tested will appear as the default values for the menu. You may clear this information most easily
by clicking on the Clear button at the bottom of the menu. This will delete all information and
allow you to start over. Fill in all of the items that you feel are appropriate (you are not required
to fill in any items).
Depending on if you are working with animals or humans you can have two different
patient information windows. EMWin is defaulted to the human information, if you wish to
switch to the human version then you need to go in My computer -> C:\EMWIN, open the
temp folder and rename the file Animal_Demographics.txt to Demographics.txt.
When you retrieve data after testing, you can use some items of patient information to
make searching and retrieval easier. The items on which you can search are marked with an
asterisk. (*)\
Version 1.3
12
EMWIN Software
Last Name*, First Name*, Middle Initial* -You do not need to capitalize the first letter of
names, since EMWin will automatically capitalize them when data is stored. There is space for
16 characters in both Last Name and First Name and 2 characters in Middle Initial.
Sex* and Birthdate* - The Sex field should be entered with either M or F. The Birthdate field
should be in the following format: MM/DD/YYYY. If you prefer to enter the date as
DD/MM/YYYY, see section 10.3.4. EMWin will flash an error message if you attempt to
continue from this screen with an incorrectly formatted Birthdate. Note that if you enter an
impossible date (such as 02/32/1975), EMWin will not stop you.
Identification* - There is space for 16 characters in the Identification field. You can use
whatever alphanumeric combination you want for this information. It could be the patient’s
Social Security number or a code that ties to your practice’s filing system.
Pupils Dilated - Record in this field whether the patient’s pupils were dilated with a mydriatic
for this test.
Diagnosis - You can either type in a diagnosis or choose one from the pull-down menu. The
diagnosis that you type in will be automatically remember and added in the list. The list can be
edited to add remove or correct spelling by going into Utilities and Edit the Diagnosis List (see
section 10.4.3).
Electrode Type - For ERG testing you can choose the type of the electrode used in the test from
the drop down list.
Dark Adapt Time - Record the amount of time that the patient was dark adapted before ERG
testing.
Other* - This field allows you to record additional information of your choice. When you
retrieve records, you can search on this field. Thus, it may be useful for recording information
such as participation in studies.
Database – This windows show the current database where the data will be stored. You can
select another database from the pull down menu. However if you want to permanently store the
data in a database other than the one defaulted you will need to change it in the Utilities. See
section 10.3.3 on how to Select the Storage Database.
Comment - Here you may enter a comment about the patient that will be stored with the data.
You are not restricted in the length of your comment. Typical comments might include
symptoms the patient presented with, referring physician, or classification in a study group.
The “Continue” button -When you have completed all of your entries, click on this button to
continue.
The “Cancel” button - This will bring you back to the main menu
Version 1.3
13
EMWIN Software
The “Clear” Button - This will clear out all the information in the fields
The “Search + Fill” button - If you fill in a patient’s Last Name, and then click on this button,
the system will search the current waveform database for matches. Thus in some cases you will
not need to fill in all patient information if the patient has previously been seen. If it finds a
match, it will fill in the remaining items based on the information stored in the database. If no
matches are found, the system will notify you. You may then complete the information
manually.
2.5.3
Channel Information
Once you filled out the patient information and click on continue the channel information
menu will appear. Select the number of channel you are recording from and place the Label for
each channel.
The software defaults R in channel 1 and L in channel 2 for ERG and Oz in channel 1 for
VEP. Note that for VEP testing you will also need to select the eye to be tested.
ERG
VEP
If only one eye is tested, channel 1 should be used regardless
of which eye is being tested.
2.6
Icons and Menus
2.6.1
Parameters
If you click on parameters in the upper menu bar or on the large A icon, or on the light
bulb icon, the parameter window will open.
Version 1.3
14
EMWIN Software
The parameters window contains four tabs: Sunburst Flash, Averaging, Amplifiers and
Timebase.
Sunburst/BigShot Flash Parameters
This window allows the user to change the flash color, intensity, flicker rate as well as the
background light intensity and fixation light.
There are 4 different options for the ganzfeld flashes:
1. Single Flash
2. Double Flash
3. Flicker
4. On/Off
The range of the intensities depends on the stimulus source (LED, Xenon or UV if applicable)
Version 1.3
15
EMWIN Software
For LED flashes the x, y coordinate of color can be entered according to the CIE color diagram
below. Note that only colors within the inner triangle can be achieved.
CIE Color Diagram
In order to produce:
- Pure red LED stimulus enter
- Pure blue LED stimulus enter
- Pure green LED stimulus entre
Version 1.3
x = 1, y = 0
x = 0, y = 0
x = 0, y = 1
16
EMWIN Software
Pattern Parameters
In the case you are
recording using a pattern
then the icons above will
appear. The Checkerboard
icon will open the pattern
parameters.
Seconds of Pre-Adapt
specifies how long the
pattern will alternate before
the actual recording starts.
Version 1.3
17
EMWIN Software
Averaging Parameters
The Averaging Menu will appear, allowing you to modify the following options:
♦
♦
♦
♦
Number of sweeps to average
The number of seconds to delay between sweeps. You will want to allow at least 5 - 10
seconds between flashes for scotopic testing to avoid light-adapting the subject during
averaging. If you wish to manually reject waveforms, it is recommended that this be set
to at least 2 seconds.
Number of sweeps to acquire between screen displays of averaged waveform data.
Threshold for rejecting artifacts. This option allows automatic rejection of waveforms
during averaging that exceed an amplitude criterion. If zero is entered, the artifact reject
option is disabled. If the artifact reject threshold is set to a value that is higher than the
input range of your chosen amplifier gain setting, EMWin will instruct you to lower the
artifact reject threshold.
Version 1.3
18
EMWIN Software
♦
♦
Whether or not to display each waveform as it is acquired. For single flash ERGs, for
example, you typically want to view each response as it is generated. However for VEP
tests, each individual response typically is meaningless since it is usually embedded in
noise. If you wish to manually inspect waveforms and reject them individually, you must
display each waveform as it is acquired.
Store individual sweeps. Typically, EMWin only stores the final average of all sweeps
from one test, and the raw responses that make up the average are discarded. If Store
Individual Sweeps is selected, all raw responses will be stored in the database as well
(up to 30 responses). In Report mode you can manually include or reject each raw
response from the averaging process, and average again. However, using this feature
adds an additional step of manually choosing each response when preparing reports.
Setting any of these parameters to “0” disables that option.
Amplifier Parameters
Version 1.3
19
EMWIN Software
This selection is used to change the amplifier gain or filter settings for the protocol.
If you change the default values of the High Cut and Low Cut filters, you
may significantly alter the waveform.
The “Notch Filter” will selectively reduce 60 or 50 Hz powerline interference. Typically,
excessive powerline interference can be reduced by better electrode placement or by moving the
patient from powerline sources. However, the notch filter can be turned ON if all other noise
reduction techniques fail.
Timebase Parameters
♦ Sample Rate and Sweep Frequency - This screen allows you to control the sampling
frequency (default is 2 kHz). This sample rate can be entered in Hertz or in Sweep
length (milliseconds). A single recording sweep always includes 512 samples. If you
Version 1.3
20
EMWIN Software
change the Sample Rate, the Sweep Length will automatically be updated and visaversa.
♦ Pre-Stimulus Baseline - A Pre-Stimulus Baseline allows you to adjust the amount of
data to be collected before the stimulus is presented. Typically, this is used to
indicate the amount of baseline noise present just prior to a flash stimulus.
A “Pre-Stimulus Baseline” cannot be entered when performing a flicker test
and the software will automatically set this parameter to 0 if attempted.
EOG Parameters
Brightness - If the patient is having trouble seeing the Red LEDs you can change the brightness
of the LEDs to a higher setting.
Duration - The duration of the recording time is 15 sec, meaning that the LEDs will alternate
from right to left for every first 15 sec of each minute.
Frequency - If the patient has problems following the LEDs you can slow down the frequency of
alternation.
Version 1.3
21
EMWIN Software
Auto Save Sweeps – You can automatically save the raw data of every sweep to file. The files
will be saved under C:\EMWIN\EOGData. The sweeps will be saved as sweep_001.txt and so on
up to sweep_999.txt
Brightness - If the patient is having trouble seeing the Red LEDs you can change the brightness
of the LEDs to a higher setting.
Duration - The duration of the recording time is 15 sec, meaning that the LEDs will alternate
from right to left for every first 15 sec of each minute.
Frequency - If the patient has problems following the LEDs you can slow down the frequency of
alternation.
The settings in EOG recording time are preset to ISCEV standard and usually do not need to be
changed. However if you see that the patient has reached the lower value in the dark adapt time
you can shorten the time on the fly. If the patient has reached the peak in the light-adapt phase
you can just stop the test.
The EOG background are set to low for Pre-adapt and Medium for Light-adapt. According to
ISCEV standard the eyes of the patient must be dilated for EOG, we do not recommend using
high intensity background on dilated eyes.
Display Scale - If the data seems too large for the window, change the display scale to a lower
setting.
Custom Intensity Background Light - for UTAS SunBurst and
BigShot user, you can set the light adapt phase to a custom intensity,
just select Custom in the Light Adapt drop down list and type in the
desired value.
2.6.2
Analyze
Once waveforms are displayed, many analysis
features can be implemented. For each function, you
will be asked which waveforms you wish to perform
the action
Smooth –
Smoothing can be achieved by going to Analyze -> Smooth or by clicking on the
following icon.
The smoothing algorithm is useful for removing excess high frequency noise from a waveform.
The smoothing procedure consists of replacing each point in the waveform by the average of the
Version 1.3
22
EMWIN Software
surrounding 11 points (five on each side plus the point itself). This process acts as a high-cut
filter that preserves the latency of all of the features of the waveform. If smoothing the
waveform once does not provide sufficient noise reduction, you may perform the smoothing
operation multiple times.
Warning: Smoothing a single flash ERG waveform will remove any
oscillatory potential and may change the initial slope of the a-wave.
Baseline Correct
Baseline Correct can be achieved by going to Analyze -> Baseline Correct or by clicking
on the following icon.
The purpose of baseline correction is to remove any slope, or ultra-low frequency noise, from the
data that might interfere with estimating amplitudes. Baseline correction is accomplished by
performing a linear regression on the data and subtracting the resulting line from the waveform.
If the stimulus is flickering, the slope of the line is estimated from the entire waveform;
otherwise it is estimated from the pre-stimulus baseline. Thus, if a waveform has an overall
upward slope, baseline correction will remove it. If the waveform goes first up and then down
(or vice-versa), the baseline correction function may not be useful.
Invert
Invert can be achieved by going to Analyze -> Invert or by clicking on the following icon
You may invert a waveform (make positive-going potentials appear below baseline and
negative-going potentials appear above baseline). This feature is useful if you wish to make the
waveform appear as if you had interchanged the + and - connections to the patient amplifiers. It
is also useful for subtracting waveforms. (See Add Waveforms)
Add Waveforms
Add Waveforms can be achieved by going to Analyze -> Add Waveforms or by clicking
on the following icon
You may add two or more waveforms together by selecting Add Waveforms. All of the
waveforms that you choose will be added together and will replace waveform 1 on the screen.
(The original waveforms will be removed, leaving only the summed waveform.)
You can subtract two waveforms by first inverting one of them (see Inverting Waveforms above)
and then adding the two together. For example, it is possible to subtract a Scotopic Red ERG
from a matched Scotopic Blue ERG to remove the cone contribution and obtain a good estimate
of the isolated rod ERG.
Off-Line Average
Off-Line Average can be achieved by going to Analyze -> Off-Line Average or by
clicking on the following icon
Version 1.3
23
EMWIN Software
You may retrieve and average waveforms that have previously been stored to disk. This process
is called off-line averaging. First, select the waveforms you want to average, placing all of them
on the screen at one time. Then select Off-Line Average. All of the waveforms that you choose
will be averaged together and will replace waveform 1 on the screen. (The original waveforms
will be removed, leaving only the averaged waveform.)
Remove Interference - Sometimes, despite your best efforts, you will be stuck with a recording
that contains some power line interference. If desired, EMWin will estimate the amount of
power line interference in the waveform and remove it. Of course, after the waveform is stored,
there’s no way to know how much of the signal at the power line frequency (60 or 50 Hz) is
noise and how much is part of the original signal, so EMWin subtracts all of it out. Except for
30 Hz flicker (where there may be a substantial real component at 60 Hz), this subtraction should
cause no problems.
Removing power line interference after the test has been performed can clean up a waveform
that has some noise in it, but it will not rescue an otherwise uninterpretable waveform. If the
power line interference is larger than the original signal, you should discard the waveform.
Analyze Oscillatory Potentials
Analyze Oscillatory Potentials an be performed from Analyze -> Oscillatory potentials
or by clicking on the following icon
Oscillatory potentials (OPs) are fast wavelets on the ascending edge of the b-wave of the flash
ERG. They have been shown to be a good predictor of progression to neovascularization in
patients with diabetic retinopathy or with central retinal vein occlusion. (CRVO) There are two
methods by which you can obtain OPs from the EMWin system.
The first method that can be used to extract OPs (and the one that LKC recommends) is to record
the flash ERG with the low-cut filter set normally, and use the software filtering system to
extract the OPs. Using the software filtering results in a more accurate representation of both the
amplitude and latency of the individual OP wavelets.
To use the EMWin software to determine oscillatory potentials, first record the OPs using the
either the Standard or the Bright Flash ERG protocol. (The Standard protocol follows the
ISCEV guidelines for recording oscillatory potentials, while the Bright Flash protocol more
closely approximates the technique of Bresnick et al.) Store the raw waveforms. Click on
Analyze and select Analyze Oscillatory Potentials. After you choose the waveforms from which
to extract OPs, EMWin will filter the waveforms and display them on the screen. You may then
choose to store the waveforms again.
After the waveforms have been filtered to extract OPs, EMWin will ask if you want it to
automatically place cursors on the OP wavelets. If you do, click on Yes. The program will then
place cursors on the oscillatory potentials (at its best guess for the maximum and minimum for
each one) and will determine the summed OP amplitude. EMWin will place up to 10 cursors on
up to 5 OP wavelets. You may access the cursors of these wavelets using the Cursors option
Version 1.3
24
EMWIN Software
from the Reports Menu. The summed OP amplitude will be reported at the top of each analyzed
waveform.
The second method is to record the flash ERG with the low cut filter of the patient amplifiers set
to 75 Hz. The 75 Hz filter will remove the low-frequency components of the ERG, leaving only
the higher frequency components, including the oscillatory potentials. (Step 3 of the Standard
ERG Protocol implements this filtering.)
If you prefer to place cursors on the OPs yourself, you may do so by selecting Cursors from the
Reports or button bar.
Flicker Amplitude and Timing
Flicker Amplitude and Timing can be performed from Analyze -> Flicker Amplitude and
Timing or by clicking on the following icon.
EMWin provides you with a means of determining the implicit time and amplitude of the flicker
electroretinogram. This technique only works for flicker rates of 20 Hz or faster. The implicit
time estimates are derived somewhat differently from the normal technique of placing the cursor
at the peak of the response. The technique used by EMWin estimates implicit time based on
finding the center of the response; this technique has been proven effective in prediction of
neovascularization of the iris in central retinal vein occlusion. (CRVO)
To automatically determine implicit time and amplitude of a flicker ERG, click on Analyze and
select Flicker Amplitude and Timing. Select each waveform you wish to analyze. The analysis
will be performed.
After the analysis is complete, the estimates of Amplitude and Implicit Time (abbreviated Ampl.
on the screen) will be displayed. This technique does not affect the placement of cursors on the
waveform, nor does it place any cursors of its own.
Retinal Ischemia Monitor
This can be found under Analyze -> Retina Ischemia Monitor
The Retina Ischemia Monitor (RIM) algorithm developed under a grant from the National
Institutes of Health, analyzes 30Hz flicker ERG waveforms to provide information about the
extent of ischemia (inadequate blood supply) in the retina. Implicit time provides more
information than amplitude. The implicit time reported by Retinal Ischemia Monitor is not the
same as the implicit time of the peak of the waveform.
Fast Fourier Transform
Fast Fourier Transform can be performed from Analyze -> Fast Fourier Transform or by
clicking on the following icon.
The Fast Fourier Transform is computed for selected waveforms, giving information on specific
frequency components of waveform data. You can determine the amplitude and phase of a
specific component using the mouse.
Version 1.3
25
EMWIN Software
2.6.3
Undo
This will remove all the analysis that was performed on the waveforms prior to saving (smooth,
analyze OP, auto scale….)
2.6.4
Graph Properties
These options control how the data is displayed on the graph.
Show Normal - This will write the upper and lower normal
limits of the standard ERG adjusted to the age of the current
patient. This function is check on/off to add/remove the
normal data from the waveforms.
Auto Scale - This will expand all waveforms to fit closely within the waveform’s axes. Although
the Auto Scale feature make waveforms look larger in amplitude, these large amplitudes can be
deceiving, since even small-amplitude signals will be expanded to fit the entire graph. Please
use this feature with caution when analyzing waveforms.
Line Thickness - This option lets you choose from among Thin, Thick, and Extra Thick for the
thickness of the line. The default is Thin. Thicker lines may be useful for easier visualization,
especially on printouts and faxes.
Data Layout - This allows you to choose whether you want the data displayed as separate data
sets or overlapping data sets.
Setup Normal Data - This allows you to enter your own normal data so that it displays when you
select shown normal. It is recommended that each institute comes up with their own normal data.
Also note that normal data is different for each electrodes type (ERG-Jet, Burian Allen…)
Version 1.3
26
EMWIN Software
Show Flicker Labels - This allows you to choose whether you want the data displayed as
separate data sets or overlapping data sets. This is a check On/OFF options. It is set as always
ON; hence each flash will be represented by an upside down triangle on the flicker waveform.
2.6.5
Retrieve
Search -This option takes you back to the Patient Information Screen and allows you to perform
a new search.
Next - Selecting Next will display the next waveform(s) stored in the current database. This
allows you to browse through waveforms.
Previous - Selecting Previous will display the previous waveform(s) stored in the current
database.
Re-Read - Clicking on Re-Read will redisplay the current waveform. This is especially useful
when analyzing data and you want to revert to the original, unedited data.
Version 1.3
27
EMWIN Software
Add More - Clicking on Add More will open the search waveform window and allow adding
more waveforms to the report.
2.6.6
Record
This will open a window streaming the real time data: baseline.
Running the baseline is the first action to do when starting a test. Once you click on
baseline you will be able to see real time acquisition of data. A good baseline be reasonably flat,
should not have 50/60Hz cycle noise.
Baseline – starts streaming real time data, you can stop baseline by clicking on stop baseline.
Record – From the baseline menu you can start recording right away by clicking on Record Data
Impedance Test (ONLY AVAILABLE ON EPIC-4000 and UTAS-3000 SYSTEMS) – allows you
to check the impedance of the electrode. This is useful once the electrodes are placed on the
patient. The lower the impedance the better the contact of the electrode and the better the
recording. If you are getting high impedance (higher than 40k consider reapplying the
electrodes, adding more gel or cream, cleaning the skin as appropriate)
Version 1.3
28
EMWIN Software
2.6.7
Store
Will store the waveforms in the currently selected database. You can choose to save all
displayed waveforms or select the one to be saved. The waveforms are saved back to
back and give a number. The latest saved waveforms will be the waveform with the highest
waveforms number in the database.
2.6.8
Step
To proceed to another step in the protocol, click on step.
You may select Step Forward to proceed to the next step in the
protocol, or you may select Step Backward to proceed to the
previous step. The appropriate stimulus conditions and step
number for the step will appear at the bottom of the screen.
There are several ways to move forward and backward.
You can either use the big arrow icons, pointing left to move
backward pointing right to move forward. You can also use the
menu by clicking on Step then Forward or Backward or Step To to jump to any of the steps in
the protocol. Finally you can also use the keyboard touch F3 to go backward and F4 to go
forward.
The text at the bottom of the screen indicates if the current waveforms have been stored.
2.6.9
Place Cursors
In order to measure the amplitude and time of specific locations of waveforms, you must
use the Place Cursors feature. You can place up to 10 cursors on each waveform,
although only two or four cursors for a single response are typical.
♦
A new box (picture above) will be shown at the bottom of the screen, which indicates
that the cursors will be placed on Waveform 1. Also, notice that a set of cross hairs is
placed on the first (top) waveform on the screen.
♦
Left-Click on the waveform on which you want to place cursors on.
♦
EMWIN will automatically select Cursor 1 to start with, which indicates that cursor 1 is
the cursor to be placed on the waveform.
Version 1.3
29
EMWIN Software
♦
Use the Left Arrow (←
←) and Right Arrow (→
→) keys to slowly scroll through a
waveform. As the cross-hair moves, the amplitude and time data will automatically
update. You can hover the mouse arrow over the point you want to place the cursor and
left click on the mouse, this will also place the cursors.
♦
To move through a waveform faster, you can use the Page Up and Page Down keys.
♦
When the cross-hair is located at the data point of your choice, press the Enter key. This
will place a marker on that waveform. You can also use the Place Cursor button at the
bottom of the screen.
♦
After Enter is pressed, notice that the selected option is now 2, since EMWin assumes
you want to place cursors in sequential order.
2.6.10
Print
The currently displayed waveforms can be printed to any standard Windows printer.
After clicking Print (from either the menu option or the toolbar button), you will see a Print
Preview of your data, which will show you how the data will appear when printed. Words that
may appear jumbled on the preview screen will be expanded to appear normal on the printout.
You can zoom in on the Print Preview by double-clicking on the image. To zoom out, doubleclick the right mouse button. To print the data, click on the Print button.
The first page will have the patient name, waveform pictures as well as the first few
cursors for each waveform. It also shows amplifier settings, number of average waveforms and
other stimulus information. If many cursors have been placed they will show on the second page
named Waveform Details. The third page contains all the patient information, comments entered
and all analysis routines that have been performed on each waveform
Version 1.3
30
EMWIN Software
Note:
If you are printing data from two different patients on the same printout, the
patient information at the top of the printout (name, date of birth, etc.)
corresponds to the data from the first waveform only.
If you are printing in the purpose of faxing the waveforms you will need to
thicken the lines (see section 10.4.4). Graph Properties -> Line Thickness ->
Thick
2.6.11 Update Patient Information
This allows the user to change the patient information, or enter comments during
recording. The changes need to be made before the waveform is saved to the database.
2.6.12 Change Eye
Changing the recording eye is useful especially if you are recording one eye at time
because you either have only one electrode or you are using a mini-ganzfeld. This
settings allows you to change with eye is being tested when inside the protocol.
Version 1.3
31
EMWIN Software
2.6.13 Measure Interference
The measure interference button collects one sweep of data from each channel and
determines the amount of main interference (50 Hz or 60 Hz, depending on
configuration); measured in µV. (Higher numbers are worse.) The information will tell
you whether you will be able to obtain a good recording from the patient. Excessive
interference is often caused by poor electrode contact, so if this value is high, check the
electrode contact and re-measure.
2.6.14 Red Background Light
This will turn the background light of the ganzfeld on red as well. This is meant to help
assist the technician when placing the electrodes without ruining dark adaptation of the
patient.
2.7
Creating Reports
2.7.1
Selecting Patient’s Data
The first step in generating a report is to select the waveforms that will be displayed.
From the main menu go to Create Report. EMWin will put up a Patient Information Screen for
you to fill in. Filling in portions of this menu will reduce the number of waveforms you have to
look through to pick the ones you want.
In the Action window, View Waves is selected as default this will allow you to display the
waveforms to create the reports. Export Waves and Export Cursors will be discussed in the
export data section 10.10.1.
Version 1.3
32
EMWIN Software
Patient Information Screen
In many cases, filling in the patient’s last name will be sufficient to search through the large
database.
Filling in the Age Range as 45 - 55 would select all patients aged 45 to 55. Note that this
computes the age of the patient at testing, not the present age of the patient.
Filling in Test Date as 11/1/1990 - 11/30/1990 would select all tests performed in November,
1990.
Any menu item which is left blank is assumed to match all items. As an example, to find
the ERGs of all patients named Smith who were tested in July of 1990, you would fill out the
menu as follows:
Last Name
First Name
Middle Initial
Identification
Sex
Birthdate
Age Range
Test Date
Version 1.3
: Smith
:
:
:
:
:
:
: 7/1/1990 - 7/31/1990
33
EMWIN Software
Other
:
Test Type
: ERG
Record Number:
Start Number :
Diagnosis
:
If EMWin reports No Matches Were Found, either you have mistyped the name in the
search or the patient name may have been mistyped when the test was performed. It is also
possible that the waveform is stored in a different database or has been deleted. You can also
use wildcards (*) to help reduce errors. For example, the search term: Sm* will find "Smith",
"Small", "Smythe," etc.
EMWin will search through all of the waveforms and display on the screen all of those
that match the items you filled in on the menu. You should select the waveforms that you want
to display by clicking anywhere on the line of the appropriate waveform. If you make a mistake,
just click on the box again to deselect it.
Notice the list of waveforms in the “Search Results” box. The waveforms that you select
will be displayed on the next screen.
Selecting the Display View
2.7.2
Once you entered the search parameters the search result box will appear.
Version 1.3
34
EMWIN Software
It has two main windows that contained the data waveforms. Left-hand Graph refers to
the left half page of the report; Right-Hand Graph refers to the right half page of the report.
Here are two different ways to display your data.
Option 1: If you select waveform 2 (in this case L eye ERG) in Left-hand Graph and waveform 1
(in this case R eye ERG) in Right-hand Graph then the data will display as below.
Option 2: If the two waves are selected in the Left hand Graph window then they will appear on
top of each other in the report.
Both options have advantages and inconvenient.
In option 1 you can select up to 5 waveforms on each side, however only the first 4
cursors will be displayed on that first page all additional cursors will have to print out on the
second page. Also the waveforms are appearing a lot smaller since it is only using half of the
page.
In option 2 the waveforms are more visible because they are using the whole width; all
the cursors will display on that first page (no need to print an extra page) however you can only
have up to 5 waveforms up on that display mode.
Version 1.3
35
EMWIN Software
Option 1
Version 1.3
36
EMWIN Software
Option 2
Version 1.3
37
EMWIN Software
2.7.3
Adjusting the Data Display
There are several things you can do to adjust the display of your data on the reports. You
can zoom in on the right and left time axis (see example below)
To adjust the time scales (for display purposes only) first click on the waveforms and then move
the Xmin and Xmax tabs to the desired location.
Version 1.3
38
EMWIN Software
The gain buttons allows zooming in and out in amplitude. To change the amplitude of one curve
and have the second one match the same scale do a follow:
Select one of the waveform, adjust the gain and click on the
waveforms on display to the same amplitude scale.
icon. This will make all
The position buttons allow the user to move the waveforms up and down on the displays.
2.7.4
Retrieving data
Once you have done your first report you do not have to go back to the main menu to
select the next waveform you can use the retrieve menu. See section 10.6.5 about the retrieve
menu.
2.8
User-Defined Protocols (UDP)
2.8.1
Creating user-defined protocols
To write a User-Defined
Protocol, choose Design Protocols
and choose Design from the Main
Menu. You will then have the
option of writing a new protocol,
editing an existing User-Defined
Protocol, deleting a protocol, or
printing out a summary of a protocol.
To create a new protocol
click
on
CREATE
NEW
PROTOCOL, to create a new
protocol that is very close to one
already existing then chose the
protocol you want to clone and
choose CREATE PROTOCOL
FROM. This will copy all the
information from the selected
protocol and give you the
opportunity to make changes to it.
If you are creating a new protocol then the screen below will pop up. This screen is
where you will need to enter the Protocol Name, Test Type, and Stimulator Type.
Version 1.3
39
EMWIN Software
The Protocol Name needs to be unique or you will be asked if you want to replace the
existing file. At this time, ERG and VEP are the only available options for Test Type. Only the
stimulators that your equipment is configured for will be offered as choices under Stimulator
Type. The other stimulators will be grayed out. Depending on which stimulator you used the
appropriate parameter window will open. See section 9.5.1 on parameters, make sure you check
all 4 tabs and select the values you want (stimulator parameter, amplifiers, timeframe and
averaging).
All flicker stimuli should have a pre-stimulus baseline of 0 in the timeframe tab
Once you checked all the tabs for the first step of your protocol click continue and you
either have the choice to add another step or finish the protocol (which would create a one step
protocol). If you select add another step the software will automatically use the values selected in
the previous as default.
Editing user-defined protocols
2.8.2
UDPs can edit any user defined protocols by going
to Design Protocol -> Design select the protocol to be
edited and click on Edit.
The choices are to add, edit insert or delete steps.
Using user-defined protocols
2.8.3
To use the UDP you have created go to Perform Test -> User Defined Protocols and select your
protocol from the list.
2.8.4
Changing Standard Protocols
EMWIN comes with a preset number of ISCEV standard protocols such as On/off,
standard, double flash… It is possible to change those protocols to fit your needs.
The standard protocols are stored in C:\EMWIN and have .PRO extensions. See appendix 3 for
the list of all standard protocols, their name and parameters. If you need to change the settings of
Version 1.3
40
EMWIN Software
a standard protocol you need to change the extension of the protocol file from .UDP to .PRO.
then you will be able to edit the protocol as described in section 9.7.2. Once you are done editing
the protocol don’t forget to change the extension name back to .PRO
2.8.5
Printing Standard and User Defined protocols
To print protocols go to Design Protocol -> Print. A list of protocols will appear. The
files with .UDP extensions are the user defined protocol, the .PRO are the standard protocols. All
the UTAS protocols have a capital U as the last letter of their name such as stdergU.pro for the
standard ERG.
2.9
Sunburst / BigShot Error Sounds
Sunburst and BigShot have a built in speaker. It will play music when you first turn it on.
There are other occasions where the ganzfeld might emit sounds.
1. Ganzfeld is playing the Jeopardy theme sound “Think”. This means the ganzfeld is
overheating. Sunburst will keep playing the music and not respond to any other
commands until the temperature goes down low enough.
2. Single Beep. This means you sent a wrong command to the ganzfeld.
3. Two Beeps. The two beep scheme is use to signal that the flash or background light
that you are trying to make is either out of the color range possible or out of the
luminance range possible.
Short Beep of Medium Frequency followed by Short Beep of Higher
Frequency: Color out of bound
Long Beep of Medium Frequency followed by Short Beep of Lower
Frequency: Luminance out of allowed range
2.10
Other Features
2.10.1 Exporting Images
Exporting the patient data to for
analysis or visualization in other programs
is very simple. When
a graph of data is on
the screen (either in
Test Mode or Report
Mode),
click
anywhere on the
white background of
the graph (left side or
right side) with the
right-mouse button.
Version 1.3
41
EMWIN Software
A pop-up menu with appear with a list of features. Select the item labeled “Export Dialog” and
the Exporting Electrotinogram window will appear.
You can select to export picture in Metafile or Bitmap format to the Clipboard, a specific file of
your choice or the printer.
2.10.2
Batch Exporting Waveform Data and Cursors
EMWIN has the capability to export up to 1000 waveform and cursors of 1000 waveforms into a
.CSV file format.
In order to export the waveforms, Cursor and patient into go to Report and select Export Waves
in the Action window.
Then click on Continue, this will bring up the list of all waveforms.
Version 1.3
42
EMWIN Software
Use the Ctrl or Shift key to select multiple waveforms to export. The default name of the export
file is Export.CVS, if needed you can change the name by typing in a new name in the Export
File Name window.
Once you click on Continue the export file will be created and saved under C:\EMWIN\Export.
Note if you recorded multi-data (created a protocol where in one step the software will
automatically collect more than 1 waveform and save all individual waveforms). All the
waveform will be exported back to back however only the cursors on the first waveform will be
exported.
2.10.3
Importing Data From Your DOS LKC System
Previous users of any version of EM for DOS may also convert older data to the
EMWin format. This allows you to exploit the powerful report making features that are not
available in previous versions of LKC software.
In the "EMWin" folder of the hard drive of the computer (c: drive), there is a program
named "CONVERT.EXE". Double-click this icon with the left-mouse button to open this
conversion utility. Data from all versions of EM for DOS are named "WAVEFORM.xxx",
where xxx is a number from 001 to 999. Select the disk drive that contains these waveform files.
Typically, you will copy these files from an older EPIC or UTAS system to a floppy or zip disk.
Now, select the appropriate directory and sub-directory, if applicable.
Version 1.3
43
EMWIN Software
Before actually converting the data, you must first determine the target database for these
waveforms. The default option for the "Convert" program is to use the currently selected
database for EMWin, which is shown at the bottom right of the menu. Waves will be added to
the end of this database in chronological order. In addition, you can also select a different
database or create a new one for this data.
For example, you may want to create a new blank database for all EM for DOS data. In
this case, you would:
1.
2.
3.
4.
Click the "Create New Database"
In the text box, type "EMDOSDATA" (or any other name) and click "OK."
Now click the "Select Database" button, and choose "EMDOSDATA" from the list.
Click "Continue".
At this point, all converted data will be added to the new EMDOSDATA database.
On the right side of the Conversion utility screen, you can select multiple waveforms
using the <Shift> and <Ctrl> keys. Holding down the <Shift> key allows you to select a large
number of waveforms at one time. Holding the down the <Ctrl> key allows to you to select
individual waves. Once all desired waveforms are selected, click the "Go" button. After a few
seconds, a message will indicate that waves were converted successfully.
Version 1.3
44