1
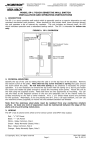
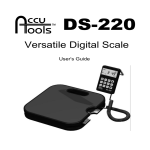
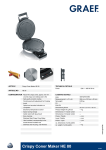
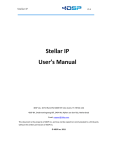
JH7600S UV-VIS SPECTROPHOTOMETER No. 01060128 Shanghai please read manual before installation and operation Contents ⅠIntroductions 1. Application Fields 2. Features 3. Major specifications and functions 4. Instrument apperance 5. Configration information 6. Computer and printer Requirements For Using Analysis Software and Printout By Host Ⅱ Working Environment and Installation 1. Find packing list and check all of the accessories 2. Working environment and installation requirements 3. AC Voltage Requirements 4. Preheating Ⅲ Instrument Operating Procedures 1. Installation 2. Main Functions 3. Photometric 4. Quantitative 5. Spectral Scanning 6. Dynamic 7. Multi-Wavelength 8. DNA/Protein 9. PC Mode 10. Set 11. Data Openning and Saving Ⅳ Troble Shooting I Introduction 1. Application Fields UV-VIS spectrophotometer available for physics, chemistry, medicine, biology, edicine, geology and other disciplines to conduct scientific research. It is widely used in chemical,pharmaceutical,biochemical, metallurgical, light industry, material, environment protection, medical test and so on, as well as it is the one of most important quality control instrument in the analysis industry. Also, it is essential equipment in conventional laboratory. 2. Features ◆JH7600S touch screen double beam UV-VIS spectrophotometer use a patent technology, all of the measuring functions can be operated on the 7 inch color touch screen with Andriod operating system. ◆Measuring data or curve can be stored in the host memory, or through USB interface. ◆Measuring data or curve can be printed directly on host by HP printer through USB interface. ◆Four basic measuring functions (spectral scanning, photometric measuring, kinetics measuring, quantitative measuring) can be run in the host without analysis software and computer. ◆Analysis software can be equipped with the host for function expansion. 3. Major specifications and functions Optical System Lamp double beam deuterium lamp (Japan) tungsten halogen lamp (German) Detector Wavelength run mode Wavelength Range silicon photodiode auto scanning (190-1100)nm Wavelength Accuracy 0.3 nm Wavelength Reproducibility ≤0.1nm Spectral Bandwidth Photometric Accuracy Variable (0.5, 1.0, 2, 4, 5)nm ±0.002A (0~0.5A) ±0.004A (0.5~1A) ±0.3%T (0~100%T) ≤0.001A(0~0.5A) Photometric Reproducibility ≤0.002A(0.5~1A) ≤0.1%T(0~100%T) Photometric Range Concentrition Range Stray Light -0.400-4.000(A) 0-99999 ≤0.02%T (360nm, NaNO2 & 220nm NaI ) Stability <0.0005A/h(500nm,OA, 2hours warm up) Baseline <±0.0003A (200-1000nm) Noise 0.0003A(500nm,P-P, 30mins warm up) Spectral scanning Host Measuring Functions Photometric Dynamics Quantitative Measuring Items Auto Cuvette Holder Printer (optional) Transmittance Absorbance Concentration Energy 1-5cm standard double beam cuvette holder HP 110 (for host print only, should install drive program) all models (for using software) Analysis Software (optional) Quantitative-qualitative analysis software 4. Instrument Apperance 1)Front View Touch screen label Sample room cover Figure 1.1 Instrument Front View 2)Back View 1 Power Switch 5 RS232 Interface 3Fuse Holder 2 Power Socket 4 USB Interface Figure 1.2 Instrument Back View 3)Sample Room Reference Sample Position Testing Sample Position Figure 1.3 Top View Of The Sample Room 5. Configration Information Standard Configuration 1) Spectrophotometer 1 set 2) Power cable 1 pc 3)User’s manual 1 pc 4)Certificate of quality checking 1 pc 5)Dust Cover 1 pc 6)1cm glass cuvettes 4 pcs 7)1cm quartz cuvette 2 pcs 8)1cm standard double beam cuvette holder 1 pc 9)Packing list 1 pc Optional Accessories 1) Tungsten halogen lamp Deuterium Lamp 2) Deuterium lamp 3) Glass cuvette 0.5cm,1cm, 2cm, 3cm,5cm 4) 1cm standard double beam cuvette holder 5) 5cm standard double beam cuvette holder (adaptable for 1-5cm cuvette) 6) Quartz cuvette 1cm,2cm,3cm,5cm 7) Praseodymium-Neodymium optical filter 8) Holmium oxide optical filter 9) HP 110 printer with drive program 10) Analysis software 11) 5-allied cuvette rack for DNA measuring function 6. Computer and printer Requirements For Using Analysis Software and Printout By Host 1) For using analysis software, personal computer should be equipped, Windows XP,WIN7,WIN8 operate system can be used only. For details information,pls read instruction manual. 2) Please install authorized Microsoft Office in personal computer for using some functions of analysis software. 3) HP series laser and inkjet printer can be used for printout data and graphics by using host only. HP2000 printer is the recommended model for print out data and graphics by using JH7600S host. The drive program for HP2000 printer had been installed in JH7600S UV-VIS spectrophotometer,so, HP2000 printer can be used after connecting print cable between printer and host. ⅡWorking Environment and Installation 1. Find packing list and check all of the accessories Take out instrument form wooden box,find packing list and check all the items listed, if anything damaged or missied,please immediately contact manufacture with TEL No. 0086 21 62551292. 2. Working Environment and installation requirements Rated voltage is 94V-240V AC, 50 / 60Hz±1Hz. Instrument should be put in a dry room with temperature at 5℃-35℃, and relative humidity is not than 85 %. The instrument should be placed on the solid stable working platform, no strong vibration or continuous vibration. The room should no hydrogen sulfide, nitrous acid fluoride and other corrosive gasses. The instrument should stay away from high-intensity magnetic field,electric field and produced high-frequency wave device. The instrument should avoid a direct hit by strong wind. The instrument should avoid strong sunshine. Grounding well is necessary. 3. AC Voltage Requirements Instrument can be used for wide range voltage at 94V-240V AC 50 / 60Hz±1Hz in most countries, pls ensure the AC voltage stability and not exceeding. 4. Preheating Warm up the host at least 30mins after power on. Ⅲ Instrument Operating Procedures 1. Power on 1. Power on, figure 3.0 will be shown, click SPD icon and then enter initialization function, see figure 3.1. Figure 3.0 Instrument start up view Figure 3.1 initialization process Caution! Please do not open sample room door or put any cuvettes into sample room during the initialization process! 2. When initialization function was finished, instrument will enter main menu,see figure 3.2. Figure 3.2 main menu 2. Main Menu Functions Photometric Measuring Select a single wavelength, put sample and blank, instrument will be adjusted 0% and 100% automatically, and then diaplay absorbance or tansmittance value automatically. Quantitative Measuring Standard contrast method and standard curve method for selection. Standard curve method can be created absorbance-concentration curve (A/C Curve) for using single wavelength or double wavelength, the sample concentration will be calculated and displayed by instrument automatically. Spectral Scanning Scanning, peak value and valley value detecting and the other functions can be run after setting parameters. Dynamic Measuring Set a single wavelength value and time range for building time-sample value scanning, absorbance, transmittance and energy can be selected Multi-wavelength Measuring After setting wavelength value, instrument can be run wavelength, 0%, 100% adjustment, transmission or absorbance value measuring automatically, data can be saved and printed out in word or excel form. PC Connection This function is only for analysis software using, and should connect host and computer with cable. Instrument Setting Lamps switch function seeting,and so on. 3. Photometric Function Photometric measuring function is used to get transmission or absorbance value at one fixed wavelength value. 1. Submenu Click Photometric icon of main menu, see Figration 3.2, enter Photometric Submenu, see Figure 3.3. Figure 3.2 main menu Figure 3.3 Photometric Submenu WL SET icon---input wavelength value on pop up numeric keyboard,and click ok button to confirm. Holder icon ---press the arrow keys to set the position of the sample holder.This functions is only for special cuvette holder. ZERO icon---blank 0% adjustment by using sample holder select icon to select the blank position. BLANK icon --- blank 100% adjustment by using sample holder select icon to select the blank position. TEST icon---get and display absorbance and transmittance value. SAVE---save the current test data. USB or host memeory can be selected. PRT icon---print test data by using HP printer model via USB interface. OPEN icon---open saved data for checking or modifing. X icon on the top right coner--- exit current operation menu, enter previous menu. 2. Photometric Function Steps a. Click WL SET icon, see Figure 3.3, Figure 3.4 will be shown, input wavelength value on popping numeric keyboard Figure 3.3 Photometric Submenu Figure 3.4 Wavelength Settings b. Put the reference sample into reference holder, click Photometric Menu BLANK icon, see Figure 3.3, adjust 100%T. Figure 3.3 Photometric Submenu c. Click Photometric Menu ZERO icon, see Figure 3.3, adjust 0%T. Figure 3.3 Photometric Submenu d. Put sample into the sample holder, and wait for the absorbance value stabilized, click TEST icon, and then put next sample into sample holder. Repeat the steps till all the sample test finished. All test data will be shown on the data bar, see Figure 3.5. Figure 3.3 Photometric Submenu Figure 3.5 Neutral Density Filter Test 4. Quantitative Function Quantitative measuring function is used to get sample concentration, gradient concentration value standard samples will be needed to prepare for making working curve. 4.1 Quantitative Submenu Click Quantitive icon of main menu, see Figration 3.2, enter Photometric setting sub menu, see Figure 3.3. Figure 3.2 main menu 4.1.1 Settings sub menu, see Figure 4.1 Figure 4.1 Quantitative Test Basic Settings Sample Name icon --- input the file name of the sample. Test Mode icon ---select single or double-wavelength mode. Wavelength icon --- input wavelength value. Factor icon --- input coefficient .This icon is only for double-wavelength using. Units icon --- input sample concentration units. Through Zero icon --- select equation through zero or no. OPEN icon --- open the saved test data. NEXT icon --- enter nest menu,see Figure 4.2 X icon on the top right coner--- exit current operation menu, enter previous menu. 4.1.2 Standard samples parameters setting sub menu, see Figure 4.2 Figure 4.2 Quantitative test standard sample setting ABS icon --- input a set of standard samples absorbance value one by one if standard samples absorbance value known. CONC icon --- input a set of standard samples concentration value one by one. READ icon --- if standard samples absorbance value unknown, should read out the standard samples absorbance value one by one. CONC ADD icon --- list ABS and concentration value at right data bar with No. DEL icon --- delete selected standard sample data Holder icon --- click button to setting the sample holder position. This functions is only for special cuvette holder ZERO icon --- adjust 0%T BLANK - icon -- adjust 100%T, make absorbance value turn to 0.000A. SAVE icon --- save the current test data OPEN icon --- standard sample data has been saved for viewing NEXT icon --- after all standard sample data input finished,click this button,and then enter standard curve fit, see Figure 4.3 X icon on the top right coner--- exit current operation menu, enter previous menu. 4.1.3 Standard curve fittness sub menu, see Figure 4.3 Figure 4.3 Standard Working Curve NEXT icon --display standard sample fittness graphics and equation,and then enter sample test process PRT icon—display and view test data in word or excel format,click PRT icon to print by HP printer. X icon on the top right coner--- exit current operation menu, enter previous menu. 4.2 Sample test sub menu, see Figure 4.4 Figure 4.4 pending test sample concentrations test ZERO icon --- adjust 0%T BLANK icon --- adjust 100%T, make absorbance value turn to 0.000A. TEST icon --- test the sample of absorbance or transmittance ratio. SAVE icon --- save the current test data Print PRT icon -- display and view test data in word or excel format,click print botton to print by HP OPEN icon --- standard sample data has been saved for viewing. Holder icon --- click button to setting the sample holder position. This functions is only for special cuvette holder. X icon on the top right coner--- exit current operation menu, enter previous menu. 4.3 Sample test operation process 1. Put the reference sample into feference holder, click BLANK icon to adjust 100% , after adjustment is completed, click ZERO icon to adjust 0%T, see Figure 4.4. 2. Put samples into the sample holder, and wait for the absorbance value stabilizes, click TEST icon, see Figure 4.4, and then put the next sample into the sample holder. Repeat the steps till all the sample finished. All test data will be shown on the data bar. 5. Spectrum Function Spectrum function is used to scan the sample T-WL or ABS-WL graphics for qualitative. 5.1 Spectrum Submenu Click Spectrum icon of main menu, see Figure 3.2, enter Spectrum Parameters Setting sub menu, see Figure 5.1. Figure 3.2 main menu Sample Name --- input the file name of the sample. Test Mode--- absorbance(Abs) and Transmittance (Trans) can be selected. Wavelength --- input start wavelength valueand and end wavelength value. Figure 5.1 Spectral Scanning Parameters Setting Interval --- select sampling interval. Chanel --- Cover and overlay can be selected. Cover mode: the screen display only one spectrum graphic. Overlap mode: the screen display all the spectrum graphics ever scanning. Speed --- slow,medium and fast scanning speed can be selected. Slit--- select bandwidth. Open --- To view the saved spectrum graphics. Next --- Enter Spectral Scanning Sample Test sub menu, see Figure 5.2 X icon on the top right coner--- exit current operation menu, enter previous menu. 4.2 Spectrum Sample Test Process, see Figure 5.2. Put reference sample into reference holder, click Make Baseline icon. After finished make baseline process, put sample into sample holder (No. 1-8), click TEST icon,the spectrum graphics will be displayed on the screen, see Figure 5.3. Figure 5.2 Spectrum menu Figure 5.3 Scanning Graphic of Holmium Standard sample 4.3 Graphics Processing 5.3.1 Coordinate Value Setting Click the vertical coordinates at the left side for modify, input the the upper limit and lower limit value of the coordinates, click OK to complete the setting, see Figure 5.4,or click Cancel to quit. Click Abs or %T or E icon at vertical coordinates to change the test items. Figure 5.4 Coordinate Value Setting 5.3.2 Peak and Valley Value Detection Click FUNC →Valley or PEAK icon to detect peak or valley value, see Figure 5.2, and identify the corresponding points, see Figure 5.5. Figure 5.2 Spectrum menu Figure 5.5 Peak Detection Data 5.3.3 Detailed Test Data List Click the FUNC→DETAIL icon, see Figure 5.2, to view the spectrum scanning data,see Figure 5.6. Figure 5.2 Spectrum menu Figure 5.6 Spectral Detailed Data 6. Dynamic Function Dynamic function is used to scan the sample ABS-TIME value. 6.1 Dynamic 6.1.1 Submenu Setting Parameters Click Dynamic icon of the maim menu, see Figure3.2, enter Dynamic sub menu,see Figure 6.1. Figure 3.2 main menu Figure 6.1 Dynamic Test Sample Name --- input the file name of the sample. Test Mode--- Absorbance(ABS) or Transmittance (Trans) can be selected. Wavelength --- input wavelength value. Time --- input test time. Interval --- Select sampling interval. Chanel --- cover and overlay can be selected. cover mode: the screen display only one spectrum graphic. overlap mode: the screen display all the spectrum graphics ever scanning. Delay—input start test time after setting this parameter. OPEN --- to view the saved spectrum graphics. NEXT --- enter dynamic test sample setting menu. X icon on the top right coner--- exit current operation menu, enter previous menu 6.1.2 Dynamic Sample Test Operation Put the reference sample into reference holder, click BLANK icon to adjuse 100%T, see Figure 6.2, after adjustment is completed, click ZERO icon to adjuse 0%T. Figure 6.2 Dynamic Test After finished blank and zero process, put the sample into sample holder, click TEST icon, see Figure 6.2, scanning will be begun,and then display the dynamic graphic, see Figure 6.3. Figure 6.2 Dynamic Test menu Figure 6.3 Dynamic Test Graphics 6.1.3 Graphics Processing a. Coordinate Value Setting Click the vertical coordinates at the left side for modify, input the the upper limit and lower limit value of the coordinates, click OK to complete the setting, see Figure 6.4,or click Cancel to quit. Click Abs or %T or E icon at vertical coordinates to change the test mode. Figure 6.4 Coordinate Setting 6 .3.2 Detailed Test Data List Click the FUNC button→DETAIL button, see Figure 6.3, to view the spectrum scanning data,see Figure 6.5. Figure 6.2 Dynamic Test menu Figure 6.5 Detailed Data 7. Multi-Wavelength Function Multi-wavelength function is used to measure sample value in 2 wavelength simultaneously. 7.1 Multi-Wavelength Submenu Click Multi-Wavelength icon of the maim menu, see Figure3.2, enter Multi-Wavelength sub menu,see Figure 7.1 Figure 3.2 main menu Figure 7.1 Multi-Wavelength Test Basic Setting ADD ---, click ADD button to input wavelength value to the right bar. DEL --- Delete the selected wavelength value. Sample Num --- input the number of samples to be tested for each wavelength.This function is used for special sample holder only. NEXT --- enter Multi-wavelength Sample Test menu,see Figure 7.2. OPEN --- View the saved data X icon on the top right coner--- exit current operation menu, enter previous menu 7.1.1 Multi-wavelength Sample Test Operate Put reference sample into reference holder, put the sample into sample holder, click TEST icon, test data will be diaplayed on the screen, see Figure 7.2. Figure 7.2 Multi-wavelength Test sub menu 8. DNA Function DNA function is used to measure DNA. Click DNA icon of the maim menu, see Figure3.2, enter DNA sub menu,see Figure 8.1. 8.1 DNA Submenu, see Figure 8.1 Figure 8.1 DNA Test Setting menu WL 1, WL2, Ref WL ---input WL1 at 260nm,WL2 at 280nm, Ref WL at 320nm for DAN measuring. DNA FACTOR 1, DNA FACTOR 2 ---input factor value. Sample Num--- input the number of samples to be tested. This function is used for special sample holder only. Open --- View the saved data. Next --- Confirm the sample data input and enter into the DNA testing. 1.1 DNA Sample Test Operate 1. Put the reference sample into reference holder 2. Put the sample into sample holder 3. Click TEST button,see Figure 8.2. 4. Data will be displayed on the screen, see Figure 8.2 right bar. Figure 8.2 DNA Test Interface 9. PC Mode This function is for software using only. For details information of software using,pls resd software instruction manual. Click PC MODE icon, see Figure 3.2, enter PC connection function, as shown in Figure 9.1, when the instrument operated in this mode, software will control all the operations, data and graphics will be displayed on the computer screen. Figure 3.2 main menu Figure 9.1 PC Mode Submenu Click the CANCEL icon to exit PC MODE function,see Figure 9.1. 10. SET This function is for setting parameters of wavelength change of lamp, cuvette holder and the other function,see Figure 10.1. Figure 10.1 Instrument Setting Interface Exch Wavelength—lamp exchange wavelength.Default value is 340nm, for manufacture debug only. Peak Sensitivity--peak resolution coefficient. Use Autoholder—for using auto sample holder instrument only. Print Detail(spectrum)—list all the detail data by selecting this function,or display graphics only. Print Detail(dynamics)—list all the detail data by selecting this function,or display graphics only. Slit—select bandwidth. CMDIN— this function is for manufacture debugging only. Save— save setting parameters. CANCEL—exit SET function. 11. Data Openning and Saving 11.1 Open Files 1. Click OPEN button of TEST MENU. 2. Click file name, click SELECT button to open data. 11.2 Save File 1. Click SAVE button of TEST MENU. 2. Select the file directory, input the file name. (select EXCEL format, OFFICE EXCEL format file will be output) 3. Click SELECT button for saving data. Ⅳ Troble Shooting ⅰ. Common troubleshooting inspection When the instrument meets troubleshooting, it should be turned off the host power supply, and then follow the below steps inspection step by step. 1. The sample chamber lid is closed tight or not 2. The sample holder position is right or not and whether there have any foreign body block the light in the sample indoor or not. 3. Colorimetric Cuvette choice is right or not. 4. Connecting the instrument power supply, and observe whether the tungsten lamp is bright light or not? 5. Under the range of instrument specified wavelength, whether it can be adjusted “100%T” or “OA”. ⅱ.Common troubleshooting cause and handing Phenomenon 1. There is no reaction when open the power switch. (on the back of main machine, the fan can not work) 2. The main machine can not connect with the computer 3. Can not be adjusted 0%T 4. Can not 100%T/OA be Cause 1) Power supply is not connected 2) Fuse is in open circuit 1) The cable damage 2) Main machine-cables-poor contact comperatures 3) Failure inside of the instrument 1) The sample chamber lid is not closed. 2) The instrument internal fault. Handing 1) Check the power supply voltage is normal or not? The power supply is connected or not? 2) Replace the same model specification fuse(refer to Appendix) 1) Replace the new cable between 2) Improve the state of plug and socket connection to make good contact adjusted 1)The reference sample absorbance value is too large(high concentration) 2) The light source lamp location offset. 3) The light source lamp is suddenly damaged when the instrument working. 4) The sample holder positioning is not correct or there exits block light by foreign body. 5) The instrument internal fault. 5. Instability show 1) Instrument warm-up time is not enough 2) Instrument installation environment vibration is too large, light source nearby air velocity is large or irradiation by strong light. 3) The supply voltage is instability. 4) The instrument grounding is bad. 5) The light source lamp is not positioned correctly. 6) The testing sample is unstable or has volatile. 7) The instrument internal fault. 6. The instrument visible area 1) Does not use quartz cuvette working normally, but UV area 2) When the instrument working, the deuterium lamp can not adjust 100%T/OA suddenly damage. 3) The instrument internal fault. 7. Test data accuracy consistent difference or 1) Sample preparation is not good (the choice of solvent and test solution system. As well as temperature control. Etc.) 2) Poor choice to test condition (test wavelength selection, and the control environmental of laboratory room temperature, humidity, quakeproof, anti-electromagnetic interference, grounding, and so on.) 3) The testing sample concentration or the thickness of cuvette has not well controlled. So that the measured absorbance beyond the linear range. 4) The sample reaction was not balanced nor have volatile reaction. 5) The sample turbidity, and have background interference. 6) A complete set of cuvette matching with large error or repeated use it result in pollution and caused the cuvette mismatching. 7) The four-hole sample rack fixed leaf spring rust, 1) The instrument should be under the state of sample chamber lid closed. 2) Ask the professional for maintenance, patching is proposed. 1) Dilution the reference sample. 2) Adjusting the light source lamp position. (refer to Appendix Ⅰ) 3) Replace the new same model specification light source lamp (refer to Appendix Ⅰ) 4) Pull sample holder rod and make it position correct, or remove foreign body. 5) Ask the professional for maintenance, patching is proposed. 1) Extend the instrument preheat time. 2) Improve the working environment. 3) External AC power supply to ensure that the instrument operating voltage is 220V. and no mutation. 4) Improve the grounding state. 5) Adjust the light source lamp position. (refer to Appendix Ⅰ) 6) For testing after the sample stable or switch to use gas-tight cuvette. 7) Ask the professional for maintenance, patching is proposed. 1) Make use of paired quartz cuvette. 2) Replace the new same model specification deuterium lamp (refer to Appendix Ⅰ) 3) Ask the professional for maintenance, patching is proposed. 1) According to right method to make sample. 2) According to the testing requirements to select the appropriate test condition. 3) It will be better to control the measured absorbance scope between from 0.2A~0.8A to 0.1A~1.0A. 4) Waiting for the test after sample reaction balanced or switch to use the gas-tight cuvette. 5) Make choice of dual-wavelength, triple-wavelength or derivative spectrophotometery method to test. 6) Make choice of matching cuvette with small error or clean contaminated cuvette, and then provides matching. Usually, it should make use of right way to wash the cuvette in time. 7) Replace a new but the same specification four-hole sample holder. 8) Please self-calibration method in accordance with caused the cuvette positioning not corrected. 8) The Maximum permissible error and repeatability of instrument wavelength is exceeded. 9) The Maximum permissible error and repeatability of instrument transmissivity is exceeded. 10) The instrument stray light is exceeded. 11) The difference of instrument stability (Drift large of 0%T and 100%T, also external voltage change caused by the indication value drift large) Appendix 2, or ask the professional for maintenance, patching is proposed. 9) Ask the professional for maintenance, patching is proposed. 10) Ask the professional for maintenance, patching is proposed. 11) Ask the professional for maintenance, patching is proposed. ⅲ. Note: 1. Product in the factory under the condition of original packaging should be stored at an ambient temperature 5℃-35℃, relative humidity in room is not more than 85%. And there should not have harmful substance to cause corrosion in the air. 2. The instrument should be operation under the requirements of the first section of chapter fifth. 3. In view of instrument in the factory prior to commissioning on the best condition, so the user can not arbitrarily adjusted, also can not arbitrarily open the casing to disassemble its parts (expect for the replacement of light source lamp), especially disassemble monochromator, it can not be damaged or bruise the polished optical components. 4. The instrument from the user purchase date, under the normal transportation, storage and use, when it can not normal working result from bad manufacturing within 1 year, the factory should be responsible for repair but free of charge (not including consumable parts, such as tungsten lamp, deuterium lamp), if without authorization to open the instrument cover . Disassembly is not including in “three guarantees”. 5. It should be agreed by the factory technical staff guided if meet any failure need to self-service. Making the appropriate qualified professionals investigation, adjustment and maintenance, patching is proposed. Appendix The Replacement and adjustment of Light Source Lamp ⅰ. Replace and adjust the halogen lamp 1. Open the host Counterclockwise screw and rotate the sample chamber rod, using cross screwdriver to open the four M4 screws on the both sides of host shell. Bring up the host shell, open the host. Note: pay attention to the connection cable between the chassis and body when bring up the process of host shell. Halogen tungsten lamp for the instrument visible light area is wearing parts. (The instrument making use of imported halogen tungsten lamp), if used the other model specification halogen tungsten lamp will damage the instrument electronic circuit). Therefore, it should be replacement if the lamp damaged. On the other hand, the lamp may be deviated from the normal position on the transportation process. So should be mastered the method of halogen tungsten lamp replacement and adjustment in order to making the instrument to work properly. Cut off the power supply firstly when replacement the halogen tungsten lamp. Installation a new lamp must be wear glove to avoid leaving fingerprint on the outside of lamp shell, especially in the light window parts. It results in reducing its transmission rate. 2. Replacement order: 1) Open the host, open the instrument case 2) Gently flip the spring film fixed in the position of halogen tungsten lamp, and take out the old lamp from the socket. (refer to the halogen tungsten lamp installation picture 6 ) 3) Insert the new halogen tungsten lamp into the socket (wear glove), and then make use of spring film fixed the halogen tungsten lamp. 3. The step of examination and adjustment 1) Connecting the power supply, when self-test is completed, set the wavelength to visible area. 2) Observation the lamp spot from the behind of instrument, check the position of incident slit is correct or not (refer to picture 7), the reading value (transmissivity) on the display screen should be stable. If the reading is not stable, should be fine adjusted the lamp position until the reading stabilized. Picture 6 halogen tungsten lamp installation diagram Picture 7 the right position of halogen tungsten lamp in incident slit diagram ⅱ. Replace and adjust the deuterium lamp (75 series) Deuterium lamp for the instrument UV area light source is wearing parts. The model is DD2.5. Deuterium lamp is installed in its shelf, the installation structure shown in picture 8. Cut off the power supply firstly when replacement the deuterium lamp. Installation a new lamp must be wear glove to avoid leaving fingerprint on the outside of lamp shell, especially in the light window parts. It results in reducing its transmission rate. 1. Replacement order: 1) Open the host, open the instrument case (same as halogen tungsten lamp replacement and adjustment) 2) Making use of screwdriver to release three leading cables of deuterium lamp (pay attention to three leading cables color) 3) Unload the deuterium lamp (with lamp shelf) from the lamp room socket (it will ok that take out two fixed bolts from the deuterium lamp shelf), and loosen the tight bolt of deuterium lamp. 4) Take out the old lamp from the deuterium lamp shelf and replace a new one. Then make the new one (with deuterium lamp shelf) fixed on the lamp room socket, connect the leading cable.(three leading cables should be connected according to the original access method. Note: Two same color cables is filament wire, the other one is anode leading cable. Do not wrong connection, or else deuterium lamp will burn out when starting-up the instrument) 5) Adjust the deuterium lamp light hole to make the hole pointed to spherical reflector in the lamp room. 2. The step of examination and adjustment 1) Connecting the power supply, when self-test is completed, set the wavelength to UV area. 2) Rotating the deuterium lamp, observation the lamp UV spot from the behind of instrument, check the position of incident slit is correct or not (refer to picture 9), the reading value (UV area transmissivity) on the display screen should be stable. If the reading is not stable, should be fine adjusted the lamp position until the reading stabilized. And fastening tightened bolt. Picture 8 deuterium lamp installation diagram Picture 9 the right position of UV light spot in incident slit diagram ⅲ. Replace Fuse 1. Remove the fuse holder Cut off the power supply and take out power cord, making the word screwdriver into the top of word of fuse socket of power outlet. (Fuse socket marked with symbol ). And then forth slide it with large force. You can remove the fuse holder. (Refer to picture 10) 2. Replacement a new but same model specification fuse. (5×20 mm 2.5A) 3. Reset fuse holder Making the fuse holder correctly inserted into fuse jack in the top of power supply outlet socket. 4. Verification replacement Connecting to the host power supply, the fuse replaced successfully if the power indicator light. Picture 10 dismounting fuse block diagram