1
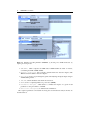
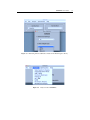
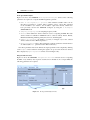
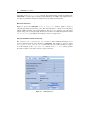
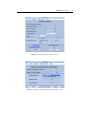
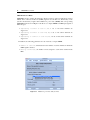
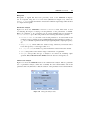
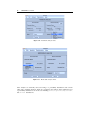
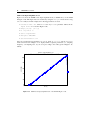
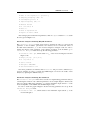
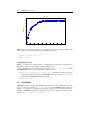
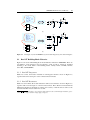
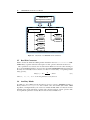
SIMSIDES User Guide
19
• Name of the signal(s) to process: y
• Sampling frequency (Hz): fs
• Oversampling ratio: M
• Input Frequency (Hz): fi
• Window: Kaiser
• N. of Points: N
• Beta: 20
• Kind of Spectrum: LP
• Figure of merit: SNDR
After setting up the aforementioned parameters, click on Compute and then Plot to obtain
the curve given in Figure 1.18.
Parametric Analysis Considering Only One Parameter
The Parametric Analysis menu can be used for studying the effect of a given model
parameter on the modulator performance. For instance, let us consider the effect of
the OTA transconductance gm of the front-end integrator in Figure 1.15b. In order to
analyze the impact of this parameter on the effective resolution of the modulator, go to
Parametric Analysis menu and set up the following parameters:
• Parameter name: gm1, which stands for gm of the front-end integrator block in
Figure 1.15b.
• Range [vi,vf]: [1e-5,1e-3]
• N. of points: 50
• Scale: Linear
• Analysis: SNR/SNDR
• Second Parameter: Off
Once these parameters are defined, click on Continue and proceed in a similar way to
previous examples in order to compute the SNDR. Figure 1.19 shows the results of this
analysis, by depicting the SNDR versus gm1.
Parametric Analysis Considering Two Parameters
The Parametric Analysis menu can be used also for implementing parametric analyses
considering the variation of two different parameters. As an example, Figure 1.20 shows the
effect of both the OTA transconductance gm1 and the maximum output current Io1 of the
front-end amplifier on the SNDR of the Σ∆M in Figure 1.15b.
In order to obtain the graph in Figure 1.20, the following parameters are set up in the
Parametric Analysis menu:
• Parameter name: io1, which stands for the maximum output current Io of the
front-end integrator.