1
User's Guide
AI Plugins
The set of modules for automatic identification
STC-S522
User’s Guide
ABSTRACT
Thank you for purchasing SIS II Sound Editor! We hope that our software will improve the quality of your tasks
accomplishment.
Before getting started, read this paper “AI Plugins The set of modules for automatic identification STC-S522 User’s
Guide” (then – manual) carefully.
This User’s Guide is intended for operators who use the set of modules for automatic speaker identification by
voice AI Plugins as a part of the specialized Sound editor SIS II.
It contains:
1. General information about modules
2. Modules installation
3. Modules registration procedure
4. Estimation (calculation) of signal characteristics
5. The order of speech detection
6. The order of speaker identification
7. Trouble shooting
There are the following data in the appendices:
A. Explanations to qualitative characteristics of phonogram
B. List of terms and definitions
C. Abbreviations
Any part of this publication may not be reproduced, transmitted, stored in a retrieval system or translated into any language in any form
or by any means, without the written permission of Speech Technology Center, Ltd.
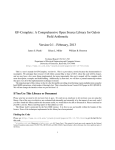
CONTENTS
INTRODUCTION......................................................................................................................................................................................... 4
General ............................................................................................................................................................................................ 4
Manpower requirements........................................................................................................................................................... 4
Typography conventions .......................................................................................................................................................... 5
Copyright ........................................................................................................................................................................................ 6
1 GENERAL INFORMATION ................................................................................................................................................................ 7
1.1 About the product and the producer............................................................................................................................. 7
1.2 Product allocation ................................................................................................................................................................. 8
1.3 Composition and facilities .................................................................................................................................................. 8
2 INSTALLATION OF THE SET OF MODULES .......................................................................................................................... 9
3 MODULES REGISTRATION ........................................................................................................................................................... 11
4 SIGNAL ANALYSIS. CALCULATION OF SIGNAL CHARACTERISTICS................................................................... 14
4.1 Calculation of signal characteristics ............................................................................................................................. 14
4.2 Graphics of spectral characteristics.............................................................................................................................. 16
4.3 Estimations and recommendations on the received signal characteristics ................................................... 17
4.4 Copying of signal characteristics into a text editor ................................................................................................ 18
5 SPEECH DETECTION ........................................................................................................................................................................ 19
5.1 Detection execution .......................................................................................................................................................... 19
5.2 Speech detection’s results .............................................................................................................................................. 20
6 SPEAKER IDENTIFICATION ........................................................................................................................................................... 22
6.1 Pitch statistics method ..................................................................................................................................................... 23
6.2 Spectral and formant identification method ............................................................................................................ 24
6.3 Total variability method ................................................................................................................................................... 25
6.4 Theoretical basis of the generalized method ........................................................................................................... 26
6.5 Performing the identification......................................................................................................................................... 27
7 TROUBLE SHOOTING ...................................................................................................................................................................... 30
7.1 Warnings and Errors .......................................................................................................................................................... 30
APPENDICES ............................................................................................................................................................................................. 31
Appendix A: Explanations to qualitative characteristics of phonogram ................................................................ 31
Appendix B: The list of terms and definitions .................................................................................................................. 37
Appendix C: Abbreviations .................................................................................................................................................... 40
3
INTRODUCTION
INTRODUCTION
General
The given User’s Guide discovers necessary data on installation, adjustment and operation with the set of
modules for automatic speaker identification by voice AI Plugins as a part of the specialized Sound editor SIS II.
This paper “SIS II the specialized Sound editor STC-S521 User’s Guide” is intended for operators – office workers
who use the specialized Sound editor SIS II according to its intended purpose.
The manual contains information how to install and operate the Sound editor SIS II. Thus, it characterizes the
possibilities of the solution and also describes the sound editor algorithm.
This paper does not replace academic, reference books and manuals from the manufacturers of the operating
system and common software.
Manpower requirements
Staff, producing the installation of the specialized Sound editor SIS II, should have professional skills to install
general and special software.
Staff, working with the dedicated Sound editor SIS II, should have basic skills to operate with applications in the
operating systems Microsoft Windows and should know how to expertise speech audio/sound records.
4
INTRODUCTION
Typography conventions
The following typographic conventions are used in the manual:
Font
Description
Normal
Body text of the manual
Italic
The first appearance of a term. Meaning of the term is explained here or in the
appendix. Also it is used to attract attention or to make up notes.
Bold
Names of software components and interface elements (headings, buttons, etc.).
BoldItalic
Names of files and paths to them.
Menu selection is marked with an arrow , i.e. the combination Menu Command should be understood as
following: select Menu and then find the item Command.
To indicate the importance of any information, the following comments and notes are used in the manual:
Note: Useful information
Warning: Important information
Caution: Essential instructions which are obligatory to be fulfilled to prevent any fatal error in the system
functioning.
5
INTRODUCTION
Copyright
SIS II is trademark of Speech Technology Center Ltd. All rights reserved.
All other companies and products mentioned in the manual are property of their respective owners.
The software includes modules of cross-platform application framework Qt 4.7.0 (http://qt.nokia.com) distributed
under the terms of the GNU LGPL 2.1 license http://www.gnu.org/licenses/lgpl-2.1.html.
6
GENERAL INFORMATION
1 GENERAL INFORMATION
1.1 About the product and the producer
Name
Conditional name
Producer
Postal address
Telephone
Fax
The set of modules for automatic identification AI Plugins
STC-S522
Speech Technology Center, Ltd.
Russia, 196084, St. Petersburg, 4 Krasutskogo str.
+7 (812) 325-88-48
+7 (812) 327-9297
7
GENERAL INFORMATION
1.2 Product allocation
The set of modules for automatic identification AI Plugins (then – AI Plugins or the set of modules) as a part of
the specialized Sound editor SIS II is intended for an estimation of characteristics of a signal, detecting of
speech and noise, and speaker identification by voice.
1.3 Composition and facilities
The set includes the following additional program modules:
1) Signal Analysis. The quality estimation module of a phonogram allows estimating automatically the
suilability of the phonogram to the examination.
2) Speech Detector. The search module of speech segments allows allocating automatically speech and
noise segments in a phonogram.
3) Speaker identification. The identification module carries out automatic speaker identification by voice
using three methods and the generalized solution.
It should be noted that features of the program are constantly increasing and improving, so it’s recommended to
specify the current additional modules on the STC official website: http://www.speechpro.com or please contact
Speech Technology Center managers to find out more about.
8
INSTALLATION OF THE SET OF MODULES
2 INSTALLATION OF THE SET OF MODULES
The set of modules should be installed on a PC, which already has the specialized Sound editor SIS II.
No additional maintenance or software to install or modules to operate is required.
Software installation must be performed by OS administrator.
The set of modules should be installed as an addition to the specialized Sound editor SIS II. To start the
installation, run the file AI_Plugins.exe.
Further steps to install the set of modules are shown below.
In welcome window (Fig. 1) click Next> and follow the instructions of the Installation Wizard appearing on the
screen.
Figure 1 – “Welcome” window
9
INSTALLATION OF THE SET OF MODULES
On completion of the installation, click the Finish button to exit the Setup Wizard program (Fig. 2).
Figure 2 – Window of successful setup installation
10
MODULES REGISTRATION
3 MODULES REGISTRATION
Registration of additional modules in the specialized Sound editor SIS II is performed automatically. After
installing the set of modules and running the Sound editor SIS II, these additional modules will be added to the
Modules menu (Fig. 3).
Figure 3 – “Modules” menu
If the installation of modules was performed by one user and a new user operates with them, the modules for the
new user will not be registered automatically; so it must be done manually.
On the Modules menu, click Register…
In the Plugins registration dialog box (Fig. 4) all the installed modules will be depicted, please select the
check boxes.
Figure 4 – “Plugins registration” window
Additional software modules are executed as plug-ins – independently complied program modules that are
dynamically connected to the main program.
By default they are installed in the Plugins, located in the directory C:\Program Files\Speech Technology
Center\ SIS II\Plugins. There are the following modules:
1) Signal Analysis module – SignalAnalys.dll.
2) Speech Detector module – MarkingPlugin.dll.
11
MODULES REGISTRATION
3) Speaker identification module – IdentificationPlugin.dll.
If the necessary modules are not available in the list, click the Refresh button.
If after this operation there are necessary modules missing again in the Plugins registration dialog box,
click the Paths button, and in the Pathes to find modules dialog box (Fig. 5) – click New.
Figure 5 – “Pathes to find modules” dialog box
In the Select folder dialog box (Fig. 6) specify the folder, where the module is installed.
Figure 6 – “Select folder” dialog box
In the Pathes to find modules dialog box, select the necessary check box and click OK.
Maybe after this operation it will be necessary to click once again the Refresh button.
12
MODULES REGISTRATION
If you select module’s name and click Options in the Plugins registration dialog box, you can
become familiar with its properties in the Module options dialog box (Fig. 7).
Figure 7 – “Module options” dialog box
13
SIGNAL ANALYSIS. CALCULATION OF SIGNAL CHARACTERISTICS
4 SIGNAL ANALYSIS. CALCULATION OF SIGNAL CHARACTERISTICS
Evaluation of signal characteristics is used to determine the suilability of the phonogram to the examination.
4.1 Calculation of signal characteristics
To evaluate (calculate) signal characteristics, on the Modules menu click Signal Analysis (Modules
Signal Analysis).
The Signal Characteristics dialog box (Fig. 8) shows the main signal characteristics that determine the quality of
the estimated phonogram: amplitude-frequency characteristic, signal-to-noise ratio, the presence or absence of
tonal noise, the average reverberation time and its dispersion, the presence or absence of clipping, the duration
of pure speech.
Figure 8 – ”Signal Characteristics” dialog box before the calculating process
14
SIGNAL ANALYSIS. CALCULATION OF SIGNAL CHARACTERISTICS
To calculate signal characteristics, specify the process area (Entire Signal , Selected Area , Visible part ) and click
the button
.
The calculation process of signal characteristics takes time; it is displayed in the Task Viewer (Fig. 9) dialog box.
The process can be interrupted by clicking the button
to the right of the operation’s progress indicator.
Figure 9 – Indication of the operation
Calculation’s results are represented in the Signal Characteristics dialog box (Figure 10).
Figure 10 – ”Signal Characteristics” dialog box after performing the calculations
15
SIGNAL ANALYSIS. CALCULATION OF SIGNAL CHARACTERISTICS
4.2 Graphics of spectral characteristics
To build the graphics of the amplitude-frequency characteristic (AFC) of the signal or the graphics of the signalto-noise ratio (SNR), click the button
in the AFC or SNR fields (refer to figure 10).
The spectrum of the Fast Fourier Transform (FFT) is build for AFC. This graphic is shown in Figure 11. AFC
boundaries are defined by module with the dashed lines.
Figure 11 – FFT spectrum for AFC
Frequency distribution is build for the signal-to-noise ratio (Fig. 12).
Figure 12 – Window with SNR and the selected new fragment
The boundaries, within which the integral value of SNR is calculated, are marked with the dashed lines, as given in
the Signal Characteristics dialog box. By default the integral value of SNR is calculated in the range from 100 to
3300 Hz. If selecting another fragment on the SNR graphic (Fig. 12), frequency value is changed and the SNR
integral value is recalculated in the Signal Characteristics dialog box (Fig. 13).
Figure 13 – Selected frequency fragment and integral value of SNR for this fragment
16
SIGNAL ANALYSIS. CALCULATION OF SIGNAL CHARACTERISTICS
4.3 Estimations and recommendations on the received signal characteristics
To obtain recommendations on each group of characteristics, click the button
.
Examples of recommendations to signal characteristics in Figure 10 are shown in Figures 14 – 18.
Figure 14 – Recommendations to calculate spectral
characteristics
Figure 17 – Recommendations to calculate clipping
Figure 15 – Recommendations to calculate tonal noise
Figure 18 – “Recommendations” window with the opened contextual
menu (recommendations to calculate the duration of speech)
Figure 16 – Recommendations to calculate reverberation
Data appearing in the Recommendations windows can be copied to the clipboard to paste subsequently
into the report.
To copy the data, click the right mouse button to invoke the contextual menu (Fig. 18) or press Ctrl+C.
17
SIGNAL ANALYSIS. CALCULATION OF SIGNAL CHARACTERISTICS
4.4 Copying of signal characteristics into a text editor
To put the calculated signal characteristics to the clipboard of a text editor, click the Copy button in the Signal
Characteristics dialog box.
In the text editor perform the Paste operation.
Example of signal characteristics, placed in the text editor is shown in Fgure 19.
In the Speech item the duration of pure speech (without noise and pauses) is depicted.
Figure 19 – Signal characteristics in the text editor “Notepad”
18
SPEECH DETECTION
5 SPEECH DETECTION
Detecting of speech is required for preliminary segmentation of phonograms coming for processing in the
speaker identification module. Thus the phonogram is divided into areas (segments) with a useful speech signal,
noise, pauses and telephone signals.
5.1 Detection execution
To extract speech automatically from the background noisy areas of phonogram, on the Modules menu click
Speech Detector (Modules Speech detection). In the Speech detection dialog box (Fig. 20)
specify time interval between noisy areas, where they will be merged into one.
Figure 20 – “Speech detection” dialog box
The program module carries out the search of speech segments and places them in the group of marks – “VAD”.
In addition the program module can carry out the detecting of beeps, overloads and glitches. Marks of the given
kinds of signals are located in the general group of marks – “Noise”.
For detecting of beeps, overloads and glitches, select the necessary check boxes: Detect beeps, Detect
overloads, Detect glitches.
To start the speech detection process, click the Calculate button.
To cancel the speech detection process, click the Close button.
The calculation process (speech detection) takes time; it is displayed in the Task Viewer dialog box. The
process can be interrupted by clicking the button
to the right of the operation’s progress indicator.
19
SPEECH DETECTION
5.2 Speech detection’s results
After speech detection the interval marks will appear in the data window; they mark phonogram’s areas with
speaker’s speech and noise. The intervals will be shown in the list of marks in the VAD and Noise tabs (Fig. 21)
accordingly.
An operator can manually adjust the intervals by means of the Sound editor SIS II. In this case speech areas,
given by the operator, will be used for identification.
Figure 21 – Data window, “VAD” and “Noise” tabs after speech detection
20
SPEECH DETECTION
Overall number of marks and their length can be obtained by selecting the VAD and Noise groups on the
Marks tab of the Manager Panel (Fig. 22).
Figure 22 – Marks selecting phonogram’s areas with speaker’s speech and noise
21
SPEAKER IDENTIFICATION
6 SPEAKER IDENTIFICATION
The module identifies speakers with the help of the following methods:
1) Pitch statistics method;
2) Spectral and formant identification method (SFIM);
3) Total variability method (TotV);
4) The generalized method.
Speaker identification based on the first three methods involves two main steps: speaker’s voise modeling and
decision-making concerning identification.
The generalized method is the most accurate method; it includes all three methods of speaker identification.
Models created with the help of the generalized method contain data with all three methods of voice
identification in a single file.
The result of identification via the generalized method is an average identification result of methods mentioned
above. When using the generalized method, FR and FA values are not calculated.
22
SPEAKER IDENTIFICATION
6.1 Pitch statistics method
This method uses sixteen different characteristics of voice pitch. There are some of them: the mean value of pitch,
its maximum and minimum values; the median; percentage of areas with increasing tone; the variance of tone’s
logarithm; the asymmetry of tone’s logarithm; the excess of tone’s logarithm and other characteristics.
The value of the equiprobable acceptance /rejection error (EER) for the pitch statistics method depends on
duration of the speech fragments being compared and can reach ~ 18-19 %.
The implementation of this algorithm is now realizable due to the creation by STC specialists the fully automatic
high-precision algorithm for pitch selection.
The advantages of this method are the following: high rate of features comparison and as a consequence high
speed of search or verification of speaker.
At the same time dependence of the reliability of this method on emotional and psychological state of speaker at
the time of speech delivery is the cause to use it as an additional one.
Speaker’s voise modeling is as follows.
Pitch extraction realizes via spectral analysis of phonogram’s signal. The method is based on algorithm that is
based by-turn on analysis of the values of pitch harmonics in the signal spectrum. The algorithm is aimed at
overcoming the problems associated with the suppression of half of signal spectrum in the channel.
For example, the signal is missing in the telephone channel in the band from 0 to 300 Hz, but the value of pitch
frequency is in this very range. In this case the algorithm of pitch allocation makes it possible to solve the problem
by taking into account the harmonics of pitch frequency in the band from 0,3 to 3,4 kHz.
This type of identification is stable enough to signal-to-noise ratio. If the level of the harmonics of pitch frequency
is at least a few decibles higher than noise level, the algorithm by means of special “underlining” methods of pitch
harmonics makes it possible to determine the desired frequency.
At the calculating stage of pitch statistical characteristics, a set of values of pitch statistics according to the
obtained pitch curves is determined. This set includes the following characteristics: the average, maximum and
minimum pitch values; frequency values, above which there is 3% of pitch values and frequency values below
which there is 1 % of pitch values; the median; percentage of areas with the increasing pitch; the dispersion; the
asymmetry of logarithm and the excess of pitch logarithm; the mean rate of pitch change and others.
At the decision-making stage of identification, pitch statistical characteristics are compared, values of type I errors
and type II errors (FA and FR) for each of the obtained values of pitch statistics are calculated, as well as FA and FR
values on the resulting metrics of pitch statistics as a weighed sum of all relative deviations of values of pitch
statistics for two compared phonograms are calculated. Bagging is performed on the duration of speech signal
(FR/FA evaluations depend on the duration of speech signal, on which bases every compared NDM-module is
built).
23
SPEAKER IDENTIFICATION
6.2 Spectral and formant identification method
This method is based on the thesis about uniqueness of the geometry of the vocal tract of each person, and this
fact is reflected in different spectral characteristics of speech. Difference of spectral characteristics is shown clearly
in the frequencies orientation and mutual location of the formants. In addition this method is based on the
highlighting and comparison of location and behavior dynamics of three or more formants (protected by Russian
patent).
The usage of spectral formant method provides the value of EER up to 6-7%. The value of this index for a
particular case depends on the duration and quality of the speech fragments being compared.
Spectral-formant method is the primary method. These are the reasons:
– the method makes lower requirements to the quality of the signal than other ones (it is possible to operate
with the signals that have the signal-to-noise ratio up to 10 dB);
– the method shows relatively high rate of highlighting of speech characteristics and it is enough resistant to the
channel’s type.
Speaker’s voise modeling is as follows.
The average phonogram’s spectrum, which is used for the construction of identity speaker card, is constructed.
Then for this phonogram, the normalizing function is built; it will be used to calculate instantaneous spectra of
the speech signal.
Locations of three spectral peaks are used as the identifying features. They are the most appropriate for formants
of the speech signal at each spectral slice, where it was possible to determine them reliably. These characteristics
determine mostly individual features of vocal tract. Density of the distribution of identifying features is modeled
with using NDM.
Immediate decision-making concerning identification is performed with using SVM-classifier (Support Vector
Machine). Type I errors and type II errors FR/FA are calculated on the resulting SVM distance. Bagging is performed
on the duration of speech signal (FR/FA evaluations depend on the duration of speech signal, on which bases
every compared NDM-module is built).
24
SPEAKER IDENTIFICATION
6.3 Total variability method
Total variability method (TotV method) is the most advanced method of speaker identification by voice.
Speaker’s voise modeling is as follows.
Speech characteristics MFCC (Mel Fourier Cepstrum coefficients) are calculated. They are features that describe
spectral representation of the speech signal at different periods of time. Density of the distribution of identifying
features is modeled using Normal distribution mixture.
NDM-module parameters with the help of specially adapted factor analysis are presented in the form of i-vector of
small dimension in the so-called “total variability” space that includes subspaces of “its own channels” and “its own
voices”, used in JFA (Joint Factor Analysis). A distinctive feature of this representation of NDM-module is its high
self-descriptiveness and the small size of data.
At the stage of comparing of i-vectors, SVM-classifier (Support Vector Machine), well-established in terms of speed
and quality of identification solution, is used. Type I errors and type II errors FR/FA are calculated on the resulting
SVM distance. Bagging is performed on the duration of speech signal (FR/FA evaluations depend on the duration
of speech signal, on which bases every compared NDM-module is built).
25
SPEAKER IDENTIFICATION
6.4 Theoretical basis of the generalized method
The generalized method of speaker identification is realized on the basis of the generic solution that is made
according to the identification results by one or more methods of identification, regardless of their number.
The result is a pseudo-likelihood P belonging of two compared phonograms to one speaker, which lies in the
range from 0 to 100%; 0% - means the minimum possible similarity of speakers in phonograms, 100% - the full
compliance of speakers’ voices.
The algorithm of calculating of the generalized solution is based on the usage of the weighted voting method:
N
P = ∑ wi ⋅ f ( F i , R
F i )A,
i =1
where N – the number of authentication methods according to which the decision is received,
wi - weighting factor of i method. The value of weighting factor changes automatically depending on signal
quality.
F Ri / F Ai - type I errors and type II errors of i method. The F Ri / F Ai values are calculated as a persantage and
have a range of values from 0 to 100%.
26
SPEAKER IDENTIFICATION
6.5 Performing the identification
For automatic speaker identification, on the Modules menu click Speaker identification.
In the Identification dialog box (Fig. 23) from the drop-down lists File 1 and File 2 select files to compare
and select the check boxes (methods of comparison) in the Method field and click Compare.
To cancel the identification process, click the Close button.
If the signal has not passed the segmentation procedure (detection) of speech (Fig. 23, a), the warning will
appear. In the warning dialog box you should choose whether to continue identification or not. If you choose
“Continue identification”, the identification module will produce the segmentation by itself.
a) speech is not segmented
b) speech is segmented
Figure 23 – “Identification” windows (before performing the identification process)
When conducting the speech segmentation procedure, all noise will be extracted as if all the check boxes were
selected in the speech detection module (refer to figure 20). The result of noise detection outside the module is
not given and it can not be checked or updated by an operator. As a result there will not be enough pure speech
for identification.
In this case, please cancel the identification and at first run the speech segmentation procedure using “Speech
detection” module.
27
SPEAKER IDENTIFICATION
The identification modeling process takes time; it is displayed in the Task Viewer dialog box and at the header
of the Identification dialog box.
The process can be interrupted by clicking the button
to the right of the operation’s progress indicator.
Quality of compared phonograms is estimated by the module during the identification process.
After completion of identification, results for the selected methods will be displaed in the table of the
Identification dialog box (Fig. 24).
a) speech is not segmented
b) speech is segmented
Figure 24 – “Identification” windows (after performing the identification process)
Identification results can be copied to the clipboard by clicking the Copy button and pasted into a report or a
text editor such as “Notepad” (Fig. 25).
To obtain FR-FA and DET graphs (Fig. 26) for each of the methods, click the button
method. If you select the Display EER check box, the EER value will be shown in graphics.
The buttons
a text editor for a report.
in the field of the
make it possible to copy to the clipboard each of graphics in order to paste them into
28
SPEAKER IDENTIFICATION
Figure 25 – Result of comparison, copied into a text editor “Notepad”
Figure 26 – Examples of FR-FA and DET graphs
29
TROUBLE SHOOTING
7 TROUBLE SHOOTING
7.1 Warnings and Errors
If while selecting the calculating of signal characteristics, an active window has not got an oscillogram of this
signal, an error message will appear as shown on Figure 27.
Figure 27 – Error message of data choice to calculate characteristics
Click OK, and make available the window with the appropriate type of the signal.
If in order to detect speech, a window that does not contain an oscillogram of the signal is chosen, a warning
message will appear (Figure 28).
Figure 28 – Warning about the absence of the required type of the signal
Click OK, and make available the window with the appropriate type of the signal.
If speech is not segmented in the selected files for identification, a warning message will appear (Fig. 29).
Figure 29 – Warning about the presence of non-segmented speech
To improve the reliability of identification, click No, segment the speech using “Speech detection” method and
repeat the identification process.
30
APPENDICES
APPENDICES
Appendix A: Explanations to qualitative characteristics of phonogram
A.1 Irregularity of the frequency response
Amplitude-frequency characteristic (AFC) is a function that shows the frequency dependence of module of a
complex function. More often it means the modulus of a complex coefficient of linear four-terminal device
transmission. It is also possible to consider AFC of other complex-valued functions of frequency, for example, of
the spectral density of signal power.
Amplitude-frequency characteristic irregularity is the difference between maximum and minimum attenuation in
the working bandwidth of shaping filter; it is the degree of deviation from the straight, parallel axes of
frequencies.
Acoustics, which have AFC as a straight line, will be ideal for sound reproduction. Unfortunately, AFCs of real
acoustic systems are curves with many peaks and valleys. Appearance of this irregularity when playing sounds of
different frequencies is caused by no idealness of components, as well as acoustical system in general, the
presence of various kinds of parasitic resonances, vibrations of the shell, etc. The more uniform the AFC, the more
natural the reproduction.
The degree of irregularity of AFC is characterized by the ratio of peak value of sound pressure to minimum one or,
by other method, the ratio of maximum (minimum) value to the average in a given range of frequencies,
expressed in decibles.
31
APPENDICES
A.2 Signal-to-noise ratio
One of the key indicators affecting the quality of speaker identification, the results of acoustic treatment, etc., is
the original speech signal ratio to noise ratio, the so-called signal/noise ratio (SNR). In this case, a signal level is its
capacity.
Signal-to-noise Ratio (SNR) is the ratio of the total signal to the total noise which shows how much higher the
signal level is than the level of the noise. A measure of signal quality.
Signal to noise ratio matrix is calculated in the “Signal Analysis” module: SNR (k, m) (where k and m – the indeces
of frequency and frame), on which the output parameters can be obtained. They are the following:
1) Integral SNR of the entire file in frequency bands;
2) Integral SNR throughout the file.
SNR estimation algorithm is as follows.
With the help of Voice Activity Detector (VAD) the areas of input signal are marked at which there is speech and
no noise (clicks, tone bursts, etc.). Speech areas are cut to frames on which power spectrum of the signal is
calculated.
Current estimates of power spectra of input signal |X(k, m)|² and noise |Ń(k, m)|² (where k and m – the indices of
frequency and frame) are calculated according to the power spectrum. In this, signal areas marked as “non-verbal”
are excluded from the analysis.
Then, low informative and potentially dangerous (in terms of possible noise) bands are cut off (below 100 Hz and
above 3300 Hz), and the ratio is calculated in the resulting band:
INR (m) = 1/K ∑ k=1, K [ |X(k, m)|² / |Ń(k, m)|² ],
It represents the average value, which shows to what extent the power spectrum of the input signal is more than
the power spectrum of noise at a given time frame, i.e. gives some general estimation of noise level at the frame.
The INR value (m) is compared with a threshold and only frames with INR (m), which are higher than the default
threshold, are sent for further processing. The following characteristics are calculated:
1) Integral SNR throughout the file. In the frequency band 100-3300 Hz SNR is calculated at time frames:
SNR (m) = < |X(k, m)|² > / < |Ń(k, m)|² > - 1,
where < > – averaging operation along all frequency bands.
Then SNR is stored recursively at time frames to obtain an estimate of the integral SNR through the file:
E[SNR] = 1/M ∑ m=1, M [SNR(m)],
where M – total number of frames in the file.
2) Integral SNR in frequency bands throughout the file. SNR is calculated in frequency bands at time frames along
all frequency bands ranging from zero frequency to Nyquist frequency:
SNR(k, m) = max{ 0, |X(k, m)|²/ |Ń(k, m)|² - 1 }.
Then integral SNR is calculated recursively in frequency bands throughout the file:
E[SNR(k)] = 1/M ∑ m=1, M [SNR(k, m)],
where M – total number of frames in the file.
Conversion of each type of SNR in decibles is carried out by a well-known formula:
SNR dB = 10 log(SNR).
32
APPENDICES
А.3 Stationary tonal noise
Noise is some extra signal added to useful signal, for example any signal in the background of a speech
conversation will be recorded as noise –noise from the street, hum and hindrances from home appliances,
electrical devices, clicks in radio channel, bangs of door closing, rattle of paper, another conversation, music, TV
sound, hindrances from the recording system or transmission channel itself, etc. In critical cases, this strong
additive noise may substitute the useful signal due to small dynamic range of the recorder and small sound level
of speech.
Noise is an unwanted physical phenomenon or effect of electrical, magnetic or electromagnetic fields, electric
currents or voltages of external or internal source that violates the normal operation of facilities or causes the
degradation of technical characteristics and the parameters of these facilities. Any oscillation in solids, liquids and
gases can be the source of an audible and inaudible noise. Radio-electronic (electromagnetic) noise is a random
variation of current or voltage in radio-electronic devices (for example, audio recording and reproducing
equipment).
Tonal noise (TP) is periodic signals with a frequency of the fundamental period from several tens of Hz and above.
Stationary noises are steady for whole recording or its fragment, without any perceptible change in its
characteristics. Most background noises are more or less contituous – street, office hum, hindrances from
equipment (without sharp changes in working modes), etc.
Non-stationary noises have breaks or pauses, like beep signal in telephone channel.
Noise is primarily signals which spectrum overlaps with the PC spectrum, and the amplitude of spectral
components is comparable with the amplitudes of PC spectral components (otherwise they are not noise).
Examples of tonal noise classes:
– periodic pulse processes that generate a comb of harmonics of pitch in the spectrum;
– tonal network noise (50-60 Hz) and their harmonics;
– PC acoustic noise (peaks of spectrum in low-frequency region);
– tone pulses in telephone lines, etc.;
– acoustic noise of artificial origin (sirens, music, etc.)
Comb filter: A filter whose frequency response exhibits a series of deep peaks or notches equally spaced in
frequency (hence the word “comb”).
33
APPENDICES
А.4 Reverberation time
Reverberation (reverb) is a complex blend of multiple interacting reflections within an enclosed space which
combines with the direct sound from a source and defines the character of the sound in a room or hall.
Reverberation is the gradually reducing process of sound intensity at its multiple reflections. Sometimes
reverberation is called emulation of the effect with the help of reverberators. Conditionally, the accepted
reverberation time is the time at which the reflected sound level is reduced by 60 dB.
Reverberation is type of the distortion where reflections of the source signal from any surfaces in a closed space
and summing of these reflections with direct sound. Reflected sounds come to microphone (or to our ears) with
some time delay and some change in frequency components (caused by distance from the signal source to the
reflecting surface and this surface absorbtion characteristics). In atmost manifistation, it is echo - repetition of a
sound due to the reflection of sound waves, unchanged spectrally.
To calculate the reverberation time we use the formula, which invented by Sabin; he was the first researcher of
architectural acoustics:
, where V – the amount of space, A – genera;l fund of acoustic / sound
absorption,
,ai – acoustic / sound absorption coefficient (it depends on the material,
its dispersed or frictional characteristics), Si – area of each surface.
34
APPENDICES
А.5 Clipping
Clipping is an amplitude distortion. For example it occurs when signal levels try to exceed the available amplitude
range for given audio equipment. The tops and bottoms of clipped waveforms are typically squared off,
generating frequencies that were not in the original signal.
Clipping is a form of waveform distortion that occurs in case of overloading of amplifier and exceeding the supply
voltage limit by output voltage. Subjectively, it is expressed in the “hissing” and “sizzle” appearance.
Clipping occurs in digital processing when signal oversteps certain limited range. For example, in a 16-bit system,
the value of 32767 is the most positive (which can be represented), and if during the processing of the signal, the
amplitude will be doubled, for example 32000 shoul be 64000, then instead the amplitude is truncated to the
maximum – 32767. As a result, the top of the waves are flat and there are gross distortions of the signal.
35
APPENDICES
A.6 The duration of speech
Speech is “a concrete speaking, occurring in time and clothed in sound (including inner pronunciation) or in
writing. Speech is the process of speaking and the result of this process, i.e. speech activity, voice work, fixed by
memory or a letter”.
In this context, speech and its duration are the areas (segments) of the phonogram that are meaningful in terms
they contain only verbal information and its percentage with less significant nonverbal information (eg, noise).
This characteristic of the speech signal is fundamental in terms of the importance of speech identification, as it
directly related to the quantity of realizable acoustic and linguistic features in the useful signal.
36
APPENDICES
Appendix B: The list of terms and definitions
A
Acoustic and phonetic attributes of oral speech
The attributes reflecting acoustic qualities of the vocal tract and articulation skills of the person. These attributes
are perceived and revealed with the help of technical means and form the basis of instrumental analysis of
speech signals; the attributes can be evaluated quantitatively.
Active tab
Tab of active data window, used as a data source. The tab is usually displayed over other tabs.
Amplitude (magnitude)
(lat. amplitudo – size)
The maximum deviation value (from the equilibrium position) of an oscillating quantity, for example, the
deviation from zero of an in-circuit electric current voltage, sound pressure intensity, etc. It represents the size of
vibration (deviation value). In strictly periodic vibrations, the amplitude is a constant.
In the research of harmonic sound vibrations, the amplitude means sound pressure in a signal expressed by the
amplitude of a current, voltage or other electrical quantity on the output of sound converting equipment
(microphone). In the signal waveform figure, the amplitude represents the deviation size of an image up or down
from zero position.
Audio/sound record (phonogram)
Speech signal, pre-recorded in the file.
D
Data
A graphical image in the info data window, gathered while recording audio, reading files, operating with the
program SIS II. A representation of oscillograms (waveforms), spectrograms, histograms and other graphical
images.
Data) box
In SIS II, the independent rectangular area limited to a framework within the central working area of the main
window of the program in which certain data (oscillograms, spectrograms, histograms, formants, etc.) are
displayed in the form of a graphic representation.
Data tab
Independent data that together with other data is stored in one data window while operating with the program.
F
Formant
The amplitude maximum, area of energy concentration in the speech sound spectrum, determined by the
resonant properties of the vocal tract. In the speech sound 3-6 formants are commonly distinguished within the
frequency range from 250 to 5000 Hz. Formant is a phonetic characteristic of sound; it contains information about
the speaker’s individual speech features. Formant with the lowest frequency is denoted F1, the second F2, and so
on to the highest frequencies.
37
APPENDICES
Fragment
In SIS II, the part of data which is singled out in some way from the segment, but has not lost its connection with
the remaining data. It can be, for example, part of a segment limited by temporary marks or part of a segment
included in the highlighted interval between permanent marks or part of a segment visible in the box.
M
Mark
A tool to highlight specific data areas in the data window.
N
Noise
1. Disorderly oscillations of a different physical nature, having continuous spectrum in a sound frequency range.
2. Unwanted sound that complicates the useful signal determination and use. Any oscillation in solids, liquids and
gases can be the source of an audible and inaudible noise. Radio-electronic (electromagnetic) noise is a random
variation of current or voltage in radio-electronic devices (for example, audio recording and reproducing
equipment).
Normal distribution mixture
A general linear combination of Gaussian functions, used for approximation of various experimental distributions
of the acoustic space components.
O
Operator
A person who uses the program as intended.
P
Pause
(lat. pausa, gr. pausis – stop, termination)
A break in speech, which acoustically corresponds to the absence of sound, and physiologically – to the stop in
the activity of speech organs.
Pitch (fundamental frequency, pitch of sound/voice)
A perceived quality of sound that is most closely related to the frequency of the first harmonic (fundamental
frequency) in a discrete spectrum and depends on the size and speed of vocal cords vibrations. In oral speech,
this feature determines voice type (bass, tenor, descant, etc.).
Pitch of voice (sound)
A property of voice measured by the vocal folds oscillation frequency in a unit of time: the more oscillations
account for a unit of time, the higher is the pitch.
R
Range
A quantity setting the utmost limits of attribute change (e.g., sounding speech attributes); difference between
minimum and maximum values of the attribute.
38
APPENDICES
S
Speaker identification by voice
Algorithm of calculation (allocation) of speech identifiers (ID) and algorithm of paired comparison of them. The
process of comparing the speech of an unknown speaker against a database of the speech samples of known
speakers to determine whether it matches any of the templates or not, i.e. to identify the submitted unknown
speaker with any of known speakers.
Speaker identification characteristics
The stable individual characteristics of a speaker that are obtained from his speech: appearance and speech
characteristics, as well as subjective auditory estimation of a speaker.
Sound spectrum
An acoustic representation of complex sound providing information about the frequency of sound source, pitch
harmonics and relative intensity of all its frequency components.
Sound
A mechanical oscillation travelling through elastic mediums or bodies (solids, liquids and gases), composed of
frequencies within the limits of human hearing (between about 17-20 Hz and 20 000 Hz). The heightened
sensibility of human ear is detected in the frequency range from 1 kHz to 5 kHz. Mechanical oscillation which is
lower in frequency than 17 Hz is called infrasound, while ultrasound is an oscillation with a frequency greater than
the upper limit of human hearing (20 000 Hz).
Speaker
A person whose speech is in an audio/sound record.
Speech sound
A minimum unit of speech flow resulting from human articulation activity. Speech sound is characterized by
specific acoustic and perceptive properties.
V
Voice Activity Detection (VAD)
Software tool to separate active speech from background noise or silence.
W
Waveform (oscillogram)
Waveform of the speech signal is a graphic representation of the signal vibration amplitude as a function of time.
Waveforms can be obtained using signal processing equipment: loop waveform viewers, signal level recorders
and electronic waveform viewers. Waveforms can be used to extract fragments of data for further research.
39
APPENDICES
Appendix C: Abbreviations
In the present paper the following abbreviations are used.
DET
Detection Error Trade-off Plo – graph of the relation of errors of classification, which visually shows
the dependence of value of probabilities of type I errors and type II errors
DRR
Direct-to-Reverberant Ratio – intensity ratio of direct sound to the reverb sound ratio
EER
Equal Error Rate – level of an equal error or point of coincidence of probabilities of type I errors (α
errors, false positives) and type II errors (β errors, false negatives)
FA
False Acceptance (false recognition)
FR
False Rejection (false access control)
LR
Likelihood Ratio – evaluation of relations of maximum likelihood functions (maximum likelihood
evaluation)
JFA
Joint Factor Analysis
MFCC
Mel Fourier Cepstrum coefficients
SVM
Support Vector Machine
VAD
Voice Activity Detection (and Silence Suppression) – voice activity detector is used for extracting of
active speech from background noise or silence
AFC
Amplitude-frequency characteristic
SNR
Signal-to-noise ratio
NDM
Normal distribution mixture
SFIM
Spectral and formant identification method
40