1
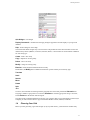
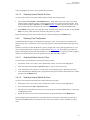
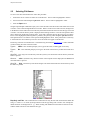
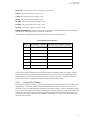
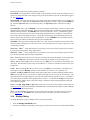
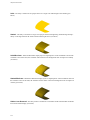
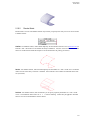
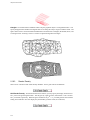
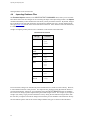
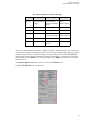
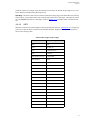
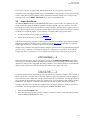
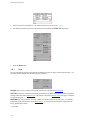
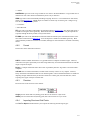
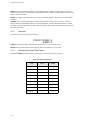
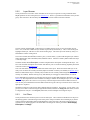
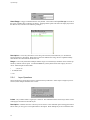
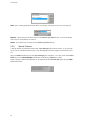
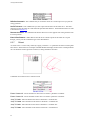
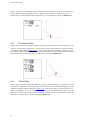
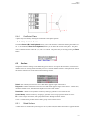
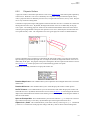
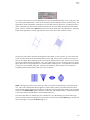
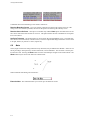
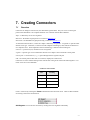
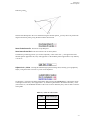
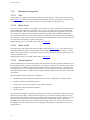
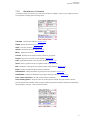
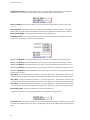
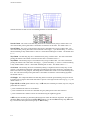
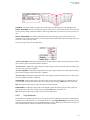
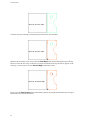
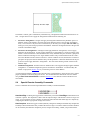
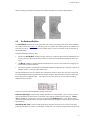
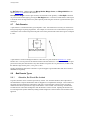
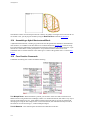
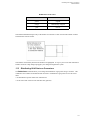
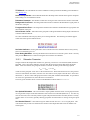
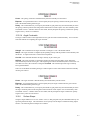
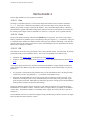
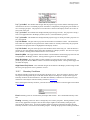
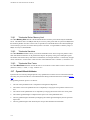
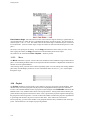
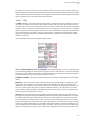
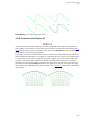
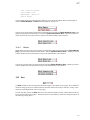
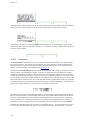
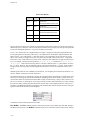
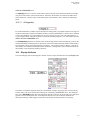
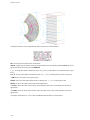
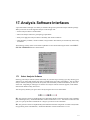
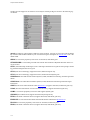
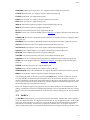
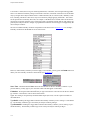
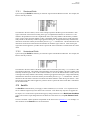
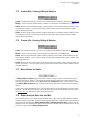
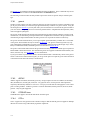
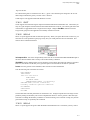
Set ∆s Values
Miscellaneous Controls
The first row of radio buttons provides options for the display of the focus connector’s grid points.
• • • - This radio button displays the connector’s grid points as small, filled, yellow and white circles
depending on whether or not the grid point is in the current subconnector, respectively. This is the default
setting.
• - • - This radio button displays the connector’s grid points as slightly larger, filled, pink circles and connects the grid points with a dashed pink line. This display option is useful for visualizing the faceting effect
of the grid point distribution on the connector shape.
Off - This radio button turns off the display of grid points.
The second row of radio buttons provides two options for the display of the focus connector’s control points.
! ! ! - This radio button displays the connector’s control points as small, open, white squares. This is the
default setting.
Off - This radio button turns off the display of the focus connectors control points. Individual control points
are temporarily displayed when the connector hiliter moves near them.
11.4
Set ∆s Values
Rather than use the Redistribute command in the Connector Modify menu for each connector in your grid,
one connector at a time, you can use the Set ∆s Vals command to specify spacing constraints for many
break points at once. This command also allows you to change the distribution function of these connectors.
And, like the ReDimension Grids command, the changes are propagated throughout the grid causing
domain and block grids to be updated. The ImmdRegen toggle button determines whether or not your
spacing constraint changes cause immediate regeneration of surface and volume grids (enabled by default)
or whether the surface and volume grids are only regenerated when you exit the command.
Spacing constraints may be picked from either the Browser or Display window. When picking from the Display window the first and last 10% of each subconnector’s length is pickable, corresponding to the region
close to the break point. All picked spacing constraints are shown in the Display window as the connector’s
10% of length with an arrow head pointing toward the constraint location. The Browser lists each spacing
constraint as shown below.
The first number listed in each entry is the connector number. If subconnectors are present, then they are
listed to the right of the decimal point. Therefore, 2.2 in the example above refers to the second subconnector of connector number 2.
The B and E refer to the beginning and ending break point of the subconnector, respectively.
The next field lists the distribution function if it is not hyperbolic tangent (TANH). The possible values of
this field are
• blank - hyperbolic tangent
11-13