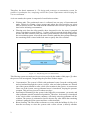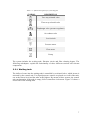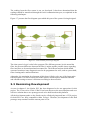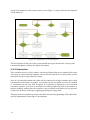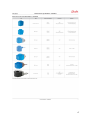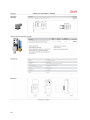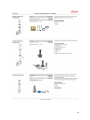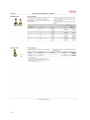
1
Production Process Automation Xabier Þór Tejero Landa Final thesis for B.Sc. degree in Mechatronic Engineering Technology Faculty of Electrical and Computer Engineering School of Engineering and Natural Sciences University of Iceland Production Process Automation Xabier Þór Tejero Landa 24 ECTS thesis submitted in partial fulfillment of a Baccalaureus Scientiarum degree in Mechatronic Engineering Technology Advisor Burkni Pálsson Final thesis for B.Sc. degree in Mechatronic Engineering Technology Faculty of Electrical and Computer Engineering School of Engineering and Natural Sciences University of Iceland Reykjanesbær, May 2015 Production Process Automation 24 ECTS thesis submitted in partial fulfillment of a Baccalaureus Scientiarum degree in Mechatronic Engineering Technology Copyright © 2015 Xabier Þór Tejero Landa All rights reserved Final thesis for B.Sc. degree in Mechatronic Engineering Technology Faculty of Electrical and Computer Engineering School of Engineering and Natural Sciences University of Iceland Grænásbraut 910 235 Reykjanesbær Sími: 578 4000 Bibliographic information: Xabier Þór Tejero Landa, 2015, Production Process Automation, BSc thesis, Faculty of Electrical and Computer Engineering, University of Iceland, pp. 99. Printing: Háskólaprent ehf., Fálkagata 2, 107 Reykjavík Reykjavík, Iceland, May 2015 Abstract An automation system for an existing production line is designed in this thesis. This production line processes separated geothermal water to generate potable water with a high concentration of silica, meant as a dietary supplement for human consumption. The different system sections and their relevant processes are to be controlled by means of an industrial computer (a Programmable Logic Controller), flow, pressure and fluid level sensors and actuated by means of electronically controlled valves. The production is conducted in a remote location, thus the need of implementing an automation solution with remote access. This will allow the operators to control and monitor the production line from the company’s offices, minimizing the need to be present on-site. The project is made for a start-up company, thus emphasis is placed on minimizing costs by sourcing the most cost-effective components that comply with the system’s requirements. Most of the components have been carefully selected and two initial prototypes have been built. The plans for the final prototype are also presented with cost estimates made. Útdráttur Þessi ritgerð fjallar um hönnun og kostnaðargreiningu á sjálfvirkri stýringu (e. automation system) á fyrirliggjandi framleiðslukerfi. Framleiðslukerfið er örsíunarkerfi sem meðhöndlar kísilríkt skiljuvatn frá jarðvarmavirkjun til að framleiða mjög kísilríkt vatn sem ætlað er til inntöku sem fæðubótarefni. Framleiðslukerfið samanstendur af biðtanki þar sem kísilkornum í skiljuvatninu er leyft að fjölliðast og vaxa, og af hringrásarkerfi þar sem kísilmagnið í vökvanum er aukið og hann svo hreinsaður. Fyrirliggjandi kerfi er einnig endurbætt með sjálfvirkri losun á tilbúinni afurð úr kerfinu ásamt því að gera hreinsun á örsíu kerfisins sjálfvirkari. Framleiðslan fer fram á frekar afskekktum stað svo brýn þörf er á að gera það mögulegt að stjórna og fylgjast með kerfinu með fjaraðgangi (e. remote access) um internetið. Þetta gerir stjórnendum kerfisins kleift að fylgjast með og stjórna kerfinu frá höfuðstöðvum fyrirtækisins, og þar með að lágmarka viðveru á framleiðslustað. Verkefnið er unnið fyrir sprotafyritæki sem ekki hefur mikið fjármagn og því er lögð mikil áhersla á að lágmarka kostnað með því að velja eins kostnaðarlega hagkvæma íhluti og mögulegt er, sem þó samrýmast öllum þeim kröfum sem gerðar eru til kerfisins. Dedication To my soulmate Kriselle Lou and my son Lawin Þór. It is your love what motivates me to do my best. Table of Contents List of figures ........................................................................................................ xiii List of Tables ...........................................................................................................xv Abbreviations ....................................................................................................... xvii Acknowledgements ............................................................................................... xix 1 Introduction ..........................................................................................................1 1.1 The system to automatize .............................................................................1 1.2 Project milestones.........................................................................................3 2 Automation system design...................................................................................5 2.1 System requirements ....................................................................................5 2.1.1 The filter..............................................................................................6 2.2 System planning ...........................................................................................6 2.2.1 Waiting tank ........................................................................................7 2.2.2 Filtration circuit ..................................................................................9 2.2.3 Filter cleaning bypass .......................................................................10 2.3 Programmable Logic Controller .................................................................12 2.3.1 Programming environment ...............................................................14 2.3.2 Internet connectivity .........................................................................14 2.4 Sensors........................................................................................................15 2.4.1 Fluid level .........................................................................................15 2.4.2 Pressure .............................................................................................18 2.4.3 Flow ..................................................................................................19 2.5 Actuators ....................................................................................................21 2.5.1 Electronic valves ...............................................................................21 2.5.2 Pumps and motor controllers ............................................................23 2.6 Electrical enclosure ....................................................................................24 2.7 Other components.......................................................................................25 3 Development status ............................................................................................27 3.1 Prototype 1 – flow monitoring ...................................................................27 3.1.1 Flow meter ........................................................................................27 3.1.2 Zelio Smart Relay .............................................................................27 3.2 Prototype 2 – Samba...................................................................................28 3.2.1 Navigation panels..............................................................................29 3.2.2 Internet connectivity .........................................................................29 3.2.3 Phase 1 - Waiting tank ......................................................................30 3.2.4 Phase 2 – Concentration....................................................................31 3.3 Remaining Development ............................................................................32 3.3.1 Serial communications – flow sensor ...............................................33 3.3.2 Phase 3 – Purification .......................................................................33 xi 3.3.3 3.3.4 3.3.5 3.3.6 Evacuation ........................................................................................ 34 Filter cleaning bypass ....................................................................... 35 Batch mode ....................................................................................... 35 Electrical enclosure .......................................................................... 35 4 Cost estimate ...................................................................................................... 37 4.1 Waiting tank............................................................................................... 37 4.2 Concentration and purification .................................................................. 37 4.3 Evacuation ................................................................................................. 38 4.4 Filter cleaning bypass ................................................................................ 39 4.5 Batch mode ................................................................................................ 40 4.6 Electrical enclosure .................................................................................... 40 4.7 Total cost summary.................................................................................... 41 5 Discussion ........................................................................................................... 43 6 Conclusion .......................................................................................................... 45 References ............................................................................................................... 47 Appendix A: Project time plan ............................................................................. 51 Appendix B: MHF15 data sheet extracts ............................................................. 53 Appendix C: PM2653 datasheet ........................................................................... 57 Appendix D: EV220B valve datasheet ................................................................. 61 Appendix E: RM-CL55BD user guide ................................................................. 75 Appendix F: Zelio program .................................................................................. 77 Appendix G: V350 connection diagram ............................................................... 79 xii List of figures Figure 1.1 - The filtering unit to be automatized ................................................................ 2 Figure 2.1 - Full system diagram ........................................................................................ 6 Figure 2.2 - Waiting tank diagram ...................................................................................... 8 Figure 2.3 - Bypass active ................................................................................................... 8 Figure 2.4 - Bypass inactive ................................................................................................ 8 Figure 2.5 - Filtration circuit diagram ............................................................................... 9 Figure 2.6 - Filter cleaning bypass diagram..................................................................... 11 Figure 2.7 - Industrial on/off switch in ladder language .................................................. 14 Figure 2.8 - PLC internet connection diagram ................................................................. 14 Figure 2.9 - Remote Operator interface ............................................................................ 15 Figure 2.10 - Sick MHF15 level sensor [14] .................................................................... 17 Figure 2.11 - IFM PM2653 pressure sensor [15] ............................................................. 18 Figure 2.12 - PM2653 connection diagram [30] .............................................................. 18 Figure 2.13 - Longrun LRF-2000M flow meter [17] ........................................................ 19 Figure 2.14 - Longrun ultrasonic transducers [18] .......................................................... 19 Figure 2.15 - Ultrasonic transducer V-mounting method [17] ......................................... 20 Figure 2.16 - Danfoss EV220B solenoid valve [20] ......................................................... 22 Figure 2.17 - Electrical enclosure diagram ...................................................................... 24 Figure 2.18 - Internal structure of activated carbon [26] ................................................ 24 Figure 3.1 - Prototype 1 connection diagram ................................................................... 28 Figure 3.2 - HMI main screen ........................................................................................... 29 Figure 3.3 - HMI waiting tank screen ............................................................................... 29 Figure 3.4 - HMI concentration screen ............................................................................. 29 Figure 3.5 - HMI trend ...................................................................................................... 29 xiii Figure 3.6 - Waiting tank process logic diagram ............................................................. 31 Figure 3.7 - Concentration process logic diagram .......................................................... 32 Figure 3.8 - Purification process logic diagram .............................................................. 34 xiv List of Tables Table 2.1 - Symbol descriptions for system diagram........................................................... 7 Table 2.2 - Waiting tank I/Os .............................................................................................. 8 Table 2.3 - Filtration circuit I/Os ...................................................................................... 10 Table 2.4 - Filter cleaning bypass I/Os ............................................................................. 12 Table 2.5 - Unitronics Samba and Vision compared ........................................................ 12 Table 2.6 - Price comparison of PLCs with expansions ................................................... 13 Table 2.7 - Level sensor types comparison ....................................................................... 17 Table 4.1 - Waiting tank component cost estimate ............................................................ 37 Table 4.2 - Concentration and purification workforce cost estimate ................................ 38 Table 4.3 - Concentration and purification component cost estimate .............................. 38 Table 4.4 - Evacuation workforce cost estimate................................................................ 38 Table 4.5 - Evacuation component cost estimate .............................................................. 39 Table 4.6 - Filter cleaning bypass workforce cost estimate .............................................. 39 Table 4.7 - Filter cleaning bypass component cost estimate............................................. 40 Table 4.8 - Batch mode workforce cost estimate ............................................................... 40 Table 4.9 - Electrical enclosure workforce cost estimate ................................................. 41 Table 4.10 - Total workforce cost estimate ....................................................................... 41 Table 4.11 - Total component cost estimate ...................................................................... 42 xv Abbreviations DZR Dezincification Resistant EPDM Ethylene Propylene Diene Monomer FBD Function Block Diagram HMI Human Machine Interface I/O Input/Output IP Internet Protocol ISK Icelandic Króna KIT Keilir Institute of Technology NPN A type of transistor, NPN sensor outputs pull down to 0V OCT Open Collector Transistor P&P Plug and Play PID Proportional, Integral and Derivative controller PLC Programmable Logic Controller PNP A type of transistor, PNP sensor outputs pull up to the positive rail PSU Power Supply Unit SMS Short Message Service UI User Interface VAT Value Added Tax VS Versus xvii Acknowledgements First and foremost, thanks to all my classmates. Something very special was born in our group that made us work together and help each other through tough times. Without you I would have never made it this far. I love you guys, you are family to me. Thanks to Ruben Mencos for seeing the potential in me when I was still looking for my path. You recruited me to take this course, what turned out to be one of the best decisions in my life. Thanks to all the staff in Keilir Institute of Technology. You make this faculty a friendly yet professional one. The warmth of this place restored my faith in education. Last but not least, thanks to my advisor Burkni, as well as Fida, Davið and the rest of the staff in geoSilica. You gave me the opportunity to work with you on this project, which turned out to be not only perfect for me, but also a tool for introspection which helped me realize where my potential lays. xix 1 Introduction Automation is the application of automatic equipment in a process or system. By means of automation, manufacturing and other industrial processes are nowadays able to function at unprecedented speeds thanks to the high speed and accuracy of modern electronic devices. One-hundred years ago, an industrial process would require constant supervision and several human workers. In the modern world, machines take the biggest part in the procedure by replacing most or all of the positions where a routine takes place, such as assembly or process management. This shift in methodology implies a lower demand of unskilled hand of work to perform and monitor the process, while generates a higher demand for control systems specialists who create and implement automatic means of production. Such systems are mostly composed of three main groups of components, which the specialist must be able to configure and puzzle together into a design that carries the job(s) required. These are: Control unit: The “brains” of the system, it receives the information from the sensors and controls the actuators as well as hosts the UI. This device needs to be programmed to implement the logic required to complete the process. Examples of such control systems are PLCs, microcontrollers and any kind of computer which supports I/Os. Sensors: These collect data from the system and transfer it to the control unit. In many cases they need to be programmed for a specific purpose (such as output signal type, operational range, etc.) and always need to be chosen to be compatible with the control unit. Examples of inputs are limit switches, pressure meters and temperature meters. Actuators: The devices which move or control a mechanism or system, typically powered by an electrical source. The actuators are the automated analogy of human hands, physically adjusting the variables to be controlled. Common examples are solenoid and motorized valves, motors and pneumatic jacks. 1.1 The system to automatize In this project, a base system designed by geoSilica (a local start-up company) is to be automatized. This system processes waste water from a geothermal power plant (separated geothermal brine) to generate a highly concentrated solution of silica in a purified water medium. This solution is meant for human consumption as a nutritional supplement. This base system is fully operated by hand, with some analog sensors for the user to monitor the status of the system. At the time of starting this project, the system was in development stage and several factors needed to be determined. Thus, development of the automation system had to be in constant adaption to its evolvement. 1 Therefore, the thesis statement is: “To design and prototype an automation system for geoSilica’s production line, complying with all the system requirements while keeping the cost to a minimum”. As it now stands, the system is composed of two distinct sections: Waiting tank: The geothermal water is collected into an array of interconnected tanks, effectively creating a large storage unit where the silica particles are given time to increase in size. The tanks must be filled and left to rest for a given period of time before initiating concentration. Filtering unit: Once the silica particles have increased in size, the water is pumped into a recirculation system (Figure 1.1), where a filter is present which allows water, arsenic and other solutes to flow out of the system while the silica stays trapped into the recirculation system. After all the water from the tanks has been pumped through, the remaining fluid is rinsed with fresh water to purify the silica solution. Figure 1.1 - The filtering unit to be automatized This filtering system was analyzed in a previous project by the author of this paper [1] where the process was investigated, categorizing the procedure in three stages: 2 Concentration: The system is filled with geothermal water (from the waiting tank) and recirculated through the system. Arsenic, salts and other pollutants are filtered out of the system, diluted in water, while silica remains in the system. As waste mass flows out of the system, more geothermal water is introduced, keeping the pressure constant. This process goes on for about two days. Purification: Remaining in the system is the high-silica-concentrate, yet arsenic and other pollutants remain in undesired quantities. Therefore, fresh water is introduced in the circuit while recirculation continues, efficiently removing pollutants off the solution. The process is estimated to last for about a day, after which the remaining solution is pumped off the system and into a collection tank. Rinse/cleaning: The filter tends to obstruct over time with the buildup of silica. It is therefore necessary to rinse the system with a silica solvent (a heavily alkaline solution) between cycles. The rinsing is calculated to last for approximately an hour, after which the filter is washed with fresh water. 1.2 Project milestones For the completion of this project, several milestones are determined: Design of automation system: Overall system design including placement and type of sensor and actuators, logic diagrams and general functionality. Selection of components on minimal budget: Specific models and pricing for control unit, sensors, actuators and other components. Low cost is a must. Implementation of remote access to PLC: Remote access to the system both for monitoring and process control. HMI design: Design and programming of the UI. Logic programming: The implementation of the functionality within the control unit(s). o Waiting tank filling and timing o Concentration process o Purification process o Evacuation process o Filter cleaning process o Batch process (all previous processes in one) o System configuration options Design and construction of air filtration system: Electronics will be placed in a copper-abrasive environment, thus must be enclosed into a safe cabinet with proper filtration. System installation: Once the system is prepared it must be installed on-site, tested and adjusted as needed. It is not expected to complete all of the project milestones during the course of the project here presented, as more time is estimated to be required to fully complete the development of the system. Appendix A presents both the original and reviewed time plans of the project. 3 4 2 Automation system design A well-defined project starts with a good design. To be able to develop the system with a minimal amount of complications, all aspects must be delineated and established. In the following subchapters, the system requirements are listed, the overall design is presented and the individual components selected. 2.1 System requirements After several meetings and interviews with geoSilica’s staff, numerous points were noted which list the requisites of the automation system. The design will take into consideration all of these points. Food processing approved: Since the final product is meant for human consumption, any parts of the system in contact with the fluid must be food approved. Research on requirements needs to be conducted, pinpointing materials and other aspects relevant to this point. High efficiency and reliability: The system must perform all tasks required with minimal supervision. Therefore it must require low-maintenance, have the ability to self-diagnose issues and be able to alert the administrators when a problem is encountered. Low cost: With geoSilica being a start-up company, funding for the development of this project is limited. Special effort must be placed on achieving optimal functionality with the lowest possible cost. Shielded from Sulphur corrosion: The production plant is to be located on the premises of Hellisheiðavirkjun, a geothermal power plant where the level of hydrogen sulfide gas (H2S) is very high [2]. Sulfide reacts with copper forming thin layers of metallic sulphides, such as geerite (Cu8S5), posnjakite (Cu4SO(OH)6H2O) and others, which have completely different properties from copper and causes general deterioration and eventually malfunctioning of electrical devices [3]. Due to this, all electronic components must be insulated and the electronics box which hosts the controllers should have an air filtration system to avoid sulfide entering the enclosure. Internet access: The offices of geoSilica are located about 100 km away from Hellisheiði, where the filtering takes place. It is thus required to be able to control and monitor the processing remotely, avoiding the constant travelling between locations. Security: Given that the system will be connected to the internet, a solid security system must be implemented to avoid unwanted access. 5 2.1.1 The filter The filter utilized by geoSilica for concentrating the fluid is a specialized one which has very specific operational instructions. Regarding the control system, the operating limits [4] are of outmost interest, as listed below: Operating pressure: 2.8 bar maximum pressure, or 6.9 bar if permeate side is pressurized. Permeate pressure: 1.4 bar maximum pressure (at all times), including backflush. Differential pressure: 2.1 bar maximum differential pressure across both ends of the filter. These limits must be constantly monitored by the system to ensure no damage is done to the filter. 2.2 System planning The control system is built around the filtration unit already constructed by geoSilica (as seen in chapter 1.1), adding all necessary electronic components which will connect to the control unit as well as modifying certain parts, such as air drain placement. Figure 2.1 presents the system diagram, with all components in place. Table 2.1 gives an explanation of the symbols there used. Figure 2.1 - Full system diagram 6 Table 2.1 - Symbol descriptions for system diagram SYMBOL DESCRIPTION Two-way solenoid valve Three-way solenoid valve Diaphragm valve (pressure regulator) Air exhaust valve Level switch Pressure meter Flow meter Pump The system includes the waiting tank, filtration circuit and filter cleaning bypass. The following subchapters explain the functionality of these different sections and relevant components. 2.2.1 Waiting tank The inflow of water into the waiting tank is controlled by a solenoid valve, which in turn is activated by the control unit. Two liquid presence sensors are placed on a wall of the tank, one at the lowest level and the other at the highest. By means of these sensors, the control unit can determine if the tank is empty, full or somewhere in-between. Figure 2.2 shows a closer look of the waiting tank. 7 Figure 2.2 - Waiting tank diagram Table 2.2 summarizes the required I/Os for this part of the process. The pump could be controlled by a relay, but it is a more efficient method to implement a PID controller on an analog output. Table 2.2 - Waiting tank I/Os I/O Amount Description Digital Input 2 Level switches Relay output 1 Solenoid valve Analog output 1 Pump control The hot water being taken into the waiting tank must never be still in the pipes, for during winters it could freeze as well as silica could sediment and affect the end product. Therefore when the tanks are not being filled, water must flow into another system. This is easily accomplished by implementing a bypass with a smaller diameter than the valve used to allow water into the tank. While the valve is closed, water flow is forced through the small opening to the bypass (Figure 2.3) but while the valve opens the liquid tends to flow through the point of less resistance, the larger diameter outlet (Figure 2.4). Figure 2.3 - Bypass active Once the tank is full and enough time has passed for the silica molecules to grow, the pump can then start pushing the fluid into the recirculation system. Figure 2.4 - Bypass inactive 8 2.2.2 Filtration circuit Built upon the original system made by geoSilica, the core functioning remains the same. Devices such as valves and pressure sensors are replaced with their respective electronic versions and some minor modifications are implemented. An isolated diagram of the filtering loop can be seen in Figure 2.5. Figure 2.5 - Filtration circuit diagram An air drain valve is added to the highest point in the system, allowing air to efficiently escape as it floats upwards. This drain is floater-based, functioning without the need of an electric source. The inlets for the concentration and purification processes are controlled by normally-closed solenoid valves, which are opened as required. The cold water inlet is regulated with a diaphragm valve, ensuring the inlet pressure does not surpass the maximum allowed by the system. This diaphragm is adjusted by hand and should not require much attention once it is set. An outlet valve is also present, which opens when the system is to be emptied by the drainage pump. The level switch present in the inlet/outlet of the tank allows to determine when the tank has been fully emptied. These parts are optional, as the system can be emptied manually once the process is done. The three three-way valves seen in the circuit are used to switch between concentration/purification and filter cleaning loops. In Figure 2.5, these are in their normal position (non-powered) where the circuit is configured for concentration/purification. 9 The two pressure sensors found in the original system are replaced by analog transducers which send the current pressure to the control unit. The correct use of this data is critical for the filter to function properly; it determines the amount of fluid required at the inlets while processing as well as it monitors the state of the filter for possible issues (such as filter obstruction). Lastly, a flow sensor monitors the filter’s waste outlet. This measurement in combination with the pressure sensors helps determining the state of the filter. The amount of fluid exiting the system is also monitored on the purification process, which helps deciding when the concentrated product has been fully flushed of arsenic. This sensor can be configured to communicate either through Modbus or sending an analog signal (see chapter 2.4.3). Table 2.3 summarizes the required I/Os on the PLC for this part of the process. Table 2.3 - Filtration circuit I/Os I/O Amount Description Digital input 1 Level switch (optional) Analog input 3 Pressure & flow (optional) Relay output 5 Solenoid valves, recirculation pump & drain pump (optional) The three-way solenoid valves are open for this circuit on their normal position, therefore no relays are needed to power them at this point. The relays powering these to switch positions are accounted for in the next subchapter. 2.2.3 Filter cleaning bypass The filter bypass (Figure 2.6) allows for the cleaning of the filter without the need of removing it from the system. It also permits to pause the production process to perform a cleaning routine, without interfering in the final product’s quality. 10 Figure 2.6 - Filter cleaning bypass diagram Once the recirculation circuit is switched over the cleaning circuit by activation of the threeway valves, cleaning fluid (as chosen by the operators) is pumped into the system through the filter’s output (backflow) by changing the state of the three-way valve present at the waste outlet. The pressure sensor present there is used to ensure the backflow pressure does not exceed the permissible limits. As pressure builds up, the recirculation pump is activated and the fluid is pressurized in the system. When the solvent is well saturated, the waste outlet opens and fresh water is used to rinse the circuit. This process may be repeated as many times as needed until the pressure and flow sensors determine the filter to be clean. Once the filter is fully cleaned and rinsed, the valves switch back to the main loop and production may continue. The container for the cleaning fluid is not yet designed and the fluid itself has not been decided upon. It might be necessary to add a sensor to determine the level of fluid in that tank. This is left to decide in the future, when the details of the cleaning solution are solidified. The cleaning solution pump can be pre-configured to work on an ideal rate, as chosen by geoSilica’s staff. This pump may be activated with a relay, filling the system and stopping until the fluid has been flushed out. The pressure sensors help determining when enough fluid has been pumped in. It is also possible to control the pump with an analog output and, if desired, attach a PID controller to it. By this method, it is possible to allow a constant flow out of the system if the previously explained method proves to be non-ideal. By doing so, the cleaning fluid might not be fully saturated once expulsed from the system thus making the process more expensive but it is left to determine which method is more effective. Table 2.4 presents the additional I/Os required for this part of the process. 11 Table 2.4 - Filter cleaning bypass I/Os I/O Amount Description Analog input 1 Backflow pressure sensor Relay output 7 Three-way valves (3), two-way valves (3), cleaning fluid pump (1, possible to use analog) Analog output 1 Cleaning fluid pump (1, instead of relay) 2.3 Programmable Logic Controller A PLC was decided to be the best choice for a control system [1]. Several PLCs were considered, finding out that the Vision line from Unitronics was the best choice [1]. Upon a closer inspection, two models seemed to be the most appropriate ones: the enhanced Vision 350 and the low-budget Samba. Both these controllers present an embedded full color 3.5” touchscreen and an array of choices of built-in I/Os. Table 2.5 compares the two models considered. Table 2.5 - Unitronics Samba and Vision compared Price (ISK, no VAT) Digital Inputs Analog Inputs Analog Resolution (bits) Relay Outputs Analog Outputs Local expansion module Ethernet Web Server SD Card Support Remote operation Permeability App Logic (MB) Memory Bits Memory Integers Long Integers Double Word Memory Floats Timers Counters 12 Samba SM-J-R20 29.900 10 total 2 (8 digital remaining) 10 8 0 No Optional No No Yes IP66/IP65/NEMA4X 0.5 512 256 32 32 24 32 32 Vision V350-35-RA22 79.765 12 total 2 (10 digital remaining) 14 8 2 Yes Optional Yes Yes Yes IP66/IP65/NEMA4X 1 8192 4096 512 256 64 384 32 With the V350 being an advanced version of the Samba, it is obvious that it is a better product although much more costly. A Samba PLC was borrowed from the distributor for evaluation purposes and over the remaining length of this chapter it is analyzed and decided whether this cheaper PLC is sufficient and/or ideal for this project. Given the design of the system, at least two analog inputs are required to begin with (pressure sensors), as well as several digital (level switches) and relay outputs (solenoid valves). An analog output is optional but recommended, for it permits an easy implementation of a PID controller for the pump between the waiting tank and filtering unit, thus optimizing pressure stability in the system and minimizing stress on the motor. In later stages, as when developing the cleaning bypass, more analog I/Os may be required. These can be added by implementing an expansion adapter, which bridges the PLC with a dedicated I/O module. Two kinds are available: Local expansion adapters are connected side-by-side to the PLC [5]. Remote expansion adapters utilize a serial port with a proprietary CANbus protocol (UniCAN) allowing the I/O module to be up to 1000 m away from the PLC [6]. The latter is about three times more expensive and also renders the serial port useless for any other purposes [6]. Remote expansions require more programming time, for a separate program needs to be uploaded to it, as well as the communications protocol configured on both the PLC and expansion unit [7]. Since there is no need to implement remote sensors/actuators, a remote adaptor is not needed unless the Samba model is chosen for the project (which does not support the local expansion). When comparing the total price of both PLC models together with their supported expansion adaptors (Table 2.6), it comes to light that the price difference is not that great. Given the additional complications and work required to make the remote expansion functional, it is suggested to invest in the V350. The additional supported features will also be of interest for future development of the project, such as SD card data logging, web server and the already mentioned analog outputs. Table 2.6 - Price comparison of PLCs with expansions SAMBA SM-J-R20 VISION V350-35-RA22 BASE PRICE 29.900 ISK + VAT 79.765 ISK + VAT EXPANSION MODULE PRICE 28.511 ISK + VAT 8.737 ISK + VAT TOTAL PLC + EXPANSION 58.411 ISK + VAT 88.502 ISK + VAT EXPANSION CONFIGURATION Complicated P&P 13 Therefore, it is concluded that the V350 PLC is more adequate for this project and although the price appears to be much higher at first sight, it reduces the overall cost of development. It also includes the much preferred analog inputs, which in the Samba are not present (thus requiring an expansion module from early stages). 2.3.1 Programming environment Both the V350 and Samba PLCs are configured through the royalty-free software Visilogic by Unitronics. This software includes the programming environments for both the logic and HMI parts in one project, making the development easy and dynamic. The programming language is Ladder, a standard in the industry. This language is built around relay logic, representing the program by a graphical diagram based on circuit diagrams of such systems (Figure 2.7). Figure 2.7 - Industrial on/off switch in ladder language Unitronics offers great educational tools through example programs, videos and webinars, allowing the programmer to easily familiarize himself with the environment. The help files give extensive information about the different features available plus they offer free, professional online assistance to solve any given complications. Overall, programming with Visilogic is relatively easy and hassle-free. 2.3.2 Internet connectivity To connect remotely to the PLC, a wireless data connection is utilized. Several industrialgrade modems are available, but are very costly compared to a standard 4G consumer modem. Therefore it was decided to configure the PLC to work within a network where the modem has a static external IP and the router actively forwards the connections to a specific port to the PLC (Figure 2.8). An additional Ethernet port is necessary to accomplish this, which is not too costly. Figure 2.8 - PLC internet connection diagram 14 To access the system, the free software “Remote Operator” by Unitronics is used (Figure 2.9). This program connects to the modem’s static IP through the port of choice and allows the user to virtually access the PLC by presenting the display on-screen. Interaction is processed with the computer’s mouse, where a simple click equals a panel touch action. Figure 2.9 - Remote Operator interface The software can be configured to load all settings upon start-up, making it easy to use for the end user. A special file can be exported from Visilogic which stores all pictures and functionality of the program into Remote Operator, thus data transfers are minimal (only variable updates and user interactions are exchanged). This is ideal for the project, as data connection in the Hellisheiði area is limited to Edge, which is about 10 times slower than 3G (about 135 kbps [8] VS 1300 kbps [9], respectively). 2.4 Sensors This chapter presents the different sensors selected for the system. These are chosen based on suitability, price and reliability. The Unitronics PLCs support both PNP and NPN digital inputs, with the user able to configure the ports by use of on-board jumpers. It must be pointed out that no individual input can be configured; it is all PNP or all NPN. Also, when using NPN, the analog inputs cannot be used as such (if present on the module). Therefore, all digital sensors used in this project are chosen to be PNP, which is the most common choice in the industry [10]. 2.4.1 Fluid level To determine the state of the waiting tank as well as fluid presence in the recirculation system, a method of detecting water presence is required. 15 Several options are available, where the detection method greatly varies. The different types of sensor considered for this project are: Capacitive: Generally used as proximity detectors, capacitive sensors can detect objects located behind a non-conducting layer by monitoring changes on a generated electric field [11]. These sensors can thus detect the level from the outside of the container, avoiding contact with the processed material. Floater: Level sensors based on floaters can work based on several different principles, such as magnetic field detection, mechanical switch activation and resistive variances [12]. Contact with the fluid requires the sensor to be built of foodprocessing approved materials and makes it prone to clogging due to silica sediment. Guided radar: A low-energy electromagnetic wave is pulsed through a probe inserted in the tank. By monitoring the time it takes for the wave to return to the transducer, the fluid level is calculated [13]. This sensor is thus in partial contact with the fluid, requiring specific build materials. Hydrostatic pressure: A precise pressure transducer is submerged into the fluid, which calculates the water level based on the pressure created by the liquid column above it [13]. This sensor is in contact with the fluid and must be of a suitable material and constituted of a hygienic design. Photoelectric: These sensors use a light beam to detect an object’s presence within their operating space [11]. More specifically, a diffuse photoelectric sensor could be ideal for this project. Such transducers emit light which is reflected on a nearby object (or fluid) and returns to the receiving end of it. A small surface of contact with the fluid is required, thus the build materials must be food-approved. Ultrasonic: Similar to the guided radar method, ultrasonic transducers send a sound wave which bounces back on the material and based on the time it takes to return, the distance is calculated [11]. These could be ideal for the tank, given that they are contact-free, but could not be used in the recirculation system. Vibration: A tuning fork is piezoelectrically energized, which makes it vibrate at its resonant frequency. Once it is covered in liquid, the vibration frequency change is detected by the sensor [13]. While some of these sensors are able to detect the exact level of the fluid (ideal for the waiting tank), such feature implies the transmission of data as an analog signal. Analog inputs on a PLC are more expensive than digital ones and generally few are present by default, requiring an expensive expansion module. On the other hand, fluid level switches only detect the presence of the liquid at a given point and thus require two units to determine both full and empty states. Yet, these are often cheaper and output the signal into digital inputs on the PLC, which are cheaper and abundant. Contact with the fluid is also relevant, for it dictates the use of food grade materials and hygienic designs which increases the price of the unit. Level of maintenance is also afflicted, as silica sediment might obstruct the sensor. 16 Therefore, an adequate choice of sensor(s) presents a conundrum which can only be solved by comparing the options side-to-side, as seen on Table 2.7. In this table, only food-grade sensors are considered when in contact with the fluid. Table 2.7 - Level sensor types comparison SENSOR UNIT COST High CAPACITIVE Low FLOATER Med./High GUIDED RADAR Med./High HYDROSTATIC Low PHOTOELECTRIC High ULTRASONIC Low VIBRATION PRECISE LEVEL No Yes Yes Yes No Yes No MAINTENANCE Low High Medium Medium Medium Low Medium By analyzing this data, it is possible to eliminate certain options: Capacitive sensors, although low maintenance, are overly expensive. Also, two units are needed on the tank. Floater-based sensors may require too high maintenance due to silica scaling. Both guided radar and hydrostatic are too costly given the level of maintenance required. Three types remain to choose from: Ultrasonic could be a great choice, as long as budget is not an issue. Both photoelectric and vibration sensors present a cheap solution, even though two units are required to monitor the tank. Since budget is of concern in this project, only photoelectric and vibration sensors remain as an option. Because of its price and availability, a diffuse photoelectric sensor was selected for this project. The model chosen is MHF15-21NG1HSM by Sick AG (Figure 2.10), a compact optical level switch built on a stainless steel housing with a polysulfone apex [14]. This low-cost sensor gives a signal through its PNP output when liquid is detected (more information in Appendix B). Given its operational method and design, it is both suitable for the waiting tank (requiring two units) and the recirculation system (for the evacuation phase). Figure 2.10 - Sick MHF15 level sensor [14] Maintenance-wise, it is expected to observe a slow buildup of scaling on the apex, therefore the sensors should be removed regularly for cleaning. It is recommended to monitor the state of the sensors monthly to eventually determine the ideal maintenance schedule. 17 Its price is 27.787 ISK + VAT. A suitable cable is required, which costs 2.260 ISK + VAT. Since two units are required for the tank, the total price for such section of the project is 60.094 ISK + VAT. The sensor and cable for the evacuation section costs 30.047 ISK + VAT. 2.4.2 Pressure Pressure monitoring is critical for the correct functioning of the system. The pressure sensors require to be in contact with the fluid, thus need to be built of a suitable material, as well as being constructed with a hygienic design. The low pressure range at which the system functions and the importance of keeping the system within permissible operating ranges demand a high precision and reliability set of meters. Considering these requirements, a suitable sensor was found within an acceptable price range. IFM’s PM2653 pressure sensor (Figure 2.11), priced at 88.489 ISK + VAT, is able to measure ranges of -1 bar ~ 25 bar with an accuracy of ±0.6% and a repeatability of ±0.1% [15]. Figure 2.11 - IFM PM2653 pressure sensor [15] This sensor is programmable and can be purchased ready to output an analog signal of 4-20 mA over the desired range (0-3 bar for this project) with no extra charge. This feature grants a high resolution when reading the analog output with a PLC, for all resolution bits are utilized to measure the specific range. Given that the analog resolution in the V350 PLC is of 13107 units [16], for a range of 0-3 bar the resolution would be: 3 ≈ 0.000229 ≈ 0.23𝑚𝑏𝑎𝑟 13107 This resolution is well above estimated minimum requirements and will prove extremely useful for the application of the pump’s PID controller, as later explained in chapter 2.5.2. The sensor can be connected by a two-wire or three-wire interface, being the latter the chosen one for the project, which powers the device by its own power lines and leaves one output exclusively for transmitting the signal (Figure 2.12). Figure 2.12 - PM2653 connection diagram [30] For more details on technical information, refer to the datasheet in Appendix C. To take advantage of the hygienic design feature, a special mounting adapter is required. Different versions are available, which vary in shape and fitting. It is not clear at this point which is more suitable for fitting into the system at hand and the assistance of a plumbing specialist might be required. This presents no issue whatsoever, for a plumber is present within geoSilica’s staff who has been confirmed to be available to carry on this task. The price of one such fitting (the one currently available at the distributor’s store) is 15.903 ISK + VAT, and pricing for the other adapters should not vary much from this one’s. 18 2.4.3 Flow Flow meters are available in several designs, ranging from mechanical to contact-free devices. Given the nature of the project, a mechanical sensor is not viable for besides the pre-requirement of being food-approved (as it would be in contact with the final product, explained in section 3.1) it would also be prone to silica build-up on the moving parts, potentially loosing accuracy and eventually all functionality. Being budget an issue, the most cost-effective solution was found to be an ultrasonic flow meter by the Chinese manufacturer Longrun, model LRF-2000M (Figure 2.13). Its price is 86.421 ISK + VAT. Chinese products are commonly known to be of low quality and/or questionable efficiency, yet Longrun is a company specialized in flow meter technology with over 12 years of experience in the sector [17]; this suggests their products are up to European industrial standards. The only issue encountered so far is the user manual which, although thorough and detailed, can be difficult to understand at some points. Figure 2.13 - Longrun LRF2000M flow meter [17] It features an accuracy of over 1% of the measured range and a repeatability of 0.2%, being able to measure flow rates as low as 0.001 m/s [17]. This sensor includes a full suite of I/Os: Upstream and downstream transducer ports. One analog output, loop powered. Two PT100 temperature sensor inputs. Three analog inputs. One OCT output. One relay. One RS485 serial communications port, customizable. Two ultrasonic transducers must be connected to the relevant inputs for measuring the flow rate of a liquid through a pipe section. Although it is possible to use customized transducers, Longrun offers several ready-to-use models which are bundled by the Icelandic distributor. Mounting method and measuring range varies between models, yet in this case the clamp-on, small size LFR-2000MNB1 model with a measuring range of 15mm to 100mm was chosen [18] (Figure 2.14). Figure 2.14 - Longrun ultrasonic transducers [18] These transducers need to be clamped around the outside of the pipe section where the flow rate is of interest. A few configurations may be used, being the most common the reflective mode or V-method (Figure 2.15). 19 Figure 2.15 - Ultrasonic transducer V-mounting method [17] For a good sound transmission through the pipe, a special grease is recommended to be applied between the pipe and the transducers which fills the gaps in-between and prevents the sound wave to be diffused through the air. The Molykote 111 Compound produced by DOW Corning was recommended by the distributor for this purpose. To achieve an accurate flow measurement, the following parameters need to be configured [17]: Pipe outer diameter. Pipe wall thickness. Pipe materials (for those pre-configured in the controller) or sound speed for the pipe material. Pipe liner material (if any), its sound speed and thickness. Liquid type (for those pre-configured in the controller) or its sound speed. Transducer type used. Transducer mounting method (such as V-method). After this, menu 25 in the controller will display the required distance between transducers, which need to be installed accordingly. Lastly, the parameters must be solidified (permanently stored) on the controller. While the sensor is designed to function as a stand-alone device, it can also transfer the measurements to a PLC via the analog output and/or serial bus. The analog output can be configured to output any of the different measurements which the meter can monitor (flow, PT100, etc.) and is able to do so by different methods (0-20mA, 420mA, 20-4-20mA, 0-4-20mA, 20-0-20mA), as selected by the user. The range of the measurements is also configurable, where it is possible to choose the values corresponding to the low and high ends of the analog output. The RS485 serial communications port can be used both to read and write registries from and to the module. It supports both Modbus ASCII and Modbus RTU protocols and allows to configure the baud rate, parity, data bits and stop bits, making it compatible with most PLCs in the market. Using this method of communication, although much more time consuming than the analog option, is a powerful solution which effectively transforms this sensor into a full expansion module for the PLC connected to it. 20 By transmitting data through a serial connection, it is possible to access several extra functions built into the controller [17]. The most interesting ones for this project are: Time period flow totalizer, up to 64 sets per day and 32 sets per month. Fully programmable batch controller. Data logger. 32 records of power-on/power-off data. Given all these features which can only be accessed by the PLC through a serial connection, it is determined that the time required to set up such communication system is feasible for this project and highly recommended over the analog output option. 2.5 Actuators A set of actuators is required to control the system. By means of relays, analog signals and/or serial bus protocols, the PLC changes the state of these devices what in turn handles the transition between phases, adjusts flow ratios, etc. 2.5.1 Electronic valves Several solenoid valves are required to control the flow in the system, as seen in chapter 2.2. Some are simple two-way valves, which act like an open/close gate, while others are more complex three-way valves that control the direction in which the liquid flows. Regardless of the specific type, all of these are in contact with the final product at some stage of processing. Therefore, the build and construction materials must be approved for food processing systems. The Icelandic Food and Veterinary Authority (Matvælastofnun) was contacted to enquire about this issue, for it is the institution responsible of food regulations in Iceland. After a long conversation, it seemed as if they did not have access to this information and they failed to refer the researcher to a better source. What did though come to light was that the regulations for potable water systems in Iceland follow European legislations, which dictate certain limits for the amount of certain dissolved materials in this medium [19]. Given that typically these valves are constructed of copper, it is of most importance to note that the maximum allowed presence of copper in drinking water is 2.0 mg/l [19]. Two engineering firms (Fálkinn ehf and Samey ehf) were enquired for a solution to the problem. It was suggested that stainless steel 316 would be the material of choice for this application. AISI316L stainless steel is a chemically inert metal which is resistant to aggressive media [20], which makes it ideal for food processing applications. On the downside components built of this material, when compared to copper or brass, are very costly thus great effort needed to be placed on research to try and keep costs to a minimum. 21 Different sources point at the use of DZR brass, a copper alloy engineered to resist the effect of leeching, or the absorption of metals from the alloy into the liquid medium (water). Danfoss, a world-wide specialist on water systems control devices, was approached to enquire about the issue. Danfoss Iceland recommended the use of the EV220B032U1256 valve (Figure 2.16). This is a solenoid valve with a Kv value of 2.500 m3/h (the flow through at 1 bar of pressure), composed of a brass body material [20]. Although the DZR version is available within this line of valves, it was later observed that this valve was built of standard copper thus being non-ideal (and possibly prohibited) for potable water systems applications. Figure 2.16 - Danfoss EV220B solenoid valve [20] The price of the valve supplied by Danfoss is 8.757 ISK + VAT and although this valve is likely to be unsuitable for the project, it gives a reference point on valve prices. To actuate the valve, a solenoid coil is required. Prices for this coils oscillate around 5.000 ISK + VAT, with little cost variations between models. Because of the ambiguity of the matter, the health department (Heilbrigðiseftirlit Suðurnesja) was reached to assist on the sourcing of information regarding the approval of the DZR brass on potable water systems. There it was confirmed that the Icelandic Food and Veterinary Authority was responsible for regulating such systems and the names of the individuals responsible of these operations were acquired. It was though impossible to contact them at the time because of a workforce strike which still stands at the time of writing this report. The health department recommended to attempt reaching the Danfoss central office in Denmark, for the Danish are experts on these kinds of regulations. After several phone calls and emails, the same EV220B type of valve was recommended by their technical sales support department, without giving any specifications on the material. It was then observed that the different models offered included a stainless steel AISI316L version. Upon further research, it was determined that DZR brass is not suitable in Iceland. The high alkalinity of tap water [21] appears to be overly abrasive for the material, resulting in corrosion and therefore contamination of the fluid [22]. Given all this information, it is highly recommended to utilize valves with conducts built of stainless steel AISI316L. The increase of price compared with other solutions is justified by the insurance of a fully qualified material for food processing systems, avoiding contamination of the product, issues with the regulatory offices and the long-lasting properties of the material. Therefore, the EV220B family of valves is chosen for the parts of the project where a twoway valve is required. The DZR body type is composed of AISI316L steel in all parts where there is contact with the fluid and the seal is built with EPDM rubber, an approved material in food-grade systems [23]. Its price is yet unknown, but it is expected to see over 100% increase in price, or 20.000 ISK + VAT. The datasheet for this family of valves can be found in Appendix D. 22 An equivalent three-way valve remains to be found for the later stages of the project. It is expected to see up to 100% increase in price, or about 40.000 ISK + VAT. 2.5.2 Pumps and motor controllers As previously explained, a portion of the control system involves the handling of water pumps. Several of these, such as the recirculation pump and drainage pump, are easily controlled by a relay which activates the motor at the pre-programmed power. Since it is possible to calibrate acceleration and deceleration on the controllers and these pumps are meant to be active for long periods at a time, there is no risk of over-stressing the motors (which would result in shortened lifetime [24]). Other pumps, namely the inlet pump between the waiting tank and the filtering system, need to have a variable flow rate as to maintain the system at a steady pressure level. To do so, it is necessary to use some kind of regulatory signal, as the constant switching of a relay would be inefficient and stressing for the motor. Two methods for signaling the frequency changes to the motor controller are available to choose from: serial communication and analog signal. Serial communication (Modbus, CANbus, etc.) is a highly efficient protocol, allowing for bidirectional data transfer between several controllers on one single data line. In addition to handle the frequency variations, it also permits to adjust parameters and read operational data yet these features are not required for the project at hand. Also, implementing serial communications can be an arduous task which in this case can be avoided. It also requires the controller to include a suitable port. Analog signaling to the motor controller requires an analog output port on the PLC. The V350 model early presented includes two of these, while the Samba would require an additional expansion module. Implementing such control method is abysmally simpler than the serial bus approach. Therefore, it is chosen for this project to utilize an analog signal to control the motor controller’s frequency in those places where this is needed. By this method, any pump connected to a controller supporting analog input may be used. With minimal configurations on the controller’s interface, the control system would be able to handle it regardless of brand and model. This output is handled by a PID controller, which adjusts the speed as required to maintain the ideal pressure in the system. A PID autotune function block is available in Visilogic, which performs a PID calibration routine. This routine is carried out as follows [25]: The system is allowed to run at full power (fluid pumped in) until the setpoint (pressure mark) is surpassed. The system is stopped until the control variable (pressure) drops under the setpoint. The previous two steps are now repeated three times, while the systems response is monitored. The data collected automatically generates the configuration variables required for the PID controller, which may be run at this point. 23 This method is ideal for this project; the autotune feature can be used every time the system begins the concentration process thus calibrating the PID and filling the system with the same procedure. 2.6 Electrical enclosure As mentioned earlier, the high levels of sulfide gas in the environment corrode and degrade the copper within electronic components. Therefore, the PLC, power supply and other modules should be enclosed in a sulfide-free casing. To achieve this, a modified electrical enclosure may be designed. By implementing a suitable air filter through which air is cleaned before being fanned into the box, it is ensured that all air within the box is free of corrosive gases (Figure 2.17). Figure 2.17 - Electrical enclosure diagram Different filter materials have been investigated: Activated carbon is a very common and cost-effective material to filter hydrogen sulfide. Carbon grains undergo a process which opens micro pores and fissures on its surface, increasing the internal surface area and thus enhancing the material’s adsorbent properties [26] (Figure 2.18). Specialized filtering materials are offered by Purafil, a USA-based company which focuses on the engineering of Figure 2.18 - Internal specialized filtering products [27]. Their product Purafil structure of activated Odorcarb Ultra Media is specifically engineered for the carbon [26] filtration of hydrogen sulfide and it is composed of activated carbon, activated alumina and other binders, resulting on a high reserve alkalinity product which “provides the maximum neutralization potential available and assures the highest overall performance” [28]. Prices for these materials need to be further researched, as well as the lifespan per volume unit given the average levels of airborne hydrogen sulfide in the Hellisheiði area. Ideal flow rates need to be calculated once the enclosure is chosen, what should also be taken into account for the calculations. A suitable container for whichever filtering product is selected needs to be either sourced or designed. Different formats are possible, such as cylindrical and slot-based, with no known performance differences between them. 24 2.7 Other components A few minor components remain to be selected for the system to be completed. These components are not electronically controlled and thus are somewhat outside of the scope of this project. Regardless, it is crucial to acquire the appropriate models, ensuring they meet the requirements of the system. Such components are: Air drain valve, found on the recirculation system. Diaphragm valves, found on the cold water inlets. These components would be relatively easy to acquire with the assistance of a professional plumber or plumbing company salesperson. 25 26 3 Development status The development of the control system is currently on the second prototype stage. The following subsections present the different prototypes built and their various fragments. In this chapter, further development is also analyzed and planned. With this information it is possible to estimate the time remaining to completion. 3.1 Prototype 1 – flow monitoring Early into the project’s development, geoSilica decided that the measurement of water flow through the recirculation system was of interest. Given the early stages of development at the time, no control system had been decided upon thus a solution had to be implemented in a way that it would be reusable later on in the project. It was also decided that flow rate could be used for a simple system diagnostics platform, where an abnormally low or high flow would indicate a potential failure (filter cleaning required, air bubbles in the piping, etc.). Budget was a recurring issue as well, therefore the solution should be low cost without incurring a big impact in performance and reliability. Thus, the project was centered for a time period into finding and implementing this “quick fix”. 3.1.1 Flow meter The flow meter presented in chapter two was chosen at this point because of its low cost, contact-less measuring method and versatility. In accordance with geoSilica’s interests, a suitable pipe section was chosen for flow measuring. The configuration steps for the meter were followed, which required determining certain values as stated in chapter 2.4.3. Once configured, the distance between transducers was noted and these placed accordingly. The output method used was the analog output, which can be effortlessly ported to any given controller. An ideal range of 4000L/h~5000L/h was determined for measuring, thus the sensor was configured to output 4mA~20mA based on those limits. 3.1.2 Zelio Smart Relay Schneider’s Zelio is a so-called “smart relay”, a low-end PLC which offers the possibility of controlling basic systems. One such Zelio, model SR3B101BD, was purchased by geoSilica in the past and was decided to use in combination with the flow meter to monitor the flow and stop the system if errors were diagnosed. A suitable power source accompanied this controller, which can also be used later to power the Unitronics PLC when purchased. This would be sufficient to connect the flow meter, but it was found out that the analog input there present only supported 0V-10V analog signal, while the meter works with current output as previously stated. 27 To overcome this issue, an analog converter was borrowed from KIT, which reads the current analog signal from the meter and outputs a voltage analog signal to the Zelio. This isolated analog converter is manufactured by Schneider, model RM-CL55BD. A wiring diagram and terminal description can be found in Appendix E. A GSM terminal was also borrowed from KIT, along the required SR2-COM01 module, which allows the system to send SMS alerts to geoSilica’s staff upon an alert is triggered, accompanied of a short text describing the error (abnormally high or low flow). Besides alerting via SMS, the controller stops the pumping from the waiting tank if the flow is abnormal. To do so, the pump is controlled by one of Zelio’s relays. It is possible to turn the pump on and off at will with one of the buttons on the Zelio. A power surge recovery system was also designed, where the Zelio would resume operations in case of recovering from a power loss. The Zelio controller is programmed with the royalty-free software Zeliosoft, which gives the option to program either through Ladder or FBD languages. FBD was chosen for this project, as the author had more experience with such language. Appendix F shows a snip of the program created. Once the Zelio was ready, it was connected to the modules (as seen in Figure 3.1), installed on the system and tested thoroughly. The results were positive and the installation functioned as desired for several productions. Figure 3.1 - Prototype 1 connection diagram 3.2 Prototype 2 – Samba The Samba PLC was used to prototype the base functionality of the system. Initially it was unknown whether this unit would suffice for the project and given the portability of the program over to the V350, development on this unit was considered to be a good start. 28 Samey, the official Icelandic distributor for Unitronics, loaned the PLC and several components for the prototyping. Thanks to this, the evaluation of the unit was cost-free and permitted this project to carry on with minimum expenses. 3.2.1 Navigation panels The UI is displayed on the PLC’s HMI. The different screens have been designed along the programming of the different parts of the system. The main screen offers the user to log-in via a password field, gives a brief message of the current status of the system and displays the current time (Figure 3.2). While the HMI is displaying any other screen, a 60s countdown triggers the return to this screen. This timer is reset every time the display is touched. Figure 3.2 - HMI main screen Once the correct password is entered, the waiting tank display is presented (Figure 3.3). There, the current level of the tank is shown and it is possible to activate the filling process. A timer can be seen, which indicates how long the tank has been full. The arrows on the top corners permit returning to the main screen or advancing to the next one. The next panel is the concentration and purification display (Figure 3.4). There, a graphical representation of the recirculation system is found. A bar indicator beneath the inlet pump shows the current power level sent to the pump controller. The two valves in the inlets and the recirculation pump change colors depending on their state (on/off). The two gauges give realtime feedback on the pressure sensors. Lastly, the LED-style bar above the system presents the real-time flow rate on the outlet. Figure 3.3 - HMI waiting tank screen Figure 3.4 - HMI concentration screen When pressing the gauges and/or the LED bar, it is possible to access the relevant trends (Figure 3.5) which show a history of the different measurements over a period of time. From that panel, the configuration menu for these sensors will be accessible to adjust the desired pressure levels and flow limits. Figure 3.5 - HMI trend 3.2.2 Internet connectivity To connect the PLC to the internet, a V100-17-ET2 Ethernet module is required. Its price is 11.813 ISK + VAT and it is easily installed. Its functionality has been tested by configuring the PLC under a household’s internet connection and accessing it from a remote location. By using the Remote Operator software, the PLC responds with an almost unnoticeable lag. 29 Remote programming through Visilogic has also been tested, with flawless results. This gives the possibility of updating the software in the future without requiring to access the Hellisheiði power plant. To adapt the PLC to any other network, the internal IP of the PLC needs to be configured as required by the router, and the port must be forwarded to it. This can be done easily once a modem is purchased for this project. Several phone companies in Iceland offer wireless internet modems and data plans, and it is left to geoSilica to find the most suitable one (given that any would work with the system). The only requirement is to ensure the modem has a static IP, what might present an additional cost in some cases. Two companies, Nova and Vodafone, were approached to enquire about the availability of these services and service costs. Both offer very similar modems, with Nova being a slightly more economic purchase. Vodafone did not offer any data plans under 5GB of download, what seems excessive given the connection speed in the Hellisheiði area and the minimalistic data transfers of Remote Operator. Additionally, Nova offered the static IP service at no cost, while Vodafone had a subscription fee for such service. The author thus recommends to contract Nova’s services for the system at hand, although ultimately it is geoSilica’s choice to make, as previously stated. Security The system needs to be protected from unwanted remote access. To accomplish this, several security measurements are put into practice. For the user to connect to the remote station, both the static IP address of the system and the PLC name (case sensitive) must be known, being the later chosen by the administrator and hardcoded into the program. These are then input into Remote Operator for establishing a connection. Once connected to the PLC, the user is presented with the login screen where the current system status is displayed. To be able to access any other screen, the correct password needs to be typed by clicking on a virtual keypad which pops upon tapping the password field there displayed. After the user gains access to the system and is done with it, he may lock the PLC by navigating back to the login screen. The system will also revert automatically to the login screen if no touchpad activity is present in 60 seconds. 3.2.3 Phase 1 - Waiting tank The waiting tank functionality is fully implemented. Upon request and as long as the tank is not already full, the inlet valve will open allowing water to flow in. Once the level reaches the top sensor, a timer runs for 60s at which end the inlet closes. This is used for ensuring the sensor is fully submerged once the water is still, for water turbulences will create waves on the surface which will prematurely activate the sensor. 30 Thus after the sensor detects water uninterruptedly for 60s, the inlet valve closes and a dedicated timer runs which marks the time the tank has been full. This timer will be userconfigurable in the future, permitting geoSilica to adjust the time the water should rest before being processed. When the timer reaches zero, a marker is set indicating the water has waited for a long enough period (waiting ready bit). With this bit set, the concentration process may begin. The waiting ready bit is reset once the lower sensor stops detecting water. For an easy understanding of this process, Figure 3.6 shows the logic flow diagram upon which it was designed. Figure 3.6 - Waiting tank process logic diagram This process has been created in duplicate, meaning that two waiting tanks may be used in the production. Although the rest of the program takes into consideration only the first tank, a second tank can thus be effortlessly added, what allows for a larger production and/or reduced waiting time between batches [29]. 3.2.4 Phase 2 – Concentration The concentration process is still in development. The interface has been designed (as seen in a previous subchapter) and the logic is in development. The PID and autotune functions for the pump are fully researched and implementing them should not present an issue. The reading of the analog pressure sensors is programmed and linearization of the values implemented. The linearized values are displayed in the real-time gauges on the display. The sensors have not been yet tested, but their functionality and connection method are fully researched. 31 The reading from the flow sensor is not yet developed. It has been determined that the readings should be transferred through the serial communications port, as explained in the following subchapter. Figure 3.7 presents the flow diagram upon which this part of the system is being designed. Figure 3.7 - Concentration process logic diagram The alert system’s logic is also left to program. The different pressure levels around the filter, the pressure difference between the filter’s outlets and the possible issues regarding flow rates have to be monitored and accounted for. The different actions which should outcome from these issue diagnostics need to be programmed as well, such as system hold, filter cleaning and e-mail notifications. Altogether, the remaining development of this phase is likely to be one of the larger tasks left to program. It is also a crucial part of the system, which requires attention to details and constant testing to ensure it functions according to the necessities. 3.3 Remaining Development As seen in chapter 2, the Samba PLC has been diagnosed to be not appropriate for this project. The Vision series V300-35-RA22 has been chosen as the most adequate and costeffective solution thus a new prototype needs to be built based on this platform. All the development made on the Samba can be effortlessly imported into a V350 project, for both PLCs are fully compatible within Visilogic. Therefore, development of this final prototype may continue from the current point it is in. 32 A full connection diagram for this new prototype can be found in Appendix G, which shows how the main phases of the system (waiting tank, concentration and purification) can be developed without the need of an expansion module. The diagram takes into account the level switch and solenoid valve required for the evacuation process. The implementation of the pump is not accounted for, since it is not decided whether it will be controlled through an analog output or relay. Regardless, one port of each remains available on the PLC for whichever case. To fully develop the design presented in this thesis (including filter cleaning bypass and evacuation system), an additional set of relays is necessary. Two expansion modules are available solely for this purpose: IO-RO8: This module adds eight relays to the V350 PLC. Its price is 13.004 ISK + VAT. IO-RO16: This module adds 16 relays to the V350 PLC. Its price is 17.578 ISK + VAT. To implement the filter bypass, six additional electronic valves are to be controlled. Therefore, the IO-RO8 expansion module is diagnosed to be sufficient to complete the system’s functionality. As mentioned in chapter 2.3, an expansion adapter is required to connect any expansion modules to the PLC. The EX-A2X expansion adapter is chosen for this purpose, which allows up to 8 expansion modules to be connected to the PLC [5]. Its price is 8.737 ISK + VAT, which added to the price of the IO-RO8 totals in a sum of 21.741 ISK + VAT. 3.3.1 Serial communications – flow sensor As explained in chapter 2.4.3, the LRF-2000M supports serial communications through the RS-485 connector. The design shown in Appendix G takes advantage of this communications port to retrieve the current flow of the system as well as read and reset the meter’s totalizers and gather data from the pressure sensor connected to the analog input of the meter. The LRF-2000M user manual includes a table of registries to be used in the communications, thus once the Modbus protocol is configured on the PLC, accessing the relevant data should be a simple process. 3.3.2 Phase 3 – Purification The rinsing process happens within the same recirculation system as the concentration. Because of this, both processes are quite similar and many of the features programmed in phase 2 can be reused in phase 3. The greatest difference between the two is the fact that the inlet is controlled through a solenoid valve instead of a motor controlled by PID. Although the inlet’s pressure is adjusted with a diaphragm valve, it is possible that variations in the mains’ pressure would affect the pressure after the diaphragm. Therefore, the pressure in the system needs to be monitored, closing the solenoid valve if necessary. 33 A logic flow diagram for this system can be seen in Figure 3.8, upon which the development will be based on. Figure 3.8 - Purification process logic diagram The development of this part of the system should not require much effort, as long as the concentration phase is mostly developed beforehand. 3.3.3 Evacuation The evacuation process is fairly simple; once the purification has been completed, the outlet valve may be opened and the drainage valve activated until the level sensor there present determines the processing tank to be empty. Since it is not decided whether the outlet will be connected to a large container tank, which could hold several batches of product, or a smaller one for one batch at a time, the method of evacuation has not been fully designed. It is possible to implement a user-activated evacuation protocol, as well as an automatic one which could keep track of the number of batches produced, making sure the container is not overfilled. In the latter case, the operator would reset the batch count upon emptying/replacing the storage tank. This part of the development presents a minimal amount of programming effort and can be quickly implemented at any stage of development. 34 3.3.4 Filter cleaning bypass One of the most complex and challenging parts of development is the filter cleaning bypass system. This process should be activated whenever the filter is diagnosed to be clogged by monitoring the different pressures and flow rate in the recirculation system. The logic involving cleaning and rinsing the filter needs to be recursively repeated until optimal measurements from the sensors are achieved. Also, the filter needs to be thoroughly rinsed before engaging once again into production to avoid the contamination of the final product. The filter cleaning bypass is an optional feature of the system, which can be left for development once the rest of the design is completed. On the meantime, the filter can be monitored by the alert system and the process may be paused until the operators clean it by hand. The logic design of this part of the system is thus left for future stages of development, which also implies a lower cost of development while achieving all of the requirements. 3.3.5 Batch mode Once all individual parts of production are automatized, an option for batch production needs to be set. This option will begin with filling the waiting tank, followed by concentrating, rinsing and possibly evacuating the product. The number of batches should be configurable by the operator (especially when the storage tank for the final product is large enough for holding several batches), allowing for a constant production with minimal human interaction. The filter cleaning bypass is highly recommended for being able to perform several batches in a row; otherwise an operator would have to perform such operation whenever the necessity arises. It is estimated that the development of this stage would be trouble-free and easy to implement, for the different subroutines it handles are programmed in earlier stages. 3.3.6 Electrical enclosure A priority part of the project involves the design of the air-filtered electrical enclosure to protect the electrical components from hydrogen sulfide corrosion, as stated in chapter 2.6. Although the basic design has been created, the choice of enclosure, filter format and filtering material remains undone. Pricing for the different components is yet unknown and more research is needed into the required air-flow rate, necessary filtering material volume/surface of contact and longevity of the air filter. This part of the project needs to be completed preferably before installing the system in Hellisheiði, as to avoid damage to the electrical components which compose the system. 35 It is emphasized that the cost of research and development of the filtrated electrical enclosure is fully justified by the fact that without it, the system would have a greatly reduced lifespan resulting into higher long-term costs. 36 4 Cost estimate This chapter summarizes the cost involved on the development of the different sections of the project. The prices for the various components, cost estimates for the parts with unclear prices and estimated development times with the relating hourly rates are added together, giving a notion of the overall project cost at the different stages. The tables in the following subchapters present this information. Prices marked “(est.)” are estimates considered. 4.1 Waiting tank The waiting tank logic is fully developed in the prototype built during the project presented in this thesis, therefore the only cost involved with this part of development is the installation itself. Table 4.1 presents the prices of the components required for this section of the project. Table 4.1 - Waiting tank component cost estimate Component Unit price Quantity Total price Description (ISK, no VAT) (ISK, no VAT) V350-35-RA22 79.765 1 79.765 PLC, PSU available at geoSilica MHF1521NG1HSM 27.787 2 55.574 Level sensors M12x1 4-pin 2.260 connector 2 EV220B 20.000 (est.) 1 Solenoid coil 5.000 (est.) 1 Total 4.520 Level sensor cable 20.000 2/2 valve 5.000 To actuate valve 164.859 4.2 Concentration and purification The concentration phase is in early stages of development, while the purification phase is not programmed at all (although both share much of the same code). Being one of the most complex stages to program and requiring extensive testing, it is estimated that two months of full-time work will be necessary to complete this part of the project. Table 4.2 presents an estimated workforce cost. 37 Table 4.2 - Concentration and purification workforce cost estimate Reason Hourly cost (ISK) Hours Total (ISK) 5.000 330 1.650.000 Workforce Table 4.3 sums up the component’s prices. The components already available at geoSilica (recirculation pump, three-phase relay, motor controller) are not taken into consideration. Table 4.3 - Concentration and purification component cost estimate Component Unit price Quantity Total price Description (ISK, no VAT) (ISK, no VAT) LRF-2000M 86.421 1 Modbus cable 2.000 (est.) 1 PM2653 88.489 2 Sensor adapter 15.903 2 31.806 Pressure sensor adapt. CYJV2 3.000 (est.) 2 6.000 Pressure sensor wire EV220B 20.000 (est.) 2 40.000 2/2 valve Solenoid coil 5.000 (est.) 2 10.000 To actuate valve Total 86.421 Flow meter 2.000 Serial com. cable 176.978 Pressure sensors 353.205 4.3 Evacuation The evacuation phase is composed of a simple design with few components. Given the simplicity of the programming, the development is estimated to last for two working days. Table 4.4 presents the estimated workforce cost. Table 4.4 - Evacuation workforce cost estimate Reason Workforce Hourly cost (ISK) Hours Total (ISK) 5.000 16 80.000 Table 4.5 sums up the component’s prices. 38 Table 4.5 - Evacuation component cost estimate Component Unit price Quantity Total price Description (ISK, no VAT) (ISK, no VAT) MHF1521NG1HSM 27.787 1 M12x1 4-pin 2.260 connector 1 EV220B 20.000 (est.) 1 Solenoid coil 5.000 (est.) 1 Total 27.787 Level sensors 2.260 Level sensor cable 20.000 2/2 valve 5.000 To actuate valve 55.047 4.4 Filter cleaning bypass The filter cleaning bypass requires the construction of the pipe section which constitutes the second recirculation system, used exclusively for this purpose. The sourcing of the materials, machining and assembly are not part of the automation project itself thus it is not accounted for in the cost estimation. Given that the system can control any pump by the use of a relay (or analog output), the cost of such device is considered to be outside of the scope of this project; any suitable pump can be controlled with no modifications to the system here presented. The cost of development is substantial, given the complexity of the system and the frail nature of the filter. Nevertheless, most of the alerts involving pressure ranges should be programmed in the concentration phase, which are reusable on this one. Therefore, an estimated development time of one month is assigned to this phase. The cost involved can be seen in Table 4.6. Table 4.6 - Filter cleaning bypass workforce cost estimate Reason Workforce Hourly cost (ISK) Hours Total (ISK) 5.000 165 825.000 A summary of the cost of components can be seen in Table 4.7. Many of these are rough estimates which need to be further researched. 39 Table 4.7 - Filter cleaning bypass component cost estimate Component Unit price Quantity Total price Description (ISK, no VAT) (ISK, no VAT) EX-A2X 8.737 1 8.737 Local expansion adapter IO-RO8 13.004 1 13.004 8-relay expansion module PM2653 88.489 1 88.489 Pressure sensor Sensor adapter 15.903 1 15.903 Pressure sensor adapt. CYJV2 3.000 (est.) 1 3.000 Pressure sensor wire EV220B 20.000 (est.) 3 3-way valve 40.000 (est.) 3 Solenoid coil 5.000 (est.) 6 Total 60.000 2/2 valve 120.000 Rough estimated cost 30.000 To actuate valve 339.133 4.5 Batch mode The batch mode does not require any additional parts. Given the simplicity of the process, it is estimated that one working week would suffice to complete this stage once all previous ones are completed. Table 4.8 presents the estimated cost of development. Table 4.8 - Batch mode workforce cost estimate Reason Workforce Hourly cost (ISK) Hours Total (ISK) 5.000 40 200.000 4.6 Electrical enclosure The electrical enclosure’s design and development is a delicate task. A suitable enclosure needs to be selected, with price ranges between 20.000 ISK to 50.000 ISK. The cost of the filter and filtering material is yet unknown. An estimate of 100.000 ISK is presumed, but all the factors left to research will greatly impact the initial cost. The level of maintenance required is unknown as well. 40 Development of the electrical enclosure should begin right away, for it is necessary in all stages of development. Considering the research required, calculations and building time, an estimate of three weeks of work is expected to bring this part to completion. Table 4.9 presents the estimated workforce cost involved in this process. Table 4.9 - Electrical enclosure workforce cost estimate Reason Hourly cost (ISK) Hours Total (ISK) 5.000 120 600.000 Workforce 4.7 Total cost summary If the project is to be brought to a full completion, the costs presented in the previous subsections must be added to contemplate the total expense of development. Table 4.10 presents all the workforce-related costs and sums them together. Table 4.10 - Total workforce cost estimate Workforce section Hourly cost (ISK) Hours Total (ISK) Concentration/purification 5.000 330 1.650.000 Evacuation 5.000 16 80.000 Filter cleaning bypass 5.000 165 825.000 Batch mode 5.000 40 200.000 Electrical enclosure 5.000 120 600.000 Total: 671 3.355.000 Table 4.11 presents all the components needed for the full project (with the exception of the electrical enclosure, air filter, and air drain and diaphragm valves) and adds their prices together. 41 Table 4.11 - Total component cost estimate Component Unit price Quantity Total price Description (ISK, no VAT) (ISK, no VAT) V350-35-RA22 79.765 1 79.765 PLC, PSU available at geoSilica EX-A2X 8.737 1 8.737 Local expansion adapter IO-RO8 13.004 1 13.004 8-relay expansion module LRF-2000M 86.421 1 86.421 Flow meter Modbus cable 2.000 (est.) 1 MHF1521NG1HSM 27.787 3 83.361 Level sensors M12x1 4-pin 2.260 connector 3 EV220B 20.000 (est.) 7 140.000 2/2 valve 3-way valve 40.000 (est.) 3 120.000 Rough estimated cost Solenoid coil 5.000 (est.) 10 50.000 To actuate valve PM2653 88.489 3 265.467 Pressure sensors Sensor adapter 15.903 3 47.709 Pressure sensor adapt. CYJV2 3.000 (est.) 3 9.000 Pressure sensor wire Total: 42 2.000 Serial com. cable 6.780 Level sensor cable 912.244 5 Discussion The art of automation is a complex one; when a given system needs to be upgraded, all relevant aspects must be well researched to ensure the process is carried in a straightforward fashion as to minimize the amount of issues encountered while developing the solution. When handed the project and its basic requirements, many aspects were overseen. For one, the problem regarding airborne hydrogen sulfide and its corrosive nature was unknown to geoSilica; this issue was found mostly by chance, when a salesman in Samey who had work experience in the power plant pointed it out. The discovery of this issue would most likely have happened at some point, but it could have been catastrophic otherwise. This taught a good lesson on the importance of researching the environmental conditions of the location where the control system is to be placed. Another breakthrough discovery was the realization of the lack of strong regulations for food processing systems in Iceland. Although the European law dictates the Icelandic rules, there seems to be a lack of specialists on the field which in turn makes it very troublesome to reach for advice and possibly results in many such systems not being up to current standards. Based on the information gathered during this part of the research, it seems though as the designer himself is solely responsible for ensuring the system is up to standards. A quality insurance contract signed by the designer appears to be required before such a system is put to operation. Given the level of responsibility involved, an official advisor should be offered by the regulatory body to assist on the creation of automated systems for food processing, in the author’s opinion. The development of a high quality system such as the one here presented, where the system to automatize is already built and in operation, presents complications when testing and debugging the setup. To ensure the automation system is fully functional by the time it is first used, a prototype system is indispensable. Otherwise development times would increase, given that the system would not be readily available at all times for experimenting. In the case of geoSilica, an old proof-of-concept system is available which may be used to test and improve the automation setup. In other situations, test devices could be required, such as analog I/O simulators, pressurized chambers, etc. This project has been an excellent educational one for the author, which has opened his eyes to a whole field of specialty that he finds exciting and rewarding. The experience and knowledge acquired will surely open a wide array of doors in the future. 43 44 6 Conclusion The system design has been thoroughly reviewed and approved by the end users. The control logic is robust and fully accomplishes the requirements of the production process. The Samba prototype has proven the capabilities of the Unitronics family of PLCs and has aided on determining the most suitable model for this system. This has also allowed the author to familiarize himself with the programming environment, what in turn allows for a faster development in the future. Few components are left to be sourced while few others need to have their prices confirmed. Nevertheless, the cost estimate is presumed to be accurate enough as to give a good idea of the budget required for the different stages. The time required to complete the project is a very rough estimate and costs involving workforce are listed only as a reference. If the project is to be completed, it is possible to lower costs by arranging different payment methods than the one presented in this report (freelance engineer). Regardless, the effort placed in minimizing the cost of components allows for more resources to be placed on workforce, what seems to constitute the greatest cost of development. Overall, the project is now well defined with schematics ready, most components selected and the programming in development. A solid project design is delineated, making it possible to commence the construction of the system. 45 46 References [1] X. Þ. T. Landa, "Research and analysis for the automation of silica production," n/a, Reykjanesbær, 2014. [2] Umhverfisstofnun, "Brennisteinsvetni," n/a. [Online]. Available: http://www.ust.is/einstaklingar/loftgaedi/brennisteinsvetni/. [Accessed 29 April 2015]. [3] B. V. Salas, M. S. Wiener, R. Z. Koytchev, G. L. Badilla, R. R. Irigoyen, M. C. Beltrán, N. R. Nedev, M. C. Alvarez, N. R. Gonzalez and J. M. B. Rull, "Copper Corrosion by Atmospheric Pollutants in the Electronics Industry," International Scholarly Research Notices, vol. 2013, no. n/a, pp. 1-7, 2013. [4] Koch Membrane Systems, Inc., "Romicon TM 3" Hollow Fiber Cartridges," Koch Chemical Technology Group, LLC, Wilmington, Massachusetts, 2014. [5] Unitronics, "EX-A2X I/O expansion module adapter," December 2009. [Online]. Available: http://www.unitronics.com/Downloads/Support/IO%20and%20COM%20Modules/I O%20Expansions/EX-A2X_SPEC_12-09.pdf. [Accessed 30 April 2015]. [6] Unitronics, "EX-RC1 remote I/O adapter," May 2008. [Online]. Available: http://www.unitronics.com/Downloads/Support/IO%20and%20COM%20Modules/I O%20Expansions/EX-RC1_SPEC_05-08.pdf. [Accessed 30 April 2015]. [7] UnitronicsWebinars, "PLC Training: Remote I/Os via EX-RC1 | UniLogic for UniStream by Unitronics," September 2013. [Online]. Available: https://www.youtube.com/watch?v=APnEBvSqhks. [Accessed 04 May 2015]. [8] GSM Arena, "EDGE (Enhanced Data for Global Evolution)," n/a. [Online]. Available: http://www.gsmarena.com/glossary.php3?term=edge. [Accessed 04 May 2015]. [9] Phonearena, "Which carrier offers the fastest mobile data and coverage: 4G / 3G speed comparison," n/a. [Online]. Available: http://www.phonearena.com/news/Whichcarrier-offers-the-fastest-mobile-data-and-coverage-4G--3G-speedcomparison_id53828. [Accessed 04 May 2015]. [10] Various, "NPN vs. PNP inputs," control.com, 19 September 2001. [Online]. Available: http://control.com/thread/1000870647. [Accessed 09 May 2015]. [11] W. Kwaśny and A. Błaźejewski, Mechatronics - Module 5: Mechatronic Components, Wroclaw: Wroclaw University of Technology, 2007. 47 [12] Deeter Electronics Inc., "Float Switches & Liquid Level Sensors," The Deeter group, 2015. [Online]. Available: http://www.deeterelectronicsinc.com/products/floatswitch-liquid-level-sensors-overview. [Accessed 05 May 2015]. [13] Sick AG, "Level sensors," Sick AG, 2015. [Online]. Available: http://www.sick.com/group/EN/home/products/product_portfolio/instrumentation/P ages/level_sensors.aspx. [Accessed 05 May 2015]. [14] Sick AG, "MHF15," Sick AG, 2015. [Online]. Available: http://www.sick.com/instruments/EN/home/products/level_sensors/Pages/MHF15.a spx. [Accessed 15 May 2015]. [15] IFM Electronic Ltd., "PM2653 pressure sensors," IFM Electronic Ltd., 2015. [Online]. Available: http://www.ifm.com/products/uk/ds/PM2653.htm. [Accessed 12 May 2015]. [16] Unitronics, "Vision OPLC technical specifications," July 2013. [Online]. Available: http://www.unitronics.com/Downloads/Support/Technical%20Library/Vision%20H ardware/Vision350%20Specifications/V350-35-RA22_J_TECH-SPEC_07-13.pdf. [Accessed 12 May 2015]. [17] Longrun industrial instrument CO.,LTD, "Ultrasonic flow meter user manual - Type: LRF-2000M," n/a. [Online]. Available: http://www.ultrasonicscn.com/Download/User-manual/LRF2000M%20User%20Manual.pdf. [Accessed 29 April 2015]. [18] Longrun industrial instrument CO.,LTD, "Ultrasonic Flow Module / LRF-2000M," Longrun industrial instrument CO.,LTD, n/a. [Online]. Available: http://www.ultrasonicscn.com/Products/Ultrasonic-flow-meter/LRF-2000M.html. [Accessed 07 May 2015]. [19] Innanríkisráðuneytið - Reglugerðasafn, "Reglugerð um neysluvatn," 2008. [Online]. Available: http://www.reglugerd.is/reglugerdir/allar/nr/536-2001. [Accessed 15 May 2015]. [20] Danfoss A/S, Data sheet - Servo-operated 2/2-way solenoid valves - Type EV220B 15 - EV220B 50, n/a: Danfoss A/S, 2015. [21] Vísindavefurinn Háskóli Íslands, „Hvað er það helst sem getur spillt neysluvatninu og hvernig komum við í veg fyrir að það gerist?,“ 2012. [Á neti]. Available: http://www.visindavefur.is/svar.php?id=62801. [Skoðað 15 May 2015]. [22] A. Andersen, F. Fontenay, L. R. Hilbert and F. Technology, "Corrosion of brass in drinking water with high alkalinity," EUROCORR, Denmark, 2011. [23] Wellington Rubber Co. Ltd., "Material safety data sheet," Material safety data sheet, Wellington, 2012. 48 [24] Stutzman Services, Inc., "Introduction to constant pressure systems," Stutzman Services, Inc., 2015. [Online]. Available: http://www.stutzmanservices.com/en/about-news-ssu_constantpressure.html. [Accessed 06 May 2015]. [25] UnitronicsWebinars, "Webinar PID and autotune," 3 April 2013. [Online]. Available: https://youtu.be/EqEqEdOx-x8. [Accessed 06 May 2015]. [26] US Building Laboratories Inc., "Filtration machines," US Building Laboratories Inc., 2009. [Online]. Available: http://usbuildinglabs.com/filtration-machines.html#. [Accessed 12 May 2015]. [27] Purafil, Inc., "Purafil," Purafil, Inc., 2015. [Online]. Available: www.purafil.com. [Accessed 12 May 2015]. [28] Purafil, Inc., "Product bulletin for purafil odorcab ultra media," 2015. [Online]. Available: http://www.purafil.com/wp-content/uploads/2015/01/Purafil-OdorcarbUltra-Media-Bulletin.pdf. [Accessed 12 May 2015]. [29] B. Pálsson and D. Ásgeirsson, Interviewees, Various meetings with geoSilica's staff. [Interview]. 2015. [30] IFM Electronic GMBH, „PM2653,“ 26 March 2009. [Á neti]. Available: http://tds.ifmelectronic.com/tentacle/servlet/PdfRequestServlet?styleId=datasheet2_xhtml&partN umber=PM2653&pg=500&site=uk&lang=ENGB&locale=en_GB. [Skoðað 15 May 2015]. 49 12 11 10 9 8 7 6 5 4 3 2 1 8 7 6 5 4 3 2 1 Task Mode Task Mode 27 days 15 days 44 days 21 days 14 days 9 days 15 days 35 days Duration Research & design Flow meter instalation Zelio project PLC programming GPRS communications HMI display Level sensors Valve control Set-up electronics box Selection of box Installation Report writing Task Name Research on PLC and sensors Design of system Programming Core program Module programming Error-check & reporting Testing & improving Report writing Task Name Finish 74 days 10 days 5 days 31 days 5 days 25 days 25 days 25 days 4 days 3 days 1 day 24 days Duration Mon 5.1.15 Fri 23.1.15 Tue 3.2.15 Fri 20.3.15 Fri 20.3.15 Thu 26.3.15 Thu 26.3.15 Thu 26.3.15 Tue 21.4.15 Tue 21.4.15 Fri 24.4.15 Sun 26.4.15 Start Xabier Þór Xabier Þór Jun '15 May '15 Apr '15 Mar '15 Feb '15 Jan '15 29 5 12 19 26 2 9 16 23 2 9 16 23 30 6 13 20 27 4 11 18 25 1 Fri 20.3.15 Mon 2.2.15 Sun 8.2.15 Mon 20.4.15 Wed 25.3.15 Mon 20.4.15 Mon 20.4.15 Mon 20.4.15 Sat 25.4.15 Fri 24.4.15 Sat 25.4.15 Wed 20.5.15 Finish Xabier Þór Xabier Þór May 2015 April 2015 March 2015 February 2015 January 2015 1 4 7 1013161922252831 3 6 9 121518212427 2 5 8 111417 20232629 1 4 7 10131619222528 1 4 7 10131619222528 Mon 5.1.15 Sat 31.1.15 Sat 31.1.15 Sun 15.2.15 Mon 16.2.15 Tue 31.3.15 Mon 16.2.15 Sun 8.3.15 Mon 9.3.15 Sun 22.3.15 Mon 23.3.15 Tue 31.3.15 Tue 31.3.15 Wed 15.4.15 Thu 16.4.15 Wed 20.5.15 Start Original time plan: ID ID Appendix A: Project time plan Revised time plan (18-03-2015): 51 52 Appendix B: MHF15 data sheet extracts 53 54 55 56 Appendix C: PM2653 datasheet 57 58 59 60 Appendix D: EV220B valve datasheet 61 62 63 64 65 66 67 68 69 70 71 72 73 74 Appendix E: RM-CL55BD user guide 75 76 Appendix F: Zelio program 77 78 Appendix G: V350 connection diagram 79