1
32
Design of a low-cost Photon Height Analyzer for a Mössbauer Spectroscopy
5
4
Amplitude (V)
3
2
1
0
-1
0
500
1000
1500
2000
sample number
2500
3000
3500
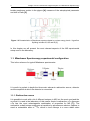
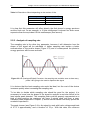
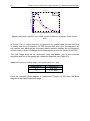
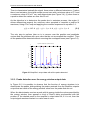
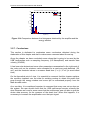
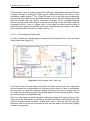
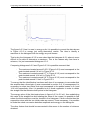
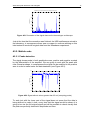
Figure 3.3 An example (some packs of 1024 points) of the previous position vector
spread out
3.2.2. Peaks detection over amplifier’s output data
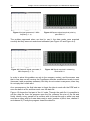
To understand the signal shape obtained from the amplifier’s unipolar output, it could
be observed Figure 3.3. There, it is shown that the peak consist in a fast increment of
voltage (from 2 µs until 6µs maximum), followed by a negative near-Gaussian peak,
which allow us to obtain information about the dead time.
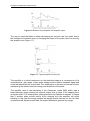
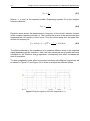
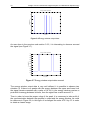
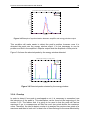
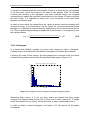
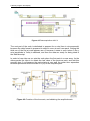
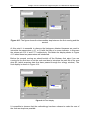
The MatLab code pretends to find the position and amplitude value of the positives
peaks. In order to know how to detect the positives peaks it is essential to know their
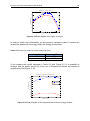
features, therefore the data will be zoomed to obtain some key parameters (see
Figure 3.4).
Amplifier's output data
0.04
Amplitude (V)
0.03
0.02
0.01
0
-0.01
2.61
2.615
2.62
2.625
2.63 2.635
# of point
2.64
2.645
2.65
2.655
4
x 10
Figure 3.4 Signal without values greater than 50 mV (excepting peaks).