1
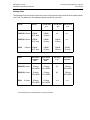
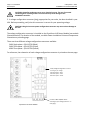
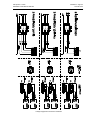
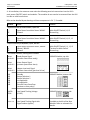
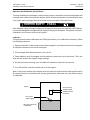
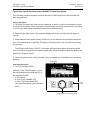
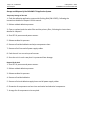
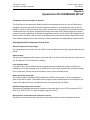
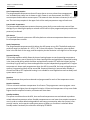
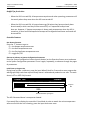
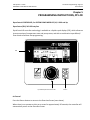
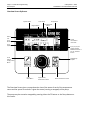
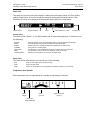
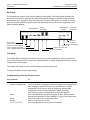
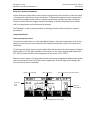
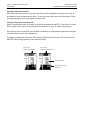
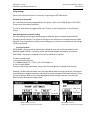
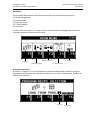
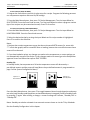
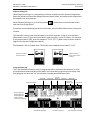
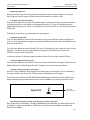
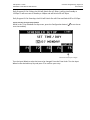
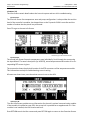
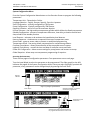
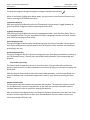
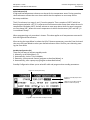
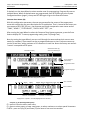
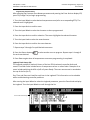
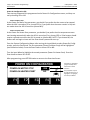
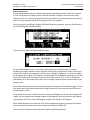
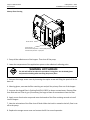
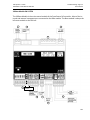
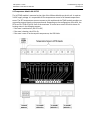
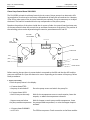
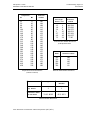
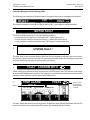
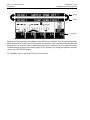
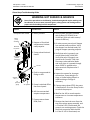
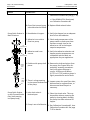
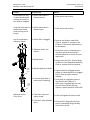
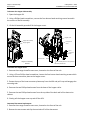
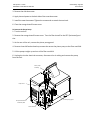
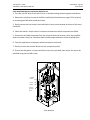
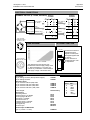
ITW Dynatec c. 2012
DYNAMELT S ASU Manual #20‐59P‐LCD
Page 5‐4 Controller Programming
Revised 4/12
Bar‐Graphs
The temperature status of each zone is shown by a bar‐graph. A solid bar‐graph indicates that
the temperature zone is activated. An outlined bar‐graph indicates a temporarily de‐activated
temperature zone. A question mark indicates that the zone's RTD sensor is not valid. An exclam‐
ation mark inside a solid bar‐graph means that the temperature of the zone is significantly out‐
side its setpoint window.
Active Zones
Non‐Active
Zones
(”solid”
bar‐graphs)
(”outlined”
bar‐graphs)
Zone has
no sensor
Zone is near setpoint
Zone is cold
Zone has a sensor fault
Zone is over‐heating
Zone is cold
Zone is at lower tolerance
Zone is just under setpoint
Zone is exactly at setpoint
Zone is slightly above setpoint Scan Mode
Scan Mode allows the operator to watch the currently active temperature zones scroll one at a
time on the Overview Screen. Each zone is displayed with its name, programmed setpoint, actual
temperature and bar graph.
To activate Scan Mode: On the Overview Screen, push the input knob.
To stop Scan Mode: Turn the input wheel.
To Navigate Away from the Overview Screen
Press This Button
System Configuration
Menu
Pump
Return
F1, F2, F3, F4, F5
To:
Go to the System Configuration Menu to program the temperature
unit, language, setpoint limitation, hi/ low tolerance, setback
temperature, level control, heat‐up sequence, pump enable
temperature, access code, temperature offset, customer
zone names, power‐on configuration or view the logbook.
Go to the Main Menu screen to program recipes, set‐back mode,
keypad locking and the 7‐day scheduler or to go to the Help Screen
Go to the Pump screen to program pump
Return to the previous screen
Go to the temperature zones (use as shortcuts)