1
Caution
Do not exceed the operating input power, voltage, and current
level and signal type appropriate for the instrument being used, refer to
your instrument's Operation Manual.
Electrostatic discharge(ESD) can damage the highly sensitive
microcircuits in your instrument. ESD damage is most likely to occur as
the test fixtures are being connected or disconnected. Protect them from
ESD damage by wearing a grounding strap that provides a high
resistance path to ground. Alternatively, ground yourself to discharge any
static charge built-up by touching the outer shell of any grounded
instrument chassis before touching the test port connectors..
注意
過剰な入力電力、電圧、電流および測定器の使用する信号の種類に注
意してください。詳しくは測定器の機能解説書を参照してください。
計測器には、静電気による放電によって破壊される恐れのある電子回
路が含まれています。これらの静電破壊は、多くの場合テストフィクスチャ
の接続、取り外し時に発生します。測定器を静電気による破壊から守るため
に、グランド・ストラップを使用して体を接地してください。あるいは、テ
に、グランド
・ストラップを使用して体を接地してください。あるいは、テ
ストポートコネクタに触る前に、接地された測定器の筐体などに触れて静電
気を放電してください。
4291B
Safety Summary
When you notice any of the unusual conditions listed below, immediately
terminate operation and disconnect the power cable.
Contact your local Agilent Technologies sales representative or
authorized service company for repair of the instrument. If you continue
to operate without repairing the instrument, there is a potential fire or
shock hazard for the operator.
n Instrument operates abnormally.
n Instrument emits abnormal noise, smell, smoke or a spark-like light
during the operation.
n Instrument generates high temperature or electrical shock during
operation.
n Power cable, plug, or receptacle on instrument is damaged.
n Foreign substance or liquid has fallen into the instrument.
使用上の安全について
以下のような異常が見られたときは、直ちに使用を中止して電源プラグを抜き、最寄り
の当社セールス・オフィス
の当社セールス・オフィスまたは当社指定のサービス会社に連絡して修理を受けて下さ
・オフィスまたは当社指定のサービス会社に連絡して修理を受けて下さ
い。そのまま使用を続けると、火災や感電のおそれがあります。
n
正常な動作をしない。
n
動作中に異音、異臭、発煙あるいはスパークのような光が発生した。
n
使用時に異常な高温や電気ショックを感じた。
n
電源コード、電源プラグ、電源コネクタが損傷した。
n
製品内に異物、液体などが入った。
Agilent 4291B RF Impedance/Material
Analyzer
Operation Manual
Agilent Part No. 04291-90040
Printed in Japan September 2002
Fifth Edition
Notice
The information contained in this document is subject to change
without notice.
This document contains proprietary information that is protected by
copyright. All rights are reserved. No part of this document may be
photocopied, reproduced, or translated to another language without
the prior written consent of the Agilent Technologies.
Agilent Technologies Japan, Ltd.
Component Test PGU-Kobe
1-3-2, Murotani, Nishi-ku, Kobe-shi,
Hyogo, 651-2241 Japan
c Copyright 1997, 1998, 1999, 2001, 2002
Agilent Technologies Japan, Ltd.
For additional important information about serial numbers, read
\Serial Number" in Appendix A.
Manual Printing History
The manual's printing date and part number indicate its current
edition. The printing date changes when a new edition is printed.
(Minor corrections and updates that are incorporated at reprint do not
cause the date to change.) The manual part number changes when
extensive technical changes are incorporated.
December 1997 : : : : : : : : : : : First Edition (part number: 04291-90020)
September 1998 : : : : : : : : Second Edition (part number: 04291-90030)
December 1999 : : : : : : : : : : : Third Edition (part number: 04291-90030)
January 2001 : : : : : : : : : : : Fourth Edition (part number: 04291-90030)
September 2002 : : : : : : : : : : Fifth Edition (part number: 04291-90040)
MS-DOS R is a registered trademark of Microsoft Corporation.
APC-7 R is a registered trademark of Bunker Ramo Corporation.
iii
Safety Summary
The following general safety precautions must be observed during all
phases of operation, service, and repair of this instrument. Failure to
comply with these precautions or with speci c WARNINGS elsewhere
in this manual may impair the protection provided by the equipment.
In addition it violates safety standards of design, manufacture, and
intended use of the instrument.
The Agilent Technologies assumes no liability for the customer's
failure to comply with these requirements.
Note
4291B comply with INSTALLATION CATEGORY II and POLLUTION
DEGREE 2 in IEC1010-1. 4291B are INDOOR USE product.
Note
LEDs in 4291B are Class 1 in accordance with IEC825-1.
CLASS 1 LED PRODUCT
Ground The Instrument
To avoid electric shock hazard, the instrument chassis and cabinet
must be connected to a safety earth ground by the supplied power
cable with earth blade.
DO NOT Operate In An Explosive Atmosphere
Do not operate the instrument in the presence of ammable gasses or
fumes. Operation of any electrical instrument in such an environment
constitutes a de nite safety hazard.
Keep Away From Live Circuits
Operating personnel must not remove instrument covers. Component
replacement and internal adjustments must be made by quali ed
maintenance personnel. Do not replace components with the power
cable connected. Under certain conditions, dangerous voltages may
exist even with the power cable removed. To avoid injuries, always
disconnect power and discharge circuits before touching them.
DO NOT Service Or Adjust Alone
Do not attempt internal service or adjustment unless another person,
capable of rendering rst aid and resuscitation, is present.
DO NOT Substitute Parts Or Modify Instrument
Because of the danger of introducing additional hazards, do not
install substitute parts or perform unauthorized modi cations to the
instrument. Return the instrument to a Agilent Technologies Sales and
Service Oce for service and repair to ensure that safety features are
maintained.
iv
Dangerous Procedure Warnings
Warnings , such as the example below, precede potentially dangerous
procedures throughout this manual. Instructions contained in the
warnings must be followed.
Warning
Safety Symbols
Dangerous voltages, capable of causing death, are present in this
instrument. Use extreme caution when handling, testing, and
adjusting this instrument.
General de nitions of safety symbols used on equipment or in manuals
are listed below.
Instruction manual symbol: the product is marked
with this symbol when it is necessary for the user to
refer to the instruction manual.
Alternating current.
Direct current.
On (Supply).
O (Supply).
In position of push-button switch.
Out position of push-button switch.
Frame (or chassis) terminal. A connection to the
frame (chassis) of the equipment which normally
include all exposed metal structures.
This Warning sign denotes a hazard. It calls attention
to a procedure, practice, condition or the like, which,
if not correctly performed or adhered to, could result
in injury or death to personnel.
This Caution sign denotes a hazard. It calls attention
to a procedure, practice, condition or the like, which,
if not correctly performed or adhered to, could result
in damage to or destruction of part or all of the
product.
This Note sigh denotes important information. It
calls attention to a procedure, practice, condition or
the like, which is essential to highlight.
Axed to product containing static sensitive devices
use anti-static handling procedures to prevent
electrostatic discharge damage to component.
v
Typeface Conventions
Bold
Italics
Computer
4HARDKEYS5
NNNNNNNNNNNNNNNNNNNNNNNNNN
SOFTKEYS
vi
Boldface type is used when a term is de ned.
For example: icons are symbols.
Italic type is used for emphasis and for titles
of manuals and other publications.
Italic type is also used for keyboard entries
when a name or a variable must be typed in
place of the words in italics. For example:
copy lename means to type the word copy,
to type a space, and then to type the name of
a le such as file1.
Computer font is used for on-screen prompts
and messages.
Labeled keys on the instrument front panel
are enclosed in 4 5.
Softkeys located to the right of the LCD are
enclosed in .
NNNNN
Certi cation
Agilent Technologies certi es that this product met its published
speci cations at the time of shipment from the factory. Agilent
Technologies further certi es that its calibration measurements are
traceable to the United States National Institute of Standards and
Technology, to the extent allowed by the Institution's calibration
facility, or to the calibration facilities of other International Standards
Organization members.
Warranty
This Agilent Technologies instrument product is warranted against
defects in material and workmanship for a period of one year from
the date of shipment, except that in the case of certain components
listed in General Information of this manual, the warranty shall
be for the speci ed period. During the warranty period, Agilent
Technologies will, at its option, either repair or replace products that
prove to be defective.
For warranty service or repair, this product must be returned to a
service facility designated by Agilent Technologies. Buyer shall prepay
shipping charges to Agilent Technologies and Agilent Technologies
shall pay shipping charges to return the product to Buyer. However,
Buyer shall pay all shipping charges, duties, and taxes for products
returned to Agilent Technologies from another country.
Agilent Technologies warrants that its software and rmware
designated by Agilent Technologies for use with an instrument will
execute its programming instruction when property installed on that
instrument. Agilent Technologies does not warrant that the operation
of the instrument, or software, or rmware will be uninterrupted or
error free.
Limitation Of Warranty
The foregoing warranty shall not apply to defects resulting from
improper or inadequate maintenance by Buyer, Buyer-supplied
software or interfacing, unauthorized modi cation or misuse,
operation outside the environmental speci cations for the product, or
improper site preparation or maintenance.
No other warranty is expressed or implied. Agilent Technologies
speci cally disclaims the implied warranties of merchantability and
tness for a particular purpose.
vii
Exclusive Remedies
Assistance
viii
The remedies provided herein are buyer's sole and exclusive
remedies. Agilent Technologies shall not be liable for any direct,
indirect, special, incidental, or consequential damages, whether based
on contract, tort, or any other legal theory.
Product maintenance agreements and other customer assistance
agreements are available for Agilent Technologies products.
For any assistance, contact your nearest Agilent Technologies Sales
and Service Oce. Addresses are provided at the back of this manual.
How to Use This manual
The Operation Manual describes all functions accessed from the front
panel keys and softkeys. It also provides information on options and
accessories available, and the analyzer features.
Chapter 1 Introduction
Chapter 1 provides overviews of the system and main features of
the analyzer.
Chapter 2 Front and Rear Panel
Chapter 2 shows front and rear panel, test station, and test heads
with descriptions. This chapter also provides the information on
I/O port on the rear panel. The following chapter 3 through 8
provides front keys and softkeys reference. Each key and softkey
are categorized by the key blocks on the front panel keys.
Chapter 3 Active Channel Block
Chapter 3 describes 4Chan 15 or 4Chan 25 keys in the active channel
block, which is used to select channel.
Chapter 4 Entry Block
Chapter 4 describes the Entry Block, which is used to enter
parameter value to the analyzer or to change setting of the
analyzer.
Chapter 5 Measurement Block
Chapter 5 describes 4Meas5, 4Format5, 4Display5, 4Scale Ref5, 4Cal5,
4Bw/Avg5 keys in the measurement block, which is used to corneal
measurement capability of the analyzer. The equivalent circuit
function is also explained in this chapter.
Chapter 6 Stimulus Block
Chapter 6 describes 4Sweep5, 4Source5, 4Trigger5, 4Start5, 4Stop5, 4Center5,
and 4Span5 keys in the Stimulus Block, which is used to control the
stimulus source, sweep functions.
Chapter 7 Marker Block
Chapter 7 describes 4Marker5, 4Search5, 4Marker)5, 4Utility5 keys in the
marker block, which is used to control the marker function.
Chapter 8 Instrument State Block
Chapter 8 describes 4System5, 4Local5, 4Preset5, 4Copy5, 4Save5, and 4Recall5
keys in the Instrument State block. 4System5 key section describes
the capability to control channel-independent system function;
controlling the Agilent Technologies Instrument BASIC capability,
adjusting internal clock, turning beeper on/o , controlling, and
making limit line and executing limit testing. 4Local5 key section
describes the capability to control GPIB, 4Copy5 key section describes
making hard copy of the LCD image or listing measurement value or
the analyzer setting. 4Save5 and 4Recall5 section describes the storage
capability of analyzer and also provides the information on le
structure to be saved in a disk.
ix
Chapter 9 Analyzer Features
Chapter 10 shows analyzer's simpli ed block diagram and explains
the data processing ow in the analyzer.
Chapter 10 Options and Accessories Available
Chapter 10 provides the information on the options and accessories
available.
Chapter 11 Measurement Basic
Chapter 11 provides basic theory for impedance and material
measurements.
Chapter 12 4291B RF Impedance/Material Analyzer
Speci cations
Chapter 12 provides the speci cation of the 4291B.
Appendix A Manual Changes
Appendix A contains the information required to adept this manual
to earlier version or con gurations of the analyzer than the current
printing date of this manual.
Appendix B Input Range and Default Settings
Appendix B lists input ranges, preset values when 4Preset5 key is
pressed or the analyzer receives *RST command through GPIB, and
power ON default setting.
Appendix C Temperature Coecient Measurement
Appendix C describes a high temperature test head, a high
temperature xture, and temperature coecient measurement
software.
Error Messages
Error messages lists all error messages with an explanations for
each error.
x
Contents
1. Introduction
Introduction . . . . . . . .
System Overview . . . . . .
Analyzer features . . . . .
Front and Rear Panels . .
ACTIVE CHANNEL Block .
ENTRY Block . . . . . .
MEASUREMENT Block . .
STIMULUS Block . . . . .
MARKER Block . . . . . .
INSTRUMENT STATE Block
.
.
.
.
.
.
.
.
.
.
.
.
.
.
.
.
.
.
.
.
.
.
.
.
.
.
.
.
.
.
.
.
.
.
.
.
.
.
.
.
.
.
.
.
.
.
.
.
.
.
.
.
.
.
.
.
.
.
.
.
.
.
.
.
.
.
.
.
.
.
.
.
.
.
.
.
.
.
.
.
.
.
.
.
.
.
.
.
.
.
.
.
.
.
.
.
.
.
.
.
.
.
.
.
.
.
.
.
.
.
.
.
.
.
.
.
.
.
.
.
.
.
.
.
.
.
.
.
.
.
1-1
1-2
1-4
1-4
1-4
1-4
1-4
1-5
1-5
1-6
Front Panel . . . . . . . . . . . . . . . . . . . .
1. Front Panel Keys and Softkeys . . . . . . . . .
Softkeys that are Joined by Vertical Lines . . . .
Softkeys That Toggle On or O
. . . . . . . . .
Softkeys that Show Status Indications in Brackets
2. GPIB \REMOTE" Indicator . . . . . . . . . . . .
3. 4Preset5
. . . . . . . . .
4. Test Station Connectors . . . . . . . . . . . .
5. Floppy Disk Drive . . . . . . . . . . . . . . .
6. LINE Switch
. . . . . . . .
Screen display . . . . . . . . . . . . . . . . . . .
1. Active Channel
. . . . . . .
2. Measured parameter . . . . . . . . . . . . . .
3. Scale/Div
. . . . . . . . .
4. Reference Level
. . . . . . .
5. Marker Data Readout . . . . . . . . . . . . .
6. Level Monitor, Marker Statistics and Width Value
7. Softkey Labels
. . . . . . .
8. Pass/Fail
. . . . . . . . .
9. DC BIAS ON notation . . . . . . . . . . . . .
10. DC Bias Level
. . . . . . .
11. Instrument BASIC Status (Run Light)
. .
12. Stimulus Span/Stop Value . . . . . . . . . . .
13. CW Frequency
. . . . . . .
14. Stimulus Center/Start Value . . . . . . . . . .
15. OSC Level
. . . . . . . .
16. Status Notations
. . . . . . .
17. Equivalent Circuit Parameters . . . . . . . . .
18. External Reference
. . . . . .
19. Active Entry Area
. . . . . .
20. Message Area
. . . . . . .
21. Title
. . . . . . . . .
Rear Panel Features and Connectors . . . . . . . . .
.
.
.
.
.
.
.
.
.
.
.
.
.
.
.
.
.
.
.
.
.
.
.
.
.
.
.
.
.
.
.
.
.
2-1
2-2
2-2
2-2
2-2
2-3
2-3
2-3
2-3
2-3
2-4
2-4
2-5
2-5
2-5
2-5
2-5
2-5
2-5
2-6
2-6
2-6
2-6
2-6
2-6
2-6
2-7
2-7
2-7
2-8
2-8
2-8
2-9
2. Front and Rear Panel, Test Station, and Test Heads
Contents-1
1. External Reference Input . . . . . . . . . . .
2. Internal Reference Output . . . . . . . . . . .
3. External Program RUN/CONT Input . . . . . . .
4. I/O Port
. . . . . . . . .
5. Power
. . . . . . . . .
6 GPIB Interface
. . . . . . .
7. mini-DIN Keyboard Connector . . . . . . . . .
8. External Trigger Input . . . . . . . . . . . . .
9. Reference Oven Output (Option 1D5 Only) . . . .
10. Video Port
. . . . . . . .
11. Printer Port
. . . . . . . .
I/O Port . . . . . . . . . . . . . . . . . . . . . .
Test Station . . . . . . . . . . . . . . . . . . . .
1. Cable
. . . . . . . . .
2. Test Fixture Mounting Posts . . . . . . . . . .
3. Test Fixture Mounting Screws . . . . . . . . .
4. Test Head Connectors . . . . . . . . . . . . .
5. Heat Sink
. . . . . . . .
6. Test Station Mounting Screws . . . . . . . . . .
Test Heads . . . . . . . . . . . . . . . . . . . . .
1. Connectors
. . . . . . . .
2. APC-7 R Connector
. . . . . .
3. Knobs
. . . . . . . . .
High Impedance Measurement Test Head . . . . . .
Low Impedance Measurement Test Head (Option 012
only) . . . . . . . . . . . . . . . . . . . . .
High Temperature High Impedance Test Head (Option
013 only) . . . . . . . . . . . . . . . . . . .
High Temperature Low Impedance Test Head (Option
014 only) . . . . . . . . . . . . . . . . . . .
3. Active Channel Block
and 4Chan 25 . .
Active Channel . . .
Coupling Channels .
Stimulus Coupling
Marker Coupling .
4Chan 15
4. Entry Block
Numeric Keypad
Terminator Keys
Knob . . . . .
4*5 and 4+5 . . .
4Entry O 5 . . . .
4Back Space5 . . .
Contents-2
.
.
.
.
.
.
.
.
.
.
.
.
.
.
.
.
.
.
.
.
.
.
.
.
.
.
.
.
.
.
.
.
.
.
.
.
.
.
.
.
.
.
2-9
2-10
2-10
2-10
2-10
2-10
2-10
2-10
2-10
2-10
2-10
2-11
2-13
2-13
2-13
2-13
2-13
2-14
2-14
2-15
2-15
2-15
2-15
2-15
.
2-16
.
2-16
.
2-16
.
.
.
.
.
.
.
.
.
.
.
.
.
.
.
.
.
.
.
.
.
.
.
.
.
.
.
.
.
.
.
.
.
.
.
.
.
.
.
.
.
.
.
.
.
.
.
.
.
.
.
.
.
.
.
.
.
.
.
.
.
.
.
.
.
.
.
.
.
.
.
.
.
.
.
.
.
.
.
.
3-2
3-2
3-2
3-2
3-2
.
.
.
.
.
.
.
.
.
.
.
.
.
.
.
.
.
.
.
.
.
.
.
.
.
.
.
.
.
.
.
.
.
.
.
.
.
.
.
.
.
.
.
.
.
.
.
.
.
.
.
.
.
.
.
.
.
.
.
.
.
.
.
.
.
.
.
.
.
.
.
.
.
.
.
.
.
.
.
.
.
.
.
.
.
.
.
.
.
.
.
.
.
.
.
.
4-2
4-2
4-2
4-2
4-3
4-3
5. Measurement Block
. . . . . . . . . . . . . . . . . . . . . . . .
5-3
Impedance Measurement Menu . . . . . . . . . . .
5-9
Complex Impedance Measurement Menu . . . . . . . 5-11
Dual Parameter Menu . . . . . . . . . . . . . . . . 5-12
Impedance Fixture Menu (No option 002) . . . . . . 5-14
Impedance Fixture Menu (Option 002 only) . . . . . . 5-15
Permittivity Measurement Menu (Option 002 only) . . 5-17
Complex Permittivity Measurement Menu (Option 002
only) . . . . . . . . . . . . . . . . . . . . . . 5-19
Dual Parameter Menu (Dielectric Material
Measurement) . . . . . . . . . . . . . . . . . . 5-20
Dielectric Material Fixture Menu (Option 002 only) . . 5-21
Dielectric Material Size Menu (Option 002 only) . . . . 5-22
Permeability Measurement Menu (Option 002 only) . . 5-23
Complex Permeability Measurement Menu (Option 002
only) . . . . . . . . . . . . . . . . . . . . . . 5-25
Dual Parameter Menu (Magnetic Material Measurement) 5-26
Magnetic Material Fixture Menu (Option 002 only) . . 5-27
Magnetic Material Size Menu (Option 002 only) . . . . 5-29
4Format5 . . . . . . . . . . . . . . . . . . . . . . . .
5-30
Format Menu . . . . . . . . . . . . . . . . . . . . 5-30
User Trace Format Menu . . . . . . . . . . . . . . 5-31
4Display5 . . . . . . . . . . . . . . . . . . . . . . . .
5-32
Display Menu . . . . . . . . . . . . . . . . . . . 5-33
Display Allocation Menu . . . . . . . . . . . . . . 5-36
Data Math Menu . . . . . . . . . . . . . . . . . . 5-38
Equivalent Circuit Menu . . . . . . . . . . . . . . 5-40
Adjust Display Menu . . . . . . . . . . . . . . . . 5-42
Color Adjust Menu . . . . . . . . . . . . . . . . . 5-44
Label Menu . . . . . . . . . . . . . . . . . . . . 5-45
Title menu . . . . . . . . . . . . . . . . . . . . . 5-46
User Trace Display Menu . . . . . . . . . . . . . . 5-47
4Scale Ref5 . . . . . . . . . . . . . . . . . . . . . . .
5-49
Scale Reference Menu . . . . . . . . . . . . . . . 5-49
User Trace Scale Menu . . . . . . . . . . . . . . . 5-51
4Bw/Avg5 . . . . . . . . . . . . . . . . . . . . . . .
5-52
Averaging Menu . . . . . . . . . . . . . . . . . . 5-52
4Cal5 . . . . . . . . . . . . . . . . . . . . . . . . .
5-54
Calibration Menu . . . . . . . . . . . . . . . . . . 5-55
Fixture Compensation Menu (for Impedance
Measurement) . . . . . . . . . . . . . . . . . . 5-57
Fixture Compensation Menu (for Permittivity
Measurement) . . . . . . . . . . . . . . . . . . 5-58
Fixture Compensation Menu (for Permeability
Measurement) . . . . . . . . . . . . . . . . . . 5-59
Calkit Menu . . . . . . . . . . . . . . . . . . . . 5-60
cal kit . . . . . . . . . . . . . . . . . . . . . . 5-60
Compen Kit Menu (for Impedance Measurement
Fixture) . . . . . . . . . . . . . . . . . . . . 5-62
Compen Kit Menu (for Permittivity Measurement
Fixture) . . . . . . . . . . . . . . . . . . . . 5-64
Port Extension Menu . . . . . . . . . . . . . . . . 5-66
4Meas5
Contents-3
6. Stimulus Block
. . . . .
Sweep Menu .
List Menu . .
Segment Menu
4Source5 . . . . .
Source Menu .
4Trigger5 . . . . .
Trigger Menu .
.
.
.
.
.
.
.
.
.
.
.
.
.
.
.
.
.
.
.
.
.
.
.
.
.
.
.
.
.
.
.
.
4Start5 4Stop5 4Center5 4Span5 .
.
.
.
.
.
.
.
.
.
.
.
.
.
.
.
.
.
.
.
.
.
.
.
.
.
.
.
.
.
.
.
.
.
.
.
.
.
.
.
.
.
.
.
.
.
.
.
.
.
.
.
.
.
.
.
.
.
.
.
.
.
.
.
.
.
.
.
.
.
.
.
.
.
.
.
.
.
.
.
.
.
.
.
.
.
.
.
.
.
.
.
.
.
.
.
.
.
.
.
.
.
.
.
.
.
.
.
.
.
.
.
.
.
.
.
.
.
.
.
.
.
.
.
.
.
.
.
.
.
.
.
.
.
.
.
6-3
6-4
6-7
6-9
6-10
6-10
6-12
6-12
6-14
. . . . . . . . . . . . . . . . . . . . . .
Marker Menu . . . . . . . . . . . . . . . . . .
Delta mode menu . . . . . . . . . . . . . . . .
4Marker)5 . . . . . . . . . . . . . . . . . . . . .
Marker! menu . . . . . . . . . . . . . . . . .
4Search5 . . . . . . . . . . . . . . . . . . . . . .
Search Menu . . . . . . . . . . . . . . . . . .
Target Menu . . . . . . . . . . . . . . . . . .
Peak Menu . . . . . . . . . . . . . . . . . . .
Search Range Menu . . . . . . . . . . . . . . .
Widths Menu . . . . . . . . . . . . . . . . . .
4Utility5 . . . . . . . . . . . . . . . . . . . . . .
Utility Menu . . . . . . . . . . . . . . . . . .
Marker Function . . . . . . . . . . . . . . . . .
Three Types of Markers . . . . . . . . . . . . .
Marker Value . . . . . . . . . . . . . . . . . .
X-axis Value to be Displayed . . . . . . . . . .
Stimulus Value . . . . . . . . . . . . . . . .
Time . . . . . . . . . . . . . . . . . . . . .
Relaxation Time (1/2f) . . . . . . . . . . . .
Marker Level Monitor . . . . . . . . . . . . . .
OSC level monitor value . . . . . . . . . . .
Continuous/Discrete Mode . . . . . . . . . . . .
Marker on the Data Trace or on the Memory Trace
1Mode . . . . . . . . . . . . . . . . . . . . .
Marker Search Function . . . . . . . . . . . .
Width Function . . . . . . . . . . . . . . . . .
Width Value . . . . . . . . . . . . . . . . .
Peak De nition . . . . . . . . . . . . . . . . .
Peak De nition . . . . . . . . . . . . . . . .
.
.
.
.
.
.
.
.
.
.
.
.
.
.
.
.
.
.
.
.
.
.
.
.
.
.
.
.
.
.
.
.
.
.
.
.
.
.
.
.
.
.
.
.
.
.
.
.
.
.
.
.
.
.
.
.
.
.
.
.
7-3
7-4
7-6
7-7
7-7
7-10
7-11
7-12
7-13
7-15
7-16
7-18
7-18
7-20
7-20
7-20
7-20
7-20
7-20
7-20
7-21
7-21
7-21
7-21
7-21
7-22
7-22
7-23
7-26
7-26
.
.
.
.
.
.
.
.
.
.
.
.
.
.
.
.
.
.
.
.
.
.
8-3
8-4
8-6
8-9
8-10
8-11
8-13
8-14
8-17
8-19
8-19
4Sweep5
7. Marker Block
4Marker5
8. Instrument State Block
. . . . . . . . . .
System Menu . . . . . .
Instrument BASIC menu
Program Menu . . . . .
Memory Partition Menu .
Clock Menu . . . . . .
Beeper Menu . . . . . .
Limit Test Menu . . . .
Limit Line Entry Menu .
4Local5 . . . . . . . . . .
Local Menu . . . . . .
4System5
Contents-4
.
.
.
.
.
.
.
.
.
.
.
.
.
.
.
.
.
.
.
.
.
.
.
.
.
.
.
.
.
.
.
.
.
.
.
.
.
.
.
.
.
.
.
.
.
.
.
.
.
.
.
.
.
.
.
.
.
.
.
.
.
.
.
.
.
.
.
.
.
.
.
.
.
.
.
.
.
.
.
.
.
.
.
.
.
.
.
.
.
.
.
.
.
.
.
.
.
.
.
.
.
.
.
.
.
.
.
.
.
.
.
.
.
.
.
.
.
.
.
.
.
.
.
.
.
.
.
.
.
.
.
.
. . . . . . . . . . . . . . . . . . . . . . . .
. . . . . . . . . . . . . . . . . . . . . . . .
Copy Menu . . . . . . . . . . . . . . . . . . . . .
Print Setup Menu . . . . . . . . . . . . . . . . . .
Copy Limit Test Menu . . . . . . . . . . . . . . . .
Copy List Sweep Menu . . . . . . . . . . . . . . .
Screen Menu . . . . . . . . . . . . . . . . . . . .
4Save5 . . . . . . . . . . . . . . . . . . . . . . . . .
Save Menu . . . . . . . . . . . . . . . . . . . . .
De ne Save Data Menu . . . . . . . . . . . . . . .
Re-Save File Menu . . . . . . . . . . . . . . . . .
Purge File Menu . . . . . . . . . . . . . . . . . .
Purge Yes No Menu . . . . . . . . . . . . . . . . .
Initialize Yes No Menu . . . . . . . . . . . . . . .
4Recall5 . . . . . . . . . . . . . . . . . . . . . . . .
Recall Menu . . . . . . . . . . . . . . . . . . . .
Limit Line Concept . . . . . . . . . . . . . . . . . .
How Limit Lines are Entered . . . . . . . . . . . .
Turning Limit Lines and Limit Testing On and O . . .
Segment Entering Order . . . . . . . . . . . . . .
Saving the Limit Line Table . . . . . . . . . . . . .
O setting the Stimulus or Amplitude of the Limit Lines
Supported Display Formats . . . . . . . . . . . . .
Use a Sucient Number of Points or Errors May Occur
Displaying or Printing Limit Test Data . . . . . . . .
Results of Printing the Display with Limit Lines ON . .
GPIB . . . . . . . . . . . . . . . . . . . . . . . .
What is GPIB? . . . . . . . . . . . . . . . . . . .
How GPIB Works . . . . . . . . . . . . . . . . . .
Talker . . . . . . . . . . . . . . . . . . . . . .
Listener . . . . . . . . . . . . . . . . . . . . .
Controller . . . . . . . . . . . . . . . . . . . .
GPIB Requirements . . . . . . . . . . . . . . . . .
Analyzer GPIB Capabilities . . . . . . . . . . . . .
Bus Mode . . . . . . . . . . . . . . . . . . . . .
System Controller . . . . . . . . . . . . . . . .
Addressable . . . . . . . . . . . . . . . . . . .
Setting Addresses . . . . . . . . . . . . . . . . . .
Saving and Recalling Instrument States and Data . . . .
Storage Devices . . . . . . . . . . . . . . . . . .
Disk Requirements . . . . . . . . . . . . . . . .
Disk Formats . . . . . . . . . . . . . . . . . . .
Memory disk Capacity . . . . . . . . . . . . . .
Copy Files Between the memory disk and the oppy
Disk . . . . . . . . . . . . . . . . . . . . .
File Types and Data Groups . . . . . . . . . . . . .
File Types . . . . . . . . . . . . . . . . . . . .
Data Groups . . . . . . . . . . . . . . . . . . .
Graphics Images (GRAPHICS) . . . . . . . . . . .
File Type and Data Group Combinations . . . . . .
File Names . . . . . . . . . . . . . . . . . . . . .
Valid Characters for File Names . . . . . . . . . . .
Suxes (LIF) and Extensions (DOS) . . . . . . . . .
Auto Recall Function . . . . . . . . . . . . . . . .
4Preset5
4Copy5
8-21
8-22
8-23
8-26
8-28
8-28
8-29
8-30
8-32
8-35
8-36
8-37
8-37
8-38
8-39
8-39
8-40
8-40
8-41
8-42
8-42
8-42
8-42
8-42
8-42
8-43
8-44
8-44
8-44
8-44
8-44
8-45
8-45
8-45
8-46
8-46
8-46
8-47
8-48
8-48
8-48
8-48
8-48
8-48
8-48
8-48
8-49
8-49
8-49
8-50
8-50
8-50
8-50
Contents-5
File Structure of Internal Data Arrays File for Binary
Files . . . . . . . . . . . . . . . . . . . . .
File Header . . . . . . . . . . . . . . . . . .
Data Group . . . . . . . . . . . . . . . . . .
File Structure of Internal Data Arrays File for ASCII
File . . . . . . . . . . . . . . . . . . . . .
Status Block . . . . . . . . . . . . . . . . . .
Data Block . . . . . . . . . . . . . . . . . . .
File Structure for Single Channel and Dual Channel .
.
.
.
8-51
8-51
8-52
.
.
.
.
8-56
8-56
8-56
8-58
Introduction . . . . . . . . . . . . . . . . . . . . .
System Overview . . . . . . . . . . . . . . . . . . .
Data Processing . . . . . . . . . . . . . . . . . . .
Overview . . . . . . . . . . . . . . . . . . . . .
Data Processing Flow . . . . . . . . . . . . . . . .
AD converter (adc) . . . . . . . . . . . . . . . .
Digital Filter . . . . . . . . . . . . . . . . . . .
Ratio Processing . . . . . . . . . . . . . . . . .
Fixed Point Calibration Coecient Arrays and User
De ned Point Calibration Coecient Arrays . .
Calibration Coecient Interpolation . . . . . . . .
Calibration Coecient Arrays . . . . . . . . . . .
Error Collection . . . . . . . . . . . . . . . . .
Averaging . . . . . . . . . . . . . . . . . . . .
Raw Data Arrays . . . . . . . . . . . . . . . . .
Port Extension . . . . . . . . . . . . . . . . . .
Fixture Compensation Coecient Arrays . . . . . .
Fixed Point Fixture Compensation Coecient Arrays
and User De ned Point Fixture Compensation
Coecient Arrays . . . . . . . . . . . . . . .
Compensation Coecient Interpolation . . . . . .
Fixture Compensation . . . . . . . . . . . . . .
Data Arrays . . . . . . . . . . . . . . . . . . .
Memory Arrays . . . . . . . . . . . . . . . . . .
Format . . . . . . . . . . . . . . . . . . . . . .
Data Math . . . . . . . . . . . . . . . . . . . .
Data Trace Arrays . . . . . . . . . . . . . . . .
Memory Trace Arrays . . . . . . . . . . . . . . .
Scaling . . . . . . . . . . . . . . . . . . . . . .
9-1
9-1
9-2
9-2
9-3
9-3
9-3
9-4
9. Analyzer Features
10. Options and Accessories
Introduction . . . . . . . . . . . . . . . . . . . . .
Options Available . . . . . . . . . . . . . . . . . . .
Option 001 Add dc bias . . . . . . . . . . . . . . .
Option 002 Add material measurement rmware . . .
Option 011 Delete high impedance test head . . . . .
Option 012 Add low impedance test head . . . . . .
Option 013 Add high temperature high impedance test
head . . . . . . . . . . . . . . . . . . . . . .
Option 014 Add high temperature low impedance test
head . . . . . . . . . . . . . . . . . . . . . .
Option 0BW Add Service Manual . . . . . . . . . .
Option 1D5 Add high stability frequency reference . .
Option 1A2 Keyboard less . . . . . . . . . . . . . .
Contents-6
9-4
9-4
9-4
9-4
9-4
9-4
9-5
9-5
9-5
9-5
9-5
9-5
9-5
9-6
9-6
9-6
9-6
9-6
10-1
10-1
10-1
10-1
10-1
10-1
10-1
10-1
10-2
10-2
10-2
Option 1CM Rack mount kit . . . . . . . . . . . . .
Option 1CN Handle Kit . . . . . . . . . . . . . . .
Option 1CP Rack mount and handle kit . . . . . . .
Measurement accessories available . . . . . . . . . . .
16191A Side electrode SMD test xture . . . . . . .
16192A Parallel electrode SMD test xture . . . . . .
16193A Small side electrode SMD test xture . . . . .
16194A High temperature component xture . . . . .
16453A Dielectric material test xture . . . . . . . .
16454A magnetic material test xture . . . . . . . .
16091A Coaxial termination xture set . . . . . . . .
16092A Spring clip test xture . . . . . . . . . . .
16093A/B Binding post test xtures . . . . . . . . .
16094A Probe test xture . . . . . . . . . . . . . .
System accessories available . . . . . . . . . . . . . .
System rack . . . . . . . . . . . . . . . . . . . .
Printer . . . . . . . . . . . . . . . . . . . . . . .
GPIB cable . . . . . . . . . . . . . . . . . . . . .
Service Accessories Available . . . . . . . . . . . . .
Collet removing tool (Agilent part number 5060-0236) .
Collet removing tool guide (Agilent part number
04291-21002) . . . . . . . . . . . . . . . . . .
6-Slot collet (Agilent part number 85050-20001) . . .
11. Impedance Measurement Basics
Impedance parameters . . . . . . . . . . . . . . . .
_ . . . . . . . . . . . . . . . . . . .
Impedance (Z)
_ . . . . . . . . . . . . . . . . . . .
Admittance (Y)
_ . . . . . . . . . . . . . .
Re ection Coecient (0)
Series and Parallel Circuit Models . . . . . . . . . . .
Parallel-Series Equivalent Circuit Conversion . . . . .
Selecting Circuit Mode of Capacitance . . . . . . . .
Small Capacitance . . . . . . . . . . . . . . . .
Large Capacitance . . . . . . . . . . . . . . . .
Selecting Circuit Mode of Inductance . . . . . . . .
Large Inductance . . . . . . . . . . . . . . . . .
Small Inductance . . . . . . . . . . . . . . . . .
Smith Chart . . . . . . . . . . . . . . . . . . . . .
Calibration Concepts . . . . . . . . . . . . . . . . .
OPEN SHORT LOAD Calibration . . . . . . . . . . .
Ideal Measurement Circuit . . . . . . . . . . . .
General Impedance Measurement Schematic . . . .
Low Loss Capacitor Calibration . . . . . . . . . . .
Port Extension . . . . . . . . . . . . . . . . . . . .
Fixture Compensation . . . . . . . . . . . . . . . .
Actual Measuring Circuit . . . . . . . . . . . . . .
Residual Parameter E ects . . . . . . . . . . . . .
Characteristics of Test Fixture . . . . . . . . . . . .
Electrical Length of Coaxial Coupling Terminal
Section . . . . . . . . . . . . . . . . . . . .
Elimination of Electrical Length E ects in Test
Fixture . . . . . . . . . . . . . . . . . . . .
Residual and Stray Parameters of Contact Electrode
Section . . . . . . . . . . . . . . . . . . . .
10-2
10-2
10-2
10-3
10-3
10-3
10-3
10-3
10-3
10-3
10-3
10-4
10-4
10-4
10-4
10-4
10-4
10-5
10-5
10-5
10-5
10-5
11-3
11-3
11-4
11-5
11-6
11-6
11-7
11-7
11-8
11-8
11-8
11-9
11-10
11-12
11-12
11-12
11-13
11-14
11-16
11-19
11-19
11-19
11-20
11-20
11-20
11-20
Contents-7
Elimination of Residual Parameter E ects in Test
Fixture (Fixture Compensation) . . . . . . . .
Compensation Coecient for Each Compensation . . .
OPEN Compensation . . . . . . . . . . . . . . .
SHORT Compensation . . . . . . . . . . . . . . .
LOAD Compensation . . . . . . . . . . . . . . .
OPEN-SHORT Compensation . . . . . . . . . . .
OPEN-LOAD Compensation . . . . . . . . . . . .
SHORT-LOAD Compensation . . . . . . . . . . .
OPEN-SHORT-LOAD Compensation . . . . . . . .
Permittivity Measurements . . . . . . . . . . . . . .
Complex Permittivity . . . . . . . . . . . . . . . .
Characteristics of Test Fixture . . . . . . . . . . . .
Edge E ect . . . . . . . . . . . . . . . . . . .
Residual Parameter . . . . . . . . . . . . . . . .
Permeability Measurements . . . . . . . . . . . . . .
Complex Permeability . . . . . . . . . . . . . . . .
Characteristics of the Test Fixture . . . . . . . . . .
Residual Parameter . . . . . . . . . . . . . . . .
Elimination of Residual Impedance E ects in the Test
Fixture (SHORT Fixture Compensation) . . . . .
Impedance Parameter Value Displayed for Magnetic
Material Measurement . . . . . . . . . . . . . .
12. 4291B
RF Impedance/Material Analyzer
Technical
Data
Measurement Parameter . . . . . . . . . . . . . . .
Impedance parameters . . . . . . . . . . . . . . .
Stimulus Characteristics . . . . . . . . . . . . . . . .
Frequency Characteristics . . . . . . . . . . . . . .
Source Characteristics . . . . . . . . . . . . . . .
Sweep Characteristics . . . . . . . . . . . . . . . . .
Calibration/Compensation . . . . . . . . . . . . . . .
Measurement Accuracy . . . . . . . . . . . . . . . .
Speci cation for Option 013 and 014 High Temperature
Test Heads . . . . . . . . . . . . . . . . . . . .
Frequency Characteristics . . . . . . . . . . . . . .
Source Characteristics . . . . . . . . . . . . . . .
Basic Measurement Accuracy . . . . . . . . . . . .
Typical E ects of Temperature Drift on Measurement
Accuracy . . . . . . . . . . . . . . . . . . . .
Operation Conditions of the Test Head . . . . . . . .
Dimensions of High Temperature Test Head . . . . .
Display . . . . . . . . . . . . . . . . . . . . . . .
Data Storage . . . . . . . . . . . . . . . . . . . . .
GPIB . . . . . . . . . . . . . . . . . . . . . . . .
Printer parallel port . . . . . . . . . . . . . . . . .
General Characteristics . . . . . . . . . . . . . . . .
Input and Output Characteristics . . . . . . . . . .
Operation Conditions . . . . . . . . . . . . . . . .
Non-operation conditions . . . . . . . . . . . . . .
Others . . . . . . . . . . . . . . . . . . . . . . .
External program Run/Cont input . . . . . . . . . .
Contents-8
11-21
11-22
11-22
11-22
11-23
11-23
11-24
11-24
11-24
11-26
11-26
11-27
11-27
11-28
11-29
11-30
11-31
11-31
11-31
11-32
12-1
12-1
12-1
12-1
12-1
12-3
12-4
12-5
12-11
12-11
12-11
12-12
12-16
12-18
12-18
12-19
12-19
12-19
12-20
12-20
12-20
12-21
12-21
12-21
12-22
Speci cations for Option 1D5 High Stability Frequency
Reference . . . . . . . . . . . . . . . . . . . .
Reference Oven Output . . . . . . . . . . . . . . .
Supplemental Characteristics for Option 002 Material
Measurement . . . . . . . . . . . . . . . . . . .
Measurement Frequency Range . . . . . . . . . . .
Measurement Parameter . . . . . . . . . . . . . .
Permittivity parameters . . . . . . . . . . . . . .
Permeability parameters . . . . . . . . . . . . .
Typical Measurement Accuracy . . . . . . . . . . .
Option 002 Material Measurement Accuracy with Option
013 and 014 High Temperature Test Head (Typical) .
Dielectric Material Measurement Accuracy with High
Temperature Test Head (Typical) . . . . . . . . .
Typical E ects of Temperature Drift on Dielectric
Material Measurement Accuracy . . . . . . . . .
Magnetic Material Measurement Accuracy with High
Temperature Test Head (Typical) . . . . . . . . .
Typical E ects of Temperature Drift on Magnetic
Material Measurement Accuracy . . . . . . . . .
Furnished Accessories . . . . . . . . . . . . . . . .
A. Manual Changes
Introduction . . . . . . . . . . . . . . . . . . . . .
Manual Changes . . . . . . . . . . . . . . . . . . .
Serial Number . . . . . . . . . . . . . . . . . . . .
B. Input Range and Default Setting
. . . . . . . . .
. . . . . . . . .
4Display5 . . . . . . . . .
4Scale Ref5 . . . . . . . .
4Bw/Avg5 . . . . . . . .
4Cal5 . . . . . . . . . .
4Cal5 (") . . . . . . . . .
4Cal5 ()
. . . . . . . .
4Sweep5 . . . . . . . . .
4Source5 . . . . . . . . .
4Trigger5 . . . . . . . . .
4Start5, 4Stop5, 4Center5, 4Span5
4Marker5 . . . . . . . . .
4Marker!5 . . . . . . . .
4Search5 . . . . . . . . .
4Utility5 . . . . . . . . .
4System5 . . . . . . . . .
4Local5 . . . . . . . . .
. . . . . . . . .
4Copy5
4Save5 . . . . . . . . . .
4Meas5
4Format5
.
.
.
.
.
.
.
.
.
.
.
.
.
.
.
.
.
.
.
.
.
.
.
.
.
.
.
.
.
.
.
.
.
.
.
.
.
.
.
.
.
.
.
.
.
.
.
.
.
.
.
.
.
.
.
.
.
.
.
.
.
.
.
.
.
.
.
.
.
.
.
.
.
.
.
.
.
.
.
.
.
.
.
.
.
.
.
.
.
.
.
.
.
.
.
.
.
.
.
.
.
.
.
.
.
.
.
.
.
.
.
.
.
.
.
.
.
.
.
.
.
.
.
.
.
.
.
.
.
.
.
.
.
.
.
.
.
.
.
.
.
.
.
.
.
.
.
.
.
.
.
.
.
.
.
.
.
.
.
.
.
.
.
.
.
.
.
.
.
.
.
.
.
.
.
.
.
.
.
.
.
.
.
.
.
.
.
.
.
.
.
.
.
.
.
.
.
.
.
.
.
.
.
.
.
.
.
.
.
.
.
.
.
.
.
.
.
.
.
.
.
.
.
.
.
.
.
.
.
.
.
.
.
.
.
.
.
.
.
.
.
.
.
.
.
.
.
.
.
.
.
.
.
.
.
.
.
.
.
.
.
.
.
.
.
.
.
.
.
.
.
.
.
.
.
.
.
.
.
.
.
.
.
.
.
.
.
.
.
.
.
.
.
.
.
.
.
.
.
.
12-22
12-22
12-23
12-23
12-23
12-23
12-23
12-23
12-39
12-39
12-40
12-45
12-46
12-51
A-1
A-1
A-2
B-2
B-2
B-3
B-4
B-6
B-6
B-7
B-7
B-8
B-8
B-8
B-9
B-9
B-10
B-10
B-10
B-11
B-12
B-12
B-12
Contents-9
C. Option 013, 014 Temperature Coecient Measurement
Introduction . . . . .
Setup and Installation Guide
Required Equipment . . .
Equipment Setup . . . . .
Quick Start . . . . . . . . .
Calibration . . . . . . .
Setting the Test Fixture .
Fixture Compensation .
Saving Status File . . .
Messages
Index
Contents-10
.
.
.
.
.
.
.
.
.
.
.
.
.
.
.
.
.
.
.
.
.
.
.
.
.
.
.
.
.
.
.
.
.
.
.
.
.
.
.
.
.
.
.
.
.
.
.
.
.
.
.
.
.
.
.
.
.
.
.
.
.
.
.
.
.
.
.
.
.
.
.
.
.
.
.
.
.
.
.
.
.
.
.
.
.
.
.
.
.
.
.
.
.
.
.
.
.
.
.
.
.
.
.
.
.
.
.
.
.
.
.
.
.
.
.
.
.
C-1
C-2
C-2
C-2
C-4
C-4
C-4
C-4
C-8
Figures
1-1.
1-2.
1-3.
1-4.
2-1.
2-2.
2-3.
2-4.
2-5.
2-6.
2-7.
2-8.
2-9.
3-1.
4-1.
5-1.
5-2.
5-3.
5-4.
5-5.
5-6.
5-7.
5-8.
5-9.
5-10.
5-11.
5-12.
5-13.
5-14.
5-15.
5-16.
4291B System Overview . . . . . . . . . . . . . .
Test Fixtures . . . . . . . . . . . . . . . . . . . .
Material Test Fixtures for Option 002 . . . . . . . .
High Temperature Test Heads and High Temperature
Test Fixtures for Option 013/014 . . . . . . . . .
Analyzer Front Panel . . . . . . . . . . . . . . . .
Screen Display (Single Channel, Cartesian Format) . .
Analyzer Rear Panel . . . . . . . . . . . . . . . .
Pin Assignment of I/O Port . . . . . . . . . . . . .
Circuit of I/O Port . . . . . . . . . . . . . . . . .
Test Station . . . . . . . . . . . . . . . . . . . .
Keeping Space Around the Heat Sink . . . . . . . .
Dimensions of Test Station . . . . . . . . . . . . .
Test Heads . . . . . . . . . . . . . . . . . . . . .
Active Channel Keys . . . . . . . . . . . . . . . .
Entry Block . . . . . . . . . . . . . . . . . . . .
Measurement Block . . . . . . . . . . . . . . . . .
Softkey Menus Accessed from the 4Meas5 Key for
Impedance Measurement . . . . . . . . . . . .
Softkey Menus Accessed from the 4Meas5 Key for
Permittivity Measurement . . . . . . . . . . . .
Softkey Menus Accessed from the 4Meas5 Key for
Permeability Measurement . . . . . . . . . . . .
Softkey Menus Accessed from the 4Meas5
Key for Impedance Measurement (when
Smith/Polar/Admittance or Complex-Plane Format is
selected) . . . . . . . . . . . . . . . . . . . .
Softkey Menus Accessed from the 4Meas5 Key
for Permittivity Measurement (when
Smith/Polar/Admittance or Complex-Plane Format is
selected) . . . . . . . . . . . . . . . . . . . .
Softkey Menus Accessed from the 4Meas5 Key
for Permeability Measurement (when
Smith/Polar/Admittance or Complex-Plane Format is
selected) . . . . . . . . . . . . . . . . . . . .
Impedance Measurement Menu . . . . . . . . . . .
Complex Impedance Measurement Menu . . . . . . .
Dual Parameter Menu . . . . . . . . . . . . . . . .
Impedance Fixture Menu (No option 002) . . . . . .
Impedance Fixture Menu (Option 002 only) . . . . . .
Permittivity Measurement Menu (Option 002 only) . .
Complex Permittivity Measurement Menu (Option 002
only) . . . . . . . . . . . . . . . . . . . . . .
Dual Parameter Menu (Dielectric Material
Measurement) . . . . . . . . . . . . . . . . . .
Dielectric Material Fixture Menu (Option 002 only) . .
1-2
1-2
1-3
1-3
2-1
2-4
2-9
2-11
2-12
2-13
2-14
2-14
2-15
3-1
4-1
5-1
5-3
5-4
5-5
5-6
5-7
5-8
5-9
5-11
5-12
5-14
5-15
5-17
5-19
5-20
5-21
Contents-11
5-17.
5-18.
5-19.
5-20.
5-21.
5-22.
5-23.
5-24.
5-25.
5-26.
5-27.
5-28.
5-29.
5-30.
5-31.
5-32.
5-33.
5-34.
5-35.
5-36.
5-37.
5-38.
5-39.
5-40.
5-41.
5-42.
5-43.
5-44.
5-45.
5-46.
5-47.
5-48.
5-49.
5-50.
5-51.
5-52.
6-1.
6-2.
6-3.
6-4.
6-5.
6-6.
6-7.
6-8.
7-1.
7-2.
7-3.
7-4.
Contents-12
Dielectric Material Size Menu (Option 002 only) . . . . 5-22
Dielectric Material Size . . . . . . . . . . . . . . . 5-22
Permeability Measurement Menu (Option 002 only) . . 5-23
Complex Permeability Measurement Menu (Option 002
only) . . . . . . . . . . . . . . . . . . . . . . 5-25
Dual Parameter Menu (Magnetic Material Measurement) 5-26
Magnetic Material Fixture Menu (Option 002 only) . . 5-27
Magnetic Material Size Menu (Option 002 only) . . . . 5-29
Magnetic Material Size . . . . . . . . . . . . . . . 5-29
Format Menu . . . . . . . . . . . . . . . . . . . . 5-30
User Trace Format Menu . . . . . . . . . . . . . . 5-31
Softkey Menu Accessed from 4Display5 Key . . . . . . 5-32
Display Menu . . . . . . . . . . . . . . . . . . . 5-33
Display Allocation Menu . . . . . . . . . . . . . . 5-36
Display Allocations . . . . . . . . . . . . . . . . . 5-37
Data Math Menu . . . . . . . . . . . . . . . . . . 5-38
Equivalent Circuit Menu . . . . . . . . . . . . . . 5-40
Adjust Display Menu . . . . . . . . . . . . . . . . 5-42
Color Adjust Menu . . . . . . . . . . . . . . . . . 5-44
Label Menu . . . . . . . . . . . . . . . . . . . . 5-45
Title Menu . . . . . . . . . . . . . . . . . . . . . 5-46
User Trace Display Menu . . . . . . . . . . . . . . 5-47
Scale Reference Menu . . . . . . . . . . . . . . . 5-49
User Trace Scale Menu . . . . . . . . . . . . . . . 5-51
Averaging Menu . . . . . . . . . . . . . . . . . . 5-52
Softkey Menu Accessed from 4Cal5 key . . . . . . . . 5-54
Calibration Menu . . . . . . . . . . . . . . . . . . 5-55
Fixture Compensation Menu . . . . . . . . . . . . . 5-57
Fixture Compensation Menu (for Permittivity
Measurement) . . . . . . . . . . . . . . . . . . 5-58
Fixture Compensation Menu (for Permeability
Measurement) . . . . . . . . . . . . . . . . . . 5-59
Calkit Menu . . . . . . . . . . . . . . . . . . . . 5-60
Calibration Standard Model . . . . . . . . . . . . . 5-61
Compen Kit Menu (for Impedance Measurement
Fixture) . . . . . . . . . . . . . . . . . . . . 5-62
Parameters of OPEN, SHORT, and LOAD for the
Impedance Fixture Compensation . . . . . . . . 5-63
Compen Kit Menu (for Permittivity Measurement
Fixture) . . . . . . . . . . . . . . . . . . . . 5-64
Parameters of LOAD for the Premitttivity Fixture
Compensation . . . . . . . . . . . . . . . . . . 5-65
Port Extension Menu . . . . . . . . . . . . . . . . 5-66
Stimulus Block . . . . . . . . . . . . . . . . . . .
6-1
Softkey Menus Accessed from the 4Sweep5 Key . . . . .
6-3
Sweep Menu . . . . . . . . . . . . . . . . . . . .
6-4
Sweep Delay Time and Point Delay Time . . . . . . .
6-5
List Menu . . . . . . . . . . . . . . . . . . . . .
6-7
Segment Menu . . . . . . . . . . . . . . . . . . .
6-9
Softkey Menus Accessed from the 4Source5 Key . . . . 6-10
Softkey Menus Accessed from the 4Trigger5 Key . . . . 6-12
Marker Block . . . . . . . . . . . . . . . . . . . .
7-1
Softkey Menus Accessed from the 4Marker5 Key . . . .
7-3
Marker Menu . . . . . . . . . . . . . . . . . . . .
7-4
Delta Mode Menu . . . . . . . . . . . . . . . . . .
7-6
7-5.
7-6.
7-7.
7-8.
7-9.
7-10.
7-11.
7-12.
7-13.
7-14.
7-15.
8-1.
8-2.
8-3.
8-4.
8-5.
8-6.
8-7.
8-8.
8-9.
8-10.
8-11.
8-12.
8-13.
8-14.
8-15.
8-16.
8-17.
8-18.
8-19.
8-20.
8-21.
8-22.
8-23.
8-24.
8-25.
8-26.
8-27.
8-28.
8-29.
8-30.
8-31.
8-32.
9-1.
9-2.
11-1.
11-2.
11-3.
11-4.
11-5.
11-6.
11-7.
11-8.
11-9.
Marker! Menu . . . . . . . . . . . . . . . . . . .
7-7
Softkey Menus Accessed from the 4Search5 Key . . . . 7-10
Search Menu . . . . . . . . . . . . . . . . . . . . 7-11
Target Menu . . . . . . . . . . . . . . . . . . . . 7-12
Peak Menu . . . . . . . . . . . . . . . . . . . . . 7-13
Search Range Menu . . . . . . . . . . . . . . . . . 7-15
Widths Menu . . . . . . . . . . . . . . . . . . . . 7-16
Utility Menu . . . . . . . . . . . . . . . . . . . . 7-18
Bandwidth Search Example . . . . . . . . . . . . . 7-23
Q Measurement Examples . . . . . . . . . . . . . . 7-25
Peak De nition . . . . . . . . . . . . . . . . . . . 7-26
Instrument State Block . . . . . . . . . . . . . . .
8-1
Softkey Menus Accessed from the 4System5 Key . . . .
8-3
System Menu . . . . . . . . . . . . . . . . . . . .
8-4
Instrument BASIC Menu . . . . . . . . . . . . . .
8-6
Peogram Menu . . . . . . . . . . . . . . . . . . .
8-9
Memory Partition Menu . . . . . . . . . . . . . . . 8-10
Clock Menu . . . . . . . . . . . . . . . . . . . . 8-11
Beeper Menu . . . . . . . . . . . . . . . . . . . . 8-13
Limit Test Menu . . . . . . . . . . . . . . . . . . 8-14
Limit Line Entry Menu . . . . . . . . . . . . . . . 8-17
Local Menu . . . . . . . . . . . . . . . . . . . . 8-19
Softkey Menus Accessed from the 4Copy5 Key . . . . . 8-22
Copy Menu . . . . . . . . . . . . . . . . . . . . . 8-23
Print Setup Menu . . . . . . . . . . . . . . . . . . 8-26
Copy Limit Test Menu . . . . . . . . . . . . . . . . 8-28
Copy List Sweep Menu . . . . . . . . . . . . . . . 8-28
Screen Menu . . . . . . . . . . . . . . . . . . . . 8-29
Softkey Menus Accessed from the 4Save5 Keys . . . . . 8-30
Save Menu . . . . . . . . . . . . . . . . . . . . . 8-32
De ne Save Data Menu . . . . . . . . . . . . . . . 8-35
Re-Save File Menu . . . . . . . . . . . . . . . . . 8-36
Purge File Menu . . . . . . . . . . . . . . . . . . 8-37
Purge Yes No Menu . . . . . . . . . . . . . . . . . 8-37
Initialize Yes No Menu . . . . . . . . . . . . . . . 8-38
Recall Menu . . . . . . . . . . . . . . . . . . . . 8-39
The Concept of Segments as a Point between Two Sets
of Limit Lines . . . . . . . . . . . . . . . . . . 8-40
Analyzer Bus Concept . . . . . . . . . . . . . . . 8-46
File Header Structure . . . . . . . . . . . . . . . . 8-51
RAW, DATA, and DATA-TRACE Data Group Structure . 8-52
CAL Data Group Structure . . . . . . . . . . . . . 8-53
MEMORY and MEMORY TRACE Data Group Structure
8-54
User Trace Data Group Structure . . . . . . . . . . 8-55
Analyzer Simpli ed Block Diagram . . . . . . . . .
9-1
Data Processing . . . . . . . . . . . . . . . . . .
9-3
De nition of Impedance . . . . . . . . . . . . . . 11-3
Vector Representation of Admittance . . . . . . . . 11-5
Small Capacitance Circuit Mode Selection . . . . . . 11-7
Large Capacitance Circuit Mode Selection . . . . . . 11-8
Large Inductance Circuit Mode Selection . . . . . . . 11-9
Small Inductance Circuit Mode Selection . . . . . . . 11-9
Smith Chart . . . . . . . . . . . . . . . . . . . . 11-10
Impedance Read-out . . . . . . . . . . . . . . . . 11-11
Phase Sift by Transmission Line . . . . . . . . . . . 11-11
Contents-13
11-10. Measurement Circuits for I-V Method . . . . . . . .
11-11. General Schematic for Impedance Measurement Using
Two Vector Voltmeters . . . . . . . . . . . . . .
11-12. Modifying the Standard Value of a 50 LOAD using a
Low-Loss Air-Capacitor . . . . . . . . . . . . .
11-13. Port Extension . . . . . . . . . . . . . . . . . . .
11-14. Residual Parameters in the Circuit . . . . . . . . . .
11-15. Characteristics of Test Fixture . . . . . . . . . . . .
11-16. Test Fixture Represented by the F matrix of a Two
Terminal Pair Network . . . . . . . . . . . . . .
11-17. Schematic Electrode Structure of the 16453A . . . .
11-18. Material has some loss . . . . . . . . . . . . . . .
11-19. Edge E ect . . . . . . . . . . . . . . . . . . . .
11-20. Basic Relationship of Magnetic Flux Density, Magnetic
Flux, and Current . . . . . . . . . . . . . . . .
11-21. Schematic Fixture Structure of 16454A . . . . . . .
11-22. Material Has Loss . . . . . . . . . . . . . . . . . .
11-23. Residual Impedance of the 16454A . . . . . . . . .
12-1. DC Voltage and Current Level Range (Typical) . . . .
12-2. Impedance Measurement Accuracy Using High
Impedance Test Head (@ Low OSC Level) . . . . .
12-3. Impedance Measurement Accuracy Using High
Impedance Test Head (@ High OSC Level) . . . . .
12-4. Impedance Measurement Accuracy Using Low
Impedance Test Head (@ Low OSC Level) . . . . .
12-5. Impedance Measurement Accuracy Using Low
Impedance Test Head (@ High OSC Level) . . . . .
12-6. Typical Q Measurement Accuracy (when open/short/50
/low-loss-capaciter calibration are done) . . . . .
12-7. Impedance Measurement Accuracy Using High
Temperature High Impedance Test Head
(@ Low OSC Level) . . . . . . . . . . . . . . .
12-8. Impedance Measurement Accuracy Using High
Temperature High Impedance Test Head
(@ High OSC Level) . . . . . . . . . . . . . . .
12-9. Impedance Measurement Accuracy Using High
Temperature Low Impedance Test Head
(@ Low OSC Level) . . . . . . . . . . . . . . .
12-10. Impedance Measurement Accuracy Using High
Temperature Low Impedance Test Head
(@ High OSC Level) . . . . . . . . . . . . . . .
12-11. Typical Frequency Characteristics of Temperature
Coecient Using High Temperature High Impedance
Test Head . . . . . . . . . . . . . . . . . . . .
12-12. Typical Frequency Characteristics of Temperature
Coecient Using High Temperature Low Impedance
Test Head . . . . . . . . . . . . . . . . . . . .
12-13. Dimensions of High Temperature Test Head . . . . .
12-14. Trigger Signal . . . . . . . . . . . . . . . . . . .
12-15. I/O Port Pin Assignment . . . . . . . . . . . . . . .
12-16. Typical Permittivity Measurement Accuracy
(@thickness=0.3 mm) . . . . . . . . . . . . . .
12-17. Typical Permittivity Measurement Accuracy
(@thickness=1 mm) . . . . . . . . . . . . . . .
Contents-14
11-12
11-13
11-15
11-16
11-19
11-20
11-21
11-26
11-26
11-27
11-29
11-29
11-30
11-31
12-3
12-7
12-7
12-8
12-8
12-10
12-14
12-14
12-15
12-15
12-17
12-17
12-18
12-20
12-22
12-25
12-25
12-18. Typical Permittivity Measurement Accuracy
(@thickness=3 mm) . . . . . . . . . . . . . . .
12-19. Typical Dielectric Loss Tangent (tan ) Measurement
Accuracy (@thickness=0.3 mm) . . . . . . . . .
12-20. Typical Dielectric Loss Tangent (tan ) Measurement
Accuracy (@thickness=1 mm) . . . . . . . . . .
12-21. Typical Dielectric Loss Tangent (tan ) Measurement
Accuracy (@thickness=3 mm) . . . . . . . . . .
12-22. Typical Permittivity Measurement Accuracy ("r v.s.
Frequency, @thickness=0.3 mm) . . . . . . . . .
12-23. Typical Permittivity Measurement Accuracy ("r v.s.
Frequency, @thickness=1 mm) . . . . . . . . . .
12-24. Typical Permittivity Measurement Accuracy ("r v.s.
Frequency, @thickness=3 mm) . . . . . . . . . .
12-25. Typical Permeability Measurement Accuracy (@F* =0.5)
12-26. Typical Permeability Measurement Accuracy (@F* =3)
12-27. Typical Permeability Measurement Accuracy (@F* =10)
12-28. Typical Permeability Loss Tangent (tan ) Measurement
Accuracy (@F* =0.5) . . . . . . . . . . . . . . .
12-29. Typical Permeability Loss Tangent (tan ) Measurement
Accuracy (@F* =3) . . . . . . . . . . . . . . .
12-30. Typical Permeability loss Tangent (tan ) Measurement
Accuracy (@F* =10) . . . . . . . . . . . . . . .
12-31. Typical Permeability Measurement Accuracy (r v.s.
Frequency, @F*=0.5) . . . . . . . . . . . . . .
12-32. Typical Permeability Measurement Accuracy (r v.s.
Frequency, @F*=3) . . . . . . . . . . . . . . .
12-33. Typical Permeability Measurement Accuracy (r v.s.
Frequency, @F*=10) . . . . . . . . . . . . . .
12-34. Typical Frequency Characteristics of Temperature
Coecient of "r ' and Loss Tangent Accuracy
(Thickness=0.3 mm) . . . . . . . . . . . . . . .
12-35. Typical Frequency Characteristics of Temperature
Coecient of "r ' and Loss Tangent Accuracy
(Thickness=1 mm) . . . . . . . . . . . . . . .
12-36. Typical Frequency Characteristics of Temperature
Coecient of "r ' and Loss Tangent Accuracy
(Thickness=3 mm) . . . . . . . . . . . . . . .
12-37. Typical Frequency Characteristics of Temperature
Coecient of r 0 and Loss Tangent Accuracy (F* =
0.5) . . . . . . . . . . . . . . . . . . . . . .
12-38. Typical Frequency Characteristics of Temperature
Coecient of r 0 and Loss Tangent Accuracy (F* =
3) . . . . . . . . . . . . . . . . . . . . . . .
12-39. Typical Frequency Characteristics of Temperature
Coecient of r 0 and Loss Tangent Accuracy (F* =
10) . . . . . . . . . . . . . . . . . . . . . . .
A-1. Serial Number Plate . . . . . . . . . . . . . . . .
C-1. Equipment Setup . . . . . . . . . . . . . . . . . .
C-2. Test Head and Test Stand Setup . . . . . . . . . . .
C-3. 16194A Connection . . . . . . . . . . . . . . . . .
12-26
12-27
12-28
12-29
12-30
12-30
12-31
12-31
12-32
12-32
12-33
12-34
12-35
12-36
12-36
12-37
12-42
12-43
12-44
12-48
12-49
12-50
A-2
C-2
C-3
C-4
Contents-15
Tables
5-1.
8-1.
8-2.
8-3.
10-1.
11-1.
11-2.
12-1.
12-2.
12-3.
12-4.
12-5.
12-6.
A-1.
A-2.
Contents-16
Equivalent Circuit Selection Guide . . . . . . . . . .
List Value Format . . . . . . . . . . . . . . . . . .
Contents of ASCII Files . . . . . . . . . . . . . . .
Data Groups and Data Array Names . . . . . . . . .
Supported Printers and Printing Modes . . . . . . .
Parallel/Series Circuit Model and Measurement
Parameter . . . . . . . . . . . . . . . . . . .
Dissipation Factor Equations and Parallel-Series
Equivalent Circuit Conversion . . . . . . . . . .
Zs and Yo when High Impedance Test Head is used . .
Zs and Yo when Low Impedance Test Head is used . .
Zs and Yo when High Impedance Test Head is used . .
Zs and Yo when Low Impedance Test Head is used . .
Applicable Dielectric Material Size Using with 16453A
Applicable Magnetic Material Size Using with 16454A .
Manual Changes by Serial Number . . . . . . . . . .
Manual Changes by Firmware Version . . . . . . . .
5-41
8-24
8-57
8-58
10-5
11-6
11-7
12-6
12-6
12-13
12-13
12-38
12-38
A-1
A-1
Introduction
Introduction
1
This chapter provides an overview of the 4291B system and
descriptions of the main features of the analyzer (also referred to
as the main frame). The system includes the analyzer, test station,
test heads, xtures, and keyboard. The analyzer features include the
front and rear panels and the six key blocks. The front and rear panel
sections provide information on the input/output connectors, the LCD,
and other panel features. The six key block sections describe the keys
and their associated menus and how they function together.
Introduction 1-1
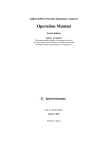
System Overview
The 4291B system is shown in Figure 1-1, Figure 1-2, and Figure 1-3.
Figure 1-1. 4291B System Overview
1.
2.
3.
4.
5.
6.
Main frame
Test station (furnished with the main frame)
Cal kit (furnished with the main frame)
High impedance test head (furnished with the main frame)
Low impedance test head (furnished with option 012)
mini-DIN Keyboard
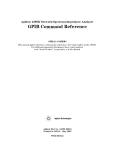
Figure 1-2. Test Fixtures
7. 16191A Component test xture (optional)
8. 16192A Component test xture (optional)
9. 16193A Component test xture (optional)
1-2 Introduction
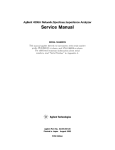
Figure 1-3. Material Test Fixtures for Option 002
10. 16453A Dielectric material test xture (optional)
11. 16454A Magnetic material test xture (optional)
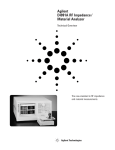
Figure 1-4.
High Temperature Test Heads and High Temperature Test Fixtures for Option 013/014
12. High temperature high impedance test head (furnished with
option 013)
13. High temperature low impedance test head (furnished with option
014)
14. Fixture Stand (furnished with option 013 and option 014)
15. 16194A High temperature component test xture (optional)
Note
For more information on options and accessories available, see
Chapter 2 and manuals furnished with each accessory. Also other
options and accessories are available, see Chapter 10 for details.
Introduction 1-3
Analyzer features
The following sections describe the analyzer's features. Individual
chapters following this chapter describe each block of controls in
more detail.
Front and Rear Panels
Analyzer functions are activated from the front panel by using front
panel hardkeys or softkeys. Measurement results are displayed on
the LCD (which also displays the measurement conditions and the
instrument status). The front panel has input, output, and control
ports to connect to the test station and a oppy disk drive to store
data and instrument status.
The rear panel has input and output connectors to control the
analyzer from an external controller or to control external devices
from the analyzer. The rear panel also has a connector used to control
a BASIC program, a connector for an external keyboard, and a parallel
I/O port controlled by the program.
For more information, see Chapter 2.
ACTIVE CHANNEL Block
ENTRY Block
The analyzer has two channels for independent measurement of
parameters and display of data. This block has two keys that select
the active channel. Once an active channel is selected, you can
control it using the front panel keys and display its trace and data
annotations. If you want to use the other channel, you must select
the new channel before you make any other changes. For more
information, see Chapter 3.
This block provides the numerical and units keypad, the knob, and
the step keys. These controls are used in combination with other keys
to enter or change numeric data.
For more information, see Chapter 4.
MEASUREMENT Block
This block controls the measurement and display functions. Each key
provides access to softkey menus.
Because the measurement functions are di erent for impedance,
permittivity ", and permeability measurements, the menus accessed
from the 4Meas5 and 4Cal5 keys are di erent for each measurement of
operation.
4Meas5
Provides access to a series of menus used to select the
parameters to be measured. This menu is also used to select
xtures to be used for material (" and ) measurements.
4Format5
Displays the menu used to select the display format of the
data. Various rectangular and polar formats are available
1-4 Introduction
for display of measurement parameters selected by 4Meas5
key.
4Display5
Provides access to a series of menus used for instrument
state and active channel display functions. These menus
include dual channel display (overlaid or split), de nitions
of the displayed active channel trace in terms of the
mathematical relationship between data and trace memory,
display intensity, color selection, active channel display
title, frequency blanking, and equivalent circuit function.
4Scale Ref5 Displays the menu used to modify the axis scales and the
reference line value.
4Bw/Avg5
Provides access to two di erent noise reduction techniques:
sweep-to-sweep averaging, and on-point averaging.
4Cal5
Provides access to a series of menus that implement the
calibration and xture compensation procedures.
For more information, see Chapter 5.
STIMULUS Block
This block de nes the sweep range, and controls the trigger function,
test signal and DC bias source.
4Sweep5
Provides access to a series of menus used for selecting the
sweep type, editing the list sweep table, specifying the
number of points to be displayed, and specifying the delay
time.
4Source5
Displays the menu used to control the test signal, and DC
bias.
4Trigger5
Provides access to a series of menus used for selecting
trigger mode and trigger source.
4Start5, 4Stop5, 4Center5, and 4Span5
Used to specify frequency or power range of the stimulus.
For more information, see Chapter 6.
MARKER Block
This block displays the marker on the screen and controls the marker
function.
Displays the marker and provides access to a series of
4Marker5
menus used for selecting the marker mode and displaying
the sub-markers and the 1marker.
4Marker!5 Provides access to a series of menus used for changing
selected measurement parameters to the current maker
value.
4Search5
Displays menus used for searching the trace for a speci c
amplitude related point and placing the marker on that
point.
4Utility5
Displays a menu used for listing all marker values,
calculating and displaying statistical values of the display
trace, indicating the time elapsed since the sweep started,
monitoring OSC or dc bias level applied to a DUT.
Introduction 1-5
For more information, see Chapter 7.
INSTRUMENT STATE Block
This block provides control of channel-independent system functions.
These include the controller modes, real-time clock, limit line and
limit testing, HP Instrument BASIC, printing, saving instrument states
and trace data to a built-in disk or memory.
4System5
Provides access to a series of menus used for programming
HP Instrument BASIC, controlling the real-time clock and
the beeper, de ning the limit line table, performing limit
line testing, and change memory size for HP Instrument
BASIC and the memory disk.
4Local5
Returns front panel control to the user from an external
controller and displays a series of menus used to select the
GPIB mode and modify the GPIB addresses.
4Preset5
Sets the analyzer to the preset state. See Appendix B, for a
listing of the preset values.
4Copy5
Provides access to the menus used for controlling external
printers and de ning the parameters.
4Save5
Provides access to the menus used for saving the instrument
state and data to the oppy disk or memory disk.
4Recall5
Displays the menu used to recall the contents of disk les or
memory disk back into the analyzer.
For more information, see Chapter 8.
1-6 Introduction
Front and Rear Panel, Test Station, and Test Heads
2
This chapter describes the features of the analyzer, the test station,
and the test heads. It provides illustrations and descriptions of the
analyzer's front panel features, the LCD and its labels, and the rear
panel features and connectors. It also includes illustrations and
descriptions of the Test station and test heads.
Front Panel
Analyzer functions are activated from the front panel (Figure 2-1)
by using the front panel hardkeys or softkeys. In this manual, all
front panel hardkeys and softkey labels are shown as 4Hardkey5 and
Softkey , respectively.
NNNNNNNNNNNNNNNNNNNNNNN
Figure 2-1. Analyzer Front Panel
Front and Rear Panel, Test Station, and Test Heads 2-1
1. Front Panel Keys and Softkeys
Some of the front panel keys change instrument functions directly,
and others provide access to additional functions available in softkey
menus. Softkey menus are lists of up to eight related functions that
can be displayed in the softkey label area at the right-hand side of
the display. The eight keys to the right of the LCD are the softkeys.
Pressing one of the softkeys selects the adjacent menu function. This
either executes the labeled function and makes it the active function,
causes instrument status information to be displayed, or presents
another softkey menu.
Some of the analyzer's menus are accessed directly from front panel
keys and some from other menus. For example, the sweep menu
accessed by pressing the 4Sweep5 key presents all the sweep functions
such as sweep type, number of points, and sweep time. Pressing
NUMBER of POINTS allows the required number of points displayed
per sweep to be entered directly from the number pad. RETURN
softkeys return to previous menus. DONE indicates completion of a
speci c procedure and then returns to an earlier menu.
Usually, when a menu changes, the present active function is cleared.
NNNNNNNNNNNNNNNNNNNNNNNNNNNNNNNNNNNNNNNNNNNNNNNNNN
NNNNNNNNNNNNNNNNNNNN
NNNNNNNNNNNNNN
Softkeys that are Joined by Vertical Lines
When several possible choices are available for a function, the
softkeys are joined by vertical lines. For example, in the impedance
measurement menu under the 4Meas5 key, the available measurement
parameters are listed: MAG(|Z|) , PHASE(z) , RESIST(R) ,
REACT(X) with a vertical line between them. Note that only one
softkey can be selected at a time. When a selection has been made
from the listed alternatives, that selection is underlined until another
selection is made.
NNNNNNNNNNNNNNNNNNNNNNNNNN
NNNNNNNNNNNNNNNNNNNNNNNNNNNN
NNNNNNNNNNNNNNNNNNNNNNNNNNNNN
NNNNNNNNNNNNNNNNNNNNNNNNNN
Softkeys That Toggle On or O
Some softkey functions can be toggled on or off, for example
averaging. This is indicated in the softkey label. The current state, on
or off, is capitalized in the softkey label.
Example:
FFFFFFFFFFFFFFFFFFFFFFFFFFFFFFFFFFFFFFFFF
SWEEP AVG ON off The word on is capitalized, showing that sweep averaging is
currently on.
FFFFFFFFFFFFFFFFFFFFFFFFFFFFFFFFFFFFFFFFF
SWEEP AVG on OFF The word o is capitalized, showing that sweep averaging is
currently o .
Softkeys that Show Status Indications in Brackets
Some softkey labels show the current status of a function in brackets.
These include simple toggle functions and status-only indicators.
An example of a toggled function is the PRINT [STANDARD] or
PRINT [COLOR] softkey. The DATA MATH[ ] softkey is an example
of a status-only indicator, where the selected equation of the data
math function is shown in brackets in the softkey label.
NNNNNNNNNNNNNNNNNNNNNNNNNNNNNNNNNNNNNNNNNNNNNNNNNN
NNNNNNNNNNNNNNNNNNNNNNNNNNNNNNNNNNNNNNNNN
2-2 Front and Rear Panel, Test Station, and Test Heads
NNNNNNNNNNNNNNNNNNNNNNNNNNNNNNNNNNNNNN
2. GPIB \REMOTE" Indicator
This lights when the analyzer is in the remote state.
3. 4Preset5
This key returns the instrument to a known standard preset state
from any step of any manual procedure. A complete listing of the
instrument preset conditions is provided in Appendix B.
4. Test Station Connectors
The test station connects to these connectors.
5. Floppy Disk Drive
6. LINE Switch
Stores the measurement data, instrument status, list sweep tables, and
HP Instrument BASIC programs. The applicable disk formats are LIF
(logical interchange format) and DOS (disk operating system) format.
Turn on/off the 4291B
Front and Rear Panel, Test Station, and Test Heads 2-3
Screen display
Displays a grid on which the measurement data is plotted the
currently selected measurement traces and other information
describing the measurement. Figure 2-2 shows the locations of the
di erent information labels.
In addition to the full-screen display shown in Figure 2-2, a split
display is available (see \4Display5" in Chapter 5). In this case,
information labels are provided for each half of the display.
The screen can also be used as the HP Instrument BASIC display. HP
Instrument BASIC uses either a full-screen display or a half-screen
display below the graticule display as a text screen.
Figure 2-2. Screen Display (Single Channel, Cartesian Format)
1. Active Channel
Displays the number of the current active channel (selected with
the keys in the active channel block). If dual channel is on with an
overlaid display, both chan 1 (channel 1) and chan 2 (channel 2)
appear in this area.
2-4 Front and Rear Panel, Test Station, and Test Heads
2. Measured parameter
Shows the measurement parameter selected using the 4Meas5 key.
3. Scale/Div
Displays the scale set by the 4Scale Ref5 key in units appropriate to
the current measurement or displays top and bottom value of the
graticule. When polar, Smith chart or admittance chart formats are
selected, this area displays Fscl and the value of the outer circle.
(Fscl stands for `full scale'.)
4. Reference Level
Displays the value of a reference line in Cartesian formats. It is
selected using the 4Scale Ref5 key. However, the reference line is
invisible (it is indicated by a small triangle adjacent to the graticule
at the left). The reference levels of the complex plane format are not
displayed.
NNNNNNNNNNNNNNNNNNNNNNNNNNNNN
NNNNNNNNNNNNNNNNNNNNNNNNNNNNNNNNNNNNNN
When TOP VALUE and BOTTOM VALUE are used for scaling traces,
these values are displayed in the area of \3. Scale/Div" and \4.
Reference Level" with T&B. (T&B stands for `top and bottom'. )
5. Marker Data Readout
Displays the values of the marker in units appropriate to the current
measurement (see Chapter 7). The status of the marker is also
displayed under the marker values. The following status notations are
used:
Cpl
Peak
Max
Min
Targ
Marker couple is tuned on. (When single channel is displayed, this
notation is not displayed even if the marker couple is on.)
PEAK search tracking is turned on.
MAX search tracking is turned on.
MIN search tracking is turned on.
TARGET search tracking is turned on.
6. Level Monitor, Marker Statistics and Width Value
Displays the level monitor value, the statistical marker values
determined by using the menus accessed with the 4Utility5 key, and the
width value determined by using the menus accessed with the 4Search5
key. See Chapter 7.
7. Softkey Labels
Displays the menu labels that de ne the function of the softkeys
immediately to the right of the label.
8. Pass/Fail
Indicates the values used for limit testing when using limit lines. See
\Limit Line Concept" in Chapter 8.
Front and Rear Panel, Test Station, and Test Heads 2-5
9. DC BIAS ON notation
When dc bias is turned on, DC BIAS ON is displayed in this area. This
notation is not display when the screen displays user trace.
10. DC Bias Level
Displays the dc bias level and limit value of the dc bias when it is
turned on. The dc bias limit level is displayed in brackets.
11. Instrument BASIC Status (Run Light)
Shows current status of Instrument BASIC
t(blank)
_
?
3
Program stopped; can execute commands; CONTINUE not allowed.
Program paused; can execute commands; CONTINUE is allowed.
BASIC program waiting for input from keyboard; cannot execute
commands.
This indication has two possible meanings:
Program running; CANNOT execute BASIC commands. CONTINUE
not allowed.
System executing command entered from keyboard; CANNOT
enter commands.
12. Stimulus Span/Stop Value
Displays the stop frequency of the sweep range in frequency domain
measurements or the upper limit of a OSC level or dc bias sweep.
When the stimulus is in center/span mode, the span is shown in
this space. The stimulus values can be blanked (see \4Display5" in
Chapter 5).
13. CW Frequency
Displays the measurement frequency when the OSC level or dc bias
sweep is selected. When the frequency sweep is selected, this area is
blank.
14. Stimulus Center/Start Value
Displays either the start frequency of the sweep range for frequency
domain measurements or the lower power value in OSC level or dc
bias sweep. When the stimulus is in center/span mode, the center
stimulus value is shown in this space.
15. OSC Level
Displays the OSC level of the test signal output when the stimulus is
frequency or dc bias. When the OSC level is selected as stimulus, this
area is blank.
2-6 Front and Rear Panel, Test Station, and Test Heads
16. Status Notations
Displays the current status of various functions for the active
channel. The following notations are used:
3
V#
I#
COR
CO+
Cor
C+
C?
C+?
C!
C+!
CMP
Cmp
Cm?
Cm!
Del
Avg
D0M
D+M
D/M
D3M
G3
0O
G&O
Hld
"
ext
man
bus
Svc
Stimulus parameters changed: measured data in doubt until a complete
fresh sweep has been taken.
DC bias output is clamped to the current limit.
DC bias output is clamped to the voltage limit.
Error correction in xed cal points is on.
Error correction with low-loss capacitor in xed cal points is on.
Error correction in user cal points is on.
Error correction with low-loss capacitor in user cal points is on.
Stimulus parameters have changed and interpolated error correction in
user cal points is on.
Stimulus parameters have changed and interpolated error correction with
low-loss capacitor in user cal points is on.
Error correction in user cal points is on but questionable. Caused by
extrapolation.
Error correction with low-loss capacitor in user cal points is on but
questionable. Caused by extrapolation.
Fixture compensation in xed compensation points is on.
Fixture compensation in user compensation points is on.
Stimulus parameters have changed and interpolated xture compensation
is on.
Fixture compensation in user compensation points is on but questionable.
Caused by extrapolation.
Port extension has been added or subtracted. (Del stands for \delay".)
Sweep-by-sweep averaging is on. The averaging count is shown below.
Data math ( Data Trace 0 Memory Trace ) is on.
Data math ( Data Trace + Memory Trace ) is on.
Data math (Data Trace/Memory trace) is on.
Data math (Data Trace2Memory trace) is on.
Data math Gain is on.
Data math O set is on.
Data math Gain and O set are on.
Hold sweep.
Fast sweep indicator.
Waiting for external trigger (BNC in rear panel).
Waiting for manual trigger.
Waiting for GPIB trigger.
A service mode is turned on. If this notation is shown, the measurement
data will be out of speci cations. See Service Manual for more
information. (Service manual is furnished with Option 0BW.)
17. Equivalent Circuit Parameters
Displays equivalent circuit parameters by using menu accessed with
4Display5 key. See \Equivalent Circuit Menu" in Chapter 5.
18. External Reference
ExtRef is displayed when an external reference signal is connected to
the external reference input on the rear panel (even if phase is not
locked).
Front and Rear Panel, Test Station, and Test Heads 2-7
19. Active Entry Area
Displays the active function and its current value.
20. Message Area
Displays prompts or error messages. See \Error Messages" for more
information on error messages.
21. Title
Displays a descriptive alpha-numeric string title de ned by you and
entered as described in \4Display5" in Chapter 5.
2-8 Front and Rear Panel, Test Station, and Test Heads
Rear Panel Features and Connectors
Figure 2-3 shows the features and connectors on the rear panel.
Requirements for the input signals to the rear panel connectors are
provided in Chapter 12.
Figure 2-3. Analyzer Rear Panel
1. External Reference Input
Connects an external frequency reference signal to the analyzer that
is used to phase lock the analyzer for increased frequency accuracy.
When the analyzer is equipped with the external oven (option 1D5),
this connector must be connected to REF OVEN connector.
The external frequency reference function is automatically enabled
when a signal is connected to this input. When the signal is removed,
the analyzer automatically switches back to its internal frequency
reference.
Front and Rear Panel, Test Station, and Test Heads 2-9
2. Internal Reference Output
Connects to the frequency reference input of an external instrument
to phase lock it to the analyzer.
3. External Program RUN/CONT Input
Externally triggers run or cont of the HP Instrument BASIC program.
The positive edge of a pulse more than 20 s wide in the low state
triggers run or cont. The signal is TTL-compatible.
4. I/O Port
Connects to external devices such as a handler on a production line.
For more information on I/O port, see \I/O Port".
5. Power
This is input for the main power cable. Insert the main-power cable
plug only into a socket outlet that has a protective ground contact.
6 GPIB Interface
Connects the analyzer to an external controller and other instruments
in an automated system. This connector is also used when the
analyzer itself is the controller of compatible peripherals. See \GPIB"
in Chapter 8.
7. mini-DIN Keyboard Connector
Connects the keyboard that is usually used with HP Instrument
BASIC.
8. External Trigger Input
Triggers a measurement sweep. The positive (or negative) edge of
a pulse more than 20 s wide in the low (or high) state starts a
measurement. The signal is TTL-compatible. To use this connector, set
the trigger mode to external using softkey functions (see \4Trigger5" in
Chapter 6).
9. Reference Oven Output (Option 1D5 Only)
Connects to the EXT REF INPUT connector when option 1D5 is
installed. Option 1D5 improves the frequency accuracy and stability
of the analyzer.
10. Video Port
This terminal outputs measurement results to an external color
monitor. Color monitors supporting VGA (scan speed of 31.5 kHz) can
be connected to this terminal.
11. Printer Port
This interface enables the output of displayed results to a printer.
It complies with the Centronics parallel interface standard. See
\Printer" in Chapter 10 for supported printers.
2-10 Front and Rear Panel, Test Station, and Test Heads
I/O Port
Figure 2-4 shows the pin assignment of I/O port on the rear panel.
Figure 2-4. Pin Assignment of I/O Port
The signals carried through each pin are described below.
OUT 0 thru 7
Output signals to external devices. Controlled
by GPIB commands and HP Instrument BASIC
statements and functions, as described below. Once
SYST:COMM:PAR:TRAN:DATA is executed, the signal
is latched until this command is executed again or
power off.
IN 0 thru 4
Input signals from external devices. Read by
the GPIB command SYST:COMM:PAR:DATA?, as
described below.
Related GPIB Commands
There are two GPIB commands that directly control an I/O port.
SYST:COMM:PAR:TRAN:DATA
This command outputs 8-bit data to the OUT 0 thru 7 lines. The
OUT 0 signal is the LSB (least signi cant bit). The OUT 7 signal
is the MSB (most signi cant bit).
SYST:COMM:PAR:DATA?
This command inputs data from the 4-bit parallel input port to
the analyzer, and outputs the data to the controller.
Related HP Instrument BASIC Statement and Function
HP Instrument BASIC can access an I/O port directly by using the
following statement and function.
WRITEIO 15,0;A
This statement outputs decimal value, A, as 8-bit data to
the OUT 0 thru 7 lines. The OUT 0 signal is the LSB (least
signi cant bit). The OUT 7 signal is the MSB (most signi cant
bit).
READIO(15,0)
Front and Rear Panel, Test Station, and Test Heads 2-11
This function inputs data from the 4-bit parallel input port to
the analyzer, and returns the data to the HP Instrument BASIC
program.
Circuit of I/O Port
Figure 2-5 shows the internal circuits of the I/O port.
Figure 2-5. Circuit of I/O Port
Connector
D-SUB 15 pin
2-12 Front and Rear Panel, Test Station, and Test Heads
Test Station
Figure 2-6. Test Station
1. Cable
Connects to test station to the front panel of the main frame.
2. Test Fixture Mounting Posts
Locates and positions a test xture to be used.
3. Test Fixture Mounting Screws
Fixes a test xture to be used.
4. Test Head Connectors
Connects to a test head.
Caution
Protect the instrument from ESD damage by wearing a
grounding strap that provides a high resistance path to ground.
Alternatively, ground yourself to discharge any static charge built-up
by touching the outer shell of any grounded instrument chassis before
touching the test port connectors.
Front and Rear Panel, Test Station, and Test Heads 2-13
5. Heat Sink
Sinks heat of the test station. When you install the test station, you
keep space around heat sink in order to radiate heat as shown in
Figure 2-7.
Figure 2-7. Keeping Space Around the Heat Sink
6. Test Station Mounting Screws
Fixes the test station to the peripheral, such as handler. See
Figure 2-8 for the dimensions of the test station mounting screws.
Figure 2-8. Dimensions of Test Station
2-14 Front and Rear Panel, Test Station, and Test Heads
Test Heads
Figure 2-9. Test Heads
1. Connectors
Connects to the test station.
2. APC-7 R Connector
Connects to a test xture.
These terminals comply with INSTALLATION CATEGORY I of IEC
1010-1.
3. Knobs
Fixes the test head to the test station.
High Impedance Measurement Test Head
This test head is designed to measure high impedance with better
accuracy. As a guide, when the impedance value of a DUT is grater
than about 300 , use the high impedance measurement test head.
This test head is furnished with 4291B. This test head is also used
with the 16453A Dielectric Material Test Fixture.
The impedance measurement accuracy using this test set is shown in
the Chapter 12 (bound with this manual).
Front and Rear Panel, Test Station, and Test Heads 2-15
Low Impedance Measurement Test Head (Option 012 only)
This test head is designed to measure low impedance with better
accuracy. As a guide, when the impedance value of a DUT is less than
about 5 , use the low impedance measurement test head. This test
head is furnished with Option 012. This test head is also used with
the 16454A Magnetic Material Test Fixture.
The impedance measurement accuracy using this test set is shown in
the Chapter 12 (bound with this manual).
When impedance of a DUT is almost in the range from 5
test heads can be used.
to 300 , either or both
High Temperature High Impedance Test Head (Option 013 only)
This test head is designed to measure high impedance components
or materials in wide temperature range. The analyzer can measure
components or materials in temperature range from 055 C through
+200 C, when this test head is used with the 16194A High
temperature component xture or the 16453A Dielectric Material Test
Fixture. This test head is furnished with Option 013.
The dimensions of this test head and the impedance measurement
accuracy using this test set is shown in the Chapter 12 (bound with
this manual).
High Temperature Low Impedance Test Head (Option 014 only)
This test head is designed to measure low impedance component
or material in high temperature condition. The analyzer can
measure components or materials in temperature range from 055 C
through +200 C, when this test head is used with the 16194A High
temperature component xture or the 16454A Magnetic Material Test
Fixture. This test head is furnished with Option 014.
The dimensions of this test head and the impedance measurement
accuracy using this test set is shown in the Chapter 12 (bound with
this manual).
2-16 Front and Rear Panel, Test Station, and Test Heads
Handling and Storage APC-7 R Connectors
Keep connectors clean.
Do not touch the mating plane surfaces.
Do not set connectors contact-end down.
Before storing, extend the sleeve.
Use end caps over the mating plane surfaces.
Never store connectors loose in a box or a drawer.
Microwave connectors must be handled carefully, inspected before use, and when not
in use stored in a way that gives them maximum protection.
Avoid touching the connector mating plane surfaces and avoid setting the connector's
contact-end down on any hard surface. Natural skin oils and microscopic particles of
dirt are easily transferred to the connector interface and are very dicult to remove.
Damage to the plating and to the mating plane surface occurs readily when the
interface comes in contact with any hard surface.
Never store connectors with the contact end exposed. End caps are provided with all
Agilent Technologies connectors, and these should be retained after unpacking and
placed over the ends of the connectors whenever they are not in use.
Above all, never store any devices loose in a box or in a desk or a bench drawer.
Careless handling of this kind is the most common cause of connector damage during
storage.
Calibration devices and test xtures should be stored in a foam-lined storage case,
and protective end caps should always be placed over the ends of all connectors.
Cables should be stored in the same shape as they have when they are used - they
should not be straightened - and end caps should be placed over both connectors.
The following gure summarizes these Agilent Technologies recommendations on
handling and storing devices that have microwave connectors.
Handle and Store Connectors Carefully
Never Place Connectors Contact-End Down
Use End Caps
Extend threads fully when end caps are not used
Use foam-lined storage cases if available
Never store devices loose in a box or in a desk or bench drawer
Front and Rear Panel, Test Station, and Test Heads 2-17
3
Active Channel Block
The analyzer has two active channels (Figure 3-1) that provide
independent display of data. Two di erent sets of data can be
measured simultaneously (for example, one measurement with two
di erent frequency spans). The data can be displayed separately or
simultaneously.
Figure 3-1. Active Channel Keys
Active Channel Block 3-1
4Chan 15
and 4Chan 25
The 4Chan 15 and 4Chan 25 keys select which channel is the active
channel.
Active Channel
This is the channel currently controlled by the front panel keys.
The active channel trace and data annotations are displayed on the
display. All the channel speci c functions that are selected apply to
the active channel. The current active channel is indicated by an
amber LED adjacent to the corresponding channel key.
The analyzer has dual trace capability, so that both the active and
inactive channel traces can be displayed, either overlaid or on
separate graticules (split display). The dual channel and split display
features are available in the display menus.
Coupling Channels
Stimulus Coupling
The stimulus values can be coupled or uncoupled between the
two channels (independent of the dual channel and split display
functions). See \Sweep Menu" in Chapter 6 for a listing of the
stimulus value that are coupled in the channel couple mode.
Marker Coupling
Another coupling capability is coupled markers. The measurement
markers can have the same stimulus values for the two channels or
they can be uncoupled for independent control in each channel. See
Chapter 7 for more information about markers.
3-2 Active Channel Block
4
Entry Block
The ENTRY block (Figure 4-1) contains the numeric and unit's
keypad, the knob, and the step keys. These controls are used in
combination with other front panel keys and softkeys to modify the
active entry, to enter or change numeric data, and to change the
value of the marker. In most cases, the keypad, knob, and step keys
can be used interchangeably.
Before a function can be modi ed, it must be made the active
function by pressing a front panel key or softkey. It can then be
modi ed directly with the knob, the step keys, or the digits' keys and
a terminator.
Figure 4-1. Entry Block
Entry Block 4-1
Numeric Keypad
The numeric keypad selects digits, decimal point, and minus sign for
numerical entries. A unit's terminator is required to complete the
entry.
Terminator Keys
The unit's terminator keys are the four keys in the right-hand
column of the keypad. These specify units of numerical entries
from the keypad and also terminate the entries. A numerical entry
is incomplete until a terminator is entered. When a terminator is
required, the data entry arrow \ " points at the last entered digit in
the active entry area. When the unit's terminator key is pressed, the
arrow is replaced by the units selected. The units are abbreviated on
the terminator keys as follows:
4G/n5
4M/5
4k/m5
4x15
Knob
*
4 5
and 4+5
4-2 Entry Block
Giga/nano (109 / 1009 )
Mega/micro (106 / 1006 )
kilo/milli (103 / 1003 )
basic units: dB, dBm, degrees, seconds,
Hz, V, A, F, H, , or S. (may be used
to terminate unitless entries such as
averaging factor).
The knob adjusts the current values continuously for functions
such as scale, reference level, and others. If a marker is on, and no
other function is active, the knob can adjust the marker position.
Values changed by the knob are e ective immediately and require no
terminator.
The 4+5 and 4*5 keys step the current value of the active function up
or down. The steps are predetermined and cannot be altered. No
unit's terminator is required with these two keys.
4Entry O 5
Clears and turns o the active entry area and any displayed prompts,
error messages, or warnings. Use 4Entry O 5 to clear the display before
plotting. This key also prevents active values from being changed by
accidentally moving the knob. The next function selected turns the
active entry area back on.
4Back Space5
Deletes the last entry (or the last digit entered from the numeric
keypad).
Entry Block 4-3
5
Measurement Block
The measurement block keys and associated menus provide control
of measurement parameter, display, equivalent circuit analysis,
averaging, calibration, and xture compensation. The following list
shows the functions controlled by each key in the measurement block.
Figure 5-1. Measurement Block
4Meas5
4Format5
4Display5
4Scale
Ref5
4Bw/Avg5
4Cal5
Selecting parameter to be measured
Selecting test xture (impedance, permittivity ", and permeability
xtures)
Selecting display format such as rectangular, Smith chart,
admittance chart, polar chart, and complex plane.
Selecting display trace (data and memory)
Storing data trace to memory trace
Selecting display mode
Dual/Single channel
Split/Override
Allocating screen between analyzer and HP Instrument BASIC.
Performing trace math
Displaying titles and text
Erase frequency display
Adjusting display color and intensity
Calculating equivalent circuit parameters and simulating
equivalent circuit
Displaying user traces
Scaling trace
Controlling averaging function
Performing calibration and xture compensation measurement
De ning standard kits for calibration and xture compensation
Measurement Block 5-1
Functions accessed from this block
Admittance chart format
Averaging
BASIC screen
Cal kit de nition
Calibration
Complex plan format
Display adjust (Color adjust)
Dual parameter setting
Equivalent circuit
Fixture compensation
Frequency Blank
Linear rectangular format
Log rectangle format
Material measurement
Measurement parameter selection
Memory trace
OPEN, SHORT, or LOAD de nition for xture
compensation
Polar chart format
Scaling trace
Smith chart format
Single parameter setting
Split display and override
Test xture selection
Trace math
Tittle and text on the screen (labeling graphics)
You can access
from . . .
4Format5
4Bw/Avg5
4Display5
4Cal5
4Cal5
4Format5
4Display5
4Meas5
4Display5
4Cal5
4Display5
4Format5
4Format5
4Meas5
4Meas5
4Display5
4Cal5
4Format5
4Scale/Ref5
4Format5
4Meas5
4Display5
4Meas5
4Display5
4Display5
For Additional Information on . . .
Preset values and Setting Range of each function setting value
All Softkey Trees
GPIB Command Reference
How to control the 4291B using an external controller or the HP
Instrument BASIC capability through the GPIB.
5-2 Measurement Block
See the following section in this
chapter:
Format menu
Averaging menu
Display menu
Calibration menu
Calibration menu
Format menu
Display menu
Measurement menu
Display menu
Calibration menu
Display menu
Format menu
Format menu
Fixture menu
Impedance Measurement Menu
Display menu
Calibration menu
Format menu
Scale menu
Format menu
Measurement menu
Display menu
Test Fixture Selection
Display menu
Display menu
See . . .
Appendix B in this manual
Appendix C in this manual
GPIB Command Reference in the
Programming Manual
Programming Manual
4Meas5
4Meas5
Figure 5-2. Softkey Menus Accessed from the 4Meas5 Key for Impedance Measurement
Measurement Block 5-3
4Meas5
Figure 5-3. Softkey Menus Accessed from the 4Meas5 Key for Permittivity Measurement
5-4 Measurement Block
4Meas5
Figure 5-4. Softkey Menus Accessed from the 4Meas5 Key for Permeability Measurement
Measurement Block 5-5
4Meas5
Figure 5-5.
Softkey Menus Accessed from the 4Meas5 Key for Impedance Measurement (when
Smith/Polar/Admittance or Complex-Plane Format is selected)
5-6 Measurement Block
4Meas5
Figure 5-6.
Softkey Menus Accessed from the 4Meas5 Key for Permittivity Measurement (when
Smith/Polar/Admittance or Complex-Plane Format is selected)
Measurement Block 5-7
4Meas5
Figure 5-7.
Softkey Menus Accessed from the 4Meas5 Key for Permeability Measurement (when
Smith/Polar/Admittance or Complex-Plane Format is selected)
5-8 Measurement Block
4Meas5
(Impedance Measurement)
Impedance Measurement Menu
Figure 5-8. Impedance Measurement Menu
NNNNNNNNNNNNNNNNNNNNNNNNNNNNNNNNNNNNNNNNNNNNNNNNNNNNNNNN
IMPEDANCE:MAG(|Z|) Measures absolute magnitude value of
impedance (jZj).
PHASE(z) Measures phase value of impedance (z ).
RESIST(R) Measures resistance value (R).
NNNNNNNNNNNNNNNNNNNNNNNNNNNNN
NNNNNNNNNNNNNNNNNNNNNNNNNNNNN
Measurement Block 5-9
4Meas5
(Impedance Measurement)
NNNNNNNNNNNNNNNNNNNNNNNNNN
REACT(X) Measures reactance value (X).
NNNNNNNNNNNNNNNNNNNNNNNNNNNNNNNNNNNNNNNNNNNNNNNNNNNNNNNN
ADMITTNCE:MAG(|Y|) Measures absolute magnitude value of
admittance (jYj).
PHASE(y) Measures phase value of admittance (y ).
CONDUCT(G) Measures conductance value (G).
SUSCEPT(B) Measures susceptance value (B).
REFL.COEF:MAG(|0|) Measures absolute magnitude value of
re ection coecient (j0j).
PHASE(0) Measures phase value of re ection coecient ( ).
REAL(0x) Measures real part of re ection coecient (0x ).
IMAG(0y) Measures imaginary part of re ection coecient
(0y ).
CAPCITNCE:PRL(Cp) Measures parallel capacitance (Cp ),
which is used for small capacitance measurement.
SER(Cs) Measures series capacitance (Cs ), which is used for
large capacitance measurement.
INDUCTNCE:PRL(Lp) Measures parallel inductance (Lp ),
which is used for large inductance measurement.
SER(Ls) Measures series inductance (Ls ), which is used for
small inductance measurement.
RESISTNCE:PRL(Rp) Measures parallel resistance (Rp ),
which is used for large resistance, large inductance, or
small capacitance.
SER(Rs) Measures series resistance (Rs ), which is used for
small resistance, small inductance, or large capacitance.
D FACTOR (D) Measures dissipation factor (D).
Q FACTOR (Q) Measures quality factor (Q).
DUAL PARAMETER Leads to the Dual Parameter Menu, which is
used to select parameters to be measured for both channels with
one-key stroke.
FIXTURE [ ] Leads to the Fixture Menu, which is used to select
the test xture used with the analyzer. The selected test xture is
displayed in brackets in the softkey label.
NNNNNNNNNNNNNNNNNNNNNNNNNNNNN
NNNNNNNNNNNNNNNNNNNNNNNNNNNNNNNN
NNNNNNNNNNNNNNNNNNNNNNNNNNNNNNNN
NNNNNNNNNNNNNNNNNNNNNNNNNNNNNNNNNNNNNNNNNNNNNNNNNNNNNNNN
NNNNNNNNNNNNNNNNNNNNNNNNNNNNN
NNNNNNNNNNNNNNNNNNNNNNNNNN
NNNNNNNNNNNNNNNNNNNNNNNNNN
NNNNNNNNNNNNNNNNNNNNNNNNNNNNNNNNNNNNNNNNNNNNNNNNNNNNN
NNNNNNNNNNNNNNNNNNNNNNN
NNNNNNNNNNNNNNNNNNNNNNNNNNNNNNNNNNNNNNNNNNNNNNNNNNNNN
NNNNNNNNNNNNNNNNNNNNNNN
NNNNNNNNNNNNNNNNNNNNNNNNNNNNNNNNNNNNNNNNNNNNNNNNNNNNN
NNNNNNNNNNNNNNNNNNNNNNN
NNNNNNNNNNNNNNNNNNNNNNNNNNNNNNNNNNNNNN
NNNNNNNNNNNNNNNNNNNNNNNNNNNNNNNNNNNNNN
NNNNNNNNNNNNNNNNNNNNNNNNNNNNNNNNNNNNNNNNNNNN
NNNNNNNNNNNNNNNNNNNNNNNNNNNNNNNNNNN
5-10 Measurement Block
4Meas5
(Impedance Measurement)
Complex Impedance Measurement Menu
Figure 5-9. Complex Impedance Measurement Menu
This softkey menu can be accessed at the following conditions:
Format : the polar, Smith, admittance, or complex plane format is selected.
Fixture : Impedance is selected.
NNNNNNNNNNNNNNNNNNNNNNNNNNNNNNNNNNNNNNNNN
IMPEDANCE (Z) Measures complex impedance when the polar
or complex plane format is selected. This softkey is not available
when Smith chart or admittance chart is selected.
ADMITTANCE (Y) Measures complex admittance when the polar
or complex plane format is selected. This softkey is not available
when Smith chart or admittance chart is selected.
REFL. COEF(0) Measures re ection coecient when the Smith,
admittance, polar or complex plane format is selected.
DUAL PARAMETER This softkey is not available for Smith,
admittance, polar chart, and complex plane formats.
FIXTURE [ ] Leads to the Fixture Menu, which is used to select
the test xture used with the analyzer. The selected test xture is
displayed in brackets in the softkey label.
MATERIAL SIZE This softkey is not available when the xture for
impedance measurement is selected.
NNNNNNNNNNNNNNNNNNNNNNNNNNNNNNNNNNNNNNNNNNNN
NNNNNNNNNNNNNNNNNNNNNNNNNNNNNNNNNNNNNNNNN
NNNNNNNNNNNNNNNNNNNNNNNNNNNNNNNNNNNNNNNNNNNN
NNNNNNNNNNNNNNNNNNNNNNNNNNNNNNNNNNN
NNNNNNNNNNNNNNNNNNNNNNNNNNNNNNNNNNNNNNNNN
Measurement Block 5-11
4Meas5
(Impedance Measurement)
Dual Parameter Menu
Figure 5-10. Dual Parameter Menu
|Z|- Measures jZj on channel 1 and measures on channel 2.
NNNNNNNNNNNNNNNNN
NNNNNNNNNNN
R-X Measures R on channel 1 and measures X on channel 2.
|Y|- Measures jYj on channel 1 and measures on channel 2.
NNNNNNNNNNNNNNNNN
NNNNNNNNNNN
G-B Measures G on channel 1 and measures B on channel 2.
NNNNNNNNNNNNNN
Ls-Q Measures Ls on channel 1 and measures Q on channel 2.
NNNNNNNNNNNNNN
Lp-Q Measures Lp on channel 1 and measures Q on channel 2.
NNNNNNNNNNNNNN
Cs-D Measures Cs on channel 1 and measures D on channel 2.
NNNNNNNNNNNNNN
Cp-D Measures Cp on channel 1 and measures D on channel 2.
SINGLE PARAMETER Leads to the Impedance Measurement Menu.
NNNNNNNNNNNNNNNNNNNNNNNNNNNNNNNNNNNNNNNNNNNNNNNNNN
FIXTURE [ ] Leads to the Fixture Menu, which is used to select
the test xture used with the analyzer. The selected test xture is
displayed in brackets in the softkey label.
NNNNNNNNNNNNNNNNNNNNNNNNNNNNNNNNNNN
5-12 Measurement Block
4Meas5
(Impedance Measurement)
Measurement Parameters Summary
Complex Impedance Parameters
Impedance magnitude jZj
Impedance phase z
Resistance R
Reactance X
Complex Admittance Parameters
Admittance magnitude jYj
Admittance phase y
Resistance G
Reactance B
Re ection Coecient
Re ection coecient magnitude j0j
Re ection coecient phase Real part of re ection coecient 0x
Imaginary part of re ection coecient 0y
Serial Circuit parameter
Serial capacitance Cs
Serial inductance Ls
Serial resistance Rs
Parallel Circuit parameter
Parallel capacitance Cp
Parallel inductance Lp
Parallel resistance Rp
Loss
Dessipation factor D
Quality factor Q
Note
For more information on measurement parameters and serial and
parallel circuit models (such as de nitions, conversion between
parameters, and the selection guide for circuit models), see
\Impedance parameters" in Chapter 11 and \Series and Parallel
Circuit Models" in Chapter 11.
Measurement Block 5-13
4Meas5
(Impedance Measurement)
Impedance Fixture Menu (No option 002)
Figure 5-11. Impedance Fixture Menu (No option 002)
NNNNNNNNNNNNNNNNNNNNNNNNNNNNNNNNNNN
FIXTURE [ ] Leads to the following softkeys, which are used to
select test xture for impedance measurement.
FIXTURE:NONE Sets zero as the electrical length value. As the
case you do the load compensation, select this setting.
16191 Sets the electrical length that is suitable for the 16191A.
16192 Sets the electrical length that is suitable for the 16192A.
16193 Sets the electrical length that is suitable for the 16193A.
16194 Sets the electrical length that is suitable for the 16194A.
USER Sets the electrical length that is a user de ned value.
SAVE USER FXTR Saves extension value and label as a user
de ned xture.
MODIFY [ ] Leads to the following softkeys, which are used to
de ne the electrical length and label of a selected xture.
DEFINE EXTENSION Makes the extension value of the selected
xture the active function to de ne extension value.
LABEL FIXTURE Makes the xture label name the active
function to de ne it.
KIT DONE (MODIFIED) Completes the procedure to de ne the
selected xture.
NNNNNNNNNNNNNNNNNNNNNNNNNNNNNNNNNNNNNN
NNNNNNNNNNNNNNNNN
NNNNNNNNNNNNNNNNN
NNNNNNNNNNNNNNNNN
NNNNNNNNNNNNNNNNN
NNNNNNNNNNNNNN
NNNNNNNNNNNNNNNNNNNNNNNNNNNNNNNNNNNNNNNNNNNN
NNNNNNNNNNNNNNNNNNNNNNNNNNNNNNNN
NNNNNNNNNNNNNNNNNNNNNNNNNNNNNNNNNNNNNNNNNNNNNNNNNN
NNNNNNNNNNNNNNNNNNNNNNNNNNNNNNNNNNNNNNNNN
NNNNNNNNNNNNNNNNNNNNNNNNNNNNNNNNNNNNNNNNNNNNNNNNNNNNNNNNNNN
5-14 Measurement Block
4Meas5
(Impedance Measurement)
Impedance Fixture Menu (Option 002 only)
Figure 5-12. Impedance Fixture Menu (Option 002 only)
This section describes the softkeys
that can be accessed when Option 002 (Material
FFFFFFFFFFFFFFFFFFFFFFFFFFFFFFFFFF
Measurement) is installed and IMPEDANCE [ ] is selected in this menu.
NNNNNNNNNNNNNNNNNNNNNNNNNNNNNNNNNNNNNNNNN
IMPEDANCE [ ] Selects the impedance measurement. When this
softkey is selected, the menu accessed from the SELECT FIXTURE
softkey lists only the impedance xtures. The 4Meas5 and 4Cal5 keys
lead only to the menus related to the impedance measurement.
When a xture has been speci ed, its label is displayed in brackets
in the softkey label.
PERMITTVTY 16453 Selects permittivity measurement. This
function doesn't sets the electrical length. When this softkey is
selected, the 4Meas5 and 4Cal5 keys lead only to the menus related to
the permittivity measurement.
PERMEABILITY [16454( )] Selects the permeability measurement.
When this softkey is selected, the menu accessed from the
SELECT FIXTURE softkey lists only magnetic material xtures.
The 4Meas5 and 4Cal5 keys lead only to the menus related to the
permeability measurement. When a xture size has been speci ed,
the size is displayed in parenthesis in the softkey label.
SELECT FIXTURE Leads to the following softkeys, which are used
to select test xture for impedance measurement.
FIXTURE:NONE Sets zero as the electrical length value. As the
case you do the load compensation, select this setting.
16191 Sets the electrical length that is suitable for the 16191A.
NNNNNNNNNNNNNNNNNNNNNNNNNNNNNNNNNNNNNNNNNNNN
NNNNNNNNNNNNNNNNNNNNNNNNNNNNNNNNNNNNNNNNNNNNNNNNNN
NNNNNNNNNNNNNNNNNNNNNNNNNNNNNNNNNNNNNNNNNNNNNNNNNNNNNNNNNNNNNNNNNNNNNNN
NNNNNNNNNNNNNNNNNNNNNNNNNNNNNNNNNNNNNNNNNNNN
NNNNNNNNNNNNNNNNNNNNNNNNNNNNNNNNNNNNNNNNNNNN
NNNNNNNNNNNNNNNNNNNNNNNNNNNNNNNNNNNNNN
NNNNNNNNNNNNNNNNN
Measurement Block 5-15
4Meas5
(Impedance Measurement)
NNNNNNNNNNNNNNNNN
16192 Sets the electrical length that is suitable for the 16192A.
NNNNNNNNNNNNNNNNN
16193 Sets the electrical length that is suitable for the 16193A.
NNNNNNNNNNNNNNNNN
16194 Sets the electrical length that is suitable for the 16194A.
NNNNNNNNNNNNNN
USER Sets the electrical length, which is a user de ned value.
NNNNNNNNNNNNNNNNNNNNNNNNNNNNNNNNNNNNNNNNNNNN
SAVE USER FXTR Saves the extension value and label of a user
de ned xture.
MODIFY [ ] Leads to the following softkeys, which are used to
de ne the electrical length and label of a user's xture.
DEFINE EXTENSION Makes the extension value of the user
de ned xture the active function to de ne its value.
LABEL FIXTURE Makes the xture label name the active
function to de ne it.
KIT DONE (MODIFIED) Completes the procedure to de ne the
user xture and save it.
NNNNNNNNNNNNNNNNNNNNNNNNNNNNNNNN
NNNNNNNNNNNNNNNNNNNNNNNNNNNNNNNNNNNNNNNNNNNNNNNNNN
NNNNNNNNNNNNNNNNNNNNNNNNNNNNNNNNNNNNNNNNN
NNNNNNNNNNNNNNNNNNNNNNNNNNNNNNNNNNNNNNNNNNNNNNNNNNNNNNNNNNN
What is xture setting?
Fixture menu sets the electrical length in order to cancel errors caused by an
additional impedance in a distributed element of a coaxial coupling terminal between
the APC-7 connector and the contact electrode of a xture. And this setting doesn't
in uence calibration. For more information on xture characteristics, see \Fixture
Compensation" in Chapter 11. About the relation between xture setting and
calibration, see Figure 9-2.
User xture de nition is backed up by battery
The analyzer keeps the de nition of a user xture in the battery backup memory to
ensure that the de nition is retained even if the analyzer is turned o .
It is not necessary to set test xture in this menu when . . .
When you perform all three xture compensation measurements (OPEN, SHORT, and
LOAD), it is not necessary to specify the test xture in this menu. Because OPEN,
SHORT and
LOAD compensation will remove errors caused by the phase shift, be sure
FFFFFFFFFFFFFFFFFFFFFFFFFFFFFFF
to select FIXTURE:NONE before the compensation measurements are performed.
When you perform only one or two compensation measurements (OPEN and/or
SHORT), you should specify the applicable xture using this menu.
5-16 Measurement Block
4Meas5
(Dielectric Material Measurement)
Permittivity Measurement Menu (Option 002 only)
Figure 5-13. Permittivity Measurement Menu (Option 002 only)
PRMITTVTY:REAL("0r ) Measures e ective relative permittivity ("0 r ).
NNNNNNNNNNNNNNNNNNNNNNNNNNNNNNNNNNNNNNNNNNNNNNNNNNNNNNNN
LOSS FACTR ("00 r ) Measures relative dielectric loss factor ("00 r ).
NNNNNNNNNNNNNNNNNNNNNNNNNNNNNNNNNNNNNNNNNNNNNNNNN
NNNNNNNNNNNNNNNNNNNNNNNNNNNNNNNNNNNNNNNNNNNNNNNNNNNN
LOSS TNGNT (tan ) Measures dielectric dissipation factor
(dielectric loss tangent; tan ).
MAG(|"r|) Measures absolute magnitude value of permittivity (j"r j).
MORE 1/6 leads the following softkeys, which is used to masure
impedance parameter as same as the Impedance Measurement
menu.
NNNNNNNNNNNNNNNNNNNNNNNNNNNN
NNNNNNNNNNNNNNNNNNNNNNNNNN
Measurement Block 5-17
4Meas5
(Dielectric Material Measurement)
NNNNNNNNNNNNNNNNNNNNNNNNNNNNNNNNNNNNNNNNNNNNNNNNNNNNNNNN
IMPEDANCE:MAG(|Z|) Measures absolute magnitude value of
impedance (jZj).
PHASE(z) Measures phase value of impedance (z ).
NNNNNNNNNNNNNNNNNNNNNNNNNNNNN
NNNNNNNNNNNNNNNNNNNNNNNNNNNNN
RESIST(R) Measures resistance value (R).
NNNNNNNNNNNNNNNNNNNNNNNNNN
REACT(X) Measures reactance value (X).
NNNNNNNNNNNNNNNNNNNNNNNNNNNNNNNNNNNNNNNNNNNNNNNNNNNNNNNN
ADMITTNCE:MAG(|Y|) Measures absolute magnitude value of
admittance (jYj).
PHASE(y) Measures phase value of admittance (y ).
NNNNNNNNNNNNNNNNNNNNNNNNNNNNN
NNNNNNNNNNNNNNNNNNNNNNNNNNNNNNNN
CONDUCT(G) Measures conductance value (G).
NNNNNNNNNNNNNNNNNNNNNNNNNNNNNNNN
SUSCEPT(B) Measures susceptance value (B).
NNNNNNNNNNNNNNNNNNNNNNNNNNNNNNNNNNNNNNNNNNNNNNNNNNNNNNNN
REFL.COEF:MAG(|0|) Measures absolute magnitude value of
re ection coecient (j0j).
PHASE(0) Measures phase value of re ection coecient
( ).
REAL(0x) Measures real part of re ection coecient (0x ).
NNNNNNNNNNNNNNNNNNNNNNNNNNNNN
NNNNNNNNNNNNNNNNNNNNNNNNNN
NNNNNNNNNNNNNNNNNNNNNNNNNN
IMAG(0y) Measures imaginary part of re ection coecient
(0y ).
CAPCITNCE:PRL(Cp) Measures parallel capacitance (Cp ),
which is used for small capacitance measurement.
SER(Cs) Measures series capacitance (Cs ), which is used
for large capacitance measurement.
INDUCTNCE:PRL(Lp) Measures parallel inductance (Lp ),
which is used for large inductance measurement.
SER(Ls) Measures series inductance (Ls ), which is used
for small inductance measurement.
RESISTNCE:PRL(Rp) Measures parallel resistance (Rp ),
which is used for large resistance, large inductance, or
small capacitance.
SER(Rs) Measures series resistance (Rs ), which is
used for small resistance, small inductance, or large
capacitance.
D FACTOR (D) Measures dissipation factor (D).
Q FACTOR (Q) Measures quality factor (Q).
DUAL PARAMETER Leads to the Dual Parameter menu, which are
used to select parameters to be measured for both channels with
one-key stroke.
FIXTURE [16453] Leads to the Fixture Menu, which is used to
select the test xture used with the analyzer. 16453 is displayed in
brackets in the softkey label when the permittivity measurement
menu is accessed.
MATERIAL SIZE Leads to the Material Size Menu, which is used to
set the thickness of the dielectric material to be measured.
NNNNNNNNNNNNNNNNNNNNNNNNNNNNNNNNNNNNNNNNNNNNNNNNNNNNN
NNNNNNNNNNNNNNNNNNNNNNN
NNNNNNNNNNNNNNNNNNNNNNNNNNNNNNNNNNNNNNNNNNNNNNNNNNNNN
NNNNNNNNNNNNNNNNNNNNNNN
NNNNNNNNNNNNNNNNNNNNNNNNNNNNNNNNNNNNNNNNNNNNNNNNNNNNN
NNNNNNNNNNNNNNNNNNNNNNN
NNNNNNNNNNNNNNNNNNNNNNNNNNNNNNNNNNNNNN
NNNNNNNNNNNNNNNNNNNNNNNNNNNNNNNNNNNNNN
NNNNNNNNNNNNNNNNNNNNNNNNNNNNNNNNNNNNNNNNNNNN
NNNNNNNNNNNNNNNNNNNNNNNNNNNNNNNNNNNNNNNNNNNNNNN
NNNNNNNNNNNNNNNNNNNNNNNNNNNNNNNNNNNNNNNNN
5-18 Measurement Block
4Meas5
(Dielectric Material Measurement)
Complex Permittivity Measurement Menu (Option 002 only)
Figure 5-14. Complex Permittivity Measurement Menu (Option 002 only)
This softkey menu can be accessed at the following conditions:
Format : the polar, Smith, admittance, or complex plane format is selected.
Fixture : 16453A is selected.
NNNNNNNNNNNNNNNNNNNNNNNNNNNNNNNNNNNNNNNNN
IMPEDANCE (Z) Measures complex impedance on the polar or
complex plane format. This softkey is not available when Smith or
admittance chart is selected.
ADMITTANCE (Y) Measures complex admittance on the polar or
complex plane format. This softkey is not available when Smith or
admittance chart is selected.
REFL. COEF(0) Measures complex impedance on Smith,
admittance, polar or complex plane format.
PERMITTVTY (") Measures complex relative permittivity on the
polar or complex plane format. This softkey is not available when
Smith or admittance chart is selected.
DUAL PARAMETER This softkey is not available for Smith,
admittance, polar chart, and complex plane formats.
FIXTURE [ ] Leads to the Fixture Menu, which is used to select
the test xture used with the analyzer. The selected test xture is
displayed in brackets in the softkey label.
MATERIAL SIZE Leads to the Material Size Menu, which is used to
set thickness of the dielectric material to be measured.
NNNNNNNNNNNNNNNNNNNNNNNNNNNNNNNNNNNNNNNNNNNN
NNNNNNNNNNNNNNNNNNNNNNNNNNNNNNNNNNNNNNNNN
NNNNNNNNNNNNNNNNNNNNNNNNNNNNNNNNNNNNNNNNNNN
NNNNNNNNNNNNNNNNNNNNNNNNNNNNNNNNNNNNNNNNNNNN
NNNNNNNNNNNNNNNNNNNNNNNNNNNNNNNNNNN
NNNNNNNNNNNNNNNNNNNNNNNNNNNNNNNNNNNNNNNNN
Measurement Block 5-19
4Meas5
(Dielectric Material Measurement)
Dual Parameter Menu (Dielectric Material Measurement)
Figure 5-15.
Dual Parameter Menu (Dielectric Material Measurement)
"0 r -"00 r Measures "0 r on channel 1 and measures "00 r on channel 2.
"0 r -tan Measures "0 r on channel 1 and measures tan on channel
NNNNNNNNNNNNNNNNNNN
NNNNNNNNNNNNNNNNNNNNNNN
2.
"00 r -tan Measures "00 r on channel 1 and measures tan on channel
2.
|"r |-tan Measures j"r j on channel 1 and measures tan on
channel 2.
SINGLE PARAMETER Leads to the Permittivity Measurement Menu.
FIXTURE [16453] Leads to the Dielectric Material Fixture Menu,
which is used to select test xture used with the analyzer. The
selected test xture is displayed in brackets in the softkey label.
MATERIAL SIZE Leads to the Dielectric Material Size Menu, which
is used to set thickness of the dielectric material to be measured.
NNNNNNNNNNNNNNNNNNNNNNNN
NNNNNNNNNNNNNNNNNNNNNNNNNNNN
NNNNNNNNNNNNNNNNNNNNNNNNNNNNNNNNNNNNNNNNNNNNNNNNNN
NNNNNNNNNNNNNNNNNNNNNNNNNNNNNNNNNNNNNNNNNNNNNNN
NNNNNNNNNNNNNNNNNNNNNNNNNNNNNNNNNNNNNNNNN
5-20 Measurement Block
4Meas5
(Dielectric Material Measurement)
Dielectric Material Fixture Menu (Option 002 only)
Figure 5-16. Dielectric Material Fixture Menu (Option 002 only)
This section describes the softkeys
that can be accessed when Option 002 (Material
FFFFFFFFFFFFFFFFFFFFFFFFFFFFFFFFFFFFFFFFF
Measurement) is installed and PERMITTVTY 16453 is selected in this menu.
NNNNNNNNNNNNNNNNNNNNNNNNNNNNNNNNNNNNNNNNN
IMPEDANCE [ ] Selects the impedance measurement. When this
softkey is selected, the menu accessed from the SELECT FIXTURE
softkey lists only impedance xtures. The 4Meas5 and 4Cal5 keys lead
only to the menus related to the impedance measurement. When a
xture has been speci ed, its label is displayed in brackets in the
softkey label.
PERMITTVTY 16453 Selects the permittivity measurement. This
function doesn't set the electrical length. When this softkey is
selected, the 4Meas5 and 4Cal5 keys lead only to the menus related to
the permittivity measurement.
PERMEABILITY 16454( ) Selects the permeability measurement.
When this softkey is selected, the menu accessed from the
SELECT FIXTURE softkey lists only magnetic material xtures.
The 4Meas5 and 4Cal5 keys lead only to the menus related to the
permeability measurement. When a xture size has been speci ed,
the size is displayed in parenthesis in the softkey label.
NNNNNNNNNNNNNNNNNNNNNNNNNNNNNNNNNNNNNNNNNNNN
NNNNNNNNNNNNNNNNNNNNNNNNNNNNNNNNNNNNNNNNNNNNNNNNNN
NNNNNNNNNNNNNNNNNNNNNNNNNNNNNNNNNNNNNNNNNNNNNNNNNNNNNNNNNNNNNNNNN
NNNNNNNNNNNNNNNNNNNNNNNNNNNNNNNNNNNNNNNNNNNN
Measurement Block 5-21
4Meas5
(Dielectric Material Measurement)
Dielectric Material Size Menu (Option 002 only)
Figure 5-17. Dielectric Material Size Menu (Option 002 only)
NNNNNNNNNNNNNNNNNNNNNNNNNNNNN
THICKNESS Sets the thickness of the dielectric material to be
measured.
DONE (MODIFIED) Completes the procedure to de ne material size.
NNNNNNNNNNNNNNNNNNNNNNNNNNNNNNNNNNNNNNNNNNNNNNN
Figure 5-18. Dielectric Material Size
5-22 Measurement Block
4Meas5
(Magnetic Material Measurement)
Permeability Measurement Menu (Option 002 only)
Figure 5-19. Permeability Measurement Menu (Option 002 only)
PRMEABLTY:REAL(0r ) Measures real part of complex permeability
(0 r ).
LOSS FACTR (00 r ) Measures loss factor of complex permeability
(00 r ).
LOSS TNGNT (tan ) Measures loss tangent (tan ).
NNNNNNNNNNNNNNNNNNNNNNNNNNNNNNNNNNNNNNNNNNNNNNNNNNNNNNNNN
NNNNNNNNNNNNNNNNNNNNNNNNNNNNNNNNNNNNNNNNNNNNNNNNN
NNNNNNNNNNNNNNNNNNNNNNNNNNNNNNNNNNNNNNNNNNNNNNNNNNNN
NNNNNNNNNNNNNNNNNNNNNNNNNNNNN
MAG(|r|) Measures absolute magnitude value of complex
permeability (jr j).
Measurement Block 5-23
4Meas5
(Magnetic Material Measurement)
NNNNNNNNNNNNNNNNNNNNNNNNNN
MORE 1/6 leads the following softkeys, which is used to masure
impedance parameter as same as the Impedance Measurement
menu.
IMPEDANCE:MAG(|Z|) Measures absolute magnitude value of
impedance (jZj).
PHASE(z) Measures phase value of impedance (z ).
NNNNNNNNNNNNNNNNNNNNNNNNNNNNNNNNNNNNNNNNNNNNNNNNNNNNNNNN
NNNNNNNNNNNNNNNNNNNNNNNNNNNNN
NNNNNNNNNNNNNNNNNNNNNNNNNNNNN
RESIST(R) Measures resistance value (R).
NNNNNNNNNNNNNNNNNNNNNNNNNN
REACT(X) Measures reactance value (X).
NNNNNNNNNNNNNNNNNNNNNNNNNNNNNNNNNNNNNNNNNNNNNNNNNNNNNNNN
ADMITTNCE:MAG(|Y|) Measures absolute magnitude value of
admittance (jYj).
PHASE(y) Measures phase value of admittance (y ).
NNNNNNNNNNNNNNNNNNNNNNNNNNNNN
NNNNNNNNNNNNNNNNNNNNNNNNNNNNNNNN
CONDUCT(G) Measures conductance value (G).
NNNNNNNNNNNNNNNNNNNNNNNNNNNNNNNN
SUSCEPT(B) Measures susceptance value (B).
NNNNNNNNNNNNNNNNNNNNNNNNNNNNNNNNNNNNNNNNNNNNNNNNNNNNNNNN
REFL.COEF:MAG(|0|) Measures absolute magnitude value of
re ection coecient (j0j).
PHASE(0) Measures phase value of re ection coecient
( ).
REAL(0x) Measures real part of re ection coecient (0x ).
IMAG(0y) Measures imaginary part of re ection coecient
(0y ).
CAPCITNCE:PRL(Cp) Measures parallel capacitance (Cp ),
which is used for small capacitance measurement.
SER(Cs) Measures series capacitance (Cs ), which is used
for large capacitance measurement.
INDUCTNCE:PRL(Lp) Measures parallel inductance (Lp ),
which is used for large inductance measurement.
SER(Ls) Measures series inductance (Ls ), which is used
for small inductance measurement.
RESISTNCE:PRL(Rp) Measures parallel resistance (Rp ),
which is used for large resistance, large inductance, or
small capacitance.
SER(Rs) Measures series resistance (Rs ), which is
used for small resistance, small inductance, or large
capacitance.
D FACTOR (D) Measures dissipation factor (D).
Q FACTOR (Q) Measures quality factor (Q).
DUAL PARAMETER Leads to the Dual Parameter menu, which are
used to select parameters to be measured for both channels with
one-key stroke.
FIXTURE [16454( )] Leads to the Fixture Menu, which is used
to select the test xture used with the analyzer. The selected test
xture is displayed in brackets in the softkey label.
MATERIAL SIZE Leads to the Material Size Menu, which is used to
set the diameters of the magnetic material to be measured.
NNNNNNNNNNNNNNNNNNNNNNNNNNNNN
NNNNNNNNNNNNNNNNNNNNNNNNNN
NNNNNNNNNNNNNNNNNNNNNNNNNN
NNNNNNNNNNNNNNNNNNNNNNNNNNNNNNNNNNNNNNNNNNNNNNNNNNNNN
NNNNNNNNNNNNNNNNNNNNNNN
NNNNNNNNNNNNNNNNNNNNNNNNNNNNNNNNNNNNNNNNNNNNNNNNNNNNN
NNNNNNNNNNNNNNNNNNNNNNN
NNNNNNNNNNNNNNNNNNNNNNNNNNNNNNNNNNNNNNNNNNNNNNNNNNNNN
NNNNNNNNNNNNNNNNNNNNNNN
NNNNNNNNNNNNNNNNNNNNNNNNNNNNNNNNNNNNNN
NNNNNNNNNNNNNNNNNNNNNNNNNNNNNNNNNNNNNN
NNNNNNNNNNNNNNNNNNNNNNNNNNNNNNNNNNNNNNNNNNNN
NNNNNNNNNNNNNNNNNNNNNNNNNNNNNNNNNNNNNNNNNNNNNNNNNNNNNNNN
NNNNNNNNNNNNNNNNNNNNNNNNNNNNNNNNNNNNNNNNN
5-24 Measurement Block
4Meas5
(Magnetic Material Measurement)
Complex Permeability Measurement Menu (Option 002 only)
Figure 5-20. Complex Permeability Measurement Menu (Option 002 only)
This softkey menu can be accessed at the following conditions:
Format : the polar, Smith, admittance, or complex plane format is selected.
Fixture : 16454A is selected.
NNNNNNNNNNNNNNNNNNNNNNNNNNNNNNNNNNNNNNNNN
IMPEDANCE (Z) Measures complex impedance on the polar or
complex plane format. This softkey is not available when Smith or
admittance chart is selected.
ADMITTANCE (Y) Measures complex admittance on the polar or
complex plane format. This softkey is not available when Smith or
admittance chart is selected.
REFL. COEF(0) Measures complex impedance on Smith,
admittance, polar or complex plane format.
PERMEABILITY () Measures complex relative permeability on the
polar or complex plane format. This softkey is not available when
Smith or admittance chart is selected.
DUAL PARAMETER This softkey is not available for Smith,
admittance, polar chart, and complex plane formats.
FIXTURE [ ] Leads to the Fixture Menu, which is used to select
the test xture used with the analyzer. The selected test xture is
displayed in brackets in the softkey label.
MATERIAL SIZE Leads to the Material Size Menu, which is used to
set the diameters of the magnetic material to be measured.
NNNNNNNNNNNNNNNNNNNNNNNNNNNNNNNNNNNNNNNNNNNN
NNNNNNNNNNNNNNNNNNNNNNNNNNNNNNNNNNNNNNNNN
NNNNNNNNNNNNNNNNNNNNNNNNNNNNNNNNNNNNNNNNNNNNNNNNNN
NNNNNNNNNNNNNNNNNNNNNNNNNNNNNNNNNNNNNNNNNNNN
NNNNNNNNNNNNNNNNNNNNNNNNNNNNNNNNNNN
NNNNNNNNNNNNNNNNNNNNNNNNNNNNNNNNNNNNNNNNN
Measurement Block 5-25
4Meas5
(Magnetic Material Measurement)
Dual Parameter Menu (Magnetic Material Measurement)
Figure 5-21.
Dual Parameter Menu (Magnetic Material Measurement)
0 r -00 r Measures 0 r on channel 1 and measures 00 r on channel 2.
0 r -tan Measures 0 r on channel 1 and measures tan on channel
NNNNNNNNNNNNNNNNNNNNN
NNNNNNNNNNNNNNNNNNNNNNNN
2.
00 r-tan Measures 00 r on channel 1 and measures tan on channel
2.
|r |-tan Measures jr j on channel 1 and measures tan on
channel 2.
SINGLE PARAMETER Leads to the Permiability Measurement Menu.
FIXTURE [16454] Leads to the Magnetic Material Fixture Menu,
which is used to select test xture used with the analyzer. The
selected test xture is displayed in brackets in the softkey label.
MATERIAL SIZE Leads to the Material Size Menu, which is used to
set the diameters of the magnetic material to be measured.
NNNNNNNNNNNNNNNNNNNNNNNNN
NNNNNNNNNNNNNNNNNNNNNNNNNNNN
NNNNNNNNNNNNNNNNNNNNNNNNNNNNNNNNNNNNNNNNNNNNNNNNNN
NNNNNNNNNNNNNNNNNNNNNNNNNNNNNNNNNNNNNNNNNNNNNNN
NNNNNNNNNNNNNNNNNNNNNNNNNNNNNNNNNNNNNNNNN
5-26 Measurement Block
4Meas5
(Magnetic Material Measurement)
Magnetic Material Fixture Menu (Option 002 only)
Figure 5-22. Magnetic Material Fixture Menu (Option 002 only)
This section describes the softkeys
that can be accessed when Option 002 (Material
FFFFFFFFFFFFFFFFFFFFFFFFFFFFFFFFFFFFFFFFFFFFFF
Measurement) is installed and PERMEABILITY 16454 is selected in this menu.
NNNNNNNNNNNNNNNNNNNNNNNNNNNNNNNNNNNNNNNNN
IMPEDANCE [ ] Selects the impedance measurement. When this
softkey is selected, the menu accessed from the SELECT FIXTURE
softkey lists only impedance xtures. The 4Meas5 and 4Cal5 keys lead
only to the menus related to the impedance measurement. When a
xture has been speci ed, its label is displayed in brackets in the
softkey label.
PERMITTVTY 16453 Selects the permittivity measurement. This
function doesn't set the electrical length. When this softkey is
selected, the 4Meas5 and 4Cal5 keys lead only to the menus related to
the permittivity measurement.
PERMEABILITY 16454( ) Selects the permeability measurement.
When this softkey is selected, the menu accessed from the
SELECT FIXTURE softkey lists only magnetic material xtures.
The 4Meas5 and 4Cal5 keys lead only to the menus related to the
permeability measurement. When a xture size has been speci ed,
the size is displayed in parenthesis in the softkey label.
SELECT FIXTURE Leads to the following softkeys, which are used
to select a test xture for the permeability measurement.
FIXTURE:16454(S) Sets the electrical length that is suitable for
the 16454A Small.
NNNNNNNNNNNNNNNNNNNNNNNNNNNNNNNNNNNNNNNNNNNN
NNNNNNNNNNNNNNNNNNNNNNNNNNNNNNNNNNNNNNNNNNNNNNNNNN
NNNNNNNNNNNNNNNNNNNNNNNNNNNNNNNNNNNNNNNNNNNNNNNNNNNNNNNNNNNNNNNNN
NNNNNNNNNNNNNNNNNNNNNNNNNNNNNNNNNNNNNNNNNNNN
NNNNNNNNNNNNNNNNNNNNNNNNNNNNNNNNNNNNNNNNNNNN
NNNNNNNNNNNNNNNNNNNNNNNNNNNNNNNNNNNNNNNNNNNNNNNNNN
Measurement Block 5-27
4Meas5
(Magnetic Material Measurement)
NNNNNNNNNNNNNNNNNNNNNNNNNN
16454(L) Sets the electrical length that is suitable for the
16454A Large.
5-28 Measurement Block
4Meas5
(Magnetic Material Measurement)
Magnetic Material Size Menu (Option 002 only)
Figure 5-23. Magnetic Material Size Menu (Option 002 only)
NNNNNNNNNNNNNNNNNNNNNNNNNNNNNNNNNNNNNNNNNNNN
OUTER DIAMETER Sets outer diameter of magnetic material to be
measured, which is ring shaped.
INNER DIAMETER Sets inner diameter of magnetic material to be
measured, which is ring shaped.
HEIGHT Sets height of magnetic material to be measured, which is
ring shaped.
DONE (MODIFIED) Completes the procedure to de ne material size.
NNNNNNNNNNNNNNNNNNNNNNNNNNNNNNNNNNNNNNNNNNNN
NNNNNNNNNNNNNNNNNNNN
NNNNNNNNNNNNNNNNNNNNNNNNNNNNNNNNNNNNNNNNNNNNNNN
Figure 5-24. Magnetic Material Size
Measurement Block 5-29
4Format5
4Format5
Format Menu
Figure 5-25. Format Menu
NNNNNNNNNNNNNNNNNNNNNNNNNNNNNNNN
LIN Y-AXIS Displays the linear magnitude format.
NNNNNNNNNNNNNNNNNNNNNNNNNNNNNNNN
LOG Y-AXIS Displays the log scale format.
NNNNNNNNNNNNNNNNNNNNNNNNNNNNNNNNNNN
POLAR CHART Displays a polar chart format.
NNNNNNNNNNNNNNNNNNNNNNNNNNNNNNNNNNN
SMITH CHART Displays a Smith chart format.
NNNNNNNNNNNNNNNNNNNNNNNNNNNNNNNNNNNNNNNNNNNNNNNNNN
ADMITTANCE CHART Displays an admittance Smith chart format.
NNNNNNNNNNNNNNNNNNNNNNNNNNNNNNNNNNNNNNNNN
COMPLEX PLANE Displays a complex plane format.
NNNNNNNNNNNNNNNNNNNNNNNNNNNNNNNNNNNNNNNNNNNN
PHASE UNIT [ ] Selects the unit for phase measurement. The unit
selected is shown in brackets.
EXP PHASE ON off Turns the expanded phase ON or OFF. When
this is turned OFF, the analyzer wraps the phase plot around every
6180 . When this is ON, the analyzer avoids the wrap and displays
the phase plot over 6180 .
NNNNNNNNNNNNNNNNNNNNNNNNNNNNNNNNNNNNNNNNNNNNNNNNNNNNN
Note
5-30 Measurement Block
After change the format, you should select the measurement
parameter again as a right one.
4Format5
User Trace Format Menu
Figure 5-26. User Trace Format Menu
This menu can be accessed when the user trace is turned on.
NNNNNNNNNNNNNNNNNNNNNNNNNNNNNNNN
Y-AXIS:LIN Selects linear scale along the y-axis.
NNNNNNNNNNN
LOG Selects logarithm scale along the y-axis.
NNNNNNNNNNNNNNNNNNNNNNNNNNNNNNNN
X-AXIS:LIN Selects linear scale along the x-axis.
NNNNNNNNNNN
LOG Selects logarithm scale along the x-axis.
Measurement Block 5-31
4Display5
4Display5
Figure 5-27. Softkey Menu Accessed from 4Display5 Key
5-32 Measurement Block
4Display5
Display Menu
Figure 5-28. Display Menu
NNNNNNNNNNNNNNNNNNNNNNNNNNNNNNNNNNNNNNNNNNNNNNNNNNNNN
DUAL CHAN ON off Toggles between the display of both
measurement channels or the active channel only. This is used in
conjunction with SPLIT DISP ON off to display both channels.
SPLIT DISP ON off Toggles between a full-screen single graticule
display of one or both channels, and a split display with two
half-screen graticules one above the other. The split display can be
used in conjunction with DUAL CHAN ON to show the measured
data of each channel simultaneously on separate graticules.
DISPLAY ALLOCATION Displays the Display Allocation menu,
which is used to allocate the BASIC screen area on the display.
DEFINE TRACE Leads to the following softkeys, which are used to
select traces displayed (the data trace and the memory traces).
DISPLAY: DATA Displays the current measurement data trace for
the active channel.
MEMORY Displays the trace memory for the active channel. If no
data is stored in memory for this channel, a warning message is
displayed.
DATA and MEMORY Displays both the current data and the
memory traces.
DATA!MEMORY Stores the current active measurement data in
the active memory of the active channel. It then becomes the
memory trace (for use in subsequent math manipulations or
display). When the NOP is changed, the memory trace becomes
invalid.
SELECT MEMORY NO Selects a memory trace as the active
memory trace. The analyzer can store traces into several memory
traces (maximum number of memory traces depends on the NOP).
However, the display functions (such as scaling) and marker
functions a ect the active memory trace speci ed by this softkey.
NNNNNNNNNNNNNNNNNNNNNNNNNNNNNNNNNNNNNNNNNNNNNNNNNNNNN
NNNNNNNNNNNNNNNNNNNNNNNNNNNNNNNNNNNNNNNNNNNNNNNNNNNNNNNN
NNNNNNNNNNNNNNNNNNNNNNNNNNNNNNNNNNNNNN
NNNNNNNNNNNNNNNNNNNNNNNNNNNNNNNNNNNNNNNNNNNNNNNNNNNNNNNN
NNNNNNNNNNNNNNNNNNNNNNNNNNNNNNNNNNNNNN
NNNNNNNNNNNNNNNNNNNNNNNNNNNNNNNNNNNNNNNNN
NNNNNNNNNNNNNNNNNNNN
NNNNNNNNNNNNNNNNNNNNNNNNNNNNNNNNNNNNNNNNNNNNNNN
NNNNNNNNNNNNNNNNNNNNNNNNNNNNNNNNNNNNN
NNNNNNNNNNNNNNNNNNNNNNNNNNNNNNNNNNNNNNNNNNNNNNNNNN
Measurement Block 5-33
4Display5
NNNNNNNNNNNNNNNNNNNNNNNNNNNNNNNNNNNNNNNNNNNNNNNNNN
SEL'D MEM ON off Sets the state of the memory trace always
to display the memory trace or to erase the memory trace, even
each memory trace is inactive. (Regardless of this setting, the
active memory trace is always displayed.) The state of each
memory trace can be set to display or erase traces individually,
and pressing this key changes the state of the current active
memory trace selected by SELECT MEMORY NO . Therefore, it is
necessary to select a memory trace before changing this state.
See the following example:
NNNNNNNNNNNNNNNNNNNNNNNNNNNNNNNNNNNNNNNNNNNNNNNNNN
For example: To erase memory trace No.2
AssumingFFFFFFFFFFFFFFFFFFFFFFFFFFFFFFFFFFFFFFFFF
that two memory traces have been used:
1. Press SELECT MEMORY NO 425 4215. (No.2 memory trace is selected)
FFFFFFFFFFFFFFFF
2. Press FFFFFFFFFFFFFFFFFFFFFFFFFFFFFFFFFFFFFFFFF
SEL'D MEM ON off to turn to o . (Softkey label will change from ON off
FFFFFFFFFFFFFFFF
to on OFF . No.2 memory trace is set to be erased when another trace is selected.)
3. Press FFFFFFFFFFFFFFFFFFFFFFFFFFFFFFFFFFFFFFFFF
SELECT MEMORY NO 415 4215. (NO.1 memory trace is selected and No.2
memory trace is not displayed.)
If you cannot display memory traces . . .
FFFFFFFFFFFFFFFF
FFFFFFFFFFFFFFFFFFFFFFFFFFFFFFFFFFFFFFF
1. When you cannot turn on MEMORY or DATA and MEMORY .
FFFFFFFFFFFFFFFF
FFFFFFFFFFFFFFFFFFFFFFFFFFFFFFFFFFFFFFF
In this case, check if the softkey labels of MEMORY and DATA and MEMORY are
dim. If they are dim, no data is stored in the memory trace. Press 4Display5
FFFFFFFFFFFFFFFFFFFFFFFFFFFFFFF FFFFFFFFFFFFFFFFFFFFFFFFFFFFFFF
DEFINE TRACE DATA !MEMORY to store data into the memory trace before
turning on the memory trace.
FFFFFFFFFFFFFFFFFFFFFFFFFFFFFFFFFFFFFFFFF
2. When a memory trace selected using SELECT MEMORY NO can be displayed, but
other memory traces cannot be displayed.
FFFFFFFFFFFFFFFFFFFFFFFFFFFFFFFFFFFFFFFFF
In this case, please check if the softkey label of SEL'D MEM ON off is dim, if it is
FFFFFFFFFFFFFFFFFFFFFFFFFFFFFFFFFFFFFFFFFFFFFF FFFFFFFFFFFFFFFFFFFFFFFFFFFFFFFFFFFFFFFFF
dim, press 4Display5 DISPLAY ALLOCATION ALL MEMORY TRACE to make all
memory traces available.
NNNNNNNNNNNNNNNNNNNNNNNNNNNNNNNNNNNNNN
CLEAR MEMORY Clear all memory traces.
The analyzer will lose all data in the memory traces after you press this softkey. If
the memory traces are to be recalled, you must save the data to the oppy disk or
the memory disk.
The following operations also clear the memory traces:
Pressing 4Preset5.
Turning the analyzer o .
Changing NOP.
Recalling data from the oppy disk or memory disk.
FFFFFFFFFFFFFFFFFFFFFFFFFFFFFFFFFFFFFFF
Pressing SIMULATE F-CHAR in the Equivalent Circuit menu changes the data in
memory trace NO.1 because the equivalent circuit function uses this memory trace in
order to display the result of simulating the frequency characteristics.
5-34 Measurement Block
4Display5
DATA MATH Leads to the Data Math Menu. The data math function
selected is shown in brackets ( [DATA0MEM] shows that the data
math function selected DATA0MEM ).
NNNNNNNNNNNNNNNNNNNNNNNNNNNNN
NNNNNNNNNNNNNNNNNNNNNNNNNNNNNNNNN
NNNNNNNNNNNNNNNNNNNNNNNNNNN
EQUIV CKT MENU Leads to the Equivalent Circuit menu, which is
used to derive values of equivalent circuit parameters and simulate
frequency characteristics of equivalent circuits.
TITLE Displays the title menu in the softkey labels and the
character set in the active entry area to display the title in the
active channel title area on the screen.
LABEL MENU Leads to the Label menu, which is used to label text
on any area of the screen.
TRACE [ ] Turns the user trace display on or o . When the
user traces are turned on, the normal data/memory trace is not
displayed.
NNNNNNNNNNNNNNNNNNNNNNNNNNNNNNNNNNNNNNNNNNNN
NNNNNNNNNNNNNNNNN
NNNNNNNNNNNNNNNNNNNNNNNNNNNNNNNN
NNNNNNNNNNNNNNNNNNNNNNNNNNNNN
FFFFFFFFFFFFFFFF
[USER] shows the user trace is displayed
FFFFFFFFFFFFFFFFFFFFFFFFFF
[DATA&MEM] shows the normal data trace is displayed
NNNNNNNNNNNNNNNNNNNNNNNNNNNNNNNNNNNNNNNNNNNNNNNNNN
GRATICULE ON off Turns the graticule of the active channel on or
o .
FFFFFFFFFFFFFFFFFFFFFFFFFFFFFFFFFFFFFFFFF
FFFFFFFFF
If the graticule is not erased when GRATICULE ON off is turned off
When Dual channel is on, Split display is o , and both channels are using the same
format, the graticule is not erased,
even if the graticule setting of either channel is
FFFFFFFFFFFFFFFFFFFFFFFFFFFFFFFFFFFFFFFFF
tuned o . In this case, turn the GRATICULE ON off of both channels to o .
When
a user trace is displayed, the graticule cannot be erased using
FFFFFFFFFFFFFFFFFFFFFFFFFFFFFFFFFFFFFFFFF
GRATICULE ON off .
NNNNNNNNNNNNNNNNNNNNNNNNNNNNNNNNNNNNNNNNNNNN
ADJUST DISPLAY Provides a menu for adjusting display intensity,
colors, and accessing save and recall functions for modi ed display
color sets.
FREQUENCY BLANK Blanks the displayed frequency notation for
security purposes. Frequency labels cannot be restored except by
pressing 4Preset5 or by turning the power o and then on.
NNNNNNNNNNNNNNNNNNNNNNNNNNNNNNNNNNNNNNNNNNNNNNN
Measurement Block 5-35
4Display5
Display Allocation Menu
Figure 5-29. Display Allocation Menu
NNNNNNNNNNNNNNNNNNNNNNNNNNNNNNNNNNNNNNNNNNNN
ALL INSTRUMENT Selects a full screen or two half-screen graticules.
NNNNNNNNNNNNNNNNNNNNNNNNNNNNNNNNNNNNNNNNNNNNNNNNNNNNNNNNNNNNNNNNN
HALF INSTR HALF BASIC Selects two half-screens, one graticule
display above the HP Instrument BASIC display.
ALL BASIC Selects a full screen single HP Instrument BASIC
display.
BASIC STATUS Selects a full screen graticule and three status lines
for HP Instrument BASIC under the graticule.
GRAPHICS:BASIC DRAW Makes Instrument BASIC graphic capability
available. Because the Instrument BASIC graphic capability uses the
same resources as the memory trace capability, the analyzer cannot
display memory traces except for a memory trace selected using
SELECT MEMORY NO when this softkey is selected.
ALL MEMORY TRACE Makes all memory trace displays available.
Because the multiple memory trace display capability uses the same
resources as the Instrument BASIC graphic capability, the analyzer
cannot display Instrument BASIC graphics when this softkey is
selected.
NNNNNNNNNNNNNNNNNNNNNNNNNNNNN
NNNNNNNNNNNNNNNNNNNNNNNNNNNNNNNNNNNNNN
NNNNNNNNNNNNNNNNNNNNNNNNNNNNNNNNNNNNNNNNNNNNNNNNNNNNNNNNNNN
NNNNNNNNNNNNNNNNNNNNNNNNNNNNNNNNNNNNNNNNNNNNNNNNNN
NNNNNNNNNNNNNNNNNNNNNNNNNNNNNNNNNNNNNNNNNNNNNNNNNN
5-36 Measurement Block
4Display5
Figure 5-30. Display Allocations
Measurement Block 5-37
4Display5
Data Math Menu
Figure 5-31. Data Math Menu
NNNNNNNNNNNNNN
DATA Turns o all data math functions.
NNNNNNNNNNNNNNNNNNNNNNNNNN
DATA+MEM Adds the memory trace to the data trace.
NNNNNNNNNNNNNNNNNNNNNNNNNN
DATA-MEM Subtracts the memory trace from the data trace.
NNNNNNNNNNNNNNNNNNNNNNNNNN
DATA/MEM Divides the data trace by the memory trace.
DATA3MEM Multiplies the data trace by the memory trace.
NNNNNNNNNNNNNNNNNNNNNNNNNN
NNNNNNNNNNNNNNNNNNNNNNNNNNNNNNNNNNNNNNNNNNNNNNN
GAIN OFFST MENU Leads to the following softkeys, which are used
to set gain and o set values for the data math function.
DEFAULT GAIN & OFS Returns gain and o set value back to the
default values (gain=1, o set=0).
OFFSET Displays the menu used to de ne the o set value and
activates the o set value. When using Smith, polar, admittance
chart, and complex plane format, OFFSET de nes the real part of
the o set value.
MKR!OFFSET Enters the marker's amplitude value into the
o set value.
OFFSET Makes the o set value the active function.
AUX OFFSET VALUE De nes the imaginary part of the o set
value when using the Smith, polar, admittance chart, and
complex plane format. If the format is not one of the above
formats, this softkey performs no function.
GAIN De nes the gain value for the data math function.
NNNNNNNNNNNNNNNNNNNNNNNNNNNNNNNNNNNNNNNNNNNNNNNNNNNNNNNN
NNNNNNNNNNNNNNNNNNNN
NNNNNNNNNNNNNNNNNNNN
NNNNNNNNNNNNNNNNNNNNNNNNNNNNNNNNNN
NNNNNNNNNNNNNNNNNNNN
NNNNNNNNNNNNNNNNNNNNNNNNNNNNNNNNNNNNNNNNNNNNNNNNNN
NNNNNNNNNNNNNN
5-38 Measurement Block
4Display5
The data math functions displays the result of the following calculations:
(GAIN 2 DATA) 0 OFFSET
(GAIN 2 MEMORY) 0 OFFSET
(GAIN 2 (DATA + MEMORY)) 0 OFFSET
(GAIN 2 (DATA 0 MEMORY)) 0 OFFSET
(GAIN 2 (DATA / MEMORY)) 0 OFFSET
(GAIN 2 (DATA 2 MEMORY)) 0 OFFSET
Where,
FFFFFFFFFFFF
GAIN is a scalar value de ned by GAIN
DATA is the data trace value (measurement value)
MEMORY is the memory trace value (stored by DATA!MEMORY )
FFFFFFFFFFFFFFFFFFFFFFFFFFFFFFF
FFFFFFFFFFFFFFFF
OFFSET is an o set value de ned by OFFSET
Measurement Block 5-39
4Display5
Equivalent Circuit Menu
Figure 5-32. Equivalent Circuit Menu
NNNNNNNNNNNNNNNNNNNNNNNNNNNNNNNNNNNNNNNNNNNNNNNNNNNNNNNN
SELECT EQV CIRCUIT Leads to the following softkeys, which are
used to select the equivalent circuit. (See Table 5-1.)
A Selects equivalent circuit A, which is used to simulate
inductors with high core loss.
B Selects equivalent circuit B, which is used to simulate
inductors in general and resisters.
C Selects equivalent circuit C, which is used to simulate
high-value resistors.
D Selects equivalent circuit D, which is used to simulate
capacitors.
E Selects equivalent circuit E, which is used to simulate
resonators.
CALCULATE EQV PARAMS Calculates the equivalent circuit
parameters. While the calculation is being performed, the message
Calculating EQV parameters is displayed. After the calculation is
completed, the values of the equivalent parameters are displayed.
DEFINE EQV PARMS Leads to the following softkeys, which are
used to enter the equivalent circuit parameters.
PARAMETER R1 makes R1 the active function in order to enter its
value.
L1 makes L1 the active function in order to enter its value.
C0 makes C0 the active function in order to enter its value.
C1 makes C1 the active function in order to enter its value.
NNNNN
NNNNN
NNNNN
NNNNN
NNNNN
NNNNNNNNNNNNNNNNNNNNNNNNNNNNNNNNNNNNNNNNNNNNNNNNNNNNNNNNNNNNNNNNN
NNNNNNNNNNNNNNNNNNNNNNNNNNNNNNNNNNNNNNNNNNNNNNNNNN
NNNNNNNNNNNNNNNNNNNNNNNNNNNNNNNNNNNNNN
NNNNNNNN
NNNNNNNN
NNNNNNNN
5-40 Measurement Block
4Display5
NNNNNNNNNNNNNNNNNNNNNNNNNNNNNNNNNNNNNNNNNNNNNNNNNN
SIMULATE F-CHRST Simulates the frequency characteristics
by using the current equivalent circuit parameters and shows
simulation result on the screen using memory trace NO.1. In other
words, simulation results are stored into the NO.1 memory trace.
DISP EQV PARM [ON] Toggles the display of the equivalent circuit
parameter value.
NNNNNNNNNNNNNNNNNNNNNNNNNNNNNNNNNNNNNNNNNNNNNNNNNNNNNNNN
Table 5-1. Equivalent Circuit Selection Guide
Equivalent Circuit
Note
Type of devices
A
inductors with high
core loss
B
inductors and
resisters
C
high-value resistors
D
capacitors
E
resonators
Typical Frequency
Characteristics
The equivalent circuit function is available only for the frequency
sweep. The equivalent circuit function is not available for OSC level
and dc bias sweep. You should set the resonant frequency in the
sweep range to get the right result.
Analysis Range can be speci ed
The frequency range
used to calculate parameters can be speci ed using the menu
FFFFFFFFFFFFFFFFFFFFFFFFFFFFFFFFFFFFFFFFFFF
accessed from the SEARCH RANGE MENU under the 4Search5 key.
Measurement Block 5-41
4Display5
Adjust Display Menu
Figure 5-33. Adjust Display Menu
NNNNNNNNNNNNNNNNNNNNNNNNNNNNN
INTENSITY Sets the display intensity as a percentage of the
brightest setting.
BACKGROUND INTENSITY Sets the background intensity of the
display as a percentage of the white level.
MODIFY COLORS Displays the menu used for color modi cation of
the display elements.
CH1 DATA Selects channel 1 data trace for color modi cation and
displays the Color Adjust menu.
CH1 MEM/LIMIT LINE Selects channel 1 memory trace and limit
lines for color modi cation and displays the Color Adjust menu.
CH2 DATA Selects channel 2 data trace for color modi cation and
displays the Color Adjust menu.
CH2 MEM/LIMIT LINE Selects channel 2 memory and the
reference line and limit line for color modi cation and displays
the Color Adjust menu.
GRATICULE Selects the graticule and a portion of softkey text
(where there is a choice of a feature being ON or OFF) for color
modi cation and displays the Color Adjust menu.
NNNNNNNNNNNNNNNNNNNNNNNNNNNNNNNNNNNNNNNNNNNNNNNNNNNNNNNNNNNNNN
NNNNNNNNNNNNNNNNNNNNNNNNNNNNNNNNNNNNNNNNN
NNNNNNNNNNNNNNNNNNNNNNNNNN
NNNNNNNNNNNNNNNNNNNNNNNNNNNNNNNNNNNNNNNNNNNNNNNNNNNNNNNN
NNNNNNNNNNNNNNNNNNNNNNNNNN
NNNNNNNNNNNNNNNNNNNNNNNNNNNNNNNNNNNNNNNNNNNNNNNNNNNNNNNN
NNNNNNNNNNNNNNNNNNNNNNNNNNNNN
5-42 Measurement Block
4Display5
NNNNNNNNNNNNNNNNNNNNNNN
WARNING Selects the warning annotation for color modi cation
and displays the Color Adjust menu.
FFFFFFFFFFFF
MORE (in this menu) displays softkeys to select other elements for color modi cation.
NNNNNNNNNNNNNNNNNNNNNNNNNNNNNNNNNNN
TEXT MARKER Selects all the non-data text for color modi cation
(for example, softkey labels) and displays the Color Adjust menu.
IBASIC Selects the text on the BASIC screen for color
modi cation and displays the Color Adjust menu.
NNNNNNNNNNNNNNNNNNNN
NNNNNNNNNNNNNN
MORE (in this menu) displays softkeys to select a numbered pen
for color modi cation. The pens are used by the HP Instrument
BASIC graphic commands.
PEN 1 Selects pen 1 for color modi cation and displays the Color
Adjust menu.
PEN 2 Selects pen 2 for color modi cation and displays the Color
Adjust menu.
PEN 3 Selects pen 3 for color modi cation and displays the Color
Adjust menu.
PEN 4 Selects pen 4 for color modi cation and displays the Color
Adjust menu.
PEN 5 Selects pen 5 for color modi cation and displays the Color
Adjust menu.
PEN 6 Selects pen 6 for color modi cation and displays the Color
Adjust menu.
DEFAULT COLORS Returns all the color settings back to the default
values.
SAVE COLORS Saves the modi ed version of the color set to the
non-volatile memory.
RECALL COLORS Recalls the previously saved modi ed version
of the color set from the non-volatile memory. RECALL COLORS
appears only when a color set has been saved.
NNNNNNNNNNNNNNNNN
NNNNNNNNNNNNNNNNN
NNNNNNNNNNNNNNNNN
NNNNNNNNNNNNNNNNN
NNNNNNNNNNNNNNNNN
NNNNNNNNNNNNNNNNN
NNNNNNNNNNNNNNNNNNNNNNNNNNNNNNNNNNNNNNNNNNNN
NNNNNNNNNNNNNNNNNNNNNNNNNNNNNNNNNNN
NNNNNNNNNNNNNNNNNNNNNNNNNNNNNNNNNNNNNNNNN
NNNNNNNNNNNNNNNNNNNNNNNNNNNNNNNNNNNNNNNNN
Measurement Block 5-43
4Display5
Color Adjust Menu
Figure 5-34. Color Adjust Menu
NNNNNNNNNNNNNN
TINT Adjusts the hue of the chosen attribute.
NNNNNNNNNNNNNNNNNNNNNNNNNNNNNNNN
BRIGHTNESS Adjusts the brightness of the color being modi ed.
NNNNNNNNNNNNNNNNN
COLOR Adjusts the degree of whiteness of the color being modi ed.
NNNNNNNNNNNNNNNNNNNNNNNNNNNNNNNNNNN
RESET COLOR Resets the color being modi ed to the default color.
Tint
Color consists of the following three parameters:
The continuum of hues on the color wheel, ranging from red through
green and blue, and back to red.
Brightness A measure of the brightness of the color.
Color
The degree of whiteness of the color. A scale from white to pure color.
5-44 Measurement Block
4Display5
Label Menu
Figure 5-35. Label Menu
NNNNNNNNNNNNNNNNN
LABEL Makes label the active function to de ne the label.
NNNNNNNNNNNNNNNNN
COLOR Selects the color of the label text.
NNNNNNNNNNNNNNNNN
X-POS Sets the X-axis position of the label selected by
LABEL NUMBER .
NNNNNNNNNNNNNNNNNNNNNNNNNNNNNNNNNNNNNN
NNNNNNNNNNNNNNNNN
Y-POS Sets the Y-axis position of the label selected by
LABEL NUMBER .
NNNNNNNNNNNNNNNNNNNNNNNNNNNNNNNNNNNNNN
NNNNNNNNNNNNNNNNNNNNNNNNNNNNNNNNNNNNNNNNNNNNNNN
CLEAR ALL LABEL Clear all label.
NNNNNNNNNNNNNNNNNNNNNNNNNNNNNNNNNNNNNN
LABEL NUMBER Select the number of labels.
Measurement Block 5-45
4Display5
Title menu
Figure 5-36. Title Menu
SELECT LETTER Selects the letter pointed to by the arrow \"" on
the screen. The arrow can be moved by rotating the knob.
SPACE Inserts a space in the title.
BACK SPACE Deletes the last character entered.
ERASE TITLE Deletes the entire title.
DONE Terminates the title entry and returns to the display more
menu.
CANCEL Cancels the title entry and returns to the display more
menu without any change.
NNNNNNNNNNNNNNNNNNNNNNNNNNNNNNNNNNNNNNNNN
NNNNNNNNNNNNNNNNN
NNNNNNNNNNNNNNNNNNNNNNNNNNNNNNNN
NNNNNNNNNNNNNNNNNNNNNNNNNNNNNNNNNNN
NNNNNNNNNNNNNN
NNNNNNNNNNNNNNNNNNNN
5-46 Measurement Block
4Display5
User Trace Display Menu
Figure 5-37. User Trace Display Menu
This menu can be accessed when the user trace is turned on.
DISPLAY ALLOCATION Displays the Display Allocation menu,
which is used to allocate the BASIC screen area on the display.
DEFINE TRACE Leads to the following softkeys, which are used to
select traces displayed (the data and memory traces and the user
trace).
DATA!USER Stores the active measurement data in the user
trace selected and copies the unit and NOP of the data trace to
the user trace selected.
MEMORY!USER Stores the active memory data in the user trace
selected and copies the unit and NOP of the memory trace to the
user trace selected.
SELECT UTRC [1] Leads to the following softkeys, which are
used to select one user trace from the four traces available in
order to copy data or memory trace to the user trace. You can
read the value of the trace using the marker and scale the trace.
USER TRC 1 Selects user trace number 1.
USER TRC 2 Selects user trace number 2.
NNNNNNNNNNNNNNNNNNNNNNNNNNNNNNNNNNNNNNNNNNNNNNNNNNNNNNNN
NNNNNNNNNNNNNNNNNNNNNNNNNNNNNNNNNNNNNN
NNNNNNNNNNNNNNNNNNNNNNNNNNNNNNN
NNNNNNNNNNNNNNNNNNNNNNNNNNNNNNNNNNNNN
NNNNNNNNNNNNNNNNNNNNNNNNNNNNNNNNNNNNNNNNNNNNNNN
NNNNNNNNNNNNNNNNNNNNNNNNNNNNNNNN
NNNNNNNNNNNNNNNNNNNNNNNNNNNNNNNN
Measurement Block 5-47
4Display5
NNNNNNNNNNNNNNNNNNNNNNNNNNNNNNNN
USER TRC 3 Selects user trace number 3.
NNNNNNNNNNNNNNNNNNNNNNNNNNNNNNNN
USER TRC 4 Selects user trace number 4.
NNNNNNNNNNNNNNNNNNNNNNNNNNNNNNNNNNNNNNNNNNNNNNNNNNNNN
SEL'D UTRC ON off Sets the state of the selected user trace to
display it (ON) or to erase it (OFF). The trace is not displayed
when the trace is unselected after the state was set to OFF. The
state of each user trace can be set ON and OFF individually.
CLEAR ALL UTRC Clears all user trace data and settings, and
turns o the user trace display.
MORE Leads the following softkey menu.
LABEL MENU Leads to the Label menu, which is used to label text
on any area of the screen.
USER TRACE LABEL Displays the following softkeys, which are
used to put characters on the top or bottom area, or to enter the
x and y axis unit labels of the user trace display screen.
HEADLINE Displays the Letter menu to enter characters for a
headline at the top left corner of the user trace display screen.
The headline can be de ned for each user trace individually.
FOOTNOTE Displays the Letter menu to enter characters as a
footnote at the bottom of the user trace display screen. The
footnote can be de ned for each user trace individually.
X UNIT LABEL Displays the Letter menu to enter the x-axis
unit label of a current selected user trace.
Y UNIT LABEL Displays the Letter menu to enter the y-axis
unit label of a current selected user trace.
TRACE [ ] Turns the user trace display on or o . When the
user traces are turned on, the normal data/memory trace is not
displayed.
NNNNNNNNNNNNNNNNNNNNNNNNNNNNNNNNNNNNNNNNNNNN
NNNNNNNNNNNNNN
NNNNNNNNNNNNNNNNNNNNNNNNNNNNNNNN
NNNNNNNNNNNNNNNNNNNNNNNNNNNNNNNNNNNNNNNNNNNNNNNNNN
NNNNNNNNNNNNNNNNNNNNNNNNNN
NNNNNNNNNNNNNNNNNNNNNNNNNN
NNNNNNNNNNNNNNNNNNNNNNNNNNNNNNNNNNNNNN
NNNNNNNNNNNNNNNNNNNNNNNNNNNNNNNNNNNNNN
NNNNNNNNNNNNNNNNNNNNNNNNNNNNN
FFFFFFFFFFFFFFFF
[USER] shows the user trace is displayed
FFFFFFFFFFFFFFFFFFFFFFFFFF
[DATA&MEM] shows the normal data trace is displayed
NNNNNNNNNNNNNNNNNNNNNNNNNNNNNNNNNNNNNNNNNNNN
ADJUST DISPLAY Provides a menu for adjusting display intensity,
colors, and accessing save and recall functions for modi ed
display color sets.
5-48 Measurement Block
4Scale
Ref5
4Scale Ref5
Scale Reference Menu
Figure 5-38. Scale Reference Menu
NNNNNNNNNNNNNNNNNNNNNNNNNNNNNNNN
NNNNNNNNNNNNNNNNNNNNNNNNNNNNN
AUTO SCALE Brings the trace data (de ned by the SCALE FOR key)
in view on the display with one keystroke. Sweep values are not
a ected, only scale and reference values. The analyzer determines
the smallest possible scale factor that will put all displayed data
onto the vertical graticule.
SCALE/DIV Changes the response value scale per division of the
displayed trace. In Smith, polar, and admittance chart formats,
this refers to the full scale value at the outer circumference and is
identical to the reference value.
REFERENCE POSITION Sets the position of the reference line on the
graticule of a Cartesian display (with 0 at the bottom line of the
graticule and 10 at the top line). It has no e ect on a Smith, polar
or admittance chart format. The reference position is indicated
with a small triangle just outside the graticule, on the left.
REFERENCE VALUE Changes the value of the reference line, moving
the measurement trace correspondingly. In Smith, polar and
admittance chart formats, the reference value is the same as the
scale and is the value of the outer circle.
MARKER!REFERENCE Makes the reference value equal to the
marker's absolute value (regardless of the delta marker value). The
marker is e ectively moved to the reference line position. In Smith,
polar and admittance chart formats this function makes the full
scale value at the outer circle equal to the marker response value.
TOP VALUE Changes the value at the top line of the graticule,
moving the measurement trace correspondingly.
NNNNNNNNNNNNNNNNNNNNNNNNNNNNN
NNNNNNNNNNNNNNNNNNNNNNNNNNNNNNNNNNNNNNNNNNNNNNNNNNNNNNNN
NNNNNNNNNNNNNNNNNNNNNNNNNNNNNNNNNNNNNNNNNNNNNNN
NNNNNNNNNNNNNNNNNNNNNNNNNNNNNNNNNNNNNNNNNNNNNNNNNNNN
NNNNNNNNNNNNNNNNNNNNNNNNNNNNN
Measurement Block 5-49
4Scale
Ref5
NNNNNNNNNNNNNNNNNNNNNNNNNNNNNNNNNNNNNN
BOTTOM VALUE Changes the value at the bottom line of the
graticule, moving the measurement trace correspondingly.
REFERENCE X VALUE Changes the value of the center position of
the X axis, moving the measurement trace correspondingly. This
softkey is only available for the complex plane format.
REFERENCE Y VALUE Changes the value of the center position of
the Y axis, moving the measurement trace correspondingly. This
softkey is only available for the complex plane format.
SCALE FOR [ ] Selects one of the \DATA" and \MEMORY" traces
to be scaled by prior functions in this menu. The \DATA" and
\MEMORY" traces are available using the Display menu accessed
from the 4Display5 key. All memory traces are displayed with the
same scaling size.
D&M SCALE [ ] Couples or uncouples the \DATA" and \MEMORY"
traces to be scaled by prior functions in this menu. This is valid
only for those traces obtained by the Display menu accessed from
the 4Display5 key.
NNNNNNNNNNNNNNNNNNNNNNNNNNNNNNNNNNNNNNNNNNNNNNNNNNNNN
NNNNNNNNNNNNNNNNNNNNNNNNNNNNNNNNNNNNNNNNNNNNNNNNNNNNN
NNNNNNNNNNNNNNNNNNNNNNNNNNNNNNNNNNNNNNNNN
NNNNNNNNNNNNNNNNNNNNNNNNNNNNNNNNNNNNNNNNN
Scaling Parameter for Each Format
Linear Format
Log Format
Polar Format
Complex Format
5-50 Measurement Block
4Scale
Ref5
User Trace Scale Menu
Figure 5-39. User Trace Scale Menu
This menu can be accessed when the user trace is turned on.
NNNNNNNNNNNNNNNNNNNNNNNNNNNNNNNN
AUTO SCALE Brings the trace data in view on the display with one
keystroke. The analyzer determines the smallest possible scale
factor that will put all displayed data onto the graticule.
LEFT VALUE Changes the value at the left line of the graticule,
moving the current selected user trace correspondingly.
RIGHT VALUE Changes the value at the right line of the graticule,
moving the current selected user trace correspondingly.
TOP VALUE Changes the value at the top line of the graticule,
moving the current selected user trace correspondingly.
BOTTOM VALUE Changes the value at the bottom line of the
graticule, moving the current selected user trace correspondingly.
AXIS [COUPLE] Couples or uncouples all user traces to be scaled
along the x and y axes by prior functions in this menu.
NNNNNNNNNNNNNNNNNNNNNNNNNNNNNNNN
NNNNNNNNNNNNNNNNNNNNNNNNNNNNNNNNNNN
NNNNNNNNNNNNNNNNNNNNNNNNNNNNN
NNNNNNNNNNNNNNNNNNNNNNNNNNNNNNNNNNNNNN
NNNNNNNNNNNNNNNNNNNNNNNNNNNNNNNNNNNNNNNNN
FFFFFFFFFFFFFFFFFFFFF
[COUPLE] Shows parameters for the x and y axes of all user traces are coupled to
the
current selected user trace setting.
FFFFFFFFFFFFFFFFFFFFFFFFFF
[UNCOUPLE] Shows parameters for the x and y axes of each user trace can be set
individually.
Measurement Block 5-51
4Bw/Avg5
4Bw/Avg5
Averaging Menu
Figure 5-40. Averaging Menu
NNNNNNNNNNNNNNNNNNNNNNNNNNNNNNNNNNNNNNNNNNNNNNNNNNNNN
SWEEP AVG RESTART Resets the sweep-to-sweep averaging and
on-point averaging, and restarts the sweep count at 1 at the
beginning of the next sweep. The sweep count for averaging is
displayed at the left of the display.
SWEEP AVG ON off Turns the sweep-to-sweep averaging function
on or off for the active channel. When averaging is on,\Avg" is
displayed in the status notations area at the left of the display
(along with the sweep count for the averaging factor). Whenever
an instrument state change a ecting the measured data is made, the
sweep count for averaging is reset to 1.
NNNNNNNNNNNNNNNNNNNNNNNNNNNNNNNNNNNNNNNNNNNNNNNNNNNNN
NNNNNNNNNNNNNNNNNNNNNNNNNNNNNNNNNNNNNNNNNNNNNNNNNNNNN
At the start of averaging or following AVERAGING RESTART ,
averaging starts at 1 and averages each new sweep into the trace
until it equals the speci ed averaging factor. The sweep count is
displayed in the status notation area below \Avg" and updated each
sweep as it increments. When the speci ed averaging factor is
reached, the trace data continues to be updated, weighted by that
averaging factor.
SWEEP AVG FACTOR Makes the sweep-to-sweep averaging factor the
active function. Any value up to 999 can be used.
POINT AVG on OFF Turns the on-point averaging function on or
off for the active channel.
POINT AVG FACTOR Makes the point averaging factor the active
function. Any value up to 999 can be used.
NNNNNNNNNNNNNNNNNNNNNNNNNNNNNNNNNNNNNNNNNNNNNNNNNN
NNNNNNNNNNNNNNNNNNNNNNNNNNNNNNNNNNNNNNNNNNNNNNNNNN
NNNNNNNNNNNNNNNNNNNNNNNNNNNNNNNNNNNNNNNNNNNNNNNNNN
5-52 Measurement Block
4Bw/Avg5
Averaging On Sweep and Averaging On Points
Averaging On Sweep
Averaging-on-sweep computes each data point based on an exponential average of
consecutive sweeps weighted by a user-speci ed averaging factor. Each new sweep is
averaged into the trace until the total number of sweeps is equal to the averaging
factor, for a fully averaged trace. Each point on the trace is the vector sum of the
current trace data and the data from the previous sweep. A high averaging factor
gives the best signal-to-noise ratio, but slows the trace update time. Doubling the
averaging factor reduces the noise by 3 dB. The algorithm used for
averaging-on-sweep is:
A(n) =
S(n)
1
+ (1 0 ) 2 A(n01)
F
F
Where,
A(n) = current average
S(n) = current measurement
F = average factor
Averaging On Points
Averaging-on-points averages each data point by a user-speci ed averaging factor.
The analyzer repeats measuring the same point until the averaging factor is reached.
It then divides the vector summation of measurement value by the averaging factor
and starts measuring the next point. The sweep time increases in proportion to the
averaging factor. The algorithm used for averaging-on-points is:
M=
F
1 X
F
S(n)
n=1
Where,
M = Measurement Result
S(n) = current measurement
F = average factor
Measurement Block 5-53
4Cal5
4Cal5
Figure 5-41. Softkey Menu Accessed from 4Cal5 key
5-54 Measurement Block
4Cal5
Calibration Menu
Figure 5-42. Calibration Menu
NNNNNNNNNNNNNNNNNNNNNNNNNNNNNNNNNNNNNNNNNNNN
CALIBRATE MENU Leads to the following softkeys, which are used
to perform a calibration measurement.
OPEN Measures OPEN standard of the cal kit for the calibration.
SHORT Measures SHORT standard of the cal kit for the
calibration.
LOAD Measures LOAD standard of the cal kit for the calibration.
LOW-LOSS CAPACITOR Measures LOW-LOSS CAPACITOR standard
of the cal kit for the calibration.
CAL POINTS [ ] Toggles between FIXED and USER DEFINED,
to select the calibration measurement points. When [FIXED]
is displayed, the analyzer performs calibration measurements
on points xed across the full frequency sweep range, and the
e ective value for the points between these measured points will
be calculated using the interpolation method. When [USER] is
displayed, the analyzer performs calibration measurements on the
same points as the current stimulus setting.
NNNNNNNNNNNNNN
NNNNNNNNNNNNNNNNN
NNNNNNNNNNNNNN
NNNNNNNNNNNNNNNNNNNNNNNNNNNNNNNNNNNNNNNNNNNNNNNNNNNNNNNN
NNNNNNNNNNNNNNNNNNNNNNNNNNNNNNNNNNNNNNNNNNNN
NNNNNNNNNNNNNNNNNNNNNNN
NNNNNNNNNNNNNNNNNNNN
Note
For user de ned calibration, set point averaging factor to 32.
NNNNNNNNNNNNNNNNNNNNNNNNNN
DONE:CAL Completes the calibration and then computes and
stores the error coecients. The notation COR (calibration on
xed cal point is on) or Cor (calibration in user cal points is on) is
displayed on the left side of the screen.
RESUME CAL SEQUENCE Eliminates the need to restart a calibration
sequence that was interrupted to access some other menu. Goes
back to the point where the calibration sequence was interrupted.
NNNNNNNNNNNNNNNNNNNNNNNNNNNNNNNNNNNNNNNNNNNNNNNNNNNNNNNNNNN
Measurement Block 5-55
4Cal5
FIXTURE COMPEN Displays the Fixture Compensation menu, which
is used to perform the xture compensation measurements in order
to reduce measurement errors existing along the test xture.
CAL KIT [ ] Leads to the Cal Kit menu that selects the default
calibration kit and a user kit. This in turn displays additional
softkeys used to de ne calibration standards other than those in the
default kits. When a calibration kit has been speci ed, its label is
displayed in brackets in the softkey label.
COMPEN KIT [ ] Leads to the Compen Kit menu that is used
to de ne user-de ne OPEN, SHORT, and LOAD for xture
compensation measurements. When a set of user-de ned OPEN,
SHORT, and LOAD values has been speci ed, its label is displayed in
brackets in the softkey label.
PORT EXTENSIONS Leads to the Port Extension menu, which is
used to extend the apparent location of the measurement reference
plane.
NNNNNNNNNNNNNNNNNNNNNNNNNNNNNNNNNNNNNNNNNNNN
NNNNNNNNNNNNNNNNNNNNNNNNNNNNNNNNNNN
NNNNNNNNNNNNNNNNNNNNNNNNNNNNNNNNNNNNNNNNNNNN
NNNNNNNNNNNNNNNNNNNNNNNNNNNNNNNNNNNNNNNNNNNNNNN
FIXED Cal and Compensation Points
When
FIXED is selected for the calibration measurement points using
FFFFFFFFFFFFFFFFFFFFFFFFFFFFFFFFFF
CAL POINTS[ ] , the analyzer measures the standards on the following
178 frequency points. The analyzer also measures the OPEN, SHORT, and
LOAD compensation measurement points for the xture compensation at
the same frequency points.
(unit:MHz)
1
1.24
1.47
1.85
2.5
4.0
7.5
15
30
55
95
170
300
460
620
780
940
1100
1260
1420
1580
1740
1.03
1.26
1.5
1.9
2.6
4.3
8
16
33
60
100
180
320
480
640
800
960
1120
1280
1440
1600
1760
1.06
1.29
1.55
1.95
2.8
4.6
9
18
36
65
110
190
340
500
660
820
980
1140
1300
1460
1620
1780
1.09
1.32
1.6
2.0
3.0
5.0
10
20
39
70
120
200
360
520
680
840
1000
1160
1320
1480
1640
1800
1.12
1.35
1.65
2.1
3.2
5.5
11
22
42
75
130
220
380
540
700
860
1020
1180
1340
1500
1660
1.15
1.38
1.7
2.2
3.4
6.0
12
24
45
80
140
240
400
560
720
880
1040
1200
1360
1520
1680
1.18
1.41
1.75
2.3
3.6
6.5
13
26
48
85
150
260
420
580
740
900
1060
1220
1380
1540
1700
1.21
1.44
1.8
2.4
3.8
7.0
14
28
51
90
160
280
440
600
760
920
1080
1240
1400
1560
1720
FIXED Compensation Pointsd require FIXED CAL Points
When the compensation measurements are performed at the FIXED points, the
calibration measurements must have been performed at the FIXED Cal Points. If the
calibration was performed at the USER points, the compensation measurements must
be performed at the USER points.
5-56 Measurement Block
4Cal5
Fixture Compensation Menu (for Impedance Measurement)
Figure 5-43. Fixture Compensation Menu
NNNNNNNNNNNNNNNNNNNNNNNNNNNNNNNNNNN
COMPEN MENU Leads to the following softkeys, which are used to
perform a xture compensation measurement.
OPEN Measures OPEN for the xture compensation.
SHORT Measures SHORT standard for the xture compensation.
LOAD Measures LOAD standard for the xture compensation.
COMP POINT [ ] Toggles between FIXED and USER DEFINED,
to select the xture compensation measurement points.
When [FIXED] is displayed, the analyzer performs xture
compensation measurements on points xed across the full
frequency sweep range, and the e ective value for the points
between these measured points will be calculated using the
interpolation method. When [USER] is displayed, the analyzer
performs xture compensation measurements on the same points
as the current stimulus setting.
DONE:COMPEN Completes the xture compensation and then
computes and stores the error coecients.
RESUME COMP SEQ Eliminates the need to restart a xture
compensation sequence that was interrupted to access some other
menu. Goes back to the point where the xture compensation
sequence was interrupted.
OPEN ON off Turns OPEN xture compensation on or off.
SHORT ON off Turns SHORT xture compensation on or off.
LOAD ON off Turns LOAD xture compensation on or off.
NNNNNNNNNNNNNN
NNNNNNNNNNNNNNNNN
NNNNNNNNNNNNNN
NNNNNNNNNNNNNNNNNNNNNNNNNNNNNNNNNNNNNNNNNNNN
NNNNNNNNNNNNNNNNNNNNNNN
NNNNNNNNNNNNNNNNNNNN
NNNNNNNNNNNNNNNNNNNNNNNNNNNNNNNNNNN
NNNNNNNNNNNNNNNNNNNNNNNNNNNNNNNNNNNNNNNNNNNNNNN
NNNNNNNNNNNNNNNNNNNNNNNNNNNNNNNNNNNNNN
NNNNNNNNNNNNNNNNNNNNNNNNNNNNNNNNNNNNNNNNN
NNNNNNNNNNNNNNNNNNNNNNNNNNNNNNNNNNNNNN
Measurement Block 5-57
4Cal5
Fixture Compensation Menu (for Permittivity Measurement)
Figure 5-44.
Fixture Compensation Menu (for Permittivity Measurement)
This menu can be accessed when Option 002 is installed and the
16453A is selected as the xture to be used.
COMPEN MENU Leads to the following softkeys, which are used to
perform a xture compensation measurement.
OPEN Measures OPEN for the xture compensation.
SHORT Measures SHORT for the xture compensation.
LOAD Measures the standard device furnished with the 16453A
for the xture compensation.
COMP POINT [ ] Toggles between FIXED and USER DEFINED,
to select the xture compensation measurement points.
When [FIXED] is displayed, the analyzer performs xture
compensation measurements on points xed across the full
sweep range, and the e ective value for the points between
these measured points will be calculated using the interpolation
method. When [USER] is displayed, the analyzer performs
xture compensation measurements on the same points as the
current stimulus setting.
DONE:COMPEN Completes the xture compensation and then
computes and stores the error coecients.
RESUME COMP SEQ Eliminates the need to restart a xture
compensation sequence that was interrupted to access some other
menu. Goes back to the point where the xture compensation
sequence was interrupted.
NNNNNNNNNNNNNNNNNNNNNNNNNNNNNNNNNNN
NNNNNNNNNNNNNN
NNNNNNNNNNNNNNNNN
NNNNNNNNNNNNNN
NNNNNNNNNNNNNNNNNNNNNNNNNNNNNNNNNNNNNNNNNNNN
NNNNNNNNNNNNNNNNNNNNNNN
NNNNNNNNNNNNNNNNNNNN
NNNNNNNNNNNNNNNNNNNNNNNNNNNNNNNNNNN
NNNNNNNNNNNNNNNNNNNNNNNNNNNNNNNNNNNNNNNNNNNNNNN
5-58 Measurement Block
4Cal5
Fixture Compensation Menu (for Permeability Measurement)
Figure 5-45.
Fixture Compensation Menu (for Permeability Measurement)
This menu can be accessed when Option 002 is installed and 16454A is
selected as xture to be used.
COMPEN MENU Leads to the following softkeys, which are used to
perform a xture compensation measurement.
SHORT Measures SHORT for the xture compensation.
COMP POINT [ ] Toggles between FIXED and USER DEFINED,
to select the xture compensation measurement points.
When [FIXED] is displayed, the analyzer performs xture
compensation measurements on points xed across the full
sweep range, and the e ective value for the points between
these measured points will be calculated using the interpolation
method. When [USER] is displayed, the analyzer performs
xture compensation measurements on the same points as the
current stimulus setting.
DONE:COMPEN Completes the xture compensation and then
computes and stores the error coecients.
RESUME COMP SEQ Eliminates the need to restart a xture
compensation sequence that was interrupted to access some other
menu. Goes back to the point where the xture compensation
sequence was interrupted.
NNNNNNNNNNNNNNNNNNNNNNNNNNNNNNNNNNN
NNNNNNNNNNNNNNNNN
NNNNNNNNNNNNNNNNNNNNNNNNNNNNNNNNNNNNNNNNNNNN
NNNNNNNNNNNNNNNNNNNNNNN
NNNNNNNNNNNNNNNNNNNN
NNNNNNNNNNNNNNNNNNNNNNNNNNNNNNNNNNN
NNNNNNNNNNNNNNNNNNNNNNNNNNNNNNNNNNNNNNNNNNNNNNN
Measurement Block 5-59
4Cal5
Calkit Menu
Figure 5-46. Calkit Menu
cal kit
NNNNNNNNNNNNNNNNNNNNNNNNNNNNNNNNNNNNNN
CAL KIT:7 mm Selects the 7 mm cal kit (the furnished cal kit)
model.
USER KIT Selects a cal kit model modi ed and stored into memory
using SAVE USER KIT by the user.
SAVE USER KIT Stores the current cal kit into memory as USER
KIT, after it has been modi ed.
MODIFY [ ] Displays the following softkeys, which are used to
modify standard de nitions.
DEFINE STANDARD Leads to the following softkeys, which are
used to de ne the OPEN, SHORT and LOAD.
OPEN: CONDUCT(G) Makes conductance value (G) of OPEN the
active function.
CAP. (C) Makes capacitance value (C) of OPEN the active
function.
SHORT: RESIST. (R) Make resistance value (R) of SHORT the
active function.
INDUCT. (L) Makes inductance value (L) of SHORT the active
function.
LOAD: RESIST. (R) Make resistance value (R) of LOAD the
active function.
REACT. (X) Make reactance value (X) of LOAD the active
function.
STD DONE (DEFINED) Terminates the standard de nition.
press this after each standard is de ned.
LABEL KIT Leads to the Letter menu to de ne a label for a new
calibration kit. This label appears in the CAL KIT softkey label
NNNNNNNNNNNNNNNNNNNNNNNNNN
NNNNNNNNNNNNNNNNNNNNNNNNNNNNNNNNNNNNNNNNN
NNNNNNNNNNNNNNNNNNNNNNNNNNNNNNNNNNNNNNNNN
NNNNNNNNNNNNNNNNNNNNNNNNNNNNNNNN
NNNNNNNNNNNNNNNNNNNNNNNNNNNNNNNNNNNNNNNNNNNNNNN
NNNNNNNNNNNNNNNNNNNNNNNNNNNNNNNNNNNNNNNNNNNNNNNNNN
NNNNNNNNNNNNNNNNNNNNNNNNNN
NNNNNNNNNNNNNNNNNNNNNNNNNNNNNNNNNNNNNNNNNNNNNNNNNNNNNNNN
NNNNNNNNNNNNNNNNNNNNNNNNNNNNNNNNNNN
NNNNNNNNNNNNNNNNNNNNNNNNNNNNNNNNNNNNNNNNNNNNNNNNNNNNN
NNNNNNNNNNNNNNNNNNNNNNNNNNNNNNNN
NNNNNNNNNNNNNNNNNNNNNNNNNNNNNNNNNNNNNNNNNNNNNNNNNNNNNNNN
NNNNNNNNNNNNNNNNNNNNNNNNNNNNN
NNNNNNNNNNNNNNNNNNNNNNN
5-60 Measurement Block
4Cal5
in the Calibration menu and the MODIFY label in the Cal Kit
menu. It is saved with the cal kit data.
KIT DONE (MODIFIED) Completes the procedure to de ne a
current cal kit.
NNNNNNNNNNNNNNNNNNNN
NNNNNNNNNNNNNNNNNNNNNNNNNNNNNNNNNNNNNNNNNNNNNNNNNNNNNNNNNNN
Figure 5-47. Calibration Standard Model
Measurement Block 5-61
4Cal5
Compen Kit Menu (for Impedance Measurement Fixture)
Figure 5-48.
Compen Kit Menu (for Impedance Measurement Fixture)
NNNNNNNNNNNNNNNNNNNNNNNNNNNNNNNNNNNNNNNNNNNNNNN
SAVE COMPEN KIT Stores the user-modi ed or user-de ned OPEN,
SHORT, and LOAD for xture compensation into memory, after it
has been modi ed.
MODIFY [ ] Leads to the following softkeys, which are used to
modify a default de nition of OPEN, SHORT, and LOAD for the
xture compensation.
DEFINE STANDARD Leads to the following softkeys, which are
used to de ne the parameters of OPEN, SHORT, and LOAD for
the xture compensation.
OPEN:CONDUCT(G) Makes conductance value (G) of OPEN the
active function.
CAP.(C) Makes capacitance value (C) of OPEN the active
function.
SHORT:RESIST.(R) Makes resistance value (R) of SHORT the
active function.
INDUCT.(L) Makes inductance value (L) of SHORT the active
function.
LOAD:RESIST.(R) Makes resistance value (R) of LOAD the
active function.
INDUCT.(L) Makes inductance value (L) of LOAD the active
function.
STD DONE (DEFINED) Completes the procedure to de ne
user-de ned OPEN, SHORT, and LOAD.
NNNNNNNNNNNNNNNNNNNNNNNNNNNNNNNN
NNNNNNNNNNNNNNNNNNNNNNNNNNNNNNNNNNNNNNNNNNNNNNN
NNNNNNNNNNNNNNNNNNNNNNNNNNNNNNNNNNNNNNNNNNNNNNN
NNNNNNNNNNNNNNNNNNNNNNN
NNNNNNNNNNNNNNNNNNNNNNNNNNNNNNNNNNNNNNNNNNNNNNNNNN
NNNNNNNNNNNNNNNNNNNNNNNNNNNNNNNN
NNNNNNNNNNNNNNNNNNNNNNNNNNNNNNNNNNNNNNNNNNNNNNN
NNNNNNNNNNNNNNNNNNNNNNNNNNNNNNNN
NNNNNNNNNNNNNNNNNNNNNNNNNNNNNNNNNNNNNNNNNNNNNNNNNNNNNNNN
5-62 Measurement Block
4Cal5
LABEL KIT Leads to the Letter menu to de ne a label for a new
set of user-de ned OPEN, SHORT, and LOAD. This label appears
in the COMPEN KIT softkey label in the Calibration menu and
the MODIFY label in the Compen Kit menu. It is saved with the
data of OPEN, SHORT, and LOAD.
KIT DONE (MODIFIED) Completes the procedure to de ne
user-de ned OPEN, SHORT, and LOAD for xture compensation.
NNNNNNNNNNNNNNNNNNNNNNNNNNNNN
NNNNNNNNNNNNNNNNNNNNNNNNNNNNNNNN
NNNNNNNNNNNNNNNNNNNN
NNNNNNNNNNNNNNNNNNNNNNNNNNNNNNNNNNNNNNNNNNNNNNNNNNNNNNNNNNN
Figure 5-49.
Parameters of OPEN, SHORT, and LOAD for the Impedance
Fixture Compensation
Measurement Block 5-63
4Cal5
Compen Kit Menu (for Permittivity Measurement Fixture)
Figure 5-50.
Compen Kit Menu (for Permittivity Measurement Fixture)
This menu can be accessed when Option 002 is installed and the
16453A is selected as the test xture to be used.
COMP KIT:TEFLON Selects Te on as the LOAD standard.
USER KIT Selects a cal kit model de ned or modi ed by the user
using SAVE COMPEN KIT key.
SAVE COMPEN KIT Stores the user-modi ed or user-de ned OPEN,
SHORT, and LOAD for xture compensation into memory, after it
has been modi ed.
MODIFY [ ] Leads to the following softkeys, which are used to
modify a default de nition of OPEN, SHORT, and LOAD for the
xture compensation.
DEFINE STANDARD Leads to the following softkeys, which are
used to de ne the parameters of OPEN, SHORT, and LOAD for
the xture compensation.
LOAD:"r REAL Makes the e ective relative permittivity of the
LOAD standard the active function.
"r LOSS Makes the relative dielectric loss factor of the LOAD
standard the active function.
THICKNESS Makes thickness of LOAD standard the active
function.
LABEL KIT Leads to the Letter menu to de ne a label for a new
set of user-de ned OPEN, SHORT, and LOAD. This label appears
in the COMPEN KIT softkey label in the Calibration menu and
NNNNNNNNNNNNNNNNNNNNNNNNNNNNNNNNNNNNNNNNNNNNNNN
NNNNNNNNNNNNNNNNNNNNNNNNNN
NNNNNNNNNNNNNNNNNNNNNNNNNNNNNNNNNNNNNNNNNNNNNNN
NNNNNNNNNNNNNNNNNNNNNNNNNNNNNNNNNNNNNNNNNNNNNNN
NNNNNNNNNNNNNNNNNNNNNNNNNNNNNNNN
NNNNNNNNNNNNNNNNNNNNNNNNNNNNNNNNNNNNNNNNNNNNNNN
NNNNNNNNNNNNNNNNNNNNNNNNNNNNNNNNNNNNN
NNNNNNNNNNNNNNNNNNNNNN
NNNNNNNNNNNNNNNNNNNNNNNNNNNNN
NNNNNNNNNNNNNNNNNNNNNNNNNNNNN
NNNNNNNNNNNNNNNNNNNNNNNNNNNNNNNN
5-64 Measurement Block
4Cal5
the MODIFY label in the Compen Kit menu. It is saved with the
calibration data.
KIT DONE (MODIFIED) Completes the procedure to de ne
user-de ned OPEN, SHORT, and LOAD for xture compensation.
NNNNNNNNNNNNNNNNNNNN
NNNNNNNNNNNNNNNNNNNNNNNNNNNNNNNNNNNNNNNNNNNNNNNNNNNNNNNNNNN
Figure 5-51.
Parameters of LOAD for the Premitttivity Fixture Compensation
Measurement Block 5-65
4Cal5
Port Extension Menu
Figure 5-52. Port Extension Menu
NNNNNNNNNNNNNNNNNNNNNNNNNNNNNNNNNNNNNNNNNNNNNNNNNNNNNNNN
EXTENSIONS ON off Turns port extension on or off. When this
function is on, all extensions de ned below it are enabled; when
off, none of the extensions are enabled.
EXTENSION VALUE Makes the port extension value the active
function. Used to add electrical delay in seconds to extend the
reference plane at the APC-7 connector on a test head to the end of
the cable.
NNNNNNNNNNNNNNNNNNNNNNNNNNNNNNNNNNNNNNNNNNNNNNN
Note
5-66 Measurement Block
For more information on the port extension, see \Port Extension" in
Chapter 11
6
Stimulus Block
The stimulus block keys and associated menus provide control of the
sweep, trigger, and source functions. The following list shows the
functions controlled by each key in the stimulus block.
Figure 6-1. Stimulus Block
4Sweep5
4Source5
4Trigger5
4Start5
4Stop5
4Center5
4Span5
Controlling delay time
Specifying number of points to be measured
Selecting sweep source
Selecting sweep type and sweep direction
Editing table for list sweep
Selecting channel coupling
Specifying output level of stimulus source
Selecting OSC level unit
Setting CW frequency for power sweep and dc bias sweep
Controlling dc bias source
Selecting trigger mode
Selecting trigger source
Selecting event caused by trigger
Restarting measurement
Setting start value of stimulus
Setting stop value of stimulus
Setting center value of stimulus
Setting span of stimulus
Stimulus Block 6-1
Functions accessed from this block
Channel Coupling
Continuous sweep
DC bias sweep
DC bias
Delay time (sweep delay, point delay)
External trigger
Linear sweep
List sweep
List sweep table edit
Log sweep
Manual trigger
Measurement Restart
Number of points
OCS level sweep
OSC level
Single sweep
Stimulus sweep range
You can access
from . . .
See the following section in this
chapter:
4Trigger5
Sweep Menu
Trigger menu
Sweep Menu
Source Menu
Sweep Menu
Trigger menu
Sweep Menu
Sweep Menu
List Menu and Edit Segment Menu
Sweep Menu
Trigger menu
Trigger menu
Test Head Selection
Sweep Menu
Source Menu
Trigger menu
4Start5
4Start5 4Stop5 4Center5 4Span5
4Sweep5
4Trigger5
4Sweep5
4Source5
4Sweep5
4Trigger5
4Sweep5
4Sweep5
4Sweep5
4Sweep5
4Trigger5
4Trigger5
4Sweep5
4Sweep5
4Source5
4Stop5
4Center5
4Span5
Sweep direction
Sweep hold
Trigger signal polarity
User-speci ed number of sweeps
4Sweep5
4Trigger5
4Trigger5
4Trigger5
For Additional Information on . . .
Preset values and Setting Range of each function setting value
All Softkey Trees
GPIB Command Reference
How to control the 4291B using an external controller or the HP
Instrument BASIC capability through the GPIB.
6-2 Stimulus Block
Sweep Menu
Trigger menu
Trigger menu
Trigger menu
See . . .
Appendix B in this manual
Appendix C in this manual
GPIB Command Reference in the
Programming Manual
Programming Manual
4Sweep5
4Sweep5
Figure 6-2. Softkey Menus Accessed from the 4Sweep5 Key
Stimulus Block 6-3
4Sweep5
Sweep Menu
Figure 6-3. Sweep Menu
NNNNNNNNNNNNNNNNNNNNNNNNNNNNNNNNNNNNNNNNNNNN
SWEEP TIME [ ] Makes sweep time the active function and leads
to the following softkeys, which are used to specify sweep time and
set automatic sweep time.
SWEEP TIME AUTO Selects the optimum (fastest) sweep time
automatically. Pressing this softkey sets the point delay time to
zero.
:h:m:s Makes manual time entry the active function. Enters \:"
automatically.
POINT DELAY TIME Makes point delay time the active function.
When the point delay time is set, the analyzer delays the start of
the measurement for the delay time speci ed at each measurement
point. (See Figure 6-4.)
SWEEP DELAY TIME Makes sweep delay time the active function.
When the sweep delay time is set, the analyzer delays the start
of the sweep for the delay time speci ed at each sweep. (See
Figure 6-4.)
NUMBER of POINTS Sets the number of data points per sweep.
Using fewer points allows a faster sweep time but the displayed
trace shows less horizontal detail. Using more points gives greater
data density and improved trace resolution, but slows the sweep.
In list frequency sweep, the number of points displayed is the total
number of frequency points for the de ned list.
COUPLED CH ON off Toggles channel coupling of the stimulus
values. With COUPLED CH ON (the preset condition), both channels
have the same stimulus values (the inactive channel takes on the
stimulus values of the active channel). For information on the
parameters that are coupled or uncoupled by the coupling function,
see the table after Figure 6-4.
NNNNNNNNNNNNNNNNNNNNNNNNNNNNNNNNNNNNNNNNNNNNNNN
NNNNNNNNNNNNNNNNNNNN
NNNNNNNNNNNNNNNNNNNNNNNNNNNNNNNNNNNNNNNNNNNNNNNNNN
NNNNNNNNNNNNNNNNNNNNNNNNNNNNNNNNNNNNNNNNNNNNNNNNNN
NNNNNNNNNNNNNNNNNNNNNNNNNNNNNNNNNNNNNNNNNNNNNNNNNN
NNNNNNNNNNNNNNNNNNNNNNNNNNNNNNNNNNNNNNNNNNNNNNNNNNNNN
NNNNNNNNNNNNNNNNNNNNNNNNNNNNNNNNNNNNNNNNN
6-4 Stimulus Block
4Sweep5
NNNNNNNNNNNNNNNNNNNNNNNNNNNNNNNN
SWEEP MENU Leads to the following softkeys, which are used to
select sweep source and sweep type.
SWP SRC:FREQ Selects frequency sweep.
NNNNNNNNNNNNNNNNNNNNNNNNNNNNNNNNNNNNNN
NNNNNNNNNNNNNNNNNNNNNNNNNNNNN
OSC LEVEL Selects OSC level sweep.
NNNNNNNNNNNNNN
DC-V Selects dc bias voltage sweep (Option 001 only).
NNNNNNNNNNNNNN
DC-I Selects dc bias current sweep (Option 001 only).
NNNNNNNNNNNNNNNNNNNNNNNNNNNNNNNNNNNNNNNNNNNNNNNNNNNNN
SWEEP TYPE:LINEAR Selects linear sweep.
NNNNNNNNNNN
LOG Selects Logarithmic sweep mode. The source is stepped in
logarithmic increments and the data is displayed on a logarithmic
graticule. If the sweep range includes zero, the sweep type is
automatically changed to linear.
LIST Selects list frequency sweep. If a list is not de ned, this
softkey performs no function.
SWEEP DIR [ ] Toggles direction of sweep between up and down.
When DOWN is selected, the analyzer sweep starts from the
stimulus STOP value and sweeps to the START value. DOWN is only
available for the OSC level, dc voltage, and dc current sweep. The
down sweep is not available for frequency sweep.
LIST MENU Leads to the List menu, which is used to control the
list sweep and de ne the list sweep table.
Figure 6-4 shows the relationship between delay time and sweep
time. The sweep delay time is not included in the sweep time. The
summation of all point delay times is added to the sweep time. When
both the sweep delay time and the point delay time are set, the
analyzer starts the sweep after waiting for both of sweep delay time
and point delay time.
NNNNNNNNNNNNNN
NNNNNNNNNNNNNNNNNNNNNNNNNNNNNNNNNNNNNNNNN
NNNNNNNNNNNNNNNNNNNNNNNNNNNNN
Figure 6-4. Sweep Delay Time and Point Delay Time
Stimulus Block 6-5
4Sweep5
Parameters that are coupled or uncoupled by stimulus channel coupling
The following parameters are
The following parameters are
If the stimulus is coupled, the
always set separately for each
following parameters are coupled: always common to both channels,
channel, even if the stimulus is
even if the stimulus is not
coupled.
coupled.
List Sweep Table
Trigger Source
Trigger Event
Port Extensions
Fixture Selection
Port Extension
Beep O /Pass/Fail
Frequency Blank
Frequency
OSC Level
dc Bias
Delay Time
Sweep Source
Sweep Type
Sweep Direction
Number of Points
Trigger Mode
Correction/Compensation
Calibration Coecients
De ne Trace
Averaging (on/o , factor)
Limit Test (on/o )
OSC Level Unit
Measurement Parameter
Format
Scale
Graticule (on/o )
Level Monitor
Limit Line
Use USER DEFINED calibration points for stable dc bias sweep
measurements
To get a stable dc bias sweep measurement result, use the user de ned
calibration point.
1.
2.
3.
4.
5.
6-6 Stimulus Block
Set NOP to 2 points.
Set START frequency to CW frequency.
Select USER DEF POINTS as the calibration points.
Perform OPEN, SHORT, and LOAD calibration measurements.
After calibration measurement, select dc bias sweep as the sweep mode
and also you can change NOP or any other settings.
4Sweep5
List Menu
Figure 6-5. List Menu
NNNNNNNNNNNNNNNNNNNNNNNNNNNNNNNNNNNNNNNNNNNNNNNNNNNNNNNNNNN
LIST DISP:FREQ BASE Displays data measured as frequency base
in the frequency list mode. The frequency scale is linear across the
total range. Because the frequency points may not distribute evenly
across the graticule, the display resolution may be uneven. This
causes the points to be more compressed in some parts of the trace
than in other parts.
ORDER BASE Displays data measured as order base in the frequency
list mode. The displayed frequency resolution is even across the
graticule, even though the frequency points are not distributed
evenly. For more information, see the explanation of \Frequency
Base and Order Base" on the next page.
EDIT LIST Leads to the following softkeys, which are used to
de ne or modify the frequency sweep list:
SEGMENT Determines a segment on the list to be modi ed. Enter
the number of a segment in the list, or use the step keys to scroll
the pointer \>" at the left to the required segment number. The
indicated segment can then be edited or deleted.
EDIT Provides the Segment menu, which is used to de ne or
modify the segment selected using SEGMENT . The segment
indicated by the pointer \>" at the left can be modi ed.
DELETE Deletes the segment indicated by the pointer \>" at the
left.
ADD Adds a new segment to be de ned with the Segment menu.
If the list is empty, a default segment is added and the Segment
menu is displayed so it can be modi ed. If the list is not empty,
the segment indicated by the pointer \>" is copied and the
Segment menu is displayed.
CLEAR LIST Leads to the following softkeys, which are used to
clear the list table.
NNNNNNNNNNNNNNNNNNNNNNNNNNNNNNNN
NNNNNNNNNNNNNNNNNNNNNNNNNNNNN
NNNNNNNNNNNNNNNNNNNNNNN
NNNNNNNNNNNNNN
NNNNNNNNNNNNNNNNNNNNNNN
NNNNNNNNNNNNNNNNNNNN
NNNNNNNNNNN
NNNNNNNNNNNNNNNNNNNNNNNNNNNNNNNN
Stimulus Block 6-7
4Sweep5
NNNNNNNNNNNNNNNNNNNNNNNNNNNNNNNNNNNNNNNNNNNN
CLEAR LIST YES Clears the entire list.
NNNNNNNN
NO Cancels the task and softkeys and returns to the edit list
menu.
LIST DONE De nes the frequency sweep list and softkeys, and
returns to the previous menu.
NNNNNNNNNNNNNNNNNNNNNNNNNNNNN
The stimulus range of a segment can not be overlapped with other segments.
The analyzer always sweeps from a lower frequency to a higher frequency
(independent of the de nition of the segments).
Frequency Base and Order Base
The result of a list sweep is displayed using one of the two display modes; frequency
base display mode or order base display mode.
Frequency base: The X-axis is linearly scaled by frequency. The analyzer
automatically scales linearly from the sweep list. When the stimulus range of a
segment is discontinuous from another segment, the segment traces are connected
by a straight line.
Order base: The X-axis is linearly scaled by the number of sweep points according
to the sweep list.
The following gures show an example of the di erence between these modes. This
measurement has two segments, one is resonance frequency and another is
anti-resonance frequency. The span of the lower segment is narrower than the span
of the higher segment. If the trace of this list is displayed on the frequency base
scale, the sweep points of interest cannot be displayed visibly (as shown in the left
graph below). The order base can display this trace as shown in the right graph.
Frequency Base
6-8 Stimulus Block
Order Base
4Sweep5
Segment Menu
Figure 6-6. Segment Menu
SEGMENT:MKR!START Sets the stimulus start value to the stimulus
value of the marker.
MKR!STOP Sets the stimulus stop value to the stimulus value of the
marker.
NUMBER of POINTS Sets the number of points for the segment.
The total number of points for all segments cannot exceed 801.
OSC LEVEL Sets the OSC level segment by segment.
POINT AVG FACTOR Sets the averaging factor of the averaging on
point for the segment.
MORE Leads to the following softkeys:
SEGMENT:START Sets the start frequency of a segment.
STOP Sets the stop frequency of a segment.
CENTER Sets the center frequency of a segment.
SPAN Sets the frequency span of a segment about a speci ed
center frequency.
SEGMENT QUIT Returns to the previous softkey menu without
saving the modi ed segment.
SEGMENT DONE Saves the modi ed segment and returns to the
previous softkey menu.
NNNNNNNNNNNNNNNNNNNNNNNNNNNNNNNNNNNNNNNNNNNNNNNNNNNNNNN
NNNNNNNNNNNNNNNNNNNNNNNNNNNN
NNNNNNNNNNNNNNNNNNNNNNNNNNNNNNNNNNNNNNNNNNNNNNNNNN
NNNNNNNNNNNNNNNNNNNNNNNNNNNNN
NNNNNNNNNNNNNNNNNNNNNNNNNNNNNNNNNNNNNNNNNNNNNNNNNN
NNNNNNNNNNNNNN
NNNNNNNNNNNNNNNNNNNNNNNNNNNNNNNNNNNNNNNNN
NNNNNNNNNNNNNN
NNNNNNNNNNNNNNNNNNNN
NNNNNNNNNNNNNN
NNNNNNNNNNNNNNNNNNNNNNNNNNNNNNNNNNNNNN
NNNNNNNNNNNNNNNNNNNNNNNNNNNNNNNNNNNNNN
Stimulus Block 6-9
4Source5
4Source5
Figure 6-7. Softkey Menus Accessed from the 4Source5 Key
Source Menu
NNNNNNNNNNNNNNNNNNNNNNNNNNNNN
OSC LEVEL Makes OSC level the active function.
NNNNNNNNNNNNNNNNNNNNNNNNNNNNNNNNNNNNNN
OSC UNIT [ ] Leads to the following softkeys, which are used
to select the OSC level unit. The OSC level unit is displayed in
brackets in the softkey label.
VOLTAGE Selects voltage as the OSC level unit.
AMPERE Selects ampere as the OSC level unit.
dBm Selects dBm as the OSC level unit.
CW FREQ Sets the frequency for the OSC level sweep and DC bias
sweep.
DC BIAS on OFF Turn dc bias on or off.
DC BIAS MENU Leads to the following softkeys, which are used to
specify level, unit, and voltage or current limit of dc bias.
SOURCE [ ] Toggles the dc bias mode between the voltage
setting (current compliance) mode and the current setting
(voltage compliance) mode. The dc bias setting mode (VOLT or
CURRENT) is displayed in brackets in the softkey label.
BIAS VOLTAGE Sets voltage of dc bias for voltage setting mode.
BIAS CUR LIMIT Sets current limit value of dc bias for voltage
setting mode.
BIAS CURRENT Sets current value of dc bias for current setting
mode.
BIAS VOLT LIMIT Sets voltage limit value of dc bias for current
setting mode.
NNNNNNNNNNNNNNNNNNNNNNN
NNNNNNNNNNNNNNNNNNNN
NNNNNNNNNNN
NNNNNNNNNNNNNNNNNNNNNNN
NNNNNNNNNNNNNNNNNNNNNNNNNNNNNNNNNNNNNNNNNNNN
NNNNNNNNNNNNNNNNNNNNNNNNNNNNNNNNNNNNNN
NNNNNNNNNNNNNNNNNNNNNNNNNNNNNNNN
NNNNNNNNNNNNNNNNNNNNNNNNNNNNNNNNNNNNNN
NNNNNNNNNNNNNNNNNNNNNNNNNNNNNNNNNNNNNNNNNNNN
NNNNNNNNNNNNNNNNNNNNNNNNNNNNNNNNNNNNNN
NNNNNNNNNNNNNNNNNNNNNNNNNNNNNNNNNNNNNNNNNNNNNNN
6-10 Stimulus Block
4Source5
Note
The dc bias setting is common to both channels. In other words, you
cannot turn on or o the dc bias of either channel 1 or 2.
The dc bias is automatically turned o when the calibration or xture
compensation measurement is done.
Marker Level Monitor Function
The analyzer can monitor the OSC level output and dc bias level applied to the DUT
at each stimulus point using the marker. The softkey for the marker level monitor
can be accessed from the 4Utility5 key in the MARKER block. See \4Utility5" in
Chapter 7.
Source level value entered is not equal to the value applied to the DUT
For example, the OSC level voltage value displayed (or entered) is twice the value when terminating with 50 . (In other
words, the OSC level displayed is approximately equal to the value when the terminal is open.) When the DUT is connected
to the test terminal, the voltage dropped by the DUT's impedance causes the voltage value applied the DUT to be less than
the OSC level setting.
Vosc = 2 2V50
Vosc
' Vopen
Vosc 6= Vx
De nition of the OSC Level
The de nitions of the OSC level are as follows:
OSC voltage level (Vosc ) : Vosc is twice as large as the voltage value when terminating with 50 (approximately same as
open voltage).
OSC current level (Iosc ) : Iosc is twice as large as the current value when terminating with 50 (approximately same as
short current).
OSC power level (Posc ) : Posc is as the same as the power level when terminating with 50
Voltage Level Vosc = 22V50
Current Level Iosc = 22I50
Power Level Posc =P50
Stimulus Block 6-11
4Trigger5
4Trigger5
Figure 6-8. Softkey Menus Accessed from the 4Trigger5 Key
Trigger Menu
NNNNNNNNNNNNNNNNNNNNNNNNNNNNNNNN
SWEEP:HOLD Freezes the data trace on the display and the analyzer
stops sweeping and taking data. The notation \Hld" is displayed at
the left of the graticule. If the \3" indicator is on (at the left side of
the display), trigger a new sweep by pressing SINGLE .
NNNNNNNNNNNNNNNNNNNN
NNNNNNNNNNNNNNNNNNNN
SINGLE Makes one sweep of the data and returns to the hold mode.
NNNNNNNNNNNNNNNNNNNNNNNNNNNNNNNNNNNNNNNNNNNNNNNNNN
NUMBER of GROUPS Selects the group sweep and makes the
number of groups the active function. After the number of groups
is entered and the analyzer is triggered, the analyzer sweeps a
user-speci ed number and returns to the hold mode. If averaging on
sweep is on, set the number of groups at least equal to the selected
averaging factor to allow the measurement of a fully averaged
trace. Entering the number of groups resets the averaging counter
to 1.
CONTINUOUS Selects the continuous mode. In this mode the
analyzer sweeps automatically and continuously (the trace is
updated with each sweep).
TRIGGER:[ ] Displays the following softkeys, which are used to
select the trigger source and to select trigger event mode. The
trigger source is common to both channels.
NNNNNNNNNNNNNNNNNNNNNNNNNNNNNNNN
NNNNNNNNNNNNNNNNNNNNNNNNNNNNNNNNNNN
6-12 Stimulus Block
4Trigger5
The BUS trigger source can only be selected by using the GPIB
command.
FREE RUN Selects the internal trigger.
EXTERNAL Selects the external trigger input from the EXT
TRIGGER input BNC on the rear panel.
MANUAL Selects the manual trigger and triggers a sweep.
TRIG EVENT [ ] Toggles the trigger event mode.
NNNNNNNNNNNNNNNNNNNNNNNNNN
NNNNNNNNNNNNNNNNNNNNNNNNNN
NNNNNNNNNNNNNNNNNNNN
NNNNNNNNNNNNNNNNNNNNNNNNNNNNNNNNNNNNNNNNNNNN
FFFFFFFFFFFFFFFFFFFFFFFFFF
[ON POINT] The analyzer triggers on each data point in a sweep.
FFFFFFFFFFFFFFFFFFFFFFFFFF
[ON SWEEP] The analyzer triggers a sweep.
NNNNNNNNNNNNNNNNNNNNNNNNNNNNNNNNNNNNNNNNNNNNNNNNNNNNNNNN
TRIG PLRTY POS neg Selects the trigger signal polarity of an
externally generated signal connected to the rear panel EXT
TRIGGER input.
FFFFFFFFFFFFFFFFFFF
POS neg The sweep is started by a low-to-high transition of a TTL signal.
FFFFFFFFFFFFFFFFFFF
pos NEG The sweep is started by a high-to-low transition of a TTL signal.
NNNNNNNNNNNNNNNNNNNNNNNNNNNNNNNNNNNNNNNNNNNNNNN
MEASURE RESTART Aborts the sweep in progress and then restarts
the measurement. This can be used to update a measurement
following an adjustment of the DUT or test signal source.
If the analyzer is measuring aFFFFFFFFFFFFFFFFFFFFFFFFFFFFFFFFFFFFFFF
number of groups, the sweep counter is reset to 1.
If averaging on sweep is on, MEASURE RESTART resets the sweep-to-sweep
FFFFFFFFFFFFFFFFFFFFFFFFFFFFFFFFFFFFFFFFFFF
averaging and is e ectively the same as AVERAGING RESTART .
FFFFFFFFFFFF
FFFFFFFFFFFFFFFFFFFFFFFFFFFFFFFFFFFFFFF
If the sweep trigger is in the HOLD mode, MEASURE RESTART executes a single
sweep.
FFFFFFFFFFFFFFFFFFFFFFFF
If DUAL CHAN is on (screen displays both measurement channels),
FFFFFFFFFFFFFFFFFFFFFFFFFFFFFFFFFFFFFFF
FFFFFFFFFFFFFFFFFFFFFFFFFF
MEASURE RESTART executes a single sweep of both channels even if COUPLED CH
is o .
Stimulus Block 6-13
4Start5 4Stop5 4Center5 4Span5
4Start5 4Stop5 4Center5 4Span5
These keys de ne the start value, the stop value, the center value
and the span value of the frequency range, OSC level range, or dc
bias range of the stimulus. When one of these keys is pressed, its
function becomes the active function. The value is displayed in the
active entry area and can be changed with the knob, step keys, or
numeric keypad. Current stimulus values for the active channel are
also displayed along the bottom of the graticule.
The range can be expressed as either start/stop or center/span.
6-14 Stimulus Block
7
Marker Block
The marker block keys and associated menus provide control of the
marker function. The following list shows the functions controlled by
each key in the maker block.
Figure 7-1. Marker Block
4Marker5
4Marker
)5
4Search5
4Utility5
Controlling the marker, sub-markers, and delta-marker
Coupling markers on both channels
Changing stimulus value and amplitude values to the current
marker's value
Zooming traces
Searching for peak, maximum, minimum, or point speci ed by
amplitude value
Setting peak de nition
Listing marker values
Calculating statistics value
Displaying marker time
Selecting marker form for Smith, polar, and admittance chart
Marker Block 7-1
Functions accessed from this block
1marker
Coupling marker
Level monitor
Marker, Sub-marker
Marker list
Marker time
Marker! function
Mean value
Partial search
Peak de nition
Peak search, MAX/MIN search and target search
Peak-to-peak
Relaxation time
Smith/polar maker (0x -0y , j0j-, R+jX, G+jB)
Standard deviation
Zooming traces
You can access
from . . .
4Marker5
4Marker5
4Utility5
4Marker5
4Utility5
4Utility5
4Marker
!5
4Utility5
4Search5
4Search5
4Search5
4Utility5
4Utility5
4Utility5
4Utility5
4Marker
!5
For Additional Information on . . .
Preset values and Setting Range of each function setting value
All Softkey Trees
GPIB Command Reference
How to control the 4291B using an external controller or the HP
Instrument BASIC capability through the GPIB.
Note
7-2 Marker Block
See the following section in this
chapter:
Marker Menu
Marker Menu
Utility menu
Marker Menu
Utility menu
Utility menu
Marker! menu
Utility menu
Search range menu
Peak de nition menu
Search menu
Utility menu
Utility menu
Utility menu
Utility menu
Marker! menu
See . . .
Appendix B in this manual
Appendix C in this manual
GPIB Command Reference in the
Programming Manual
Programming Manual
The marker function is summarized in the last section of this chapter.
4Marker5
4Marker5
Figure 7-2. Softkey Menus Accessed from the 4Marker5 Key
Marker Block 7-3
4Marker5
Marker Menu
Figure 7-3. Marker Menu
NNNNNNNNNNNNNNNNNNNNNNN
SUB MKR Displays the following softkeys, which are used to turn on
sub-markers.
SUB MKR 1 , 2 , 3 , 4 , 5 , 6 , 7 These keys put a sub-marker at
the present marker position.
CLEAR SUB MKR Displays the following softkeys, which are used to
turn o sub-markers.
SUB MKR 1 , 2 , 3 , 4 , 5 , 6 , 7 These keys turn a sub-marker
off.
PRESET MKRS Turns o all markers and cancels all settings of the
marker functions.
MKR ON [ ] Selects a trace from data or memory to be applied for
the marker values. This softkey does not appear if the user trace
display is turned on.
NNNNNNNNNNNNNNNNNNNNNNNNNNNNN
NNNNN
NNNNN
NNNNN
NNNNN
NNNNN
NNNNN
NNNNN
NNNNN
NNNNN
NNNNN
NNNNN
NNNNNNNNNNNNNNNNNNNNNNNNNNNNNNNNNNNNNNNNN
NNNNNNNNNNNNNNNNNNNNNNNNNNNNN
NNNNN
NNNNNNNNNNNNNNNNNNNNNNNNNNNNNNNNNNN
NNNNNNNNNNNNNNNNNNNNNNNNNNNNNNNN
FFFFFFFFFFFFFFFF
[DATA] Shows that the data trace is selected.
FFFFFFFFFFFFFFFFFFFFF
[MEMORY] Shows that the memory trace is selected.
NNNNNNNNNNNNNNNNNNNNNNNNNNNNNNNNNNNNNN NNNNNNNNNNNNNNNNNNNNNNNNNNNNNNNNNNNNNNNNNNNN
MKR [COUPLE] MKR [UNCOUPLE] Toggles between the coupled and
uncoupled marker mode. This softkey does not appear if the user
trace display is turned on.
FFFFFFFFFFFFFFFFFFFFFFFFFFFFFFF
MKR [COUPLE] Couples the marker stimulus values for the two display channels.
Even if the stimulus is uncoupled and two sets of stimulus values are shown, the
markers track the same stimulus values on each channel as long as they are within
the displayed stimulus range.
FFFFFFFFFFFFFFFFFFFFFFFFFFFFFFFFFFFF
MKR [UNCOUPLE] Allows the marker stimulus values to be controlled independently
on each channel.
7-4 Marker Block
4Marker5
NNNNNNNNNNNNNNNNNNNNNNNNNNNNNNNNNNNNNNNNNNNN NNNNNNNNNNNNNNNNNNNNNNNNNNNNNNNN
MKR [DISCRETE] MKR [CONT] Toggles between the continuous and
discontinuous marker mode.
FFFFFFFFFFFFFFFFFFFFFFFFFFFFFFFFFFFF
MKR [DISCRETE] Places markers only on the measured trace points as determined
by the stimulus settings.
FFFFFFFFFFFFFFFFFFFFFFFFFF
MKR [CONT] Interpolates between the measured points to allow the markers to be
placed at any point on the trace. Displayed marker values are also interpolated. This
is the default marker mode
1MODE MENU Displays the Delta Mode menu that is used to de ne
the di erence in values between the marker and a 1marker.
NNNNNNNNNNNNNNNNNNNNNNNNNNNNNNNN
Marker Block 7-5
4Marker5
Delta mode menu
Figure 7-4. Delta Mode Menu
NNNNNNNNNNNNNN
1MKR Puts the delta-marker on the current position of the marker.
NNNNNNNNNNNNNNNNNNNNNNNNNNNNNNNN
FIXED 1MKR Sets a user-speci ed xed reference marker. The
stimulus and amplitude values can be set arbitrarily and can be
anywhere in the display area. Unlike other markers, the xed
1marker need not be on the trace. The xed 1marker is indicated
by a small triangle 1, and the marker stimulus and measurement
values are shown relative to this point. The notation 1Mkr is
displayed at the top right corner of the graticule.
TRACKING 1MKR Makes the active marker a 1marker (Tracking
1marker). When this softkey is pressed a 1marker moves to the
active marker position. Then the 1marker moves with the active
marker. It looks as if the 1marker tracks the active marker. In
other words, the tracking 1marker can be moved using the knob or
a marker search function such as SEARCH: PEAK .
NNNNNNNNNNNNNNNNNNNNNNNNNNNNNNNNNNNNNNNNN
NNNNNNNNNNNNNNNNNNNNNNNNNNNNNNNNNNNNNN
NNNNNNNNNNNNNNNNNNNNNNNNNNNNN
1MODE OFF Turns o the delta marker mode. Therefore, the values
displayed for the marker and sub-marker are now absolute values.
1MKR STIMULUS Changes the stimulus value of the xed 1marker.
Fixed 1marker stimulus values can be di erent for the two
channels if the channel markers are uncoupled.
FIXED 1MKR VALUE Changes the amplitude value of the xed
1marker. In a Cartesian format, this is the y-axis value. In a polar,
Smith chart, admittance chart, or complex plane format, this is
the rst part (real part) of the complex data pair. It applies to a
magnitude/phase marker, a real/imaginary marker, an R+jX marker,
or a G+jB marker. Fixed 1marker amplitude values are always
uncoupled in the two channels.
FIXED 1MKR AUX VALUE Changes the auxiliary amplitude value of
the xed 1marker (used only with a polar, Smith, admittance, or
complex plane format). This is the second part (imaginary part)
of a complex data pair. It applies to a magnitude/phase marker, a
real/imaginary marker, an R+jX marker, or a G+jB marker. Fixed
1marker auxiliary amplitude values are always uncoupled in the
two channels. This softkey does not appear if the user trace display
is turned on.
NNNNNNNNNNNNNNNNNNNNNNNNNNNNNNNNNNNNNNNNN
NNNNNNNNNNNNNNNNNNNNNNNNNNNNNNNNNNNNNNNNNNNNNNNNNN
NNNNNNNNNNNNNNNNNNNNNNNNNNNNNNNNNNNNNNNNNNNNNNNNNNNNNNNNNNNNNN
7-6 Marker Block
4Marker
)
4Marker
The 4Marker !5 key activates the marker (if it is not already active) and
provides access to the Marker! functions. The Marker! functions
change the stimulus and amplitude values to make them equal to the
current marker value. Use the knob or the numeric keypad to move
the marker to the desired position on the trace and then press the
appropriate softkey to set the speci ed parameters to that trace value.
When the values are changed, the marker can again be moved within
the range of the new parameters. The Marker! functions can select
either channel 1 or 2 as the destination channel whose value will be
changed by the performing the Marker! functions.
5
Marker
!5
! menu
Figure 7-5. Marker! Menu
MKR!CENTER Changes the stimulus center value to the stimulus
value of the marker and centers the new span about that value.
When the cross channel ( CROSS CHAN ) is turned o , this softkey
changes the center value of the active channel. When the cross
channel is turned on, this softkey changes the parameter of the
inactive channel.
MKR!START Changes the stimulus start value to the stimulus value
of the marker. When the cross channel ( CROSS CHAN ) is turned o ,
this softkey changes the start value of the active channel. When
the cross channel is turned on, this softkey changes the parameter
of the inactive channel.
MKR!STOP Changes the stimulus stop value to the stimulus value of
the marker. When the cross channel ( CROSS CHAN ) is turned o ,
this softkey changes the stop value of the active channel. When the
cross channel is turned on, this softkey changes the parameter of
the inactive channel.
NNNNNNNNNNNNNNNNNNNNNNNNNNNNNNNNNN
NNNNNNNNNNNNNNNNNNNNNNNNNNNNNNNN
NNNNNNNNNNNNNNNNNNNNNNNNNNNNNNN
NNNNNNNNNNNNNNNNNNNNNNNNNNNNNNNN
NNNNNNNNNNNNNNNNNNNNNNNNNNNN
NNNNNNNNNNNNNNNNNNNNNNNNNNNNNNNN
Marker Block 7-7
4Marker
!5
MKR!REFERENCE Sets the reference value to the marker's
amplitude value. When the cross channel ( CROSS CHAN ) is turned
o , this softkey changes the reference value of the active channel.
When the cross channel is turned on, this softkey changes the
parameter of the inactive channel.
MKR ZOOM Changes the stimulus center value to the stimulus
value of the marker and changes the stimulus span value to the
value speci ed by the zooming aperture. When the cross channel
( CROSS CHAN ) is turned o , this softkey changes the parameters
of the active channel. When the cross channel is turned on, this
softkey changes the parameters of the inactive channel.
PEAK!CENTER Moves the marker to the maximum or minimum
peak and changes the stimulus center value to the stimulus value
of the peak. When the cross channel ( CROSS CHAN ) is turned o ,
this softkey changes the center value of the active channel. When
the cross channel is turned on, this softkey moves the marker to
the peak of the active channel and changes the parameter of the
inactive channel.
MKR1!SPAN Changes the stimulus span value to the di erence
value between the marker and 1marker values. When the cross
channel ( CROSS CHAN ) is turned o , this softkey changes the span
value of the active channel. When the cross channel is turned on,
this softkey changes the parameter of the inactive channel.
MKR1!CENTER Changes the stimulus center value to the di erence
value between the marker and 1marker values. When the cross
channel ( CROSS CHAN ) is turned o , this softkey changes the center
value of the active channel. When the cross channel is turned on,
this softkey changes the parameter of the inactive channel.
ZOOMING APERTURE Sets the zooming aperture value as a
percentage of the span.
CROSS CHAN on OFF Selects the destination channel of the
Marker! functions. When the cross channel is turned o , a
Marker! function changes the stimulus or the amplitude value
of the active channel. When the cross channel is turned on, a
Marker! function changes the parameters of the inactive channel.
NNNNNNNNNNNNNNNNNNNNNNNNNNNNNNNNNNNNNNNNNNN
NNNNNNNNNNNNNNNNNNNNNNNNNNNNNNNN
NNNNNNNNNNNNNNNNNNNNNNNNNN
NNNNNNNNNNNNNNNNNNNNNNNNNNNNNNNN
NNNNNNNNNNNNNNNNNNNNNNNNNNNNNNNNNNNNN
NNNNNNNNNNNNNNNNNNNNNNNNNNNNNNNN
NNNNNNNNNNNNNNNNNNNNNNNNNNNNNNN
NNNNNNNNNNNNNNNNNNNNNNNNNNNNNNNN
NNNNNNNNNNNNNNNNNNNNNNNNNNNNNNNNNNNNN
NNNNNNNNNNNNNNNNNNNNNNNNNNNNNNNN
NNNNNNNNNNNNNNNNNNNNNNNNNNNNNNNNNNNNNNNNNNNNNNNNNN
NNNNNNNNNNNNNNNNNNNNNNNNNNNNNNNNNNNNNNNNNNNNNNNNNNNNN
FFFFFFFFFFFFFFFFFFFFFFFFFFFFFFFFFFFFFFFFFFF
CROSS CHAN ON off Selects the current inactive channel as the destination
channel.
FFFFFFFFFFFFFFFFFFFFFFFFFFFFFFFFFFFFFFFFFFF
CROSS CHAN on OFF Selects the current active channel as the destination
channel.
Turn o the channel coupling when the cross channel function is used
When you want to change one of channel 1 or 2 using marker ! functions, turn
o the channel coupling.FFFFFFFFFFFFFFFFFFFFFFFFFFFFFFF
If the channel coupling ( COUPLED CHAN ) is on, a marker ! functions always
changes the settings of both channels.
The active channel is NOT changed to the destination channel after a Marker!
function is performed, even when the cross channel is turned on.
7-8 Marker Block
The cross channel can be turned on when the dual channel is turned on.
Marker Block 7-9
4Search5
4Search5
The 4Search5 key activates the marker (if it is not already active) and
provides access to the marker search functions. The marker search
functions can quickly search the trace for speci ed information.
Figure 7-6. Softkey Menus Accessed from the 4Search5 Key
7-10 Marker Block
4Search5
Search Menu
Figure 7-7. Search Menu
NNNNNNNNNNNNNNNNNNNNNNNNNNNNNNNN
SEARCH:MAX Moves the marker to the maximum amplitude point on
the trace.
MIN Moves the marker to the minimum amplitude point on the
trace.
TARGET Moves the marker to a speci ed target point on the trace
and displays the Target menu that is used to search right or left to
resolve multiple solutions.
PEAK Moves the marker to the maximum or minimum peak and
displays Peak menu that is used to search for the next peak. The
search function searches for a peak that meets the peak de nition
speci ed in the Peak De nition menu. See the Peak De nition
menu for more information on peak de nition. This softkey does
not appear if the user trace display is turned on.
SEARCH TRK ON off Toggles the search tracking. This is used in
conjunction with other search features (such as, sarch MAX, MIN,
TARGET, and PEAK) to search each new sweep. This softkey does
not appear if the user trace display is turned on.
NNNNNNNNNNN
NNNNNNNNNNNNNNNNNNNN
NNNNNNNNNNNNNN
NNNNNNNNNNNNNNNNNNNNNNNNNNNNNNNNNNNNNNNNNNNNNNNNNNNNN
FFFFFFFFFFFFFFFFFFFFFFFFFFFFFFFFFFFFFFFFFFF
SEARCH TRK ON off Directs the analyzer to search every new trace for the speci ed
target value and puts the active marker on that point.
FFFFFFFFFFFFFFFFFFFFFFFFFFFFFFFFFFFFFFFFFFF
SEARCH TRK on OFF When the target is found on the current sweep, it remains at
the same stimulus value regardless of changes in trace
amplitude values in subsequent sweeps.
NNNNNNNNNNNNNNNNNNNNNNNNNNNNNNNN
WIDTHS [ ] Displays the menu that is used to de ne the start and
stop points for a width search and to turn width search on and off.
This softkey does not appear if the user trace display is turned on.
FFFFFFFFFFFFFF
[OFF]
FFFFFFFFFFFF
[ON]
Shows the width search is turned o .
Shows the width search is turned on.
SEARCH RANGE MENU Displays the Search Range menu.
NNNNNNNNNNNNNNNNNNNNNNNNNNNNNNNNNNNNNNNNNNNNNNNNNNNNN
Marker Block 7-11
4Search5
Target Menu
Figure 7-8. Target Menu
NNNNNNNNNNNNNNNNNNNN
TARGET Makes the target value the active function in which to
enter a value and moves the marker to a speci ed target point on
the trace.
The target value is in units appropriate to the current format.
In delta marker mode, the target value is the value relative to the
1marker. If no 1marker is on, the target value is an absolute value.
SEARCH LEFT Searches the trace for the next occurrence of the
target value to the left.
SEARCH RIGHT Searches the trace for the next occurrence of the
target value to the right.
SUB MKR Displays the following softkeys, which are used to put a
sub-marker on the present marker position.
SUB MKR 1 , 2 , 3 , 4 , 5 , 6 , 7 These keys put a sub-marker at
the present marker position.
NNNNNNNNNNNNNNNNNNNNNNNNNNNNNNNNNNN
NNNNNNNNNNNNNNNNNNNNNNNNNNNNNNNNNNNNNN
NNNNNNNNNNNNNNNNNNNNNNN
NNNNNNNNNNNNNNNNNNNNNNNNNNNNN
7-12 Marker Block
NNNNN
NNNNN
NNNNN
NNNNN
NNNNN
NNNNN
4Search5
Peak Menu
Figure 7-9. Peak Menu
NNNNNNNNNNNNNN
PEAK Moves the marker to the maximum or minimum peak.
NNNNNNNNNNNNNNNNNNNNNNNNNNNNN
NEXT PEAK Moves the marker to the next peak.
NNNNNNNNNNNNNNNNNNNNNNNNNNNNNNNNNNNNNNNNNNNN
NEXT PEAK LEFT Moves the marker to the peak on the left of the
present marker position.
NEXT PEAK RIGHT Moves the marker to the peak on the right of
the present marker position.
PEAK DEF MENU Displays the following softkeys, which are used to
de ne peak to be searched.
THRESHOLD on OFF Toggles the threshold on and o .
THRESHOLD VALUE Sets the threshold values.
MKR!THRESHOLD Changes the threshold value to the amplitude
value of the present marker position.
PEAK PLRTY POS neg Selects the peak polarity for the marker
search functions.
NNNNNNNNNNNNNNNNNNNNNNNNNNNNNNNNNNNNNNNNNNNNNNN
NNNNNNNNNNNNNNNNNNNNNNNNNNNNNNNNNNNNNNNNN
NNNNNNNNNNNNNNNNNNNNNNNNNNNNNNNNNNNNNNNNNNNNNNNNNN
NNNNNNNNNNNNNNNNNNNNNNNNNNNNNNNNNNNNNNNNNNNNNNN
NNNNNNNNNNNNNNNNNNNNNNNNNNNNNNNNNNNNNNNNNNN
NNNNNNNNNNNNNNNNNNNNNNNNNNNNNNNNNNNNNNNNNNNNNNNNNNNNNNNN
FFFFFFFFFFFFFFFFFFFFFFFFFFFFFFFFFFFFFFFFFFFFFF
PEAK PLRTY POS neg
shows the positive peak is selected.
PEAK PLRTY pos NEG
shows the negative peak is selected.
FFFFFFFFFFFFFFFFFFFFFFFFFFFFFFFFFFFFFFFFFFFFFF
NNNNNNNNNNNNNNNNNNNNNNNNNNNNNNNNNNNNNNNNNNNN
PEAK DELTA: 1X Sets the peak delta 1X value that is used to
de ne the peak.
PEAK DELTA: 1Y Sets the peak delta 1Y value that is used to
de ne the peak.
MKR!PEAK DELTA Changes the peak delta value to the smaller
value of the di erence of amplitude values between the present
maker position and both side display points of the marker.
NNNNNNNNNNNNNNNNNNNNNNNNNNNNNNNNNNNNNNNNNNNN
NNNNNNNNNNNNNNNNNNNNNNNNNNNNNNNNNNNNNNNNNNNNNN
Marker Block 7-13
4Search5
Search Peak Function De nitions
Peak polarity Detects either the positive or negative peak that is de ned by
FFFFFFFFFFFFFFFFFFFFFFFFFFFFFFFFFFFFFFFFFFFFFF
Threshold
Peak Delta
PEAK PLRTY POS neg .
Detects a peak whose amplitude value is greater than or equal to the
threshold (even if the peak polarity is negative). Threshold is used in
order to reject the noise oor.
Detects a peak whose di erences of amplitude values between the
peak and both side display points of FFFFFFFFFFFFFFFFFFFFFFFFFF
the peak are greater than or equal
to the peak delta value speci ed by PEAK DELTA . The peak delta
function is used to reject small peaks.
NNNNNNNNNNNNNNNNNNNNNNN
SUB MKR Displays the following softkeys, which are used to put a
sub-marker on the present marker position.
SUB MKR 1 , 2 , 3 , 4 , 5 , 6 , 7 These keys put a sub-marker at
the present marker position.
NNNNNNNNNNNNNNNNNNNNNNNNNNNNN
Note
7-14 Marker Block
NNNNN
NNNNN
NNNNN
NNNNN
NNNNN
NNNNN
For more information on peak de nition, see \Peak De nition" in the
last part of this chapter.
4Search5
Search Range Menu
Figure 7-10. Search Range Menu
NNNNNNNNNNNNNNNNNNNNNNNNNNNNNNNNNNNNNNNNNNNNNNNNNN
PART SRCH on OFF Turns partial search on or off. The search
range is de ned by two small triangles, \4", at the bottom of the
graticule. If no search range is de ned, the search range is the
entire trace.
MKR1!SEARCH RNG Sets the partial search range to the range
between the marker and 1marker.
MKR!LEFT RNG Sets the left (lower) border of the partial search
range at the current position of the marker.
MKR!RIGHT RNG Sets the right (higher) border of the partial search
range at the current position of the marker.
NNNNNNNNNNNNNNNNNNNNNNNNNNNNNNNNNNNNNNNNNNNNNNNNN
NNNNNNNNNNNNNNNNNNNNNNNNNNNNNNNNNNNNNNNN
NNNNNNNNNNNNNNNNNNNNNNNNNNNNNNNNNNNNNNNNNNN
Marker Block 7-15
4Search5
Widths Menu
Figure 7-11. Widths Menu
NNNNNNNNNNNNNNNNNNNNNNNNNNNNN
SEARCH IN Searches for the cuto point on the trace that is within
the current cuto points.
SEARCH OUT Searches for the cuto point on the trace outside the
current cuto points.
WIDTHS on OFF Turns on the width search feature and calculates
the center frequency of a lobe on the trace, width, Q, and cuto
point deviation from the center stimulus value. The cut o point
that de nes the width parameters is set using the WIDTH VALUE
softkey. For more information on the width parameters, see \Width
Function" in the last part of this chapter.
The 1marker is automatically changed to the tracking 1marker
when WIDTHS is turned on. When WIDTHS is ON, the (normal)
1marker cannot be selected.
WIDTH VALUE Sets a measurement value of a cuto point that
de nes the start and stop points for a width search. The width
search feature analyzes the center point and the width between the
trace down from (or up to) the anti-resonance point or resonance
point and the quality factor (Q) for the resonator. Width units are in
the units of the
p current format.
MKRVAL/( 2) Sets the width value to the value that equals the
marker value divided by the square root of 2.
p
MKRVAL3( 2) Sets the width value to the value that equals the
marker value multiplied by the square root of 2.
MKRVAL/2 Sets the width value to the value that equals the
marker value divided by 2.
FIXED VALUE Makes the width value the active function and sets
the width value to the value speci ed by this softkey.
NNNNNNNNNNNNNNNNNNNNNNNNNNNNNNNN
NNNNNNNNNNNNNNNNNNNNNNNNNNNNNNNNNNNNNNNNN
NNNNNNNNNNNNNNNNNNNNNNNNNNNNNNNNNNN
NNNNNNNNNNNNNNNNNNNN
NNNNNNNNNNNNNNNNNNNNNNNNNNNNNNNNNNN
NNNNNNNNNNNNNNNNNNNNNNNNNNNNNNNNNNNN
NNNNNNNNNNNNNNNNNNNNNNNNNNNNNNNNNNNN
NNNNNNNNNNNNNNNNNNNNNNNNNN
NNNNNNNNNNNNNNNNNNNNNNNNNNNNNNNNNNN
7-16 Marker Block
NNNNNNNNNNNNNNNNNNNN
4Search5
In the expanded phase mode, this function searches for the two cuto points whose
values are \+WIDTH VALUE" and \0WIDTH VALUE." For example, when the width
value is 45 , the cuto points' values are 645 .
Note
For more information on the width function, see \Width Function" in
the last part of this chapter.
Marker Block 7-17
4Utility5
4Utility5
Utility Menu
Figure 7-12. Utility Menu
NNNNNNNNNNNNNNNNNNNNNNNNNNNNNNNNNNNNNNNNNNNNNNN
MKR LIST on OFF Toggles the marker list function on and o . This
lists the stimulus values and measurement values of all markers. In
1 mode, this also lists 1marker.
STATISTICS on OFF Calculates and displays the mean, standard
deviation, and peak-to-peak values of the section of the displayed
trace in the search range. If Partial Search is off, the statistics are
calculated for the entire trace. The statistics are absolute values.
NNNNNNNNNNNNNNNNNNNNNNNNNNNNNNNNNNNNNNNNNNNNNNNNNNNNN
Statistics for Polar, Smith and Admittance Chart Formats
The statistics are calculated using the absolute value of the complex value.
A Convenient Use of Statistics
The statistics function provides a convenient way to nd the peak-to-peak value
without searching separately for the maximum and minimum values.
NNNNNNNNNNNNNNNNNNNNNNNNNNNNNNNNNNNNNNNNNNNNNNN
SMTH/POLAR MENU Displays softkeys to select the form of the
complex marker value on the Smith, polar, and admittance charts.
This softkey does not appear if the user trace display is turned on.
REAL IMAG Displays the values of the marker on a Smith chart,
an admittance chart, a polar chart, or a complex plane as a real
and imaginary pair. The complex data is separated into its real
and imaginary parts. The rst marker value given is the real
part (= M cos), and the second value is the imaginary part
(= M sin), where M = magnitude.
NNNNNNNNNNNNNNNNNNNNNNNNNNNNN
7-18 Marker Block
4Utility5
NNNNNNNNNNNNNNNNNNNNNNNNNNNNNNNNNNNNNNNNN
LIN MAG PHASE Displays a readout of the linear magnitude and
the phase of the marker. Marker magnitude values are expressed
in units of the current format and phase values in degrees.
LOG MAG PHASE Displays the logarithmic magnitude value and
the phase of the marker. Magnitude values are expressed in dB
and phase values in degrees.
R+jX Converts the marker values into rectangular form. The
complex impedance values of the active marker are displayed in
terms of resistance and reactance.
G+jB Displays the complex admittance values of the marker in
rectangular form. The marker values are displayed in terms of
conductance and susceptance (in Siemens).
SWR PHASE Displays the SWR value and phase value of the
marker.
NNNNNNNNNNNNNNNNNNNNNNNNNNNNNNNNNNNNNNNNN
NNNNNNNNNNNNNN
NNNNNNNNNNNNNN
NNNNNNNNNNNNNNNNNNNNNNNNNNNNN
Do not use the SWR-Phase marker when the analyzer displays impedance or
admittance parameters (SWR values have no meaning). Use SWR-PHASE with 0
measurements.
NNNNNNNNNNNNNNNNNNNNNNNNNNNNNNNNNNNNNNNNNNNN
MKR X AXIS [ ] Leads the following softkeys to select X-axis
value to be displayed. This softkey does not appear if the user trace
display is turned on.
MKR X AXIS STIM Displays the marker stimulus value on the
right upper corner of the screen. When the 1 mode is on, this
softkey shows a value relative to the 1marker point.
TIME Sets the x-axis units to time, (the start point is zero and the
stop point is the value of the sweep time). The marker indicates
the elapsed time since the sweep started. This function is useful
for testing a DUT's time transition characteristics at a certain
xed frequency by setting the span to zero. When the 1 mode is
on, this softkey shows a value relative to the 1marker point.
1/2F Displays the relaxation time (the value of 1/2frequency)
instead of the marker stimulus value read-out. This capability is
available for the frequency sweep only. When the 1 mode is on,
this softkey shows a value relative to the 1marker point.
LEVEL MON [ ] Leads to the following softkeys, which are used to
monitor output level of OSC level or dc bias. When this function is
turned on, the output level on a marker point is displayed on the
top right of the screen. This softkey does not appear if the user
trace display is turned on.
OFF Turns o the level monitor function. The marker displays
normal marker value.
AC-V Displays the voltage value of the OSC level on the marker
points.
AC-I Displays the current value of the OSC level on the marker
points.
DC-V Displays the voltage value of the dc bias on the marker
points.
DC-I Displays the current value of the dc bias on the marker
points.
NNNNNNNNNNNNNNNNNNNNNNNNNNNNNNNNNNNNNNNNNNNNNNN
NNNNNNNNNNNNNN
NNNNNNNNNNNNNNNNN
NNNNNNNNNNNNNNNNNNNNNNNNNNNNNNNNNNNNNNNNN
NNNNNNNNNNN
NNNNNNNNNNNNNN
NNNNNNNNNNNNNN
NNNNNNNNNNNNNN
NNNNNNNNNNNNNN
Marker Block 7-19
Marker Function
Marker Function
Three Types of Markers
Three types of markers are provided for each channel. The rst is
the active marker (or the marker) that is displayed on the screen
(as 5) when 4Marker5, 4Maker!5, 4Search5, or 4Utility5 is pressed. When
a marker is turned on and no other function is active, the marker
can be controlled with the knob, or the step keys. The second is the
sub-markers that appear at the present marker position when a
softkey in the sub-marker menu is pressed. The seven sub-markers
can be displayed for each channel at the same time (a total of 14).
The third is the 1marker that de nes a reference position of the
delta mode. There are three 1mode markers, 1marker (normal),
tracking 1marker, and xed 1marker.
Marker Value
Markers have a stimulus value (the x-axis value in a Cartesian format)
and a measurement value (the y-axis value in a Cartesian format).
In a polar, Smith, admittance chart, or complex plane format, the
second part of a complex data pair is also provided as an auxiliary
measurement value.
The marker can be moved to any point on the trace. Its measurement
and stimulus values are displayed at the top right corner of the
graticule for each displayed channel (in units appropriate to the
display format). The displayed marker measurement values are valid
even when the measured data is above or below the range displayed
on the graticule. When marker list is turned on, stimulus values and
measurement values of all markers are listed on the graticule. In
a polar, Smith , or admittance chart format, auxiliary measurement
values of all markers are also listed.
X-axis Value to be Displayed
Stimulus Value
Normally, the marker displays the stimulus value at the current
marker position for the x-axis value.
Time
When time is selected as the x-axis value to be displayed (instead of
the marker value), the x-axis is changed to the time scale. The start
point of the x-axis is 0 seconds and the stop point indicates the sweep
time.
Relaxation Time (1/2f)
When marker relaxation time (1/2f) is selected as the x-axis value to
be displayed (instead of the stimulus value), the x-axis is changed to
the 1/2f scale.
7-20 Marker Block
Marker Function
Marker Level Monitor
The analyzer has the capability to monitor the output voltage or
current level of the OSC level or dc bias. When the level monitor is
turned on, the level monitor value on a marker point is displayed on
the screen.
The monitor value displayed is calculated from the current stimulus
setting and the impedance value measured.
OSC level monitor value
The voltage value of the OSC level applied to the DUT (Vdut ) and the
current value of the OSC level owing through the DUT (Idut ) are
calculated using the following equations:
Vdut = Vosc 2
Zmeas + 50
1
Idut = Vosc 2
Zmeas + 50
Idut = Iosc 2
Zmeas + 50
or
Where,
Vosc
Iosc
Zmeas
Zmeas
50
Voltage setting value of the OSC level
Current setting value of the OSC level
Current measurement impedance value of the DUT
Continuous/Discrete Mode
Marker values are normally continuous (that is, they are interpolated
between measured points). Alternatively, they can be set to read only
discrete measured points.
Marker on the Data Trace or on the Memory Trace
If both data and memory are displayed, you can select which marker
values apply to the data trace or the memory trace. If data or
memory is displayed (not both), the marker values apply to the trace
displayed. In a data math display (data+memory, data0memory, or
data/memory), the marker values apply to the trace resulting from the
memory math function.
1Mode
With the use of a delta marker, a delta marker mode is available
that displays both the stimulus and measurement values of the
marker relative to the reference. Any position on the trace or a
xed point can be designated as the delta marker. The 1marker can
be put on a current position of the marker. If the delta reference is
the xed 1marker, both its stimulus value and its magnitude value
(y-axis value) can be arbitrarily set anywhere in the display area (not
necessarily on the trace). If the delta marker is the tracking 1marker,
its stimulus value can be controlled and its measurement value is the
value of the trace at that stimulus value.
Marker Block 7-21
Marker Function
Marker Search Function
Markers can search for the trace maximum/minimum, any other point,
peak maximum/minimum or peak-to-peak value of all or part of the
trace. The marker and sub-markers can be used together to search for
speci ed width cuto points and calculate the width and Q. Statistical
analysis uses markers to provide a readout of the mean, standard
deviation, and peak-to-peak values of all or part of the trace.
When the format is polar, Smith, admittance chart, or complex plane
format, the marker search function searches for the primary marker
value (not the AUX value) of the point speci ed.
Applications for Marker Search on Complex Plan
To search for the maximum absolute value of the complex impedance:
FFFFFFFFFFFFFFFFFFFFFFFFFFFFFFFFFFFFFFF FFFFFFFFFFFFFFFFFFFFFFFFFFFFFFFFFF
1. Press 4Utility5 SMTH/POLAR MENU LOG MAG PHASE
2. Press 4Search5 FFFFFFFFF
MAX
To search for the maximum real part value of the complex impedance:
FFFFFFFFFFFFFFFFFFFFFFFFFFFFFFFFFFFFFFF FFFFFFFFFFFFFFFFFFFFFFFF
1. Press 4Utility5 SMTH/POLAR MENU REAL IMAG
2. Press 4Search5 FFFFFFFFF
MAX
To search for the maximum resistance value (R) of the complex impedance:
FFFFFFFFFFFFFFFFFFFFFFFFFFFFFFFFFFFFFFF FFFFFFFFFFFF
1. Press 4Utility5 SMTH/POLAR MENU R+jX
2. Press 4Search5 FFFFFFFFF
MAX
Width Function
7-22 Marker Block
The width search feature analyzes a resonator and calculates
the center point, width, and quality factor (Q) for the speci ed
bandwidth. These parameters depend on the 1marker mode. The
following table shows how each parameter is determined for each
1marker mode.
Marker Function
Parameter
Tracking 1Marker
Fixed 1Marker
bandwidth
Displays
the bandwidth value between the cuto points set by
FFFFFFFFFFFFFFFFFFFFFFFFFFFFF
WIDTH VALUE .
Center
Displays the center stimulus value Displays the stimulus value
between the cuto points (this is di erence between the center
stimulus value of the cuto points
marked by sub-marker 1).
and the xed 1marker. (This is
marked by sub-marker 1.)
Q
Displays the Q value (= cent/BW) of the trace.
Peak
Displays the amplitude value at
the peak of the lobe.
Displays the amplitude value
di erence between the amplitude
value at the peak of the lobe and
the amplitude value of the xed
1marker.
1F (left)
Displays the stimulus value
di erence between marker 2 and
the center frequency speci ed by
the 4Center5 key.
Displays the stimulus value
di erence between marker 2 and
the xed 1marker.
1F (right)
Displays the stimulus value
di erence between marker 3 and
center frequency speci ed by the
4Center5 key.
Displays the stimulus value
di erence between marker 3 and
the xed 1marker.
Figure 7-13 shows an example of the bandwidth search feature.
Figure 7-13. Bandwidth Search Example
Width Value
The width search function provides four ways to specify width value
as follows:
Marker Block 7-23
Marker Function
Enter the width value directory.
Set a value that is the marker value divided by the square root of 2.
Set a value which is the marker value multiplied by the square root
of 2.
Set a value which is the marker value divided by 2.
When 1mode is on, the width value is relative to the 1marker.
Width Value
Width Value
p
MKRVAL/( 2)
FFFFFFFFFFFFFFFFFFFFFFFFFFFFFF
p
MKRVAL3( 2)
FFFFFFFFFFFFFFFFFFFFFFFFFFFFFF
FFFFFFFFFFFFFFFFFFFFF
MKRVAL/2
FFFFFFFFFFFFFF
FIXED
1Marker OFF
1Marker ON
The active marker value
divided by the square root
of 2
The 1marker value divided
by the square root of 2
The active marker value
multiplied by the square
root of 2
The 1marker value
multiplied by the square
root of 2
The active marker value
divided by 2
The 1marker value divided
by 2
Absolute width value
Relative value to 1marker
How to determine the quality factor (Q) of resonators
To determine the Q value using the anti-resonance point:
1. Press 4Search5 to make the marker active.
FFFFFFFFFFFFFFFFFFFFFFFFFFFFFFFFFFFFFFFFFFF
2. Press FFFFFFFFFFFFFFFFFFFFFFFFFFFFFFFFFFFFFFFFFFF
SEARCH TRK on OFF to change it to SEARCH TRK ON off . Then press
FFFFFFFFFFFFFFFFFFFFFFFFFF
SEARCH:MAX to move the marker to the anti-resonance point on the trace.
FFFFFFFFFFFFFFFFFFFFFFFFFFFFF FFFFFFFFFFFFFFFFFFFFFFFFFFFFFF FFFFFFFFFFFFFFFF
p
3. Press 4Search5 FFFFFFFFFFFFFFFFFFFFFFFFFFFFF
WIDTH [off] WIDTH VALUE MKRVAL/( 2) RETURN
FFFFFFFFFFFFFFFFFFFFFFFFFFFFFFF
4. Press FFFFFFFFFFFFFFFFFFFFFFFFFFFFFFF
WIDTH on OFF to change it to WIDTH ON off . The width value, Q factor,
and several parameters are displayed on the screen.
To determine the Q value using the resonance point:
1. Press 4Search5 to make the marker active.
FFFFFFFFFFFFFFFFFFFFFFFFFFFFFFFFFFFFFFFFFFF
2. Press FFFFFFFFFFFFFFFFFFFFFFFFFFFFFFFFFFFFFFFFFFF
SEARCH TRK on off to change it to SEARCH TRK ON off . Then press
FFFFFFFFF
MIN to move the marker to the resonance point on the trace.
FFFFFFFFFFFFFFFFFFFFFFFFFFFFF FFFFFFFFFFFFFFFFFFFFFFFFFFFFFF FFFFFFFFFFFFFFFF
p
3. Press 4Search5 FFFFFFFFFFFFFFFFFFFFFFFFFFFFF
WIDTH [OFF] WIDTH VALUE MKRVAL 3( 2) RETURN
FFFFFFFFFFFFFFFFFFFFFFFFFFFFFFF
4. Press FFFFFFFFFFFFFFFFFFFFFFFFFFFFFFF
WIDTH on OFF to change it to WIDTH ON off . The width value, Q factor,
and several parameters are displayed on the screen.
To determine the Q value using the admittance chart:
FFFFFFFFFFFFFFFFFFFFFFFFFFFFFFFFFFFFFFF FFFFFFFFFFFF
1. Press 4Utility5 to make marker active. Then press SMTH/POLAR MENU G+jB to
read conductance and susceptance (assuming that the admittance circle has been
displayed on the
admittance chart).
FFFFFFFFFFFFFFFFFFFFFFFFFFFFFFFFFFFFFFFFFFF
FFFFFFFFFFFFFFFFFFFFFFFFFFFFFFFFFFFFFFFFFFF
2. Press 4Search5 SEARCH TRK on off to change it to SEARCH TRK ON off . Then
FFFFFFFFFFFFFFFFFFFFFFFFFF
press Search:MAX to move the marker to the point where the G value is
maximum on the
trace (resonance point).
FFFFFFFFFFFFFFFFFFFFFFFFFFFFF FFFFFFFFFFFFFFFFFFFFFFFFFFFFF FFFFFFFFFFFFFFFFFFFFF FFFFFFFFFFFFFFFF
3. Press 4Search5 WIDTH [OFF] WIDTH VALUE MKRVAL/2 RETURN
FFFFFFFFFFFFFFFFFFFFFFFFFFFFFFF
4. Press FFFFFFFFFFFFFFFFFFFFFFFFFFFFFFF
WIDTH on OFF to change it to WIDTH ON off . The width value, Q factor,
and several parameters are displayed on the screen.
7-24 Marker Block
Marker Function
Figure 7-14. Q Measurement Examples
There are two kinds of Q parameters
Generally, two kinds of Q factors are used to characterize electric devices, the
impedance parameter Q factor and the Q value of a coil or resonator. However, these
Q factors are quite di erent. The de nitions of them are as follows:
Q factor of Impedance Parameter
This Q factor is ratio of the resistance and reactance (or conductance and suceptance):
Q=
X
R
Where, R is resistance, X is reactance.
Q value of Width Parameter
This Q factor is the ratio of the bandwidth and center frequency of the trace:
Q=
BW
C EN T ER
Where, BW is bandwidth, CENTER is center frequency.
Marker Block 7-25
Marker Function
Peak De nition
The search function provides the de ne peak feature, which speci es
the properties of the peaks searched for by the peak search function.
The de ne peak feature also allows the peak search function to
discriminate peaks from noise.
Peak De nition
The following parameters are used in the peak de nition:
Peak polarity (positive or negative)
1X, 1Y (gradient)
Threshold value
The search functions search for a peak where the parameters of the
peak match the following conditions:
11XY 2SP AN min(1yL , 1yR )
(NOP 01)
and
Threshold Peak Amplitude Value
Where,
1yL and 1yR are the di erence in amplitude value between a peak
and the adjacent measurement points on both sides.
That is, the search functions search for a peak where, the gradient is
greater than 1Y/1X, and the amplitude is greater than the threshold
value. The search functions ignore a peak when the amplitude value
is less than the threshold even if the peak polarity is set to negative.
Figure 7-15. Peak De nition
7-26 Marker Block
8
Instrument State Block
The instrument state block keys and associated menus control
channel-independent system functions. These include controller
modes, analyzer addresses, real time clock, limit lines and limit
testing, HP Instrument BASIC, beeper, or printing, saving instrument
states and data on a built-in disk or memory disk, and the preset
state.
Figure 8-1. Instrument State Block
4System5
4Local5
4Preset5
4Copy5
4Save5
4Recall5
Controlling HP Instrument BASIC.
Adjusting the internal real time clock that is used to print the
current time and date on the head of a hard copy.
Toggling Beeper ON/OFF.
Making Limit Lines and executing Limit Testing.
Service Menu (used for testing). See the Service Manual for more
information. The Service Manual is furnished with Option 0BW.
Setting GPIB mode and addresses.
Presetting State.
Printing screen image, listing measurement data and operating
parameters, calibration kit parameters, list sweep table, and limit test
table.
Saving the instrument state and/or data to the built-in disk or
memory disk.
Recalling the instrument state and/or data from the built-in disk or
memory disk.
Instrument State Block 8-1
Functions accessed from this block
Beep on, o
Cal kit de nition table
Clock
Delete le
HP Instrument BASIC
GPIB address
Initialize disk
Limit test table
Limit testing/Limit line
List measurement value
List sweep table
Memory size for memory disk
OPEN, SHORT, LOAD de nitions for xture
compensation
Operating parameter list
Preset instrument
Print display
Recall state/data from the oppy disk and memory
disk
Save state/data to the oppy disk and memory disk
System controller / Addressable
You can access
from . . .
4Copy5
Beep menu
Copy menu
Clock menu
Save menu
Instrument BASIC menu
Local menu
Save menu
Copy menu
Limit Test menu
Copy menu
Copy menu
Memory partition menu
Copy menu
4Copy5
Copy menu
4System5
4Copy5
4System5
4Save5
4System5
4Local5
4Save5
4Copy5
4System5
4Copy5
4Copy5
4System5
4Preset5
4Copy5
4Recall5
4Save5
4Local5
For Additional Information on . . .
Preset values and Setting Range of each function setting value
All Softkey Trees
GPIB Command Reference
How to control the 4291B using an external controller or the HP
Instrument BASIC capability through the GPIB.
8-2 Instrument State Block
See the following section in this
chapter:
Copy menu
Recall menu
Save menu
Local menu
See . . .
Appendix B in this manual
Appendix C in this manual
GPIB Command Reference in the
Programming Manual
Programming Manual
4System5
4System5
Figure 8-2. Softkey Menus Accessed from the 4System5 Key
Instrument State Block 8-3
4System5
System Menu
Figure 8-3. System Menu
NNNNNNNNNNNNNNNNNNNN
IBASIC Displays the menu used to operate HP Instrument BASIC.
NNNNNNNNNNNNNNNNNNNNNNNNNNNNNNNNNNNNNN
PROGRAM MENU
NNNNNNNNNNNNNNNNNNNNNNNNNNNNNNNNNNNNNNNNNNNNNNNNNN
MEMORY PARTITION Changes the size of memory areas for HP
Instrument BASIC and the memory disk.
SET CLOCK Displays the series of menus that set an internal clock.
BEEPER MENU Displays the series of menus that set a beeper.
LIMIT MENU Displays the series of menus that de nes limits or
speci cations used to test a DUT.
LOGGING ON off Turns the logging mode on or o . When logging
is on, the analyzer logs the equivalent GPIB commands of all front
panel key inputs into the HP Instrument BASIC program.
NNNNNNNNNNNNNNNNNNNNNNNNNNNNN
NNNNNNNNNNNNNNNNNNNNNNNNNNNNNNNNNNN
NNNNNNNNNNNNNNNNNNNNNNNNNNNNNNNN
NNNNNNNNNNNNNNNNNNNNNNNNNNNNNNNNNNNNNNNNNNNN
Logging Function
When an Instrument BASIC program is running, waiting for an input, or being
edited, logging cannot be turned on.
When the analyzer does not have a program loaded, the following statements are
automatically inserted at the beginning and the end of the program.
ASSIGN @Hp4291 TO 800
END
When there are already some statements in the Interment BASIC editor, the
program lines logged are inserted at the current cursor line.
The short form of the command is logged and the sux (unit of parameter) is
omitted.
If the command logged exceeds the memory capacity for the Instrument BASIC,
error will occur.
If you make an input error when logging is ON, the analyzer generates the
equivalent codes faithfully and the resulting program is incorrect.
The logging function does not truncate the repeated nodes of the SCPI command.
This makes program lines longer than necessary.
The logging function does not take into consideration the requirements of a timing
sensitive operation such as triggering or a xture compensation procedure.
Therefore, you need to add or rewrite the lines for that part of a program to run
correctly.
8-4 Instrument State Block
4System5
NNNNNNNNNNNNNNNNNNNNNNNNNNNNNNNNNNNNNN
SERVICE MENU Displays the series of service menus described in
the Service Manual. The Service Manual is furnished with Option
0BW.
Instrument State Block 8-5
4System5
Instrument BASIC menu
Figure 8-4. Instrument BASIC Menu
NNNNNNNNNNNNNN
Step Allows you to execute one program line at a time. This is
particularly useful for debugging.
NNNNNNNNNNNNNNNNNNNNNNNNNN
Continue Resumes program execution from the point where it
paused.
NNNNNNNNNNN
Run Starts a program from its beginning.
NNNNNNNNNNNNNNNNN
Pause Pauses program execution after the current program line is
executed.
Stop Stops program execution after the current line. To restart the
program, press Run .
NNNNNNNNNNNNNN
NNNNNNNNNNN
NNNNNNNNNNNNNN
Edit Enters into the EDIT mode. In the EDIT mode, the following
softkeys are displayed on the softkey menu area.
8-6 Instrument State Block
4System5
NNNNNNNNNNNNNNNNNNNNNNNNNNNNNNNNNNNNNNNNNNNN
ASSIGN @Hp4291 Produces the command ASSIGN @Hp4291 TO
800 at the cursor's current position.
NNNNNNNNNNNNNNNNNNNNNNNNNNNNNNNNNNNNNNNNNNNN
OUTPUT @Hp4291 Produces the command OUTPUT @Hp4291;"" at
the cursor's current position.
NNNNNNNNNNNNNNNNNNNNNNNNNNNNNNNNNNNNNNNNN
ENTER @Hp4291 Produces the command ENTER @Hp4291; at the
cursor's current position.
NNNNNNNNNNN
END Produces the command END.
NNNNNNNNNNNNNNNNNNNNNNNNNNNNN
GOTO LINE Allows you to move the cursor to any line number or
to a label. After pressing GOTO LINE , type a line number or a
label and then press 4Return5. The cursor moves to the speci ed
line or label.
NNNNNNNNNNNNNNNNNNNNNNNNNNNNN
NNNNNNNNNNNNNNNNNNNNNNNNNNNNNNNNNNN
RECALL LINE Recalls the last deleted line.
NNNNNNNNNNNNNNNNNNNNNNNNNN
END EDIT Exits the edit mode.
NNNNNNNNNNN
CAT Enters the CAT command in the BASIC command line. The
CAT command displays the list of les on a disk.
NNNNNNNNNNNNNN
SAVE Enters the SAVE command in the BASIC command line. The
SAVE command saves a program as an ASCII le.
NNNNNNNNNNNNNNNNNNNNNNN
RE-SAVE Enters the RE-SAVE command in the BASIC command
line. The RE-SAVE command overwrites an old le with a new one
using the same le name .
NNNNNNNNNNN
GET Enters the GET command in the BASIC command line. The
GET command loads a speci ed ASCII le into the editor memory.
NNNNNNNNNNNNNNNNN
PURGE Enters the PURGE command in the BASIC command line.
The PURGE command deletes a speci ed le.
NNNNNNNNNNNNNNNNNNNNNNNNNNNNNNNN
INITIALIZE Enters the INITIALIZE command in the BASIC
command line. The INITIALIZE command formats a disk.
MSI [INTERNAL] The MSI [INTERNAL] command speci es a disk
device. INTERNAL selects the oppy disk; MEMORY selects the
memory disk.
NNNNNNNNNNNNNNNNNNNNNNNNNNNNNNNNNNNNNNNNNNNN
NNNNNNNNNNNNNNNNNNNNNNN
SCRATCH Enters the SCRATCH command in the BASIC command
line. Pressing the 4Return5 key after the command deletes a currently
edited program from the memory.
NNNNNNNNNNNNNNNNNNNNNNNNNN
RENumber Enters the RENumber command in the BASIC command
line. Pressing the 4Return5 key after the command renumbers the line
numbers of a program.
NNNNNNNNNNNNNN
LIST Enters the LIST command in the BASIC command line. The
LIST command outputs the program list to the screen.
NNNNNNNNNNNNNNNNNNNNNNNNNNNNNNNNNNNNNNNNN
COMMAND ENTRY Displays the softkeys that are used to enter BASIC
commands. The active entry area displays the letters, digits, and
some special characters. Three sets of letters can be scrolled using
the step keys, 4*5 and 4+5.
Instrument State Block 8-7
4System5
SELECT LETTER Selects the character pointed to by \"".
NNNNNNNNNNNNNNNNNNNNNNNNNNNNNNNNNNNNNNNNN
NNNNNNNNNNNNNNNNN
SPACE Inserts a space.
NNNNNNNNNNNNNNNNNNNNNNNNNNNNNNNN
BACK SPACE Deletes the last character entered.
NNNNNNNNNNNNNNNNNNNNNNNNNNNNNNNNNNN
ERASE TITLE Deletes all characters entered.
NNNNNNNNNNNNNN
DONE Terminates command entry and executes the command you
entered.
CANCEL Cancels command and returns to the previous menu.
NNNNNNNNNNNNNNNNNNNN
NNNNNNNNNNNNNNNNNNNNNNNNNNNNN
CLEAR I/O Enters the CLEAR I/O command in the BASIC
command line. The CLEAR I/O command causes the execution of
an I/O-related command to pause. Press Continue to resume the
execution.
NNNNNNNNNNNNNNNNN
RESET Enters the RESET command in the BASIC command line.
The RESET command terminates program execution without
con rmation.
8-8 Instrument State Block
4System5
Program Menu
Figure 8-5. Peogram Menu
NNNNNNNNNNNNNNNNNNNNNNNNNNNNN
file name Shows IBASIC program le names in the oppy disk or
memotry disk.
PREV FILES Shows previous program le list.
NEXT FILES Shows next program le list.
STOR DEV [ ] Select a strage system to oppy disk or memory
disk. [DISK] means the oppy disk drive and [MEMORY] means
the memory disk.
NNNNNNNNNNNNNNNNNNNNNNNNNNNNNNNN
NNNNNNNNNNNNNNNNNNNNNNNNNNNNNNNN
NNNNNNNNNNNNNNNNNNNNNNNNNNNNNNNNNNNNNN
NNNNNNNNNNNNNNNNNNNN
NNNNNNNNNNNNNNNNNNNNNNNNNN
Instrument State Block 8-9
4System5
Memory Partition Menu
Figure 8-6. Memory Partition Menu
mmK RAM nnK BASIC Selects the memory partitions so that mm
Kbytes are used for memory disk and nn Kbytes are used for array
of HP Instrument BASIC. In fact, the analyzer displays the sizes of
the memory disk and the BASIC area, instead of mm and nn.
DONE Displays CHANGE YES and NO softkey to execute or cancel
the change.
CHANGE YES Changes the memory partition to the one selected
and presets the instrument.
NO Cancels the change to the memory partition and returns to
the previous softkey menu.
NNNNNNNNNNNNNNNNNNNNNNNNNNNNNNNNNNNNNNNNNNNNNNNNNNNNN
NNNNNNNNNNNNNN
NNNNNNNNNNNNNNNNNNNNNNNNNNNNNNNN
NNNNNNNN
NNNNNNNNNNNNNNNNNNNNNNNNNNNNNNNN
NNNNNNNN
When the memory partition is changed . . .
When the memory partition is changed, the following settings are also changed:
The analyzer setting becomes the preset state.
The Instrument BASIC program in the program editor is lost.
All data in the memory disk and backup of the memory disk is lost.
8-10 Instrument State Block
4System5
Clock Menu
Figure 8-7. Clock Menu
NNNNNNNNNNNNNNNNNNNNNNNNNNNNNNNNNNNNNNNNN
TIME HH:MM:SS Displays the current time on the active entry area
and displays the next page to adjust time.
HOUR Enables changing the hour setting using the knob or the
numeric entry keys. After you change the hour setting, press
ENTER to restart the clock.
MIN Enables changing the minute setting using the knob or the
numeric entry keys. After you change the minute setting, press
ENTER to restart the clock.
SEC Enables changing the second setting using the knob or the
numeric entry keys. After you change the second setting, press
ENTER to restart the clock.
ENTER Restarts the internal clock.
CANCEL Returns to the previous page. Pressing this key does not
a ect the internal clock setting.
DATE DD/MM/YY Displays the current date on the active entry area
to adjust date.
MON Enables changing the month setting using the knob or the
numeric entry keys. After you change the month setting, press
ENTER to restart the clock.
DAY Enables changing the day setting using the knob or the
numeric entry keys. After you change the day setting, press
ENTER to restart the clock.
YEAR Enables changing the year setting using the knob or the
numeric entry keys. After you change the year setting, press
ENTER to restart the clock.
NNNNNNNNNNNNNN
NNNNNNNNNNNNNNNNN
NNNNNNNNNNN
NNNNNNNNNNNNNNNNN
NNNNNNNNNNN
NNNNNNNNNNNNNNNNN
NNNNNNNNNNNNNNNNN
NNNNNNNNNNNNNNNNNNNN
NNNNNNNNNNNNNNNNNNNNNNNNNNNNNNNNNNNNNNNNN
NNNNNNNNNNN
NNNNNNNNNNNNNNNNN
NNNNNNNNNNN
NNNNNNNNNNNNNNNNN
NNNNNNNNNNNNNN
NNNNNNNNNNNNNNNNN
Instrument State Block 8-11
4System5
NNNNNNNNNNNNNNNNN
ENTER Restarts the internal clock.
NNNNNNNNNNNNNNNNNNNN
CANCEL Returns to the previous page. Pressing this key does not
a ect the internal clock setting.
DATE MODE:MonDayYear Changes the displayed date to the
\month:day:year" format.
DayMonYear Changes the displayed date to the \day:month:year"
format.
NNNNNNNNNNNNNNNNNNNNNNNNNNNNNNNNNNNNNNNNNNNNNNNNNNNNNNNNNNNNNN
NNNNNNNNNNNNNNNNNNNNNNNNNNNNNNNN
8-12 Instrument State Block
4System5
Beeper Menu
Figure 8-8. Beeper Menu
NNNNNNNNNNNNNNNNNNNNNNNNNNNNNNNNNNNNNNNNNNNNNNNNNN
BEEP DONE ON off Toggles an annunciator that sounds to indicate
the completion of operations such as calibration or instrument state
save.
BEEP WARN ON off Toggles the warning annunciator. When the
annunciator is on it sounds a warning when a cautionary message is
displayed.
NNNNNNNNNNNNNNNNNNNNNNNNNNNNNNNNNNNNNNNNNNNNNNNNNN
Instrument State Block 8-13
4System5
Limit Test Menu
Figure 8-9. Limit Test Menu
NNNNNNNNNNNNNNNNNNNNNNNNNNNNNNNNNNNNNNNNNNNNNNNNNNNNN
LIMIT LINE ON off Turns limit lines on or off. If limits have
been de ned and limit lines are turned on, the limit lines are
displayed for visual comparison of the measured data in all
Cartesian formats.
Limit lines can be saved on disk
If limit lines are de ned, they are always saved on disk with an instrument
state.
Limit line table can be listed.
Copy function (accessed from 4Copy5 key) can list a limit line table. In a
listing of values with limit lines on and limit test on, the upper limit and
lower limit are listed together with the pass or fail margin, as long as other
listed data allows sucient space.
NNNNNNNNNNNNNNNNNNNNNNNNNNNNNNNNNNNNNNNNNNNNNNNNNNNNN
LIMIT TEST ON off Turns limit testing on or off. When limit
testing is on, the data is compared with the de ned limits at each
measured point. Limit tests occur at the end of each sweep,
whenever the data is updated, and when limit testing is rst turned
on.
Limit testing is available for both magnitude and phase values
in Cartesian formats. In the polar, Smith, admittance chart, and
complex plane formats, the value tested depends on the marker
mode and is the magnitude or the rst value in a complex pair.
The message \NO LIMIT LINES DISPLAYED" is displayed in polar,
Smith, admittance chart, and complex plane formats if limit lines
are turned on.
8-14 Instrument State Block
4System5
Four di erent ways to indicate pass or fail status
When limit testing is ON, the following four di erent indications of pass or
fail status are provided:
A PASS or FAIL message is displayed at the right of the display.
The limit beeper sounds if it is turned on.
In a listing of values using the copy menu, an asterisk 3 is shown next to any
measured point that is out of limits.
A bit is set in the GPIB status byte.
NNNNNNNNNNNNNNNNNNNNNNNNNN
BEEP [ ] Leads to the following softkeys, which are used to turn
on or o the limit pass or fail beep. The limit beeper is independent
of the warning beeper and the operation complete beeper, both of
which are described in the \Beeper Menu."
OFF Turns the limit beeper o .
PASS Turns the limit passes beeper on. When limit testing is on
and the pass beeper is on, a beep is emitted each time a limit test
is performed and a pass is detected.
FAIL Turns the limit fails beeper on. When limit testing is on
and the fail beeper is on, a beep is emitted each time a limit test
is performed and a failure is detected.
EDIT LIMIT LINE Displays a table of limit segments on the lower
half of the display. Also leads to the following softkey, which is
used to de ne or change limits.
SEGMENT Speci es which limit segment in the table to edit. The
list can be scrolled up or down to show other segment entries.
The pointer \>" shows the segment that can be edited or deleted.
The pointer can be moved using the entry block. If the table of
limits is designated EMPTY, new segments can be added using ADD
or EDIT .
EDIT Displays the Limit Line Entry menu that de nes or
modi es the stimulus value and limit values of a speci ed
segment. If the table is empty, a default segment is displayed.
DELETE Deletes the segment indicated by the pointer \ > ."
ADD Displays the Limit Line Entry menu and adds a new
segment to the end of the list. The new segment is initially
a duplicate of the segment indicated by the pointer \> " and
selected using SEGMENT . If the table is empty, a default segment
is displayed. The maximum number of segments is 18.
CLEAR LIST Displays the following softkeys and clears all the
segments in the limit test.
CLEAR LIST YES Clears all the segments in the limit line table
and returns to the previous menu.
NO Cancels clearing the segments and returns to the edit limit
menu.
DONE Sorts the limit segments and displays them on the display
in increasing order of stimulus values.
LIMIT LINE OFFSETS Displays the following three softkeys that
o set the complete limit set in either stimulus or amplitude value.
STIMULUS OFFSET Adds to or subtracts an o set from the
stimulus value. This allows limits already de ned to be used for
testing in a di erent stimulus range.
NNNNNNNNNNN
NNNNNNNNNNNNNN
NNNNNNNNNNNNNN
NNNNNNNNNNNNNNNNNNNNNNNNNNNNNNNNNNNNNNNNNNNNNNN
NNNNNNNNNNNNNNNNNNNNNNN
NNNNNNNNNNN
NNNNNNNNNNNNNN
NNNNNNNNNNNNNN
NNNNNNNNNNNNNNNNNNNN
NNNNNNNNNNN
NNNNNNNNNNNNNNNNNNNNNNN
NNNNNNNNNNNNNNNNNNNNNNNNNNNNNNNN
NNNNNNNNNNNNNNNNNNNNNNNNNNNNNNNNNNNNNNNNNNNN
NNNNNNNN
NNNNNNNNNNNNNN
NNNNNNNNNNNNNNNNNNNNNNNNNNNNNNNNNNNNNNNNNNNNNNNNNNNNNNNN
NNNNNNNNNNNNNNNNNNNNNNNNNNNNNNNNNNNNNNNNNNNNNNN
Instrument State Block 8-15
4System5
NNNNNNNNNNNNNNNNNNNNNNNNNNNNNNNNNNNNNNNNNNNNNNNNNN
AMPLITUDE OFFSET Adds or subtracts an o set in amplitude
value. This allows previously de ned limits to be used at a
di erent power level.
MKR!AMP.OFS. Move the limits so that they are centered an
equal amount above and below the marker at that stimulus value.
NNNNNNNNNNNNNNNNNNNNNNNNNNNNNNNNNNNNNNNN
Note
8-16 Instrument State Block
For information on the limit line concept, see \Limit Line Concept"
later in this chapter.
4System5
Limit Line Entry Menu
Figure 8-10. Limit Line Entry Menu
NNNNNNNNNNNNNNNNNNNNNNNNNNNNNNNNNNNNNNNNNNNN
STIMULUS VALUE Sets the starting stimulus value of a segment
using the entry block controls.
MKR!STIMULUS Changes the segment stimulus value to the present
marker stimulus value.
UPPER LIMIT Sets the upper limit value for the segment. Upper
and lower limits must be de ned. If no upper limit is required for a
particular measurement, force the upper limit value out of range
(for example, +1 G)
NNNNNNNNNNNNNNNNNNNNNNNNNNNNNNNNNNNNNNNN
NNNNNNNNNNNNNNNNNNNNNNNNNNNNNNNNNNN
NNNNNNNNNNNNNNNNNNNNNNNNNNNNNNNNNNN
NNNNNNNNNNNNNNNNNNNNNNNNNNNNNNNNNNN
When UPPER LIMIT or LOWER LIMIT is pressed, all the segments
in the table are displayed in terms of upper and lower limits, even if
they were de ned as delta limits and middle value.
If you attempt to set an upper limit that is lower than the lower
limit, or vice versa, both limits will be automatically set to the same
value.
LOWER LIMIT Sets the lower limit value for the segment. Upper
and lower limits must be de ned. If no lower limit is required for
a particular measurement, force the lower limit value out of range
(for example, 01 G).
DELTA LIMIT Sets the limits an equal amount above and below a
speci ed middle value, instead of setting upper and lower limits
separately. This is used in conjunction with MIDDLE VALUE or
MARKER ! MIDDLE , to set limits for testing a device that is
speci ed at a particular value plus or minus an equal tolerance.
NNNNNNNNNNNNNNNNNNNNNNNNNNNNNNNNNNN
NNNNNNNNNNNNNNNNNNNNNNNNNNNNNNNNNNN
NNNNNNNNNNNNNNNNNNNNNNNNNNNNNNNNNNNNNN
NNNNNNNNNNNNNNNNNNNNNNNNNNNNNNNNNNNNNNNNNNNNNNNNN
NNNNNNNNNNNNNNNNNNNNNNNNNNNNNNNNNNNNNN
NNNNNNNNNNNNNNNNNNNNNNNNNNNNNNNNNNNNNN
When DELTA LIMITS or MIDDLE VALUE is pressed, all the
segments in the table are displayed in these terms, even if they
were de ned as upper and lower limits.
MIDDLE VALUE Sets the midpoint for DELTA LIMITS . It uses the
entry controls to set a speci ed amplitude value vertically centered
between the limits.
NNNNNNNNNNNNNNNNNNNNNNNNNNNNNNNNNNNNNN
NNNNNNNNNNNNNNNNNNNNNNNNNNNNNNNNNNNNNN
Instrument State Block 8-17
4System5
MKR!MIDDLE Sets the midpoint for DELTA LIMITS using the
marker to set the middle amplitude value of a limit segment. Moves
the limits so that they are automatically set an equal amount above
and below the present marker amplitude value.
DONE Terminates a limit segment de nition and returns to the last
menu.
NNNNNNNNNNNNNNNNNNNNNNNNNNNNNNNNNN
NNNNNNNNNNNNNNNNNNNNNNNNNNNNNNNNNNNNNN
NNNNNNNNNNNNNN
Note
8-18 Instrument State Block
For information on the limit line concept, see \Limit Line Concept"
later in this chapter.
4Local5
This key performs the following functions:
Returns front panel control to the user. The analyzer ignores all
front panel keys (except the local key) when under the control of
an external computer. The analyzer is in \local mode" when the
user has front panel control. The analyzer is in the \remote mode"
when an external computer controls the analyzer.
Gives access to the GPIB menu that sets the controller mode and
to the address menu (where the GPIB addresses of the analyzer
and peripheral devices are entered). Only one active controller can
control the bus in a multiple-controller system. The controller mode
determines which device is system controller and which acts as the
master controller (and can regain active control at any time in a
multiple-controller system).
4Local5
Local Menu
Figure 8-11. Local Menu
NNNNNNNNNNNNNNNNNNNNNNNNNNNNNNNNNNNNNNNNNNNNNNNNNNNNN
SYSTEM CONTROLLER Sets the analyzer as the system controller.
This mode is used when peripheral devices are to be used and there
is no external controller.
This mode can only be selected manually from the analyzer's
front panel and can be used only if no active system controller is
connected to the system through GPIB. If you try to set system
controller mode when another system controller is present, the
message \CAUTION: CAN'T CHANGE - ANOTHER CONTROLLER ON BUS"
is displayed.
ADDRESSABLE ONLY Sets the analyzer as addressable only. This
mode is used when an external controller controls peripheral
devices or the analyzer.
SET ADDRESS: Displays the following softkeys:
ADDRESS:4291 Sets the GPIB address of the analyzer. There is
no physical address switch to set in the analyzer.
ADDRESS:CONTROLLER Sets the GPIB address the analyzer will
use to communicate with the external controller.
NNNNNNNNNNNNNNNNNNNNNNNNNNNNNNNNNNNNNNNNNNNNNNNNNN
NNNNNNNNNNNNNNNNNNNNNNNNNNNNNNNNNNNNNN
NNNNNNNNNNNNNNNNNNNNNNNNNNNNNNNNNNNNNN
NNNNNNNNNNNNNNNNNNNNNNNNNNNNNNNNNNNNNNNNNNNNNNNNNNNNNNNN
Instrument State Block 8-19
4Local5
The analyzer keeps the setting of the GPIB mode and GPIB addresses in the battery
backup memory, even if the analyzer is turned o .
8-20 Instrument State Block
4Preset5
4Preset5
key presets the instrument state to the preset default value.
The preset default values are listed in Appendix B. 4Preset5 has no
e ect on the following states:
Display Allocation
Display Adjustment
Color Adjustment
Clock Time/Date
Limit Line Table
GPIB Address
GPIB Mode (system controller and addressable)
User Cal Kit De nition
User Compensation Kit De nition
Fixture Selection (Impedance, Permittivity, and Permeability)
4Preset5
Instrument State Block 8-21
4Copy5
4Copy5
Figure 8-12. Softkey Menus Accessed from the 4Copy5 Key
8-22 Instrument State Block
4Copy5
Copy Menu
Figure 8-13. Copy Menu
NNNNNNNNNNNNNNNNNNNNNNNNNNNNNNNNNNNNNNNNNNNNNNNNNN
PRINT [STANDARD] Causes an exact copy of the display to be
printed. The softkey label identi es the printer selected in the print
setup menu:
FFFFFFFFFFFFFFFFFFFFF
STANDARD
For a black and white printer
COLOR
For a color printer.
FFFFFFFFFFFFFF
NNNNNNNNNNNNNNNNNNNNNNNNNNNNNNNN
COPY ABORT Aborts a print in progress.
NNNNNNNNNNNNNNNNNNNNNNNNNNNNNNNNNNNNNNNNNNNNNNNNNN
COPY SKEY on OFF Speci es whether to print out softkey labels by
switching on/off
COPY TIME ON off Turns the \time stamp" on or o for a print,
the time and date are printed out rst, followed by the information
shown on the display. See \Clock Menu" for setting the internal
clock.
PRINT SETUP Leads to the Print Setup menu, which is used to
allow you to copy the display to a printer. For information on
compatible printers, see the Chapter 12 in this manual set.
ORIENT [PORTRAIT] Speci es the orientation of printer sheets.
If your printer does not support landscape printing, this setting is
ignored.
NNNNNNNNNNNNNNNNNNNNNNNNNNNNNNNNNNNNNNNNNNNNNNNNNNNNN
NNNNNNNNNNNNNNNNNNNNNNNNNNNNNNNNNNN
NNNNNNNNNNNNNNNNNNNNNNNNNNNNNNNNNNNNNNNNNNNNNNNNNNNNN
FFFFFFFFFFFFFFFFFFFFF
PORTRAIT
FFFFFFFFFFFFFFFFFFFFFFFF
LANDSCAPE
Portrait orientation
Landscape orientation
NNNNNNNNNNNNNNNNNNNNNNNNNNNNNNNNNNNNNNNNNNNNNNN
FORMFEED ON off Speci es whether to deliver a sheet after
one screen is printed out by switching on/off. When the sheet
Instrument State Block 8-23
4Copy5
orientation is speci ed to LANDSCAPE, the FORMFEED setting is
ignored and sheets are always ejected after each screen printout.
LIST VALUES provides a tabular listing of all the measured
data points and their current values. When DUAL CHAN and
COUPLED CHAN are ON , the measured values of both channels are
listed at the same time. When LIMIT LINE and LIMIT TEST are
ON , the limit information is also listed together with the measured
values. The Screen menu is displayed to enable hard copy listings
and access new pages of the table.
NNNNNNNNNNNNNNNNNNNNNNNNNNNNNNNNNNNNNN
NNNNNNNNNNNNNNNNNNNNNNNNNNNNN
NNNNNNNNNNNNNNNNNNNNNNNNNNNNNNNNNNNNNN
NNNNNNNN
NNNNNNNNNNNNNNNNNNNNNNNNNNNNNNNN
NNNNNNNNNNNNNNNNNNNNNNNNNNNNNNNN
NNNNNNNN
NNNNNNNNNNNNNNNNNNNNNNNNNNNNN
Table 8-1 shows the data listed on the screen when DUAL CHAN
and/or COUPLED CHAN are OFF . The margin listed is the smaller of
the di erence values between the measurement value and either
the upper or lower limit. A plus margin means the test passed and a
minus margin means it failed.
NNNNNNNNNNN
NNNNNNNNNNNNNNNNNNNNNNNNNNNNNNNNNNNNNN
Table 8-1. List Value Format
Display
Format
1st column
LIN Y-AXIS
LOG Y-AXIS Sweep
Parameter
SMITH CHART
POLAR Sweep
Parameter
ADMITTANCE CHART
2nd column
Values Listed
3rd column
4th column
5th column
Measurement
Data1
Margin2
Upper Limit
Value2
Lower Limit
Value2
Measurement
Data1
Measurement
Data
Upper Limit
Value2
Lower Limit
Value2
COMPLEX PLANE
1 An * is displayed at the left of the measurement value when it fails the limit testing.
2 This is listed when the limit test is on.
The analyzer can list the values measured on both channels
When the dual channel is turned on and both channels are coupled, the sweep
parameter value is listed in the rst column, the measurement data of the active
channel is listed in the second and third columns, and the non-active channel
data is listed in the fourth and fth columns. The values listed for each channel
are the same as the data listed in the second and third columns in Table 8-1.
OPERATING PARAMETERS Displays the Screen menu and provides
a tabular listing on the display of the key parameters for both
channels. The Screen menu is presented to allow hard copy listings
and access new pages of the table.
NNNNNNNNNNNNNNNNNNNNNNNNNNNNNNNNNNNNNNNNNNNNNNNNNNNNNNNNNNNNNN
8-24 Instrument State Block
4Copy5
FFFFFFFFFFFFFFFFFFFFFFFFFFFFFFFFFFFFFFFFFFFFFFFFFFF
Parameters listed by OPERATION PARAMETERS
The following operating parameters are listed in four pages:
Sweep Source
Sweep Type
Number of Points
CAL Kit
CAL Type
Test Head
Fixture
Port Extension
Material Size (Option 002 only)
Calibration States
Compensation States
Trigger Source
Trigger Polarity
CAL KIT DEFINITION Displays the Screen menu and lists the
standard de nition of the cal kit.
COMPEN KIT DEFINITION Displays the Screen menu and lists the
standard de nition of the OPEN, SHORT and LOAD standard for
xture compensation.
LIST SWEEP TABLE Displays the copy list sweep menu that can
display a tabular listing of the list sweep table and print or plot it.
LIMIT TEST TABLE Displays the copy limit test menu that can
display a tabular listing of the limit value for limit testing and print
or plot it.
NNNNNNNNNNNNNNNNNNNNNNNNNNNNNNNNNNNNNNNNNNNNNNNNNNNNNNNN
NNNNNNNNNNNNNNNNNNNNNNNNNNNNNNNNNNNNNNNNNNNNNNNNNNNNNNNNNNNNNNNNN
NNNNNNNNNNNNNNNNNNNNNNNNNNNNNNNNNNNNNNNNNNNNNNNNNN
NNNNNNNNNNNNNNNNNNNNNNNNNNNNNNNNNNNNNNNNNNNNNNNNNN
Instrument State Block 8-25
4Copy5
Print Setup Menu
Figure 8-14. Print Setup Menu
NNNNNNNNNNNNNNNNNNNNNNNNNNNNNNNNNNNNNNNNNNNN
PRINT STANDARD Sets the print command to the default selection
(a standard printer that prints in black only or a color printer to
yield a black-only print).
COLOR Sets the print command to a default of color. The
PRINT [COLOR] command does NOT work with a black and white
printer.
PRNT COLOR [FIXED] Toggles the printing color between [FIXED]
and [VARIABLE] . If FIXED is selected, the analyzer prints a hard
copy with default colors. If VARIABLE is selected, the analyzer
prints a hard copy with colors as similar as possible to the display
colors (that can be adjusted). See \4Display5" in Chapter 5 for display
colors adjustment.
NNNNNNNNNNNNNNNNN
NNNNNNNNNNNNNNNNNNNNNNNNNNNNNNNNNNNNNNNNN
NNNNNNNNNNNNNNNNNNNNNNN
NNNNNNNNNNNNNNNNNNNNNNNNNNNNNNNNNNNNNNNNNNNNNNNNNNNNNNNN
NNNNNNNNNNNNNNNNNNNNNNNNNNNNNNNN
NNNNNNNNNNNNNNNNNNNNNNNNNN
Because of the limited number of printer ink colors, the printed color is not always
the same as the displayed color.
NNNNNNNNNNN
DPI Speci es the resolution of a printer used for printing by dpi.
The range of settable resolution is between 75 and 600 dpi.
TOP MARGIN Speci es the top margin of printing by inch. The
settable margin range is between 0 and 5 inches in step of 0.1 inch.
LEFT MARGIN Speci es the left margin of printing by inch. The
settable margin range is between 0 and 5 inches in step of 0.1 inch.
DEFAULT SETUP Resets the printing parameters to the following
default settings.
NNNNNNNNNNNNNNNNNNNNNNNNNNNNNNNN
NNNNNNNNNNNNNNNNNNNNNNNNNNNNNNNNNNN
NNNNNNNNNNNNNNNNNNNNNNNNNNNNNNNNNNNNNNNNN
8-26 Instrument State Block
4Copy5
Printing resolution:
Form feed:
Sheet orientation:
Softkey label printing:
Top margin:
Left margin:
75 dpi
ON
Portraint
OFF
1.0 inch
1.0 inch
Instrument State Block 8-27
4Copy5
Copy Limit Test Menu
Figure 8-15. Copy Limit Test Menu
DISPLAY LIST Displays the limit testing table and the Screen menu
to prepare for hard copy.
DISP MODE:UPR & LWR Selects the upper and lower formats that
display the upper limit and lower limit values.
MID & DLT Selects the middle and delta formats that display the
middle value and the maximum deviation (limit value) from the
middle value.
NNNNNNNNNNNNNNNNNNNNNNNNNNNNNNNNNNNNNN
NNNNNNNNNNNNNNNNNNNNNNNNNNNNNNNNNNNNNNNNNNNNNNNNNNNNNNNNNNN
NNNNNNNNNNNNNNNNNNNNNNNNNNNNN
Copy List Sweep Menu
Figure 8-16. Copy List Sweep Menu
DISPLAY LIST Displays the list sweep table and leads to the Screen
menu to prepare for hard copy.
DISP MODE:ST & SP Selects the start/stop format to list the sweep
parameter.
CTR & SPAN Selects the center/span format to list the sweep
parameter.
NNNNNNNNNNNNNNNNNNNNNNNNNNNNNNNNNNNNNN
NNNNNNNNNNNNNNNNNNNNNNNNNNNNNNNNNNNNNNNNNNNNNNNNNNNNN
NNNNNNNNNNNNNNNNNNNNNNNNNNNNNNNN
8-28 Instrument State Block
4Copy5
Screen Menu
Figure 8-17. Screen Menu
NNNNNNNNNNNNNNNNNNNNNNNNNNNNNNNNNNNNNNNNNNNNNNNNNN
PRINT [STANDARD] Copies one page of the tabular listings to a
compatible HP graphics printer. Either STANDARD , for a black and
white printer, or COLOR , for a color printer, is shown in brackets
(\[ ]"). This identi es which printer is selected as the default in
the print setup menu. The default setting at power on is standard.
Default text for a color printer is black.
COPY ABORT Aborts a print in progress.
NNNNNNNNNNNNNNNNNNNNNNNNNN
NNNNNNNNNNNNNNNNN
NNNNNNNNNNNNNNNNNNNNNNNNNNNNNNNN
NNNNNNNNNNNNNNNNNNNNNNNNNNNNNNNNNNNNNNNNNNNNNNNNNNNNN
COPY TIME ON off Turns printing time and date on or off,time
and date are printed rst then the information displayed. See
\Clock Menu" for setting the internal clock.
NEXT PAGE Displays the next page of information in a tabular
listing .
PREV PAGE Displays the previous page of information in a tabular
listing.
RESTORE DISPLAY Turns o the tabular listing and returns the
measurement display to the screen.
NNNNNNNNNNNNNNNNNNNNNNNNNNNNN
NNNNNNNNNNNNNNNNNNNNNNNNNNNNN
NNNNNNNNNNNNNNNNNNNNNNNNNNNNNNNNNNNNNNNNNNNNNNN
Instrument State Block 8-29
4Save5
4Save5
Figure 8-18. Softkey Menus Accessed from the 4Save5 Keys
8-30 Instrument State Block
4Save5
Recalling Instrument BASIC program
The 4Save5 and 4Recall5 keys do not access Instrument BASIC programs. Instrument
BASIC has its own menus that are accessed from the keyboard. See the
Programming Manual for more information.
Instrument State Block 8-31
4Save5
Save Menu
Figure 8-19. Save Menu
NNNNNNNNNNNNNNNNN
STATE Speci es saving the instrument states, the calibration
coecients and measurement data.
DATA ONLY Displays the menu used to save data.
NNNNNNNNNNNNNNNNNNNNNNNNNNNNN
DATA ONLY does not save instrument settings such as start and stop frequencies. BE
CAREFUL! Always make sure that you save the existing STATE if you want to use
the setup again.
NNNNNNNNNNNNNNNNNNNNNNNNNNNNNNNNNNN
SAVE BINARY Speci es saving the internal data arrays which are
de ned using the DEFINE SAVE DATA key.
NNNNNNNNNNNNNNNNNNNNNNNNNNNNNNNNNNNNNNNNNNNNNNNNNN
NNNNNNNNNNNNNNNNNNNNNNNNNNNNNNNN
SAVE ASCII Speci es saving the internal data arrays as an ASCII
le. The arrays saved are de ned by the DEFINE SAVE DATA
key.
DEFINE SAVE DATA Displays the de ne save data menu that
selects the applicable data arrays to be saved.
NNNNNNNNNNNNNNNNNNNNNNNNNNNNNNNNNNNNNNNNNNNNNNNNNN
NNNNNNNNNNNNNNNNNNNNNNNNNNNNNNNNNNNNNNNNNNNNNNNNNN
8-32 Instrument State Block
4Save5
NNNNNNNNNNNNNNNNNNNNNNNNNNNNNNNNNNNNNN
STOR DEV [ ] Selects between the oppy disk drive and
the memory disk as the storage device. [DISK] shows the
oppy disk is selected and [MEMORY] shows the memory disk is
selected.
GRAPHICS Speci es saving the graphics image on the screen as an
TIFF le.
4291A STATE Saves the instrument state and the internal data
arrays in the format so that the 4291A can recall.
NNNNNNNNNNNNNNNNNNNN
NNNNNNNNNNNNNNNNNNNNNNNNNN
NNNNNNNNNNNNNNNNNNNNNNNNNN
NNNNNNNNNNNNNNNNNNNNNNNNNNNNNNNNNNN
Note
Following settings are not saved.
Printing resolution (dpi)
Sheet orientation
Form feed
Top margin
Left margin
Softkey label printing
NNNNNNNNNNNNNNNNNNNNNNNNNNNNNNNNNNNNNN
RE-SAVE FILE Displays the Re-save File menu used to update a le
that is already saved.
BACK UP MEMO DISK Backup the instrument state and the internal
data arrays in the memory disk.
FILE UTILITIES Displays the following softkeys:
PURGE FILE Displays the Purge File menu used to remove a le
saved on the disk.
CREATE DIRECTORY Speci es creating a new directory in a DOS
format disk. This function is not available for LIF les.
CHANGE DIRECTORY Speci es changing the current directory of a
DOS format disk. This function is not available for LIF les.
COPY FILE Copies les. When a le is copied between the oppy
disk and the memory disk, the disk formats of the disk and the
memory disk must be same format.
NNNNNNNNNNNNNNNNNNNNNNNNNNNNNNNNNNNNNNNNNNNNNNNNNNNNN
NNNNNNNNNNNNNNNNNNNNNNNNNNNNNNNNNNNNNNNNNNNN
NNNNNNNNNNNNNNNNNNNNNNNNNNNNNNNN
NNNNNNNNNNNNNNNNNNNNNNNNNNNNNNNNNNNNNNNNNNNNNNNNNN
NNNNNNNNNNNNNNNNNNNNNNNNNNNNNNNNNNNNNNNNNNNNNNNNNN
NNNNNNNNNNNNNNNNNNNNNNNNNNNNN
FFFFFFFFFFFFFFFFFFFFFFFF
Use the same disk format type for COPY FILE
When you copy les using this function, use the same disk format type for both the
memory disk and the oppy disk. This copy function cannot copy les when the
format of the memory disk is di erent from the format of the oppy disk.
NNNNNNNNNNNNNNNNNNNNNNNNNNNNNNNN
INITIALIZE Displays the Initialize menu. A new disk must be
initialized before data is stored on it. The disk can be formatted
in either LIF or DOS format.
FORMAT [LIF] Toggles the disk format between the LIF and DOS
formats that are used when initializing a new disk. This setting
does not change even when the line power is cycled or the 4Preset5
key is pressed. The factory setting is LIF.
STOR DEV [ ] Selects between the oppy disk drive and
the memory disk as the storage device. [DISK] shows the
oppy disk is selected and [MEMORY] shows the memory disk is
selected.
NNNNNNNNNNNNNNNNNNNNNNNNNNNNNNNNNNNNNN
NNNNNNNNNNNNNNNNNNNNNNNNNNNNNNNNNNNNNN
NNNNNNNNNNNNNNNNNNNN
NNNNNNNNNNNNNNNNNNNNNNNNNN
Instrument State Block 8-33
4Save5
Memory disk data is lost when the power is tuned o
Use the oppy disk to store important data because the memory disk data is lost
when the power is turned o .
The storage selection does not change even when the line power is cycled or the
4Preset5 key is pressed.
8-34 Instrument State Block
4Save5
De ne Save Data Menu
Figure 8-20. De ne Save Data Menu
NNNNNNNNNNNNNNNNNNNNNNNNNNNNNNNNNNNNNNNNNNNNNNN
RAW DATA ON off Toggles saving or not saving the raw data arrays.
NNNNNNNNNNNNNNNNNNNNNNNNNNNNNNNN
CAL ON off Toggles saving or not saving the calibration coecients
arrays.
DATA ON off Toggles saving or not saving the data arrays.
MEM ON off Toggles saving or not saving the memory arrays.
DATA TRACE ON off Toggles saving or not saving the trace arrays.
MEM TRACE ON off Toggles saving or not saving the memory trace
arrays.
USER TRACE ON off Toggles saving or not saving the user trace
arrays.
NNNNNNNNNNNNNNNNNNNNNNNNNNNNNNNNNNN
NNNNNNNNNNNNNNNNNNNNNNNNNNNNNNNN
NNNNNNNNNNNNNNNNNNNNNNNNNNNNNNNNNNNNNNNNNNNNNNNNNNNNN
NNNNNNNNNNNNNNNNNNNNNNNNNNNNNNNNNNNNNNNNNNNNNNNNNN
NNNNNNNNNNNNNNNNNNNNNNNNNNNNNNNNNNNNNNNNNNNNNNNNNNNNN
Instrument State Block 8-35
4Save5
Re-Save File Menu
Figure 8-21. Re-Save File Menu
NNNNNNNNNNNNNNNNNNNNNNNNNNNNN
file name Updates the le previously saved with the current
instrument states or data. The data group to be saved is determined
by the le name's extension. See \Saving and Recalling Instrument
States and Data" later in this chapter for more details about le
name extensions.
PREV FILES Displays the previous le names in the softkey label to
re-save data.
NEXT FILES Displays the next le names in the softkey label to
re-save data.
STOR DEV[ ] Selects between the oppy disk drive and the
memory disk as the storage device. [DISK] shows the oppy disk
is selected and [MEMORY] shows the memory disk is selected. This
setting does not change even when the line power is cycled or the
4Preset5 key is pressed.
NNNNNNNNNNNNNNNNNNNNNNNNNNNNNNNN
NNNNNNNNNNNNNNNNNNNNNNNNNNNNNNNN
NNNNNNNNNNNNNNNNNNNNNNNNNNNNNNNNNNN
NNNNNNNNNNNNNNNNNNNN
NNNNNNNNNNNNNNNNNNNNNNNNNN
8-36 Instrument State Block
4Save5
Purge File Menu
Figure 8-22. Purge File Menu
NNNNNNNNNNNNNNNNNNNNNNNNNNNNN
file name Selects the le to be purged from the disk or the
memory disk.
PREV FILES Displays the previous le names in the softkey label to
purge le.
NEXT FILES Displays the next le names in the softkey label to
purge le.
STOR DEV[ ] Selects between the oppy disk drive and the
memory disk as the storage device. [DISK] shows the oppy disk
is selected and [MEMORY] shows the memory disk is selected. This
setting does not change even when the line power is cycled or the
4Preset5 key is pressed.
NNNNNNNNNNNNNNNNNNNNNNNNNNNNNNNN
NNNNNNNNNNNNNNNNNNNNNNNNNNNNNNNN
NNNNNNNNNNNNNNNNNNNNNNNNNNNNNNNNNNN
NNNNNNNNNNNNNNNNNNNN
NNNNNNNNNNNNNNNNNNNNNNNNNN
Purge Yes No Menu
Figure 8-23. Purge Yes No Menu
NNNNNNNNNNNNNNNNNNNNNNNNNNNNN
PURGE:YES Removes the le and returns to the previous menu.
NNNNNNNN
NO Returns to the previous menu without purging the le.
Instrument State Block 8-37
4Save5
Initialize Yes No Menu
Figure 8-24. Initialize Yes No Menu
NNNNNNNNNNNNNNNNNNNNNNNNNNNNNNNNNNNNNNNNNNNNNNNNNNNNNNNNNNN
INITIALIZE DISK:YES Initializes the disk or the memory disk.
When the oppy disk is selected for initialization, DISK is displayed
in the softkey label, When the memory disk is selected, MEMORY is
displayed.
NO Returns to the previous menu without initializing the oppy
disk or the memory disk.
NNNNNNNNNNNNNN
NNNNNNNNNNNNNNNNNNNN
NNNNNNNN
8-38 Instrument State Block
4Recall5
4Recall5
Recall Menu
Figure 8-25. Recall Menu
NNNNNNNNNNNNNNNNNNNNNNNNNNNNN
file name Selects a le to be loaded and loads the instrument
state or data.
PREV FILES Displays the previous set of le names used to load
data.
NEXT FILES Displays the next set of le names used to load data.
NNNNNNNNNNNNNNNNNNNNNNNNNNNNNNNN
NNNNNNNNNNNNNNNNNNNNNNNNNNNNNNNN
NNNNNNNNNNNNNNNNNNNNNNNNNNNNNNNNNNNNNN
STOR DEV [ ] Selects between the oppy disk drive and the
memory disk as the storage device. [DISK] shows the oppy disk
is selected and [MEMORY] shows the memory disk is selected. This
setting does not change even when the line power is cycled or the
4Preset5 key is pressed.
NNNNNNNNNNNNNNNNNNNN
NNNNNNNNNNNNNNNNNNNNNNNNNN
Auto Recall Function
When the analyzer is turned on, it looks for a le named \AUTOREC" from the oppy
disk or the memory disk, and if found, the analyzer automatically reads the le to
retrieve its data.
Instrument State Block 8-39
Limit Line Concept
Limit Line Concept
These are lines drawn on the display to represent upper and lower
limits or device speci cations with which to compare the DUT. Limits
are de ned by specifying several segments, where each segment is a
portion of the stimulus span. Each limit segment has an upper and a
lower starting limit value.
Limits can be de ned independently for the two channels with up to
18 segments for each channel (a total of 36 for both channels). These
can be in any combination of the two limit types.
Limit testing compares the measured data with the de ned limits, and
provides pass or fail information for each measured data point. An
out-of-limit test condition is indicated in the following ways:
Displaying a FAIL message on the screen.
Emitting a beep.
Displaying an asterisk in tabular listings of data.
Writing a bit into bit 3 and 4 of the instrument status resister.
Limits are entered in tabular form. Limit lines and limit testing can be
either on or off while limits are de ned. As new limits are entered,
the tabular columns on the display are updated, and the limit lines (if
on) are modi ed to the new de nitions. The complete limit set can be
o set in either stimulus or amplitude value.
How Limit Lines are Entered
Before limit lines can be explained, the concept of \segments"
must be understood. A segment is the node of two limit lines. See
Figure 8-26.
Figure 8-26. The Concept of Segments as a Point between Two Sets of Limit Lines
As you can see in Figure 8-26, segments are distinct points that de ne
where limit lines begin or end. Limit lines span the distance between
segments and represent the upper and lower test limits. Figure 8-26
shows another important aspect of limit lines. The far left hand side
of a set of limit lines will continue from the minimum stimulus value
8-40 Instrument State Block
Limit Line Concept
(start) and the far right hand side of a set of limit lines will continue
until the maximum stimulus value (stop).
A segment is placed at a speci c stimulus value (a single frequency
for example). The rst segment de nes the limit line value from the
minimum stimulus value. Once its stimulus value is entered, the
upper and lower test limit (5 k and 4.8 k for example) need to be
supplied.
De ning a second segment de nes where the rst set of limit lines
ends. This process is repeated to create di erent sets of limit lines,
each having new upper and lower limits. Up to 18 segments can be
entered.
Limits can be de ned independently for the two channels.
The example in Figure 8-26 shows a combination of limit lines that
change instantly and gradually.
Segment 1 is at 200 MHz and has an upper and lower limit of 5 and
4.8 k , respectively. Notice the upper and lower limit lines start at
the start frequency (100 MHz) and end at segment 1.
Segment 2 is also at 200 MHz with di erent upper and lower limits
of 5.1 k and 4.9 k , changing the limit values instantly.
Segment 3 is at 300 MHz with the same limit value as segment 2 to
obtain a at limit line.
Segment 4 is at 400 MHz with upper and lower limit values of 5.2
k and 5 k , changing the limit values gradually. Notice the upper
and lower limit lines start at the segment and continue until the
stop frequency (500 MHz).
Limit lines cannot be cut
When limit lines are needed partially along the stimulus axis, the non-limit-testing
portion must also be entered. Set the non-limit-testing portion by forcing the upper
and lower limit values out of range (+1 G and 01 G for example).
Both an upper limit and a lower limit (or delta limits) must be de ned.
If only one limit is required for a particular measurement, force the other limit out of
range (+1 G or 01 G for example).
Turning Limit Lines and Limit Testing On and O
Limit lines and limit testing features are off unless explicitly turned
on by the user. After entering the limit line information, you can turn
on the limit line feature and optionally the limit testing features.
Turning these features off has no e ect on the entered limit line
information.
Instrument State Block 8-41
Limit Line Concept
Segment Entering Order
Generally, the segments do not have to be entered in any particular
order. The analyzer automatically sorts them and lists them on the
display in increasing order of stimulus value.
One exception is when two segments have the same stimulus value
as described in Figure 8-26. If the same stimulus values exist, the
analyzer draws the limit lines according to entered segment order. For
example, in Figure 8-26, segment 1 should be entered in advance of
segment 2.
Saving the Limit Line Table
Limit line information is lost if the LINE switch is turned o .
However, the 4Save5 and 4Recall5 keys can save limit line information
along with all other current analyzer settings. Limit line table
information can be saved on a disk.
O setting the Stimulus or Amplitude of the Limit Lines
All limit line entries can be o set in either stimulus or amplitude
values. The o set a ects all segments simultaneously.
Supported Display Formats
Limit lines are displayed only in Cartesian format. In polar and Smith
chart formats, limit testing of one value is available. The value tested
depends on the marker mode and is the magnitude or the rst value
in a complex pair. The message \NO LIMIT LINES DISPLAYED" is
shown on the display in polar and Smith formats.
Use a Sucient Number of Points or Errors May Occur
Limits are checked only at the actual measured data points. If you do
not select a sucient number of points, it is possible for a device to be
out of speci cation without a limit test failure indication.
To avoid this, be sure to specify a high enough number of points.
In addition, if speci c stimulus points must be checked, use the list
sweep features described in \4Sweep5" in Chapter 6 so that the actual
measured data points are checked.
Displaying or Printing Limit Test Data
The \list values" feature in the copy menu prints or displays a table
with each measured stimulus value. The table includes limit line
and limit test information (if these functions are turned on). If limit
testing is on, an asterisk \3" is listed next to any measured value that
is out of limits.
If the limit lines are on, and other listed data allows sucient space,
the following information is also displayed:
Upper limit and lower limit
The margin by which the device passes or fails the nearest limit
8-42 Instrument State Block
Limit Line Concept
For more information about the list values feature, see \Copy Menu".
Results of Printing the Display with Limit Lines ON
If limit lines are on, they are shown when you print the display. If
limit testing is on, the PASS or FAIL message is included as well.
Note
An example of a measurement using limit lines and limit testing is
provided in the Quick Start Guide.
A sample program performing a limit test using GPIB commands is
provided in the Programming Manual .
Instrument State Block 8-43
GPIB Function
GPIB
What is GPIB?
The analyzer is factory-equipped with a remote programming digital
interface using the GPIB. This allows the analyzer to be controlled by
an external computer that sends commands or instructions to and
receives data from the analyzer using the GPIB. In this way, a remote
operator has the same control of the instrument available to a local
operator from the front panel, except for the line power switch.
In addition, the analyzer itself can use GPIB to directly control
compatible peripherals, without the use of an external controller. It
can output measurement results directly to a compatible printer or
plotter.
This section provides an overview of GPIB operation. The Quick Start
Guide provides information on how to use the analyzer to control
peripherals. It also explains how to use the analyzer as a controller to
print and plot.
More complete information on programming the analyzer remotely
over GPIB is provided in Programming Manual. The Programming
Manual includes examples of remote measurements using an HP
Vectra PC with BASIC programming. The Programming Manual
assumes familiarity with front panel operation of the instrument.
For more information on the IEEE 488.1 and 488.2 standard, see
IEEE Standard Digital Interface for Programmable Instrumentation,
published by the Institute of Electrical and Electronics Engineers,
Inc., 345 East 47th Street, New York 10017, USA.
How GPIB Works
The GPIB uses a party-line bus structure in which up to 15 devices
can be connected on one contiguous bus. The interface consists of
16 signal lines and 6 grounded lines in a shielded cable. With this
cabling system, many di erent types of devices including instruments,
computers, plotters and printers can be connected in parallel.
Every GPIB device must be capable of performing one or more of the
following interface functions:
Talker
A talker is a device capable of sending device-dependent data when
addressed to talk. There can be only one active talker at any given
time. Examples of this type of device are voltmeters, counters, and
tape readers. The analyzer is a talker when it sends trace data or
marker information over the bus.
Listener
A listener is a device capable of receiving device-dependent data
when addressed to listen. There can be any number of active listeners
at any given time. Examples of this type of device are printers, power
supplies, and signal generators. The analyzer is a listener when it is
controlled over the bus by a computer.
8-44 Instrument State Block
GPIB Function
Controller
A controller is a device capable of managing the operation of the bus
and addressing talkers and listeners. There can be only one active
controller at any time. Examples of controllers include desktop
computers and minicomputers. In a multiple-controller system, active
control can be passed between controllers, but there can only be
one system controller that acts as the master, and can regain active
control at any time. The analyzer is an active controller when it plots
or prints in the addressable mode. The analyzer is a system controller
when it is in the system controller mode.
GPIB Requirements
Number of Interconnected Devices
15 maximum
Interconnection Path/Maximum Cable Length
20 meters maximum or 2 meters per device, whichever is less.
Message Transfer Scheme
Byte serial/bit parallel asynchronous data transfer using a 3-line
handshake system.
Data Rate
Maximum of 1 megabyte per second over limited distances with
tri-state drivers. Actual data rate depends on the transfer rate of
the slowest device involved.
Address Capability
Primary addresses: 31 talk, 31 listen. A maximum of 1 active
talker and 14 active listeners at one time.
Multiple Controller Capability
In systems with more than one controller, only one can be active
at any given time. The active controller can pass control to
another controller, but only one system controller is allowed.
Analyzer GPIB Capabilities
As de ned by the IEEE 488.1 standard, the analyzer has the following
capabilities:
SH1 Full source handshake.
AH1 Full acceptor handshake.
T6 Basic talker, answers serial poll, unadresses if MLA is issued. No
TE0
L4
LE0
SR1
RL1
PP0
DC1
DT1
C1, C2, C3, C4
C11
E2
talk-only mode.
Does not have extended address of talker.
Basic listener, unadresses if MTA is issued. No listen-only mode.
Does not have extended address of listener.
Complete service request (SRQ) capabilities.
Complete remote/local capability including local lockout.
Does not respond to parallel poll.
Complete device clear.
Responds to a group execute trigger.
System controller capabilities in system controller mode.
Pass control capabilities in addressable mode.
Tri-state drivers.
Instrument State Block 8-45
GPIB Function
Bus Mode
The analyzer uses a single-bus architecture. The single bus allows both
the analyzer and the host controller to have complete access to the
peripherals in the system.
Two di erent modes are possible, system controller and addressable.
System Controller
This mode allows the analyzer to control peripherals directly in a
stand-alone environment (without an external controller). This mode
can only be selected manually from the analyzer front panel. Use this
mode for operation when no computer is connected to the analyzer.
Addressable
This is the traditional programming mode, in which the external
computer is involved in all peripheral access operations. When the
external controller is connected to the analyzer through GPIB (as
shown in Figure 8-27), this mode allows the external controller to
control the analyzer over GPIB in the talker mode in order to send
data, and in the listener mode to receive commands.
Programming information for the addressable mode is provided in the
Programming Manual.
Figure 8-27. Analyzer Bus Concept
8-46 Instrument State Block
GPIB Function
Setting Addresses
In GPIB communications, each instrument on the bus is identi ed
by an GPIB address. This address code must be di erent for each
instrument on the bus. See Appendix B for information on default
addresses, and on setting and changing addresses. These addresses are
not a ected when you press 4Preset5 or cycle the power.
Instrument State Block 8-47
Saving and Recalling
Saving and Recalling Instrument States and Data
Storage Devices
The analyzer supports two storage devices, a oppy disk drive and a
memory disk. The oppy disk drive is suited to storing large numbers
of les and long term data storage. memory disk is suited to storing
tentative data and instrument states and to store or get data quickly.
Disk Requirements
The analyzer's disk drive uses a 720 Kbyte or 1.44 Mbyte 3.5 inch
oppy disk. See the \System accessories available" in Chapter 10 for
disk part numbers.
Disk Formats
The analyzer's built-in disk drive can access both LIF (logical
interchange format) and DOS formatted disks. The disk drive and
the memory disk can also initialize a new disk in either LIF or DOS
format.
The following list shows the applicable DOS formats for the analyzer:
1.44 Mbyte, 80 tracks, double-sided, 18 sectors/track
Memory disk Capacity
The memory disk capacity is 448 Kbyte. This capacity includes the
directory area. The capacity of data area depends on the disk format
type.
Copy Files Between the memory disk and the oppy Disk
A copy function is provided to copy les between the memory disk
and the oppy disk. FILE UTILITIES in the SAVE menu displays the
softkeys used to copy les. The GPIB command MMEMory:COPY is also
available to copy les (See the Programming Manual). When the
format of the memory disk is di erent from the format of the oppy
disk, the copy function and the command can not be used.
NNNNNNNNNNNNNNNNNNNNNNNNNNNNNNNNNNNNNNNNNNNN
File Types and Data Groups
File Types
The analyzer supports two le types, binary and ASCII, that are used
to save data on a disk.
Binary File
Binary les are used to save measurement conditions and data
using the SAVE function and to retrieve binary data using the
RECALL function. External controllers and Instrument BASIC
can read measurement data from binary data les.
ASCII le
ASCII measurement data or screen image les can be read by
commonly available IBM PC based software for data analysis or
other secondary functions. The RECALL function cannot read
ASCII les.
8-48 Instrument State Block
Data Groups
Saving and Recalling
Instrument States and Internal Data Arrays (STATE)
This group consists of the instrument states that include raw
calibration coecients, the data arrays, and the memory arrays.
(Binary Files Only)
Internal Data Arrays (DATA ONLY)
The internal data arrays that are stored in the analyzer's memory
consist of the following six data arrays. See \Data Processing" in
Chapter 9 for complete information on each data array and their
relationships.(Binary and ASCII Files)
Calibration Coecients arrays contain the expanded
calibration coecients obtained by calibration and xture
compensation.
Raw data arrays contain the calibrated data obtained using
the calibration coecients.
Data arrays contain the compensated data obtained using the
compensation coecients.
Memory arrays contain the memory data arrays obtained
using the DATA!MEM operation.
Data-Trace arrays contain the formatted data.
Memory Trace arrays contain the formatted data of the
\memory arrays."
These arrays can be saved selectively to suit the application. For
example, when measuring several devices with the same measurement
settings, you may need to save only the trace arrays for each device.
Saving only the necessary arrays reduces the disk space required and
the disk access time. In addition, saving internal data also allows the
analysis of the measurement results using an external controller. See
\File Structure of Internal Data Arrays File for Binary Files" for more
information.
Graphics Images (GRAPHICS)
Graphics consist of the graphic images on the screen created using
TIFF (Tagged Image File Format).
File Type and Data Group Combinations
You can select and save to a disk one of the following four
combinations of the two le types and the four data groups.
Binary File
Instrument states and internal data arrays (STATE)
Internal data arrays (DATA ONLY binary)
Graphics image (GRAPHICS)
ASCII File
Internal data arrays (DATA ONLY ascii)
Instrument State Block 8-49
Saving and Recalling
File Names
All data saved using the built-in disk drive and the memory disk
has an identifying le name. A le name consists of the lower and
upper case alphabet, numbers, and valid symbol characters. Up to 8
characters can be used for a le name. The following table shows the
valid characters for LIF and DOS le names.
Valid Characters for File Names
Valid Characters for LIF
Valid Characters for DOS Format
A - Z (Upper case alphabet)1
a - z (Lower case alphabet)1
0 - 9 (Numeric characters)
(under line)
A - Z (Upper case alphabet)2
a - z (Lower case alphabet)2
0 - 9 (Numeric characters)
$ & # % ' ! () - @ ^ fg ~ (Symbol)
1 LIF is case sensitive
2 DOS is not case sensitive
Suxes (LIF) and Extensions (DOS)
One of the following suxes or extensions is automatically added to
the le name depending on the data group type stored in the le.
Suxes for LIF
NNNNNNNNNNNNNNNNN
_S : Instrument States and Internal Data Arrays ( STATE )
_D : Internal Data Arrays ( DATA ONLY (binary) )
NNNNNNNNNNNNNNNNNNNNNNNNNNNNNNNNNNNNNNNNNNNNNNNNNNNNNNNN
_I:
NNNNNNNNNNNNNNNNNNNNNNNNNNNNNNNNNNNNNNNNNNNNNNNNNNNNN
Internal Data Arrays as an ASCII File ( DATA ONLY (ASCII) )
_T : Graphics Image as an TIFF File ( GRAPHICS )
NNNNNNNNNNNNNNNNNNNNNNNNNN
Extensions for DOS
NNNNNNNNNNNNNNNNN
.STA : Instrument States and Internal Data Arrays ( STATE )
.DAT : Internal Data Arrays ( DATA ONLY (binary) )
NNNNNNNNNNNNNNNNNNNNNNNNNNNNNNNNNNNNNNNNNNNNNNNNNNNNNNNN
.TXT : Internal Data Arrays as an ASCII File (
DATA ONLY (ASCII) )
NNNNNNNNNNNNNNNNNNNNNNNNNNNNNNNNNNNNNNNNNNNNNNNNNNNNN
.TIF : Graphics Image as an TIFF File ( GRAPHICS )
NNNNNNNNNNNNNNNNNNNNNNNNNN
Auto Recall Function
8-50 Instrument State Block
When the analyzer is turned on, it looks for a le named \AUTOREC"
(from the oppy disk). If the le is found, the analyzer automatically
uses the le to retrieve its data.
When both state and data les have been saved, the analyzer recalls
only the state le.
Saving and Recalling
File Structure of Internal Data Arrays File for Binary Files
When internal data arrays are saved as a binary le, the arrays' le
consists of a le header at the top of the le and the data groups
following the le header.
File Header
Every internal data array le begins with a le header. The following
gure shows the header structure.
Figure 8-28. File Header Structure
Seven data switches de ne the data group that follows the le head.
Each one-byte switch is either 1 or 0 (decimal value) if the applicable
data group exists or not, respectively. The data group to be followed
is in the same order of these switches. For example, when the data
switches, RAW DATA and DATA-TRACE are 1 (on), while the others
are off, only the RAW DATA and DATA-TRACE (in this order) groups
will follow the header.
Instrument State Block 8-51
Saving and Recalling
Data Group
The data le structure of each channel begins with a header and
consists of the same structured data segments. The number of data
segments depends on the data group type as follows:
RAW DATA consists of a header and four data segments per channel
as shown in the following gure. They will follow the le header in
this order:
DATA consists of a header and a data segment by a channel.
DATA-TRACE consists of a header and a data segment by a
channel.
Figure 8-29. RAW, DATA, and DATA-TRACE Data Group Structure
8-52 Instrument State Block
Saving and Recalling
CAL consists of data segments by a channel as shown in
Figure 8-30. The rst half of the segments are for channel 1 and the
second half of the segments are for channel 2. The contents of each
segment depend on the type of calibration performed. (See \4Cal5"
in Chapter 5.)
Figure 8-30. CAL Data Group Structure
Number Of Points (NOP) is a two-byte INTEGER value. This
number is equal to the number of complex data that follows the
NOP.
DATA SEGMENT is a set of the values for each measurement
point. The values are IEEE 754 double precision oating number.
The values are two numbers (the rst value is the real part, the
second value is the imaginary part). The data size in bytes can be
determined by 162NOP.
Instrument State Block 8-53
Saving and Recalling
MEMORY consists of a header and a data segment by a channel.
MEMORY TRACE consists of a header and a data segment by a
channel.
Figure 8-31. MEMORY and MEMORY TRACE Data Group Structure
Number Of Points (NOP) of a memory trace is a two-byte INTEGER
value.
DATA SEGMENT is a set of the values for each measurement point.
The values are IEEE 754 double precision oating number. The
values are two numbers (the rst value is the real part, the second
value is the imaginary part).
8-54 Instrument State Block
Saving and Recalling
User Trace consists of a header and 8 data segments that include
user trace X-array and Y-array.
Figure 8-32. User Trace Data Group Structure
Number Of Points (NOP) is a two-byte integer value.
The values of an X-array and Y-arrays are IEEE 754 double
precision oating numbers (8 byte length). The data size in bytes
for the X-array of each user trace can be determined by 82NOPn (n
is the User Trace number).
Instrument State Block 8-55
Saving and Recalling
File Structure of Internal Data Arrays File for ASCII File
Numerical data and strings in an ASCII data le are separated by a
tab, and a string is bound by double quotation marks. An ASCII data
le consists of a status block and data blocks.
Status Block
The status block consists of two lines, the revision number and the
date code.
Data Block
The data block consists of three parts, the state part, the title line,
and the data part.
State
The state part consists of the following instrument states:
Channel number
Title on the screen
Measurement parameter
Number of points
Sweep delay time
Point delay time
Sweep time
Sweep type
Point average
Source power or CW frequency
dc bias
Title
The title part consists of the data array names saved. Data array
names are described in the next section.
Data
The data part consists of sweep parameter and numerical data of
data arrays.
Table 8-2 shows an example of an ASCII data le.
8-56 Instrument State Block
Saving and Recalling
Table 8-2. Contents of ASCII Files
Block Names
Contents
Status Block
"4291B REV1.00"
"DATE: Dec 01 1997"1
"CHANNEL: 1"
"TITLE: This is a title." 2
"MEASURE PARAMETER: IMPEDANCE MAG"
"NUMBER of POINTS: 201"
"SWEEP DELAY TIME: 62.5 us"
"POINT DELAY TIME: 325 us"
"SWEEP TYPE: LIST FREQ"
"POINT AVERAGE: OFF"
"OSC LEVEL: 500 mV"
"DC BIAS: OFF" 3
State
Data Block
Title
Data6
"Frequency" !"Raw Real"!"Raw Imag"!1114, 5
3.00000E+5!8.20007E-1!4.09729E-1!1114
1.52238E+7!9.32143E-1!-4.1914E-2
!111
..
..
..
1 This is the date when the le is saved.
2 This line is listed when the title is de ned (displayed).
3 Shows the power level of the source for a frequency sweep. If power sweep is selected, the CW
frequency is listed (for example "CW FREQ: 100 MHz").
4 \!" means tab code. Data is separated by the tab code.
5 This line lists the names of the data array saved in this le. Titles used in the ASCII les are shown in
Table 8-3.
6 Each line lists the measurement data at each measurement point. The number of lines in the data block is
the same as the number of points.
Instrument State Block 8-57
Saving and Recalling
File Structure for Single Channel and Dual Channel
If you save an ASCII le when DUAL CHANNEL is turned OFF,
the ASCII data le consists of the active channel's data. If DUAL
CHANNEL is turned ON, the ASCII data le consists of the data of
both channels 1 and 2. The channel 2 data follows the channel 1 data
as follows:
File Structures for Single and Dual
Channels
Dual Channel OFF
Dual Channel ON
Status Block
Status Block
Data Block
of
Active Channel
Data Block
of
Channel 1
(end of le)
Status Block
Data Block
of
Channel 2
Table 8-3. Data Groups and Data Array Names
Data Groups
Raw Data
Calibration Data
Data
Memory
Data-Trace
Memory-Trace
8-58 Instrument State Block
Data Array Names
Real Part
Imaginary Part
Raw Real
Raw Imag
Cal[1-1] Real
Cal[1-1] Imag
Cal[1-2] Real
Cal[1-2] Imag
Cal[1-3] Real
Cal[1-3] Imag
Cal[2-1] Real
Cal[2-1] Imag
Cal[2-2] Real
Cal[2-2] Imag
Cal[2-3] Real
Cal[2-3] Imag
Cal[3-1] Real
Cal[3-1] Imag
Cal[3-2] Real
Cal[3-2] Imag
Cal[3-3] Real
Cal[3-3] Imag
Data Real
Data Imag
Memory Real
Memory Imag
Meas Prmtr Data
Meas Prmtr Memory
Descriptions
Raw data arrays.
Cal coecient 11
Cal coecient 12
Cal coecient 13
Cal coecient 21
Cal coecient 22
Cal coecient 23
Cal coecient 31
Cal coecient 32
Cal coecient 33
Corrected Data arrays
Corrected Memory arrays
Data-Trace arrays
Memory-Trace arrays
9
Analyzer Features
Introduction
This chapter provides additional information on analyzer features.
The following subjects are covered in this chapter.
System Overview
Data Processing Flow
System Overview
Impedance analyzers usually apply a stimulus signal to the DUT. The
analyzer then measures the complex voltage value (which is applied
between the terminals of the DUT) and the complex current (which is
owing through the DUT). The impedance value is derived from both
the voltage and current values.
Figure 9-1 is a simpli ed block diagram of the analyzer. A detailed
block diagram of the analyzer is provided in the Service Manual,
together with a complete theory of system operation.
Figure 9-1. Analyzer Simpli ed Block Diagram
Analyzer Features 9-1
Data Processing
Data Processing
Overview
Note
9-2 Analyzer Features
The analyzer's receiver converts the input signal into useful
measurement information. This conversion occurs in two main
steps. First, the high frequency input signal is translated to xed
low frequency IF signals using analog mixing techniques. Second,
the IF signals are converted into digital data by an analog-to-digital
converter (adc). From this point on, all further signal processing is
performed mathematically by the analyzer microprocessor and digital
signal processor. The following paragraphs describe the sequence of
math operations and the resulting data arrays as the information ows
from the ADC to the display. They provide a good foundation for
understanding most of the measurement functions and the order in
which they are performed.
Figure 9-2 is a data processing ow diagram that shows the ow
of numerical data from the ADC to the display. The data passes
through several math operations (shown as single-line boxes). Most
of these operations can be selected and controlled by the front panel
MEASUREMENT block menus. The data is also stored in data arrays
(shown as double-line boxes). These arrays are places in the ow path
where the data is accessible via GPIB or by using the oppy disk drive
or the memory disk. Figure 9-2 also shows other data arrays (shown
as double-dotted-line boxes). These arrays are not accessible via GPIB,
but showing them may help you better understand the behavior of
the instrument.
While only a single ow path is shown, two identical paths are
available that correspond to channel 1 and channel 2. When
the channels are uncoupled, each channel can be independently
controlled so that the data processing operations for one can be
di erent from the other.
Data Processing
Data Processing Flow
Figure 9-2. Data Processing
AD converter (adc)
The adc converts an analog signal (which is already down-converted
to a xed low frequency IF) into digital data.
Digital Filter
The digital lter detects the IF signal by performing a discrete Fourier
transform (DFT) on the digital data. The samples are converted into
complex number pairs (real plus imaginary, R+jX) that represent both
the magnitude and phase of the IF signal.
Analyzer Features 9-3
Data Processing
Ratio Processing
The ratio processing calculates the ratio of the current and voltage
values (V/I) in order to convert them to an impedance value.
Fixed Point Calibration Coecient Arrays and User De ned
Point Calibration Coecient Arrays
When a calibration measurement is performed, the coecient values
at each calibration measurement point are stored in these arrays.
These arrays are not accessible via GPIB.
Calibration Coecient Interpolation
When calibration measurements have been performed or stimulus
settings have been changed, the calibration coecients at the current
measurement points are calculated from either the xed point
calibration coecient arrays or the user de ned point calibration
coecient arrays. When the current measurement point is di erent
from the calibration measurement point, the coecient value is
interpolated from the xed point calibration coecient arrays or the
user de ned point calibration coecient arrays.
Calibration Coecient Arrays
Because the analyzer measures the three standards at three di erent
OSC levels automatically when the calibration measurement is
performed, calibration data arrays consist of nine arrays. These arrays
are directly accessible via GPIB, or by using the oppy disk drive or
the memory disk.
Error Collection
When a measurement calibration has been performed, error correction
removes the repeatable systematic errors (stored in the calibration
coecient arrays) from the raw data arrays. See \4Cal5" in Chapter 5
and \Calibration Concepts" in Chapter 11 for details.
Averaging
This is one of the noise reduction techniques. Two types of averaging
techniques are provided, sweep averaging and point averaging (the
point averaging processes before the ratio processing). The sweep
averaging calculation involves taking the complex exponential average
of up to 999 consecutive sweeps. The point averaging calculation
involves taking the complex average of up to 999 measurements on
each measurement point. See \4Bw/Avg5" in Chapter 5.
Raw Data Arrays
These arrays store the results of all the preceding data processing
operations. These arrays are directly accessible via GPIB, or using the
oppy disk drive or the memory disk. Note that the numbers here are
still complex pairs.
9-4 Analyzer Features
Port Extension
Data Processing
This is equivalent to \line-stretching" or arti cially moving the
measurement reference plane.
Fixture Compensation Coecient Arrays
When a xture compensation measurement has been performed and
xture compensation is turned on, the xture compensation removes
the repeatable systematic error. This error is caused by stray and
residual impedance along the xture used. This error information
is stored in the xture compensation arrays by the port extension
process. See \4Cal5" in Chapter 5 and \Calibration Concepts" in
Chapter 11 for details. When the permittivity measurement test
xture is selected, these arrays are not used. These arrays are directly
accessible via GPIB, or by using the oppy disk drive or the memory
disk.
Fixed Point Fixture Compensation Coecient Arrays and
User De ned Point Fixture Compensation Coecient Arrays
When a compensation measurement is performed, the coecient
values at each compensation measurement point are stored in these
arrays. These arrays are not accessible via GPIB.
Compensation Coecient Interpolation
When compensation measurements have been performed, stimulus
settings have been changed, or compensation is turned on, the
compensation coecient at the current measurement points is
calculated from either the xed point xture compensation coecient
arrays or the user de ned point xture compensation coecient
arrays. When the current measurement point is di erent from the
compensation measurement point, the coecient value is interpolated
from the xed point xture compensation coecient arrays or user
de ned point xture compensation coecient arrays.
Fixture Compensation
When a xture compensation measurement has been performed and
this function is turn on, xture compensation removes the errors
caused by the test xture. See \Fixture Compensation" in Chapter 11
for details.
Data Arrays
The results of error correction are stored in the data arrays as
complex number pairs. These arrays are accessible via GPIB or by
using the oppy disk drive or the memory disk.
Memory Arrays
If the data-to-memory operation is performed, the data arrays are
copied into the memory arrays (data trace arrays are also copied into
the memory trace array at same time). See \4Display5" in Chapter 5 in
this chapter. These arrays are accessible using the oppy disk drive
or the memory disk. These arrays are also output via GPIB, but data
cannot be input into this array via GPIB.
Analyzer Features 9-5
Data Processing
If memory is displayed, the data from the memory arrays goes
through the same data processing ow path as the data from the data
arrays.
Format
This converts the complex number pairs into a scalar representation
for display, according to the selected format. These formats are often
easier to interpret than the complex number representation. (Polar,
Smith, admittance chart, and complex plane formats are not a ected
by the scalar formatting.)
Data Math
This calculates the complex ratio of the two (data/memory),
the di erence (data0memory), summation (data+memory), or
multiplication (data2memory) when the data math function is
selected. In addition, this function multiplies the ratio, or di erence
by a constant.
Data Trace Arrays
The results are stored in the data trace arrays. It is important to note
those marker values and marker functions are all derived from the
data trace arrays. Limit testing is also performed on this array. The
data trace arrays are accessible via GPIB, or using the oppy disk
drive or the memory disk.
Memory Trace Arrays
If the data-to-memory operation is performed, the data trace arrays
are copied into the memory trace arrays (data arrays are also copied
into the memory array at same time). These arrays are accessible
using the oppy disk drive or the memory disk. These arrays are also
output via GPIB, but data cannot be input into these arrays via GPIB.
Scaling
These operations prepare the formatted data for display on the LCD.
This is where the appropriate reference line position, reference
line value, and scale calculations are performed. See \4Scale Ref5" in
Chapter 5 in this chapter.
9-6 Analyzer Features
10
Options and Accessories
Introduction
This chapter lists available options and accessories for the 4291B.
Options Available
Option 001 Add dc bias
This option adds the dc bias capability to the stimulus of 4291B. This
option can be retro tted using 4291V Option 001
Option 002 Add material measurement rmware
This option adds the material measurement capability to the 4291B.
This option can be retro tted using 4291V Option 002.
Option 011 Delete high impedance test head
This option deletes the high impedance test head.
Option 012 Add low impedance test head
This option adds the low impedance test head. This option can be
retro tted using 4291V Option 012.
Option 013 Add high temperature high impedance test head
This option adds the high high temperature high impedance test head.
This option includes a xture stand. This option can be retro tted
using 4291V Option 013.
Option 014 Add high temperature low impedance test head
This option adds the high temperature low impedance test head. This
option includes a xture stand. This option can be retro tted using
4291V Option 014.
Options and Accessories 10-1
Options Available
Option 0BW Add Service Manual
This option adds the 4291B Service Manual, which describes the
performance test procedures and troubleshooting.
Option 1D5 Add high stability frequency reference
This option, a 10 MHz crystal in a temperature stabilized oven,
improves the source signal frequency accuracy and stability. This
option can be retro tted using the 4291V Option 1D5.
Option 1A2 Keyboard less
This option is not furnished with the mini-DIN keyboard.
Option 1CM Rack mount kit
This option is a rack mount kit containing a pair of anges and the
necessary hardware to mount the instrument, with handles detached,
in an equipment rack with 482.6 mm (19 inches) horizontal spacing.
Option 1CN Handle Kit
This option is a rack mount kit containing a pair of handles and the
necessary hardware to mount the instrument.
Option 1CP Rack mount and handle kit
This option is a rack mount kit containing a pair of anges, and the
necessary hardware to mount the instrument with handles attached in
an equipment rack with 482.6 mm (19 inches) horizontal spacing.
10-2 Options and Accessories
Accessories Available
Measurement accessories available
16191A Side electrode SMD test xture
The 16191A is used to measure a side electrodes surface mount device
(SMD) with high repeatability. The usable operating frequency is up 2
GHz.
16192A Parallel electrode SMD test xture
The 16192A is used to measure a parallel electrodes surface mount
device (SMD) with high repeatability. The usable operating frequency
is up 2 GHz.
16193A Small side electrode SMD test xture
The 16193A is used to measure a small, side electrodes surface mount
device (SMD) with high repeatability. The usable operating frequency
is up 2 GHz.
16194A High temperature component xture
The 16194A is used to measure a component in wide temperature
range. The operating temperature range is from 055 C through
200 C. The usable operating frequency is up to 2 GHz.
16453A Dielectric material test xture
The 16453A is used to measure the permittivity of a dielectric
material. This xture has been designed to operate speci cally
with the 4291B equipped with the Option 002 (which provides the
permittivity measurement function for dielectric material). The usable
operating frequency is up to 1 GHz.
16454A magnetic material test xture
The 16454A is used to measure the permeability of a toroidal core.
This xture has been designed to operate speci cally with the
4291B equipped with the Option 002 (which provides the permeably
measurement function for magnetic material). Two types of xtures
are included in the 16454A to provide exibility for various material
sizes.
16091A Coaxial termination xture set
The 16091A is suited to the measurement of lead-less material samples
or small size, axial lead components whose leads can be shortened.
Two types of xtures are included in the xture set to provide
exibility for various sample sizes. The usable operating frequency is
up to 1 GHz.
Options and Accessories 10-3
Accessories Available
16092A Spring clip test xture
The 16092A provides a convenient capability for easily connecting
and disconnecting samples. It has a usable operating frequency up to
500 MHz.
16093A/B Binding post test xtures
The 16093A/B are suited for the measurement of relatively large
size, axial and radial lead components or devices that do not t
other xtures. The 16093A is provided with two small binding post
measurement terminals set at 7 mm intervals. The usable frequency
operating of the 16093A is up to 250 MHz. The 16093B employs a
common type three binding post terminal arrangement that includes
an extra guard post terminal. The terminal interval is 15 mm. The
usable frequency operating of the 16093B is below 125 MHz.
16094A Probe test xture
The 16094A provides probing capability for measuring circuit
impedance and components mounted on circuit assemblies. The usable
frequency operating of the 16094A is below 125 MHz.
System accessories available
System rack
Printer
10-4 Options and Accessories
The 85043B system rack is a 124 cm (49 inch) high metal cabinet
designed to rack mount the analyzer in a system con guration. The
rack is equipped with a large built-in work surface, a drawer for
calibration kits and other hardware, a bookshelf for system manuals,
and a locking rear door for secured access. Lightweight steel rails
support the instrument along their entire depth. Heavy-duty casters
make the cabinet easily movable even with the instruments in
place. Screw-down lock feet permit leveling and semi-permanent
installation. The cabinet is extremely stable when the lock feet
are down. Power is supplied to the cabinet through a heavy-duty
grounded primary power cable and to the individual instruments
through special power cables included with the cabinet.
The 4291B is capable of printing displayed measurement results
directly to a peripheral without the use of an external computer. The
compatible printers for printing is:
Accessories Available
Table 10-1. Supported Printers and Printing Modes
Printer
HP DeskJet 340J
HP DeskJet 505
HP DeskJet 560C
HP DeskJet 694C
HP DeskJet 850C
HP DeskJet 1200
HP DeskJet 1600CM
GPIB cable
Monochrome Printing Fixed Color Printing Variable Color Printing
p
p
p
p
p
p
p
p
p
p
p
p
p
p
p
An GPIB cable is required to interface the analyzer with computer, or
other external instrument. The following cables are available:
10833A (1 m)
10833B (2 m)
10833C (3 m)
10833D (0.5 m)
Service Accessories Available
Collet removing tool (Agilent part number 5060-0236)
This tool is used to remove the center conductor collet from an APC-7
connector. This is required in order to repair the collet, if the collect
is damaged.
Collet removing tool guide (Agilent part number 04291-21002)
This tool is used with the collet removing tool when the collet of the
low loss capacitor of the calibration kit is removed.
6-Slot collet (Agilent part number 85050-20001)
The repair part of the collet.
Options and Accessories 10-5
Impedance Measurement Basics
11
This chapter introduces the following basic concepts of impedance
measurements:
Impedance Parameters
Series and Parallel Circuit Models
Smith Chart
Calibration Concepts
Port Extension
Fixture Compensation
Permittivity Measurements
Permeability Measurements
Impedance Measurement Basics 11-1
11-2 Impedance Measurement Basics
Impedance Parameter
Impedance parameters
All circuit components, resistors, capacitors, or inductors, have
parasitic components lurking in the shadows waiting for the unwary,
for example unwanted resistance in capacitors, unwanted capacitance
in inductors, and unwanted inductance in resistors. Thus, simple
components should be modeled as complex impedances, for in fact
that is what they are.
_
Impedance (Z)
Figure 11-1 (a) shows the complex impedance de nitions and
Figure 11-1 (b) shows the vector representation of complex
impedance. Impedance, Z_ is the total opposition that a circuit or
device o ers to the ow of alternating current at a given frequency.
Z_ contains a real and an imaginary part, and it is expressed in
rectangular form as Resistance and Reactance, or in polar form as
magnitude of Impedance and Phase as follows.
(11 0 1)
Z_ = R + jX = jZj 6 jZj =
p
(11 0 2)
R2 + X2
jXj
= arctan
R
R = Rs
(11 0 3)
(11 0 4)
Where,
Complex Impedance [ ]
Z_ :
R : Resistance [ ]
X : Reactance [ ]
jZj : Magnitude of Impedance [ ]
:
Phase of Impedance [deg or rad]
Rs : Series Resistance [ ]
Figure 11-1. De nition of Impedance
The following parameters can be used to represent the reactance.
X = 2fL
(11 0 5)
Impedance Measurement Basics 11-3
Impedance Parameter
Where,
f:
Frequency [Hz]
L:
Inductance [H]
In addition to these parameters, the Quality Factor (Q) and Dissipation
Factor (D) are used to describe the quality of components.
1
jX j
(11 0 6)
Q= =
D
R
Where,
Q : Quality Factor
D : Dissipation Factor
_
Admittance (Y)
11-4 Impedance Measurement Basics
In some case, the dual of impedance (Admittance), Y_ is used.
Figure 11-2 shows the vector representation of admittance. As Z_
(Complex Impedance), Y_ is composed of a real and an imaginary
part, and is expressed in rectangular form as Conductance and
Susceptance, or in polar form as magnitude of Admittance and Phase.
The following are expressions for Admittance.
1
Y_ = _
(11 0 7)
Z
(11 0 8)
Y_ = G + jB = jYj 6 p 2 2 1
(11 0 9)
jYj = G + B = jZj
jBj = 0
= arctan
(11 0 10)
G
B = 2fC
(11 0 11)
1 jBj
Q= =
(11 0 12)
D
G
1
G=
(11 0 13)
Rp
Where,
Y_ : Complex Admittance [S]
G : Conductance [S] (real)
B : Susceptance [S] (imaginary)
jYj : Magnitude of Admittance [S]
:
Phase of Admittance [deg or rad]
C:
Capacitance [F]
Rp : Parallel Resistance [ ]
Impedance Parameter
Figure 11-2. Vector Representation of Admittance
_
Re ection Coecient (0)
When measuring RF impedance , the re ection and/or transmission
coecient parameter values are usually measured by a network
analyzer or RF impedance analyzer. The 4291B provides the re ection
coecient 0_ as measurement parameter.
The re ection coecient 0_ is de ned as:
V_
(11 0 14)
0_ = _ref = 0x + j 0y = j0_ j(cos + j sin ) = j0_ j6 Vinc
where,
V_ ref is voltage of the re ected wave
V_ inc is voltage of the incident wave
The re ection coecient value and the impedance value of the
sample is interrelated, each with the other, by the following formulas:
Z_ 0 Z0
0_ = _ x
(11 0 15)
Zx + Z0
1 + 0_
Z_ x = Z0
(11 0 16)
1 0 0_
where, Z0 is characteristic impedance.
Impedance Measurement Basics 11-5
Series and Parallel Circuit Models
Series and Parallel Circuit Models
An impedance element can be represented by a simple equivalent
circuit consisting of resistive and reactive elements (connected in
series with or in parallel with each other). This representation
is possible by either of the equivalent (series or parallel) circuits
because both have identical impedances at the selected measurement
frequency. These values are obtained by properly selecting the value
of the equivalent circuit elements.
The 4291B can select the model by setting the measurement
parameter (R, X, G, B, Cp , Cs , Lp , or Ls ) using the 4Meas5 key.
To determine which circuit model is best, consider the relative
impedance magnitude of the reactance and Rs and Rp .
Table 11-1.
Parallel/Series Circuit Model and Measurement
Parameter
Parallel Circuit Model
Series Circuit Model
Parallel-Series Equivalent Circuit Conversion
Parameter values for a component measured in a parallel equivalent
circuit and that measured in a series equivalent circuit are di erent
from each other. The di erence in measured values is related to
the loss factor of the sample to be measured. If no series resistance
or parallel conductance is present, the two equivalent circuits are
identical.
However, the sample value measured in a parallel measurement
circuit can be correlated with that of a series circuit by a simple
conversion formula that considers the e ect of the dissipation factor
(D). See Table 11-2. The dissipation factor of a component always
has the same value at a given frequency for both parallel and series
equivalent circuits.
11-6 Impedance Measurement Basics
Series and Parallel Circuit Models
Table 11-2.
Dissipation Factor Equations and Parallel-Series
Equivalent Circuit Conversion
Device
Circuit Mode
C
Dissipation Factor
D=
1
1
=
2f Cp Rp
Q
Conversion to other
modes
Cs = (1 + D2 )Cp
Rs =
C
D = 2f Cs Rs =
1
Q
Cp =
Rp =
L
D=
2f Lp
Rp
=
1
Q
Ls =
Rs =
L
D=
Rs
2f Ls
=
1
Q
D2
1 + D2
Rp
1
Cs
1 + D2
1 + D2
D2
Rs
1
Lp
1 + D2
D2
1 + D2
Rp
Lp = (1 + D2 )Ls
Rp =
1 + D2
D2
Rs
Selecting Circuit Mode of Capacitance
The following description gives some practical guide lines for selecting
the capacitance measurement circuit mode.
Small Capacitance
Small capacitance yields a large reactance, that implies that the
e ect of the parallel resistance (Rp ) has relatively more signi cance
than that of the series resistance (Rs ). The low value of resistance
represented by Rs has negligible signi cance compared with the
capacitive reactance, so the parallel circuit mode (Cp ) should be used
(see Figure 11-3).
Figure 11-3. Small Capacitance Circuit Mode Selection
Impedance Measurement Basics 11-7
Series and Parallel Circuit Models
Large Capacitance
When the opposite is true and the measurement involves a large value
of capacitance (low impedance), Rs has relatively more signi cance
than Rp , so the series circuit mode (Cs -D or Cs -Q) should be used (see
Figure 11-4).
Figure 11-4. Large Capacitance Circuit Mode Selection
The following is a rule of thumb for selecting the circuit model
according to the impedance of the capacitor:
Above approx. 10 k :
Use parallel circuit model.
Below approx. 10 :
Use series circuit model.
Between above values:
Follow the manufacturer's
recommendation.
Selecting Circuit Mode of Inductance
The following description gives some practical guide lines for selecting
the inductance measurement mode (that is, which circuit mode to
use).
Large Inductance
The reactance at a given frequency is relatively large (compared with
that of a small inductance), so the parallel resistance becomes more
signi cant than the series component. Therefore, a measurement
in the parallel equivalent circuit mode (Lp -D, Lp -Q or Lp -G) is more
suitable (see Figure 11-5).
11-8 Impedance Measurement Basics
Series and Parallel Circuit Models
Figure 11-5. Large Inductance Circuit Mode Selection
Small Inductance
For low values of inductance, the reactance becomes relatively small
(compared with that of a large inductance) so the series resistance
component is more signi cant. Therefore, the series equivalent circuit
mode (Ls -D or Ls -Q) is appropriate (see Figure 11-6).
Figure 11-6. Small Inductance Circuit Mode Selection
The following is a rule of thumb for selecting the circuit model
according to the impedance of the inductor:
Below approx. 10 :
Use series circuit model.
Above approx. 10 k :
Use parallel circuit model.
Between above values:
Follow the manufacturer's
recommendation.
Impedance Measurement Basics 11-9
Smith Chart
Smith Chart
This section provides a brief description of the Smith Chart for users
who are not familiar with its use.
Figure 11-7 shows the Smith Chart plane of impedance coordinates.
On the Smith Chart plane, the coordinate scales signify the impedance
component quantities.
The circles tangent at point a are the scales for which the resistance
values (R) are constant. The arcs that cross at point a and intersect
the circles at right angles are the scales for which reactance values (X)
are constant.
Figure 11-7. Smith Chart
These resistance and reactance scale values are the normalized values.
They are calculated by dividing the sample impedance (Zx =Rx +jXx )
by the characteristic impedance (Zo=50 ) of the measuring circuit.
Therefore, the normalized impedance Rr + jXr is :
Rr + jXr =
Zx Rx jXx
=
+
50
Z0 50
(11 0 17)
A sample impedance value is represented on the Smith Chart as a
point coordinated with the scales corresponding to its normalized
impedance (see Figure 11-8). The base impedance Z0 (characteristic
impedance) is located at the center of the Smith Chart plane. The
radius vector Z0 1Zr represents the re ection coecient value j0j6 of the sample (in this case, the electrical length of the transmission
line is not being taken into consideration). The phase angle scales
for the re ection coecient vector are provided along the outer
circumference of the Smith Chart. The phase angle of the re ection
coecient can be read from the phase angle scale as indicated by an
extension of the vector Z01Zr . The absolute value of the re ection
coecient j0j is constant at any point on the circle of the radius Z01Zr .
11-10 Impedance Measurement Basics
Smith Chart
Figure 11-8. Impedance Read-out
When a coaxial cable of line length l is terminated by the sample and
the cable is lossless, the impedance value of the sample measured at
the other end of the line is derived as follows:
First, the di erence in phase angle of the re ection coecient value
0 (produced by the lead length l) is calculated using the following
equation:
4l
(11 0 18)
=
Where, is the wavelength of test signal.
Next, the radius vector Z0 1Zx is rotated clockwise (towards the
generator) by the calculated phase angle . The measured impedance
value (normalized impedance) coincides with the scale reading at
point Zm (see Figure 11-9).
Figure 11-9. Phase Sift by Transmission Line
Impedance Measurement Basics 11-11
Calibration Concepts
Calibration Concepts
This section describes the basic concepts of OPEN SHORT LOAD
calibration and Low-Loss air-capacitor calibration. The Low-Loss
air-capacitor calibration improves the accuracy of the phase
measurements.
OPEN SHORT LOAD Calibration
Ideal Measurement Circuit
Figure 11-10 (a) shows the basic measurement circuits for the
I-V method. This method uses two vector voltmeters Vv and Vi
(Vv detects the vector voltage applied to the DUT and Vi detects
the vector current owing through the DUT). Assuming that
the measurement circuit is ideal (which means there is no stray
admittance and no residual impedance), and the impedance values of
all the components in the measurement circuit are exactly correct, the
DUT's impedance value Z_ x is calculated using the following equations:
V_
Z_ x = R _v
(11 0 19)
Vi
Figure 11-10. Measurement Circuits for I-V Method
Figure 11-10 (b) and (c) show the simpli ed measurement circuits of
the high impedance test head and the low impedance test head of
the analyzer. The DUT's impedance value (Z_ x ) is calculated using the
following equations (if the measurement circuit is ideal):
For the high impedance test head (Figure 11-10-(b) ), Z_ x is :
R V_
Z_ x = 0 ( _v 0 1)
(11 0 20)
2 Vi
For the low impedance test head (Figure 11-10-(c) ), Z_ x is :
2R
Z_ x = _ 0
(11 0 21)
Vi 0 1
V_ v
11-12 Impedance Measurement Basics
Calibration Concepts
General Impedance Measurement Schematic
However, actual measurement circuits have some error terms (such
as stray admittance and residual impedance) plus, the components of
the circuit also have some errors. In addition, the four resistances (R0)
in the measurement circuit do not have exactly the same impedance
value. In fact, the impedance values calculated from the above
equations do not correspond with the actual impedance value of the
DUT. Generally, an impedance measurement circuit using two vector
voltmeters is represented as shown in Figure 11-11.
Figure 11-11. General Schematic for Impedance Measurement Using Two Vector Voltmeters
This general impedance measurement circuit uses two vector
voltmeters. These two voltmeters can measure at any two di erent
points in a linear circuit. In this case, the DUT's impedance can be
expressed by the measured voltage values (V_ v and V_ i ) using a bilinear
form as follows:
1 + b_ r_
(11 0 22)
Z_ x = a_
1 + c_ r_
Where,
_ c_ are complex constants
a,
_ b,
r_ is a ratio between V_ v and V_ i as follows:
V_
(11 0 23)
r_ = _v
Vi
In general, Z_ x can be expressed using the above bilinear form
whenever the measurement circuit is linear.
By using the measurement impedance value (Z_ m ) instead of the
voltage ratio r_ and modifying the equation, Z_ x can also be expressed
using the following bilinear form:
Z_ 0 B_
(11 0 24)
Z_ x = A_ m _ _
1 0 C Zm
_ B,
_ and C_ are complex constants (calibration coecients)
Where, A,
related to the circuit.
If three standards that have known impedance value are measured,
these three constants can be calculated. The analyzer uses the
Impedance Measurement Basics 11-13
Calibration Concepts
OPEN, SHORT, and LOAD standards (furnished) for the calibration.
Once these constants are known, any impedance of the DUT can be
calculated from the measured impedance value.
Where, B_ represents residual impedance when the circuit is perfectly shorted and C_
represents stray admittance when the circuit is perfectly open.
Low Loss Capacitor Calibration
Accurate Q measurements require good analyzer stability and correct
markings on the phase scale of the analyzer. In particular, high Q (or
low D : dissipation factor) measurements at high frequencies require
high accuracy for phase measurements.
The phase accuracy of the analyzer is determined entirely by the
OPEN SHORT LOAD calibration. But, it is not guaranteed that the
phase uncertainty for a 50 LOAD at high frequencies is lower than
the uncertainty requirement for a high Q measurement.
For example, if you want to measure the Q factor with 10% of
uncertainty for a DUT whose Q value is almost 100, the uncertainty
for phase scaling must be less than 1003 . But, it is dicult to ensure
that the phase uncertainty for the 50 LOAD is less than 1003 at high
frequencies.
To reduce the uncertainty of the measured phase, the analyzer uses a
low-loss air-capacitor as a phase standard, whose dissipation factor (D)
is kept below 1003 at around 1 GHz.
The following steps show how the analyzer improves phase
measurement accuracy using a low-loss air-capacitor:
1. Measure the OPEN, SHORT, and LOAD standards and the Low-Loss
air-capacitor.
2. Assuming the impedance of the 50 LOAD is Z_ ls = 50 ej0 (that is,
the phase of 50 LOAD is zero) as shown in Figure 11-12-(a) ),
_ B,
_ and C_ .
calculate the calibration coecient A,
3. Execute the correction for the Low-Loss air-capacitor and get the
corrected impedance value of the Low-Loss air-capacitor. (Z_ cc )
4. Calculate the phase di erence (1) between the phase of Z_ cc and
the true phase of the Low-Loss air-capacitor (see Figure 11-12-(b)).
(11-25)
1 = cc 0 cs
Where,
cc = arg (Z_ cc)
cs is standard phase value of the Low-Loss air-capacitor.
5. Modify the impedance of the 50 LOAD to Z_ lc whose phase is 01
and whose impedance magnitude is still 50 (see Figure 11-12-(c)).
The modi ed impedance value of 50 LOAD Z_ lc is expressed in the
following equation:
Z_ lc = 50 e0j1
11-14 Impedance Measurement Basics
(11-26)
Calibration Concepts
_ B,
_ and C_ again by normal
6. Calculate the calibration coecients A,
OPEN SHORT LOAD calibration using the modi ed 50 LOAD
impedance value Z_ lc .
The analyzer performs this procedure automatically when a Low-Loss
air-capacitor is measured in the calibration menu. Although this is
an approximate method, just performing these procedures make the
analyzer accurate enough to perform high Q measurements.
Figure 11-12. Modifying the Standard Value of a 50 LOAD using a Low-Loss Air-Capacitor
Low-Loss Air-Capacitor calibration does not a ect the measurement below
300 MHz
In fact, taking frequency into consideration, the analyzer uses the following
equations for Z_ lc :
Z_ lc = 50 e0jk1
Where,
k is a constant that depends on the measurement frequency. Because the phase
of 50 LOAD at a low frequency is regarded as zero, the analyzer uses the
following value as k:
k = 0 (at frequency 300 MHz)
k=
f[M H z ] 0 300
500 0 300
(at 300 MHz < frequency 500 MHz)
k = 1 (at frequency > 500 MHz)
Impedance Measurement Basics 11-15
Port Extension
Port Extension
When the extension cable is used to extend the measurement plane
from APC-7 R of the head to the tip of the cable, the measurement
error increases because of the additional impedance in a distributed
element circuit of the cable.
To minimize the measurement errors, the port extension function
simulates a variable length lossless cable that can be added to or
removed from the test port to compensate for interconnecting cables,
test xtures, etc. The value of port extension is annotated in units of
time with secondary labeling in distance for the velocity of light.
An estimated impedance value through this function is calculated
according to the following concept:
Figure 11-13. Port Extension
When impedance ZL is connected to one tip of extension cable as
shown in Figure 11-13, the input impedance from the other tip of
cable is expressed using the following equation:
Z + Z0 tanh( _ l)
(11 0 27)
Zin = Z0 L
Z0 + ZL tanh( _ l)
Where,
Z0 is the characteristic impedance of the cable.
l is the electrical length of the cable representing the physical
length of the cable (l0 ) and the relative permittivity of the material
in the cable ("r ) :
p
l = "r l0
_ is propagation coecient and expressed as:
_ = +j
where,
is attenuation constant
is phase constant
Assuming that the cable is lossless,
conditions:
=0
!
=
c0
where,
11-16 Impedance Measurement Basics
(11 0 28)
(11 0 29)
and
satisfy the following
(11 0 30)
(11 0 31)
Port Extension
c0 is the velocity of light
Therefore,
!
tanh( _ l) = tanh(j l)
c0
!
= j tan( l)
c
(11 0 32)
0
Because the characteristic impedance of the extension cable for the
analyzer should be 50 , Z0 is constant as follows:
(11 0 33)
Substitute these conditions into the equation for Zin. Then modify it
in order to calculate ZL from Zin . ZL can be determined by using the
following equation:
Z 0 j 50 tan(!1t)
(11 0 34)
ZL = 50 in
50 0 jZin tan(!1t)
Z0 = 50 + j 0
Where,
1t is port extension in time [sec]
1t =
l
c0
When the linear portion of the DUT's phase is removed using the port
extension function, the electrical length of the DUT can be read in the
active entry area of the display.
Setting Proper Electrical Length Compensation
You can easily check to determine whether the electrical length can t the extended
measurement circuit. Proceed as follows:
1. Perform calibration without using an extension cable.
2. Connect the extension cable (or the unknown xture) to the test port.
3. Set the measurement parameter to j0j.
4. Set the measurement format to Smith chart format.
5. Set the Smith/polar marker to Logmag-Phase.
6. Connect a 0 S termination at the tip of the extension cable (or an open at the tip
of the extension cable).
7. Turn the port extension on.
8. Change the port extension value until the values measured are 0 at any
frequency point.
Impedance Measurement Basics 11-17
Port Extension
Another Method of Canceling the Measurement Error Caused by Extension
Cable
The OPEN1SHORT1LOAD xture compensation cancels the error caused by port
extension. To cancel the error:
1. Perform calibration at the tip of APC-7 R on the test head without using an
extension cable.
2. Connect the extension cable and the test xture to be used.
3. Perform OPEN, SHORT, and LOAD xture compensations.
It is necessary to perform calibration measurement at the APC-7 R connector of the
test head. If calibration is performed at the tip of the extension cable, the
calibration error would increase.
OPEN, SHORT or OPEN and SHORT compensations can not cancel the error caused
by the extension cable. It is the best way to perform the OPEN SHORT LOAD
xture compensation if the LOAD performance is perfectly known.
11-18 Impedance Measurement Basics
Fixture Compensation
Fixture Compensation
Actual Measuring Circuit
The measuring circuit connecting a test sample to the test port
(that is, the test xture) actually becomes part of the sample that
the instrument measures. In addition, component electrodes or
leads, which should essentially be of negligibly low impedance, also
in uence the measured sample values because of the presence of
certain parasitic impedances. Diverse parasitic impedances existing
in the measuring circuit between the test port and the unknown
device a ect the measurement result. These parasitic impedances
are present as resistive or reactive factors in parallel or in series
with the sample device. Furthermore, in the high frequency region,
the equivalent electrical length of the measuring circuit, including
component leads, rotates the measured impedance vector as function
of the test signal wavelength. Let's discuss the e ects that increase
measurement uncertainties.
Residual Parameter E ects
Figure 11-14 shows an equivalent circuit model of the measuring
circuit that includes unknown component and parasitic parameters
(usually called residual parameters). These residual parameters
cause two kinds of measurement errors, which are described in the
following paragraphs.
Figure 11-14. Residual Parameters in the Circuit
Where,
Rl
Rc
Rf
Ll
Lf
Cl
Lead (or electrodes) resistance of DUT
Contact resistance
Residual resistance of test xture
Lead (or electrodes) inductance of DUT
Residual inductance of test xture
Stray capacitance of DUT
Impedance Measurement Basics 11-19
Fixture Compensation
Cf
G
M
Stray capacitance of test xture
Residual conductance of DUT
Mutual inductance between leads (or electrodes) of
DUT
Characteristics of Test Fixture
Figure 11-15. Characteristics of Test Fixture
Electrical Length of Coaxial Coupling Terminal Section
The test xtures are basically composed of two major components,
a coaxial coupling terminal and the contact electrodes (terminals),
combined in one unit. The electrical length value speci ed for each
type of xture is calculated for the coaxial coupling terminal and does
not include the electronic factors in the electrodes.
As the coaxial coupling terminal section of the xtures is a distributed
constant circuit design (50 ), this xture section is virtually an
extension of the test port. The inherent e ect in the coaxial coupling
terminal is represented by the electrical length value particular to
the test xture. On the other hand, the contact section (that is, the
electrodes on the xtures) has di erent characteristics from the 50
distributed constant test port.
Elimination of Electrical Length E ects in Test Fixture
The 4291B has a typical electrical length for the speci ed test xtures.
When a test xture is selected, the 4291B automatically sets the
typical electrical length value for the xture selected. The technique
to eliminate the electrical length uses the same technique as the port
extension function. See \Port Extension", for more information on
port extension.
Residual and Stray Parameters of Contact Electrode Section
The contact electrode (terminal) section can not be regarded as part of
the distributed constant circuit.
Because a correction calculation performed on the basis of the test
xture selection (provided by the 4291B) does not compensate for the
residual and stray parameters in the contact section, these residuals
and strays contribute to measurement errors. The residual and stray
factors in the test xtures is illustrated in Figure 11-14.
11-20 Impedance Measurement Basics
Fixture Compensation
Elimination of Residual Parameter E ects in Test Fixture
(Fixture Compensation)
In general, these residual and stray factors can be represented by F
parameters of 2 terminal-pair as shown in Figure 11-16. Using this
model, the residual and stray factors can be eliminated.
Figure 11-16.
Test Fixture Represented by the F matrix of a Two Terminal Pair
Network
V1 = A
B V2 (11 0 35)
I1
C
I2
D
The actual impedance value of the DUT (Zx ) and the measurement
value (Zm ) are represented by the input and output current and
voltage as follows:
V1
I1
V
Zx = 2
I2
Zm =
Then, Zx is:
Zx = Acompen
Where,
Zm 0 Bcompen
1 0 Zm Ccompen
(11 0 36)
(11 0 37)
(11 0 38)
Acompen = D/A
Bcompen = B/D
Ccompen = C/A
There are three unknown parameters. Therefore, three standards are
needed for perfect compensation. When Acompen , Bcompen , and Ccompen
are given, Zx is calculated. To get Acompen, Bcompen , and Ccompen ,
the 4291B executes measurements for OPEN, SHORT, and LOAD
compensation.
Impedance Measurement Basics 11-21
Fixture Compensation
Compensation Coecient for Each Compensation
For xture compensation, three compensations (OPEN, SHORT, and
LOAD) are provided for the analyzer. These compensations can
be turned on individually. After the compensation measurements
have been done and tuned on, the compensation coecients,
Acompen , Bcompen , and Ccompen , are automatically calculated and the
measurement value Zm is transformed to Zx through the equation
(11-45). Some assumptions are made for compensations except for
OPEN1SHORT1LOAD xture compensation. The following paragraphs
show the conditions assumed for each combination and the equations
used for each combination of the OPEN, SHORT and LOAD xture
compensations.
OPEN Compensation
When only the OPEN compensation is used for the xture
compensation, two additional conditions are required to solve the Zx
equation. One condition assumes that the equivalent circuit model of
the xture used is a symmetric circuit. The other condition assumes
that SHORT measurement capability is ideal, that is, the measurement
value for perfect SHORT standard equals to perfect SHORT value.
These conditions are explained as follows:
Assuming that :
A=D (symmetric circuit)
(11-39)
B=0
(11-40)
Then, the compensation coecients are:
Acompen = 1 + j0
(11-41)
Bcompen = 0 + j0
(11-42)
Ccompen = Yom 0 Yos
(11-43)
Where,
Yom is the admittance value measured under open condition
Yos is the admittance value de ned as OPEN as the xture
compensation kit
SHORT Compensation
When only the SHORT compensation is used for the xture
compensation, two additional conditions are required to solve the Zx
equation. One condition assumes that the equivalent circuit model of
the xture used is a symmetric circuit. The other condition assumes
that OPEN measurement capability is ideal, that is, the measurement
value for perfect OPEN standard equals to perfect OPEN value. These
conditions are explained as follows:
Assuming that :
A=D (symmetric circuit)
(11-44)
C=0
(11-45)
Then, the compensation coecients are:
11-22 Impedance Measurement Basics
Fixture Compensation
Acompen = 1 + j0
(11-46)
Bcompen = Zsm 0 Zss
(11-47)
Ccompen = 0 + j0
(11-48)
Where,
Zsm is the impedance of the value measured for shorted device.
Zss is the impedance value de ned as SHORT for the xture
compensation kit
LOAD Compensation
When only the LOAD compensation is used for the xture
compensation, two additional conditions are required to solve the
Zx equation. One condition assumes that the value measuring
shorted device is the same as the value de ned as SHORT for the
xture compensation kit. The other condition assumes that SHORT
measurement capability is ideal and OPEN measurement capability is
ideal. These conditions are explained as follows:
Assuming that :
B=0
(11-49)
C=0
(11-50)
Then, the compensation coecients are:
Acompen = ZZl
lm
(11-51)
Bcompen = 0 + j0
(11-52)
Ccompen = 0 + j0
(11-53)
Where,
Zlm is the impedance value measured for load device
Zls is the impedance value de ned as LOAD of the xture
compensation kit
OPEN-SHORT Compensation
When OPEN and SHORT compensations are used for the xture
compensation, one additional condition is required to solve the Zx
equation. This condition is explained as follows:
Assuming that :
A=D (symmetric circuit)
(11-54)
Then, the compensation coecients are:
Acompen = 1 + j0
(11-55)
Z 0 (1 0 Yom Zsm )Zss 0 Zsm Yos Zss
Bcompen = sm
(11-56)
1 0 Yom Zsm Yos Zss
Ccompen =
Yom 0 (1 0 Yom Zsm )Yos 0 Yom Yos Zss
1 0 Yom Zsm Yos Zss
(11-57)
Impedance Measurement Basics 11-23
Fixture Compensation
OPEN-LOAD Compensation
When OPEN and LOAD compensations are used for the xture
compensation, one additional condition is required to solve the Zx
equation. The condition assumes that SHORT measurement capability
is ideal, that is, the measurement value for perfect SHORT standard
equals to perfect SHORT value. This condition is explained as follows:
Assuming that :
B=0
(11-58)
Then, the compensation coecients are:
Y 0 Yom
Acompen = lm
(11-59)
Yls 0 Yos
Bcompen = 0 + j0
Y Y 0 Ylm Yos
Ccompen = om ls
Yls 0 Yos
(11-60)
(11-61)
SHORT-LOAD Compensation
When SHORT and LOAD compensations are used for the xture
compensation, one additional condition is required to solve the Zx
equation. The condition assumes that SHORT measurement capability
is ideal, that is, the measurement value for perfect OPEN standard
equals to perfect OPEN value. This condition is explained as follows:
Assuming that :
C=0
(11-62)
Then, the compensation coecients are:
Z 0 Zls
Acompen = ss
(11-63)
Zsm 0 Zlm
Bcompen =
Zlm Zss 0 Zsm Zls
Zss 0 Zls
Ccompen = 0 + j0
(11-64)
(11-65)
OPEN-SHORT-LOAD Compensation
When OPEN, SHORT and LOAD compensations used for the xture
compensation, no more conditions are required to solve the Zx
equation. The compensation coecients are:
Acompen =
Yom (Zsm 0 Zlm )Yos Zss Zls 0 (1 0 Zlm Yom )Zls + (1 0 Yom Zsm )Zss
(Zsm 0 Zlm ) 0 (1 0 ZlmYom )Zsm Yos Zss + (1 0 Yom Zsm )ZlmZls Yos
(11-66)
Bcompen =
(Zsm 0 Zlm )Yos Zss Zls 0 Zsm (1 0 Zlm Yom )Zls + Zlm(1 0 Yom Zsm )Zss
Yom (Zsm 0 Zlm )YosZss Zls 0 (1 0 Zlm Yom)Zls + (1 0 Yom Zsm )Zss
(11-67)
11-24 Impedance Measurement Basics
Fixture Compensation
Ccompen =
Yom (Zsm 0 Zlm ) 0 (1 0 Zlm Yom )Yos Zss + (1 0 Yom Zsm )ZlsYos
(Zsm 0 Zlm ) 0 (1 0 ZlmYom )Zsm Yos Zss + (1 0 Yom Zsm )ZlmZls Yos
(11-68)
Impedance Measurement Basics 11-25
Permittivity Measurements
Permittivity Measurements
Figure 11-17. Schematic Electrode Structure of the 16453A
In general, when a dielectric material is put in a pair of parallel at
electrodes, capacitance C is calculated using the following equation:
C = "0 "r
Complex Permittivity
S
t
(11 0 69)
Strictly speaking, when ac voltage is applied to the dielectric material,
the material has some loss and permittivity "r is de ned as the
following complex value:
(11 0 70)
"_ r = "0 0 j"00
r
r
Now, the capacitor has a loss factor and the capacitance C in equation
(11-76) can be modi ed to the complex admittance Y_ as follows:
Y_
C 0!
(11 0 71)
j!
Y_
S
= "0 "_ r
j!
t
(11 0 72)
Figure 11-18. Material has some loss
Therefore, the relative permittivity of the MUT can be obtained using
the following equation:
1 Y_ m t
"_ r =
"0 j! S
11-26 Impedance Measurement Basics
Permittivity Measurements
=
Where,
Y_ m
j!C0
(11 0 73)
Y_ m is the measurement admittance value of the MUT.
C0 is the capacitance value of the air gap (whose distance between
electrodes is same as the thickness of the MUT).
C0 = "0
S
d
(11 0 74)
Characteristics of Test Fixture
Edge E ect
When the capacitance of the material is measured, stray capacitance
exists at edge of electrodes (see Figure 11-19).
Figure 11-19. Edge E ect
Because measurement result is a summation of the capacitance of a
MUT and the stray capacitance caused by the edge e ect, the edge
e ect is generally expressed as follows:
C0(1 + Eedge )
(11 0 75)
Where,
Eedge is the compensation coecient for the edge e ect, which is
determined by the gap between electrode and relative permittivity
of MUT.
Adding the edge e ect to C0 in equation (11-73), the relative
permittivity of the MUT can be obtained by using the following
equation:
Y_ m
(11 0 76)
"_ r =
j!C0 (1 + Eedge)
Impedance Measurement Basics 11-27
Permittivity Measurements
The Analyzer uses an approximately value as Eedge of 16453A
The analyzer uses the following approximate value of Eedge for the 16453A:
Eedge = 434t0:825 "0r 00:554
where,
t : [m]
Residual Parameter
In fact the 16453A has residual impedance and stray admittance,
which cause an increased error when measuring the admittance of the
MUT. To eliminate residual and stray admittance, the OPEN, SHORT,
and LOAD xture compensations are required for any permittivity
measurement using the 16453A.
Because the equation to compensate for measurement admittance
value is same as the equation for the OPEN-SHORT-LOAD
xture compensation for impedance measurement, see \Fixture
Compensation" for more information on OPEN, SHORT, and LOAD
xture compensation.
11-28 Impedance Measurement Basics
Permeability Measurements
Permeability Measurements
In general, when current is owing along an in nity line (as shown
in (a) of Figure 11-20), magnetic ux density B is generated by the
current as follows:
B = I
(11 0 77)
2r
When current is owing in a closed loop (as shown in (b) of
Figure 11-20), the magnetic ux 8 generated by the current is :
8 = LI
(11 0 78)
Where, L is the self-inductance of the closed loop.
Because the magnetic ux is calculated by the surface integral of the
magnetic ux density B (s shown in (C) of Figure 11-20), 8 is also
expressed by the following equations:
Z
8 = B ds
(11 0 79)
Figure 11-20.
Basic Relationship of Magnetic Flux Density, Magnetic Flux, and
Current
Figure 11-21 shows the schematic xture structure of the 16454A.
Figure 11-21. Schematic Fixture Structure of 16454A
Impedance Measurement Basics 11-29
Permeability Measurements
The 16454A measures core shape magnetic material as shown in
Figure 11-21. Erasing B and 8 and considering the physical shape and
dimensions of the 16454A, the self-inductance of the measurement
circuit including MUT is derived as follows:
Z
L = 1I B ds
=
=
Z Z
d
h0
a 0
dr dz
2r
(11 0 80)
c
do
0 n
(r 0 1)h ln + h0 ln
b
a
2
(11 0 81)
Modify equation (11-87) to get the relative permeability r of MUT:
2 L 0 Lss
+1
r =
(11 0 82)
F
0
Where,
Lss is the self-inductance of the xture when it is empty.
Lss =
0
b
h0 ln
2
a
(11 0 83)
F is the shape function of MUT, which is decided by its dimensions
only.
F = h ln
Complex Permeability
a
b
(11 0 84)
When the magnetic eld generated by an ac current is owing is
applied to the magnetic material, the permeability is de ned by the
complex value shown in equation (11-92).
_ r = 0 0 j00
(11 0 85)
r
r
Now, because the inductor has a loss factor, the inductance in
equations (11-87) through (1-89) must be modi ed to a complex
impedance, which includes the loss:
Z_
L 0!
(11 0 86)
j!
Figure 11-22. Material Has Loss
The complex relative permeability of the MUT can then be determined
by the following equation:
11-30 Impedance Measurement Basics
Permeability Measurements
Z_ 0 Lss
2 j!
+1
_ r =
0
F
(11 0 87)
_ and calculates _ r using this
The analyzer measures impedance (Z)
equation.
Characteristics of the Test Fixture
Residual Parameter
The 16454A has residual impedance. The residual impedance Z_ res is
represented by a series impedance as shown in Figure 11-23.
Figure 11-23. Residual Impedance of the 16454A
Assuming that the impedance value of the empty test xture is
known, the residual impedance can be speci ed by measuring the
xture with no MUT (empty).
Z_ res = Z_ sm 0 Z_ ss
(11 0 88)
Where,
Z_ ss is the ideal value of the impedance when the xture is empty.
Z_ sm is the measurement value of the impedance when the xture is
empty.
Elimination of Residual Impedance E ects in the Test
Fixture (SHORT Fixture Compensation)
The SHORT xture compensation can eliminate the residual
impedance e ect. When the SHORT (empty) compensation
measurement has been performed, the compensated impedance Z_ comp
can be expressed by the following equation:
Z_ comp = Z_ m 0 Z_ res
(11 0 89)
Assuming that Z_ ss has only an inductance factor (Z_ ss = j!Lss ), and
using the compensated impedance value Z_ comp , the permeability of the
MUT can be derived from Z_ m and Z_ sm as follows:
2 Z_ m 0 Z_ sm
_ r =
+1
(11 0 90)
0
j!F
Impedance Measurement Basics 11-31
Permeability Measurements
Impedance Parameter Value Displayed for Magnetic Material Measurement
When the 4291B measures magnetic materials, the impedance
parameter value displayed is calculated from the following impedance
_
value (Z):
c
_ Z_ = jwh m 0 ln
2
b
Where,
_ m is measurement complex permeability value of MUT
b is inner diameter of MUT
c is outer diameter of MUT
11-32 Impedance Measurement Basics
4291B
RF Impedance/Material Analyzer
Technical
Data
12
Speci cations describe the instrument's warranted performance over
the temperature range of 0 C to 40 C (except as noted). Supplemental
characteristics are intended to provide information that is useful
in applying the instrument by giving non-warranted performance
parameters. These are denoted as typical, typically, nominal or
approximate. Warm up time must be greater than or equal to 30
minutes after power on for all speci cations. Speci cations of the
stimulus characteristics and measurement accuracy are de ned at
the tip of APC-7 R connector on the test head connected to the
instrument.
Measurement Parameter
Impedance parameters
: jZj, z , jYj, y , R, X, G, B, Cp , Cs , Lp , Ls , Rp , Rs , D, Q, j0j, , 0x , 0y
Stimulus Characteristics
Frequency Characteristics
Operating frequency : : : : : : : : : : : : : : : : : : : : : : : : : : : : : 1 MHz to 1.8 GHz
Frequency resolution : : : : : : : : : : : : : : : : : : : : : : : : : : : : : : : : : : : : : : : : 1 mHz
Frequency reference
Accuracy
@ 2365 C : : : : : : : : : : : : : : : : : : : : : : : : : : : : : : : : : : : : : : : : : : : : < 610 ppm
Precision frequency reference (Option 1D5)
Accuracy
@ 0 C to 40 C : : : : : : : : : : : : : : : : : : : : : : : : : : : : : : : : : : : : : : : : : < 61 ppm
Source Characteristics
OSC level
Voltage range
@1 MHz Frequency 1 GHz (When terminal is open)
: : : : : : : : : : : : : : : : : : : : : : : : : : : : : : : : : : : : : : : : : : : : 0.2 mVrms to 1 Vrms
@1 GHz < Frequency 1.8 GHz (When terminal is open)
: : : : : : : : : : : : : : : : : : : : : : : : : : : : : : : : : : : : : : : : : : 0.2 mVrms to 0.5 Vrms
Current range
@1 MHz Frequency 1 GHz (When terminal is shorted)
: : : : : : : : : : : : : : : : : : : : : : : : : : : : : : : : : : : : : : : : : : : 4 Arms to 20 mArms
@1 GHz < Frequency 1.8 GHz (When terminal is shorted)
4291B RF Impedance/Material Analyzer Technical Data 12-1
Permeability Measurements
: : : : : : : : : : : : : : : : : : : : : : : : : : : : : : : : : : : : : : : : : : : 4 Arms to 10 mArms
Power range
@1 MHz Frequency 1 GHz (When terminating with 50 )
: : : : : : : : : : : : : : : : : : : : : : : : : : : : : : : : : : : : : : : : : : : : : 067 dBm to 7 dBm
@1 GHz < Frequency 1.8 GHz (When terminating with 50 )
: : : : : : : : : : : : : : : : : : : : : : : : : : : : : : : : : : : : : : : : : : : : : 067 dBm to 1 dBm
OSC level resolution
AC voltage resolution
@ 0.22 Vrms < VOSC 1 Vrms : : : : : : : : : : : : : : : : : : : : : : : : : : : : : : 2 mV
@ 70 mVrms < VOSC 220 mVrms : : : : : : : : : : : : : : : : : : : : : : : : 0.5 mV
@ 22 mVrms < VOSC 70 mVrms : : : : : : : : : : : : : : : : : : : : : : : : : 0.2 mV
@ 7 mVrms < VOSC 22 mVrms : : : : : : : : : : : : : : : : : : : : : : : : : 0.05 mV
@ 2.2 mVrms < VOSC 7 mVrms : : : : : : : : : : : : : : : : : : : : : : : : 0.02 mV
@ 0.7 mVrms < VOSC 2.2 mVrms : : : : : : : : : : : : : : : : : : : : : 0.005 mV
@ 0.2 mVrms VOSC 0.7 mVrms : : : : : : : : : : : : : : : : : : : : : 0.002 mV
AC current resolution
@ 4.4 mArms < IOSC 20 mArms : : : : : : : : : : : : : : : : : : : : : : : : : : 40 A
@ 1.4 mArms < IOSC 4.4 mArms : : : : : : : : : : : : : : : : : : : : : : : : : 10 A
@ 0.44 mArms < IOSC 1.4 mArms : : : : : : : : : : : : : : : : : : : : : : : : : 4 A
@ 140 Arms < IOSC 440 Arms : : : : : : : : : : : : : : : : : : : : : : : : : : : 1 A
@ 44 Arms < IOSC 140 Arms : : : : : : : : : : : : : : : : : : : : : : : : : : 0.4 A
@ 14 Arms < IOSC 44 Arms : : : : : : : : : : : : : : : : : : : : : : : : : : : 0.1 A
@ 4 Arms IOSC 14 Arms : : : : : : : : : : : : : : : : : : : : : : : : : : : 0.04 A
AC power resolution : : : : : : : : : : : : : : : : : : : : : : : : : : : : : : : : : : : : : 0.1 dBm
6 2f
OSC level accuracy : : : : : : : : : : : : : : : : : : : : : A + B + [dB]1800[M Hz] dB
where,
A depends on temperature conditions as follows:
@ within referenced to 2365 C : : : : : : : : : : : : : : : : : : : : : : : : : : 2 dB
@ other environmental temperature conditions : : : : : : : : : 4 dB
B depends on OSC level as follows:
@ Vosc 250mVrms : : : : : : : : : : : : : : : : : : : : : : : : : : : : : : : : : : : : : : : 0 dB
(Iosc 5 mArms )
(Posc 05 dBm)
@ 250 mVrms > Vosc 2.5 mVrms : : : : : : : : : : : : : : : : : : : : : : : : 1 dB
(5 mArms >Iosc 50 Arms )
(05 dBm > Posc 045 dBm)
@ other OSC level : : : : : : : : : : : : : : : : : : : : : : : : : : : : : : : : : : : : : : : : 2 dB
De nition of OSC level
Voltage level : 2 2 voltage level across the 50 which is connected to the output
terminal. (this level is approximately equal to the level when a terminal is open)
Current level : 2 2 current level through the 50 which is connected to the output
terminal. (this level is approximately equal to the level when a terminal is shorted)
Power level : when terminating with 50 .
OSC level accuracy : : : : : : : : : : : : : 1/2 of speci cation value (typical)
Connector : : : : : : : : : : : : : : : : : : : : : : : : : : : : : : : : : : : : : : : : : : : : : : : : : : : APC7 R
Output impedance : : : : : : : : : : : : : : : : : : : : : : : : : : : : 50 (Nominal value)
DC bias (Option 001)
DC voltage level : : : : : : : : : : : : : : : : : : : : : : : : : : : : : : : : : : : : : : : 0 to 640V
DC current level : : : : : 20 A to 100 mA and 020 A to 0100mA
12-2 4291B RF Impedance/Material Analyzer Technical Data
Permeability Measurements
DC level resolution : : : : : : : : : : : : : : : : : : : : : : : : : : : : : : : : : : : 1mV, 20A
DC level accuracy
@2365 C
Voltage : : : : : : : : : : : : : : : : : 0.1 % + 4 mV + (Idc [mA] 2 5 [
Current : : : : : : : : : : : : : : : : : 0.5 % + 30 A + (Vdc [V] /10 [k
@ 8 to 18 C and 28 to 38 C
Voltage : : : : : : : : : : : : : : : : 0.2 % + 8 mV + (Idc [mA] 2 10 [
Current : : : : : : : : : : : : : : : : : : : : 1 % + 60 A + (Vdc [V] /5 [k
@ 0 to 8 C and 38 to 40 C
Voltage : : : : : : : : : : : : : : : 0.3 % + 12 mV + (Idc [mA] 2 15 [
Current : : : : : : : : : : : : 1.5 % + 90 A + (Vdc [V] 2 3/10 [k
) mV
) mA
]
]
) mV
) mA
]
]
) mV
) mA
]
]
Level monitor
Monitor parameters : : : : : : : : OSC level (voltage, current), DC bias
(voltage, current)
Monitor accuracy
OSC level : : : : : : : : : : : : : : : : : : Same as OSC level accuracy (typical)
DC bias
: : Twice as bad as speci cations of dc level accuracy (typical)
Figure 12-1. DC Voltage and Current Level Range (Typical)
Sweep Characteristics
Sweep parameter : : : : : : : : : Frequency, OSC level (voltage), DC bias
voltage/current
Sweep setup : : : : : : : : : : : : : : : : : : : : : : : : : : : : : Start Stop, or Center Span
Sweep type
Frequency sweep : : : : : : : : : : : : : : : : : : : : : : Linear, Log, Zero-span, List
Other sweep parameters : : : : : : : : : : : : : : : : : : : : Linear, Log, Zero-span
Sweep mode : : : : : : : : Continuous, Single, Manual, Number of groups
Sweep direction
AC level, DC bias (voltage and current) : : Up sweep, Down sweep
Other sweep parameters : : : : : : : : : : : : : : : : : : : : : : : : : : : : : : : : : Up sweep
Number of measurement point : : : : : : : : : : : : : : : : : : : : : 2 to 801 points
Averaging : : : : : : : : : : : : : : : : : : : : : : : : : : : : Sweep average, Point average
Delay time : : : : : : : : : : : : : : : : : : : : : Point delay time, Sweep delay time
4291B RF Impedance/Material Analyzer Technical Data 12-3
Permeability Measurements
Measurement circuit mode : : : : series circuit mode, parallel circuit
mode
Calibration/Compensation
Calibration function
: : : : : : : : : : : : : : : : : : : Open/Short/50 calibration ,Low loss calibration
Compensation function
: : : Open/Short/Load compensation, Port extension, Electric length
12-4 4291B RF Impedance/Material Analyzer Technical Data
Permeability Measurements
Measurement Accuracy
Conditions of accuracy speci cations
Open/Short/50 calibration must be done. Calibration ON.
Averaging (on point) factor is larger than 32 at which calibration is done if Cal
points is set to USER DEF.
Measurement points are same as the calibration points.
Environment temperature is within 65 C of temperature at which calibration is
done, and within 13 C to 33 C. Beyond this environmental temperature condition,
accuracy is twice as bad as speci ed.
jZj, jYj Accuracy : : : : : : : : : : : : : : : : : : : : : : : : : : : : : : : : : : : : : 6(Ea + Eb ) [%]
The illustrations of jZj and jYj accuracy are shown in
Figure 12-2 to Figure 12-5.
(Ea + Eb)
[rad]
100
p
L, C, X, B Accuracy : : : : : : : : : : : : : : : : : : : 6(Ea + Eb) 2 p(1 + Dx2 ) [%]
R, G Accuracy : : : : : : : : : : : : : : : : : : : : : : : : 6(Ea + Eb) 2 (1 + Q2x ) [%]
D Accuracy (1D)
E + Eb
)
(1 + Dx2 ) tan( a
Ea + Eb
100
@ jDx tan(
)j < 1 : : : : : : : : : : : : : : : : : : 6
E + Eb
100
1 7 Dx tan( a
)
100
Accuracy : : : : : : : : : : : : : : : : : : : : : : : : : : : : : : : : : : : : : : : : : 6
Especially, @ Dx
Q Accuracy (1Q)
@ jQx tan(
+ Eb )
0.1 : : : : : : : : : : : : : : : : : : : : : : : : : : : : : : : : : 6 (Ea100
Ea + Eb
100
Especially, @
)j < 1 : : : : : : : : : : : : : : : : : : : 6
10
(Ea + Eb)
(1 + Q2x) tan(
Ea + Eb
100
Ea + Eb
1 7 Qx tan(
)
100
)
+ Eb )
Qx 10 : : : : : : : : : : : : : : : : : 6 Q2x (Ea100
where,
Dx : Measured vaulue of D
Ea : depends on measurement frequency as follows:
@ 1 MHz Frequency 100 MHz : : : : : : : : : : : : : : : : : : : : : : : : : : : 0.6
@ 100 MHz < Frequency 500 MHz : : : : : : : : : : : : : : : : : : : : : : : : : 0.8
@ 500 MHz < Frequency 1000 MHz : : : : : : : : : : : : : : : : : : : : : : : : 1.2
@ 1000 MHz < Frequency 1800 MHz : : : : : : : : : : : : : : : : : : : : : : 2.0
Eb = (Zs /jZxj + Yo jZxj) 2 100
Qx : Measured value of Q
Zx : impedance measurement value [ ]
Zs and Yo depend on number of point averaging (Nav), OSC level
(Vosc ), impedance measurement value (Zx ) and the test head used
as follows:
4291B RF Impedance/Material Analyzer Technical Data 12-5
Permeability Measurements
Table 12-1. Zs and Yo when High Impedance Test Head is used
Measurement Conditions
Number of
Meas.
Point
OSC Signal Level
Impedance
Averaging
(Vosc )
(Zx )
(Nav )
1Nav 7
Vosc < 0.02 V
|
0.02 V Vosc < 0.12 V
|
0.12 V Vosc
Nav 8
Zx 500
Zx <500
Vosc < 0.02 V
0.02 V Vosc < 0.12 V
0.12 V Vosc
|
|
Zx 500
Zx <500
Zs [ ]
Yo [S]
2(0.2+0.0012f[MHz] )
0.2+0.0012f[MHz]
0.2+0.0012f[MHz]
0.2+0.0012f[MHz]
0 02
{4
osc 2(0.1+5210 2f[MHz] )
0.1+5210{4 2f[MHz]
0.1+5210{4 2f[MHz]
0.1+5210{4 2f[MHz]
2(5210{5 +2210{7 2f[MHz] )
5210{5 +2210{7 2f[MHz]
5210{6 +2210{7 2f[MHz]
2210{5 +2210{7 2f[MHz]
0 02
{7
{5
osc 2(2210 +1210 2f[MHz] )
2210{5 +1210{7 2f[MHz]
2210{6 +1210{7 2f[MHz]
7210{6 +1210{7 2f[MHz]
0:02
0:02
V
:
:
V
osc
V
V
osc
Table 12-2. Zs and Yo when Low Impedance Test Head is used
Measurement Conditions
Meas.
Number of
Impedance
Point
OSC Signal Level
(Vosc )
(Zx )
Averaging
(Nav )
1Nav 7
Vosc < 0.02 V
0.02 V Vosc < 0.12 V
0.12 V Vosc
Nav
8
Zs [ ]
osc 2(0.1+0.0012f[MHz] )
|
0:02
V
|
0.1+0.0012f[MHz]
Zx 5
Zx >5
Yo [S]
0.05+0.0012f[MHz]
osc 2(0.05+5210
2f[MHz] )
|
0.02 V Vosc < 0.12 V
|
0.05+5210{4 2f[MHz]
Zx >5
0.02+5210{4 2f[MHz]
Zx 5
1210{4 +2210{7 2f[MHz]
1210{4 +2210{7 2f[MHz]
0.01+0.0012f[MHz]
Vosc < 0.02 V
0.12 V Vosc
{7
{4
osc 2(1210 +2210 2f[MHz] )
0:02
V
0:02
V
{4
0.01+5210{4 2f[MHz]
1210{4 +2210{7 2f[MHz]
{5
{7
osc 2(3210 +1210 2f[MHz] )
0:02
V
3210{5 +1210{7 2f[MHz]
3210{5 +1210{7 2f[MHz]
3210{5 +1210{7 2f[MHz]
At the following frequency points, instrument spurious characteristics could
occasionally cause measurement errors to exceed speci ed value because of
instrument spurious characteristics.
10.71 MHz
514.645 MHz
17.24 MHz
686.19333 MHz
21.42 MHz
1029.29 MHz
See \EMC" under \Others" in \General
Characteristics".
12-6 4291B RF Impedance/Material Analyzer Technical Data
42.84 MHz
1327.38666 MHz
Permeability Measurements
Figure 12-2.
Impedance Measurement Accuracy Using High Impedance Test Head (@ Low OSC Level)
Figure 12-3.
Impedance Measurement Accuracy Using High Impedance Test Head (@ High OSC Level)
4291B RF Impedance/Material Analyzer Technical Data 12-7
Permeability Measurements
Figure 12-4.
Impedance Measurement Accuracy Using Low Impedance Test Head (@ Low OSC Level)
Figure 12-5.
Impedance Measurement Accuracy Using Low Impedance Test Head (@ High OSC Level)
12-8 4291B RF Impedance/Material Analyzer Technical Data
Permeability Measurements
Typical measurement accuracy when open/short/50 /low-loss-capaciter
calibration is done
Conditions
Averaging on point factor is lager than 32 at which calibration is done.
Cal Points is set to USER DEF.
Environment temperature is within 65 C of temperature at which calibration
is done, and within 13 C to 33 C. Beyond this environmental temperature
condition, accuracy is twice as bad as speci ed.
jZj, jYj Accuracy
Accuracy
: : : : : : : : : : : : : : : : : : : : : : : : : : : : : : : : : : : : : : : : : : : : : : : : 6(Ea + Eb ) [%]
Ec
[rad]
:::::::::::::::::::::::::::::::::::::::::::::::::::::::::: 6
p
100
L, C, X, B Accuracy : : : : : : : : : : : : : : : : : : : : : : : : : : : : : : 6 (Ea + Eb ) + (Ec Dx )2 [%]
p
R, G Accuracy : : : : : : : : : : : : : : : : : : : : : : : : : : : : : : : : : : : 6 (Ea + Eb )2 + (EcQx )2 [%]
D Accuracy
@ jDx tan (Ec /100)j < 1 : : : : : : : : : : : : : : : : : : : : : : : : : : : : : : : : 6
Especially, Dx
0.1
@ jQx tan(Ec /100)j < 1 : : : : : : : : : : : : : : : : : : : : : : : : : : : : : : : : : 6
10
Ec
(1 + Dx2 ) tan(Ec=100)
1 7 Dx tan(Ec =100)
:::::::::::::::::::::::::::::::::::::::::::::::::::::6
Q Accuracy
Especially,
2
Qx 10
Ec
100
(1 + Q2x ) tan(Ec =100)
1 7 Qx tan(Ec =100)
: : : : : : : : : : : : : : : : : : : : : : : : : : : : : : : : : : : : : : : : : : : : 6Q2x
Ec
100
Where,
Dx : Actual D value of DUT
Ea , Eb : are as same as Ea and Eb of the measurement accuracy when
OPEN/SHORT/50
calbration is done.
Ec = 0:06 + 0:14 2
1800
F
(Typical)
F : measurement frequency [MHz]
Qx : Actual Q value of DUT
4291B RF Impedance/Material Analyzer Technical Data 12-9
Permeability Measurements
Figure 12-6.
Typical Q Measurement Accuracy (when open/short/50 /low-loss-capaciter calibration are done)
12-10 4291B RF Impedance/Material Analyzer Technical Data
Option 013 and 014 High Temperature Test Heads
Speci cation for Option 013 and 014 High Temperature Test Heads
Frequency Characteristics
Operating frequency : : : : : : : : : : : : : : : : : : : : : : : : : : : : : 1 MHz to 1.8 GHz
Source Characteristics
OSC level
Voltage Range
@1 MHz Frequency < 1 GHz : : : : : : : : : 0.2 mVrms to 500 mVrms
@1 GHz Frequency 1.8 GHz : : : : : : : : : : 0.2 mVrms 250 mVrms
OSC level resolution
AC voltage resolution
@ 110 mVrms < Vosc 500 mVrms : : : : : : : : : : : : : : : : : : : : : : : : : : 2 mV
@ 11 mVrms < Vosc 110 mVrms : : : : : : : : : : : : : : : : : : : : : : : : : 0.2 mV
@ 1.1 mVrms < Vosc 11 mVrms : : : : : : : : : : : : : : : : : : : : : : : : : : : 20 V
@ 0.2 mVrms Vosc 1.1 mVrms : : : : : : : : : : : : : : : : : : : : : : : : : : : 2 V
AC current resolution
@ 2.75 mArms < Iosc 12.5 mArms : : : : : : : : : : : : : : : : : : : : : : : : 50 A
@ 0.275 mArms < Iosc 2.75 mArms : : : : : : : : : : : : : : : : : : : : : : : : 5 A
@ 27.5 Arms < Iosc 275 Arms : : : : : : : : : : : : : : : : : : : : : : : : : 0.5 A
@ 5 A Iosc 27.5 A : : : : : : : : : : : : : : : : : : : : : : : : : : : : : : : : : 0.05 A
AC power resolution
@ 066.1 dBm Posc
OSC level accuracy
1.9 dBm : : : : : : : : : : : : : : : : : : : 0.2 dBm max
@ 1 MHz Frequency 1GHz, Vosc 0.25 Vrms (Iosc 6.3 mA,
Posc 04.1 dBm)
8 2 frequency[M Hz]
dB
: : : : : : : : : : : : : : : : : : : : : : : : : : : : : : : : : A + B + [dB]
1800
where,
A depends on temperature conditions as follows:
within referenced to 2365 C : : : : : : : : : : : : : : : : : : : : : : : : : : 4 dB
@ 0 C to 18 C, 28 C to 40 C : : : : : : : : : : : : : : : : : : : : : : : : : : : 6 dB
B depends on OSC level as follows:
@ 0.5 Vrms Vosc 120 mVrms : : : : : : : : : : : : : : : : : : : : : : : : : 0 dB
(12.5 mArms Iosc 3mArms )
(1.9 dBm Posc 010 dBm)
@ 120 mVrms > Vosc 1.2 mVrms : : : : : : : : : : : : : : : : : : : : : : 1 dB
(3 mArms > Iosc 30 Arms )
(010 dBm > Posc 050 dBm)
@ 1.2 mVrms > Vosc 0.2 mVrms : : : : : : : : : : : : : : : : : : : : : : 2 dB
(30 Arms > Iosc 5 Arms )
(050 dBm > Posc 066.1 dBm)
Output impedance : : : : : : : : : : : : : : : : : : : : : : : : : : : : 40 (Nominal value)
Level Monitor
Monitor accuracy
OSC level : : : : : : : : : : : : : : : : : : Same as OSC level accuracy (typical)
DC bias
: : Twice as bad as speci cations of dc level accuracy (typical)
4291B RF Impedance/Material Analyzer Technical Data 12-11
Option 013 and 014 High Temperature Test Heads
Basic Measurement Accuracy
Conditions of accuracy speci cations
OPEN/SHORT/50 calibration must be done. Calibration ON.
Averaging (on point) factor must be larger than 32 at which calibration is
done.
Measurement points are same as the calibration points.
Environment temperature is within 65 C of temperature at which
calibration is done, and within 13 C to 33 C. Beyond this environmental
temperature condition, and within 0 C to 40 C, accuracy is twice as bad
as speci ed.
Bending cable should be smooth and the bending angle is less than 30 .
Cable position should be kept in the same dposition after calibration
measurement.
OSC level must be same as level at which calibration is done.
OSC level is less than or equal to 0.25 V, or OSC level is greater than 0.25
V and frequency range is within 1 MHz to 1 GHz.
jZj Accuracy : : : : : : : : : : : : : : : : : : : : : : : : : : : : : : : : : : : : : : : : : 6(Ea + Eb) [%]
(E + Eb)
[rad]
Accuracy : : : : : : : : : : : : : : : : : : : : : : : : : : : : : : : : : : : : : : : : : 6 a
100
Where,
Ea : depends on measurement frequency as follows:
@ 1 MHz frequency 100 MHz : : : : : : : : : : : : : : : : : : : : : 0.6 [%]
@ 100 MHz < frequency 500 MHz : : : : : : : : : : : : : : : : : : : 0.8 [%]
@ 500 MHz < frequency 1 GHz : : : : : : : : : : : : : : : : : : : : : 1.5 [%]
@ 1 GHz < frequency 1.8 GHz : : : : : : : : : : : : : : : : : : : : : : 3.0 [%]
Eb = (Zs /Zx + Y0 Zx ) 2100 [%]
Zs and Y0 depend on number of point averaging (Nav) and OSC
level (Vosc ) as follows:
Zx : Impedance measurement value [ ]
12-12 4291B RF Impedance/Material Analyzer Technical Data
Option 013 and 014 High Temperature Test Heads
Table 12-3. Zs and Yo when High Impedance Test Head is used
Measurement Conditions
Number of Point
Averaging
OSC Signal Level
(Nav )
(Vosc )1
1Nav 7
Zs [ ]
Vosc < 0.02
0.02 V Vosc < 0.12
0.12 V Vosc
8<Nav
Vosc < 0.02
0.02 V Vosc < 0.12
0.12 V Vosc
2 (0.2+0.0012f[MHz] )
0.2+0.0012f[MHz]
0.2+0.0012f[MHz]
0 02
osc 2 (0.1+0.0012f[MHz] )
0.1+0.0012f[MHz]
0.1+0.0012f[MHz]
Yo [S]
2(5210{5 +2210{7 2f[MHz] )
5210{5 +2210{7 2f[MHz]
3210{5 +2210{7 2f[MHz]
0 02
{7
{5
osc 2(2210 +2210 2f[MHz] )
2210{5 +2210{7 2f[MHz]
1210{5 +2210{7 2f[MHz]
0:02
V
0:02
V
:
V
:
V
osc
osc
1 Vosc =0.12 V Iosc =3 mA Posc =010 dBm, Vosc =0.02 V Iosc =0.5 mA Posc =026 dBm
Table 12-4. Zs and Yo when Low Impedance Test Head is used
Measurement Conditions
Number of Point
Averaging
OSC Signal Level
(Nav )
(Vosc )1
1Nav 7
Zs [ ]
Vosc < 0.02
0.02 V Vosc < 0.12
0.12 V Vosc
8<Nav
Vosc < 0.02
0.02 V Vosc < 0.12
0.12 V Vosc
2 (0.1+0.0012f[MHz] )
0.1+0.0012f[MHz]
0.05+0.0012f[MHz]
0 02
osc 2 (0.05+0.0012f[MHz] )
0.05+0.0012f[MHz]
0.03+0.0012f[MHz]
0:02
V
osc
:
V
Yo [S]
2(1210{4 +2210{7 2f[MHz] )
1210{4 +2210{7 2f[MHz]
1210{4 +2210{7 2f[MHz]
0 02
{5
{7
osc 2(3210 +2210 2f[MHz] )
3210{5 +2210{7 2f[MHz]
3210{5 +2210{7 2f[MHz]
0:02
V
osc
:
V
1 Vosc =0.12 V Iosc =3 mA Posc =010 dBm, Vosc =0.02 V Iosc =0.5 mA Posc =026 dBm
At the following frequency points, instrument spurious characteristics could
occasionally cause measurement errors to exceed speci ed value because of
instrument spurious characteristics.
10.71 MHz
514.645 MHz
17.24 MHz
686.19333 MHz
21.42 MHz
1029.29 MHz
42.84 MHz
1327.38666 MHz
See \EMC" under \Others" in \General
Characteristics".
The excessive vibration and shock could
occasionally cause measurement errors to exceed
speci ed value.
4291B RF Impedance/Material Analyzer Technical Data 12-13
Option 013 and 014 High Temperature Test Heads
Figure 12-7.
Impedance Measurement Accuracy Using High Temperature High Impedance Test Head
(@ Low OSC Level)
Figure 12-8.
Impedance Measurement Accuracy Using High Temperature High Impedance Test Head
(@ High OSC Level)
12-14 4291B RF Impedance/Material Analyzer Technical Data
Option 013 and 014 High Temperature Test Heads
Figure 12-9.
Impedance Measurement Accuracy Using High Temperature Low Impedance Test Head
(@ Low OSC Level)
Figure 12-10.
Impedance Measurement Accuracy Using High Temperature Low Impedance Test Head
(@ High OSC Level)
4291B RF Impedance/Material Analyzer Technical Data 12-15
Option 013 and 014 High Temperature Test Heads
Typical E ects of Temperature Drift on Measurement Accuracy
When environment temperature is without 65 C of temperature at which
calibration is done, add the following measurement error.
Conditions of Typical E ects of Temperature Drift
Environment temperature of a test head is within 055 C to 0 C or 40 C to 200 C.
Environment temperature of the mainframe is within 65 C of temperature at
which calibration is done, and within 0 C to 40 C.
Other conditions are as same as the conditions of the basic measurement accuracy
of option 013/014.
jZj Accuracy : : : : : : : : : : : : : : : : : : : : : : : : : : : : : : : : : : : : : : : : 6(Ea2 + Eb2) [%]
(E + Eb2)
[rad]
Accuracy : : : : : : : : : : : : : : : : : : : : : : : : : : : : : : : : : : : : : : : 6 a2
100
where,
Ea2 = (1A1 1T + 1A2) 2108
Eb2 = (Zs2 / Zx + Yo2 Zx )2100
1A1 is the e ect of temperature drift on the impedance
measurement value as follows:
: : : : : : : : : : : : : : : : : : : : : : : : : : : : : : : (50 + 3002f ) [ppm/ C] (typical)
1A2 is the hysterisiss of the e ect of temperature drift on the
impedance measurement value as follows:
1A 1T
: : : : : : : : : : : : : : : : : : : : : : : : : : : : : : : : : : : : : : : : : 1 [ppm] (typical)
3
f : Measurement Frequency[GHz]
1T : Di erence of temperature between measurement
condition and calibration measurement condition. [ C]
Yo2 = (1Yo1 1T + 1Yo2 ) 210{6 [S]
Zs2 = (1Zs1 1T + 1Zs2) 210{3 [ ]
Zx : Impedance measurement value [ ]
1Yo1 is the temperature coecient for OPEN residual as
follows:
@ High Temperature High Impedance Test Head is used
: : : : : : : : : : : : : : : : : : : : : : : : : : : : : : : : (0.2 + 82f2 ) [S/ C] (typical)
@ High Temperature Low Impedance Test Head is used
: : : : : : : : : : : : : : : : : : : : : : : : : : : : : : : : : : (1 + 302f) [S/ C] (typical)
1Yo2 is the hysterisis of the OPEN residual as follows:
1Y 1T
: : : : : : : : : : : : : : : : : : : : : : : : : : : : : : : : : : : : : : : o1 [S/ C] (typical)
3
1Zs1 is the temperature coecient for SHORT residual as
follows:
@ High Temperature High Impedance Test Head is used
: : : : : : : : : : : : : : : : : : : : : : : : : : : : : : : : : (4 + 502f) [m / C] (typical)
@ High Temperature Low Impedance Test Head is used
: : : : : : : : : : : : : : : : : : : : : : : : : : : : : : : (1 + 10 2f2 ) [m / C] (typical)
1Zs2 is the hysterisis of the SHORT residual as follows:
1Z 1T
: : : : : : : : : : : : : : : : : : : : : : : : : : : : : : : : : : : : : : s1 [m / C] (typical)
3
12-16 4291B RF Impedance/Material Analyzer Technical Data
Option 013 and 014 High Temperature Test Heads
Figure 12-11.
Typical Frequency Characteristics of Temperature Coecient Using High Temperature High
Impedance Test Head
Figure 12-12.
Typical Frequency Characteristics of Temperature Coecient Using High Temperature Low
Impedance Test Head
4291B RF Impedance/Material Analyzer Technical Data 12-17
Option 013 and 014 High Temperature Test Heads
Operation Conditions of the Test Head
The cable at least 15 cm from the test station must be in the same temparature of
the main frame.
: : : : : : : : : : : : : : : : : : : : : : : : : : : : : : : : : : : : : : : : : : : : : : : : : : : : : : 055 C to +200 C
Dimensions of High Temperature Test Head
Figure 12-13. Dimensions of High Temperature Test Head
12-18 4291B RF Impedance/Material Analyzer Technical Data
Option 013 and 014 High Temperature Test Heads
Display
LCD
type/size : : : : : : : : : : : : : : : : : : : : : : : : : : : : : : : : : : : : : : : Color TFT, 8.4 inch
Resolution : : : : : : : : : : : : : : : : : : : : : : : : : : : : : : : : : : : : : : : : : : : : : : : 640 2 480
E ective Display Area : : : : : : 160 mm 2 115mm (600 2 430 dots)
Number of display channels : : : : : : : : : : : : : : : : : : : : : : : : : : : : : : : : : : : : : : : 2
Format : : : : : : : : : single, dual split or overwrite, graphic, and tabular
Number of traces
For measurement : : : : : : : : : : : : : : : : : : : : : : : : : : : : : : : : : : 1 trace/channel
For memory : : : : : : : : : : : : : : : : : : : : : : : : : 16 traces/channel (maximum)
Data math functions : : : : : : : : : : : : : : : : : : : : : : : : : : gain 2 data 0 o set
gain 2 memory 0 o set
gain 2 (data 0 memory) 0 o set
gain 2 (data + memory) 0 o set
gain 2 (data/memory) 0 o set
gain 2 (data2memory) 0 o set
Marker
Number of markers
Main marker : : : : : : : : : : : : : : : : : : : : : : : : : : : : : : : : : 1 for each channel
Sub-marker : : : : : : : : : : : : : : : : : : : : : : : : : : : : : : : : : : : 7 for each channel
1Marker : : : : : : : : : : : : : : : : : : : : : : : : : : : : : : : : : : : : : : 1 for each channel
Data Storage
Type : : : : : : : : : : : : : : : : : : : : : : : : oppy disk drive, Volatile memory disk
Capacity
oppy disk : : : : : : : : : : : : : : : : : : : : : : : : : : : : : : : : : : : : : : : : : 720 kB/1.44 MB
Volatile memory disk, can be backed up by ash memory : 448 kB
(maximum)
Disk format : : : : : : : : : : : : : : : : : : : : : : : : : : : : : : : : : : : : : : : : : : : : : : : : LIF, DOS
GPIB
Interface : : : : : : : : : : : : : : : : : : : : : : : : : : : : : : : : : IEEE 488.1-1987, IEC625,
Interface function : : : : : : : : SH1, AH1, T6, TE0, L4, LE0, SR1, RL1,
PPO, DC1, DT1, C1, C2, C3, C4, C11, E2
Numeric Data Transfer formats : : : : : : : : : : : : : : : : : : : : : : : : : : : : : ASCII
32 and 64 bit IEEE 754 Floating point format,
DOS PC format (32 bit IEEE with byte order reversed)
Protocol : : : : : : : : : : : : : : : : : : : : : : : : : : : : : : : : : : : : : : : : : : : : IEEE 488.2-1987
4291B RF Impedance/Material Analyzer Technical Data 12-19
Option 013 and 014 High Temperature Test Heads
Printer parallel port
Interface : : : : : : : : : : : : : : : : : IEEE 1284 Centronics standard compliant
Printer control language : : : : : : : HP PCL3 Printer Control Language
Connector : : : : : : : : : : : : : : : : : : : : : : : : : : : : : : : : : : : : : : : : : : : : : D-sub (25-pin)
General Characteristics
Input and Output Characteristics
External reference input
Frequency : : : : : : : : : : : : : : : : : : : : : : : : : : : : 10 MHz6100 Hz (typically)
Level : : : : : : : : : : : : : : : : : : : : : : : : : : : : : : : : : : : : : : : : > 06 dBm (typically)
Input impedance : : : : : : : : : : : : : : : : : : : : : : : : : : : : : : : : : : : 50 (nominal)
Connector : : : : : : : : : : : : : : : : : : : : : : : : : : : : : : : : : : : : : : : : : : : : BNC female
Internal Reference Output
Frequency : : : : : : : : : : : : : : : : : : : : : : : : : : : : : : : : : : : : : : 10 MHz (nominal)
Level : : : : : : : : : : : : : : : : : : : : : : : : : : : : : : : : : : : : : : : : : : : : 2 dBm (typically)
Output Impedance : : : : : : : : : : : : : : : : : : : : : : : : : : : : : : : : 50 (nominal)
Connector : : : : : : : : : : : : : : : : : : : : : : : : : : : : : : : : : : : : : : : : : : : : BNC female
External trigger input
Level : : : : : : : : : : : : : : : : : : : : : : : : : : : : : : : : : : : : : : : : : : : : : : : : : : : : TTL Level
Pulse width (Tp) : : : : : : : : : : : : : : : : : : : : : : : : : : : : : : : : > 2 s (typically)
Polarity : : : : : : : : : : : : : : : : : : : : : : : : : : : : : : : : positive/negative selective
Connector : : : : : : : : : : : : : : : : : : : : : : : : : : : : : : : : : : : : : : : : : : : : BNC female
Figure 12-14. Trigger Signal
External monitor output
Connector : : : : : : : : : : : : : : : : : : : : : : : : : : : : : : : : : : : : : : : D-sub (15-pin HD)
Display resolution : : : : : : : : : : : : : : : : : : : : : : : : : : : : : : : : 640 2 480 VGA
12-20 4291B RF Impedance/Material Analyzer Technical Data
Option 013 and 014 High Temperature Test Heads
Operation Conditions
Temperature
Disk drive non-operating condition : : : : : : : : : : : : : : : : : : : : 0 C to 40 C
Disk drive operating condition : : : : : : : : : : : : : : : : : : : : : : : 10 C to 40 C
Humidity
@wet bulb temperature <29 C, without condensation
Disk drive non-operating condition : : : : : : : : : : : : 15 % to 95 % RH
Disk drive operating condition : : : : : : : : : : : : : : : : 15 % to 80 % RH
Altitude : : : : : : : : : : : : : : : : : : : : : : : : : : : : : : : : : : : : : : : : : : : 0 to 2,000 meters
Warm up time : : : : : : : : : : : : : : : : : : : : : : : : : : : : : : : : : : : : : : : : : : : : 30 minutes
Non-operation conditions
Temperature : : : : : : : : : : : : : : : : : : : : : : : : : : : : : : : : : : : : : : : : : : 020 C to 60 C
Humidity
@wet bulb temperature <45 C, without condensation : 15 % to 95
% RH
Altitude : : : : : : : : : : : : : : : : : : : : : : : : : : : : : : : : : : : : : : : : : : : : 0 to 4,572 meters
Others
EMC
Complies with CISPR 11 (1990) / EN 55011 (1991) : Group 1, Class A
Complies with IEC 1000-3-2 (1995) / EN 61000-3-2 (1995)
Complies with IEC 1000-3-3 (1994) / EN 61000-3-3 (1995)
Complies with IEC 1000-4-2 (1995) / EN 50082-1 (1992) : 4 kV CD, 8
kV AD
Complies with IEC 1000-4-3 (1995) / EN 50082-1 (1992) : 3 V/m,
27-1000 MHz
Complies with IEC 1000-4-4 (1995) / EN 50082-1 (1992) : 0.5 kV
Signal Lines, 1 kV Main
Note: When tested at 3 V/m according to IEC 1000-4-3(1995), the measurement
accuracy will be within speci cations over the full immunity test frequency
range of 27 to 1000 MHz except when the analyzer frequency is identical to
the transmitted interference signal test frequency.
This ISM device complies with Canadian ICES-001. Cet appareil ISM
est conforme a la norme NMB-001 du Canada.
Safety
Complies with IEC 1010-1(1990), Amendment1(1992) and
Amendment2(1995).
Complies with CSA-C22.2 No.1010.1-92.
Power requirements
90V to 132V, or 198V to 264V (automatically switched), 47 to 63 Hz,
300VA max
Weight
Mainframe : : : : : : : : : : : : : : : : : : : : : : : : : : : : : : : : : : : : : : : : : : : : 21.5 kg (SPC)
Test Station : : : : : : : : : : : : : : : : : : : : : : : : : : : : : : : : : : : : : : : : : : : : : : : : : : 3.7 kg
Dimensions
Mainframe : : : : : : : : : : : : : : : : : : : : : : : 425 (W) 2 235 (H) 2 553 (D) mm
Test Station : : : : : : : : : : : : : : : : : : : : : : : : 275 (W) 2 95 (H) 2 205 (D) mm
4291B RF Impedance/Material Analyzer Technical Data 12-21
Option 013 and 014 High Temperature Test Heads
External program Run/Cont input
Connector : : : : : : : : : : : : : : : : : : : : : : : : : : : : : : : : : : : : : : : : : : : : : : : BNC female
Level : : : : : : : : : : : : : : : : : : : : : : : : : : : : : : : : : : : : : : : : : : : : : : : : : : : : : : : : : : : : : TTL
Keyboard connector : : : : : : : : : : : : : : : : : : : : : : : : : : : : : : : : : : : : : : : mini-DIN
I/O port : : : : : : : : : : : : : : : : : : : : : : : : : : 4 bit in/ 8 bit out port, TTL Level
I/O port pin assignments
Figure 12-15. I/O Port Pin Assignment
Speci cations for Option 1D5 High Stability Frequency Reference
Reference Oven Output
Frequency : : : : : : : : : : : : : : : : : : : : : : : : : : : : : : : : : : : : : : : : : 10 MHz (nominal)
Level : : : : : : : : : : : : : : : : : : : : : : : : : : : : : : : : : : : : : : : : : : : : : : : 0 dBm (typically)
Output Impedance : : : : : : : : : : : : : : : : : : : : : : : : : : : : : : : : : : : 50 (nominal)
Connector : : : : : : : : : : : : : : : : : : : : : : : : : : : : : : : : : : : : : : : : : : : : : : : BNC female
12-22 4291B RF Impedance/Material Analyzer Technical Data
Option 002 Material Measurement
Supplemental Characteristics for Option 002 Material Measurement
Measurement Frequency Range
@ Using with 16453A : : : : : : : : : : : : : : : : : : : : 1 MHz to 1.0 GHz (Typical)
@ Using with 16454A : : : : : : : : : : : : : : : : : : : : 1 MHz to 1.0 GHz (Typical)
Measurement Parameter
Permittivity parameters
: : : : : : : : : : : : : : : : : : : : : : : : : : : : : : : : : : : : : : : : : : : : : : : : : : : : : : : j"r j, "r 0 , "r 00 , tan
Permeability parameters
: : : : : : : : : : : : : : : : : : : : : : : : : : : : : : : : : : : : : : : : : : : : : : : : : : : : : : jr j, 0 r , 00 r , tan
Typical Measurement Accuracy
Conditions of accuracy characteristics
Use the High Z Test Head for permittivity measurement
Use the Low Z Test Head for permeability measurement
OPEN/SHORT/50 calibration must be done. Calibration ON.
Averaging (on point) factor is larger than 32 at which calibration is done if Cal
points is set to USER DEF.
Measurement points are same as the calibration points if Cal point is set to USER
DEF.
Environment temperature is within 65 C of temperature at which calibration is
done, and within 13 C to 33 C. Beyond this environmental temperature condition,
accuracy is twice as bad as speci ed.
1"0
"r 0 Accuracy ( 0 rm )
"rm
@tan < 0.1
0
"0
100
0:04 t
) 0 + 0:25 rm +
: : : : : : 5 + 10 +
t
f "rm
j1 0 ( f p13" )2j [%] (Typical)
0
rm
Loss Tangent Accuracy of "_ r (1tan)
@tan < 0.1 : : : : : : : : : : : : : : : : : : : : : : : : : : : : : : : : : : : : : : Ea + Eb (Typical)
Where,
@ frequency 1 GHz
0:1
Ea = 0:002 + 0:0004 0t + 0:004f +
f "rm
j1 0 ( f p13"rm )2 j
(Typical)
@ frequency > 1 GHz
t
1:1
Ea = 0:002 + 0:0004
+ 0:004f +
0
f "rm
j1 0 ( f p13"rm )2 j
(Typical)
0 0
1
0:002 1
Eb = 1""0 rm 100
+ "0rm
tan (Typical)
t
rm
0
0
4291B RF Impedance/Material Analyzer Technical Data 12-23
Option 002 Material Measurement
f is measurement frequency [GHz]
t is thickness of MUT [mm]
"rm 0 is measured value of "r 0
tan is measured value of dielectric loss tangent
10
r 0 Accuracy ( 0 rm )
rm
@tan < 0.1 : : : : : : : 4 +
0
25
15 12 2
+ F 0rm 1 + 0
f [%] (Typical)
0
F rm
F rm
Loss Tangent Accuracy of _ r (1tan)
@tan<0.1 : : : : : : : : : : : : : : : : : : : : : : : : : : : : : : : : : : : : : : : : Ea + Eb (Typical)
Where,
Ea = 0:002 + F0:001
0rm f + 0:004f (Typical)
0
(Typical)
Eb = 10 rm tan
rm 100
f is measurement frequency [GHz]
F = h ln c [mm]
b
h is the height of MUT [mm]
b is the inner diameter of MUT
c is the outer diameter of MUT
tan is the measured value of loss tangent
rm 0 is the measured value of permeability
At the following frequency points, instrument spurious characteristics could
occasionally cause measurement errors to exceed speci ed value because of
instrument spurious characteristics.
10.71 MHz
514.645 MHz
17.24 MHz
686.19333 MHz
21.42 MHz
1029.29 MHz
See \EMC" under \Others" in \General
Characteristics".
12-24 4291B RF Impedance/Material Analyzer Technical Data
42.84 MHz
1327.38666 MHz
Option 002 Material Measurement
Figure 12-16. Typical Permittivity Measurement Accuracy (@thickness=0.3 mm)
Figure 12-17. Typical Permittivity Measurement Accuracy (@thickness=1 mm)
4291B RF Impedance/Material Analyzer Technical Data 12-25
Option 002 Material Measurement
Figure 12-18. Typical Permittivity Measurement Accuracy (@thickness=3 mm)
12-26 4291B RF Impedance/Material Analyzer Technical Data
Option 002 Material Measurement
Figure 12-19.
Typical Dielectric Loss Tangent (tan) Measurement Accuracy (@thickness=0.3 mm)
Note
This graph shows only frequency dependence of Ea to simplify it. The
typical accuracy of tan is de ned as Ea + Eb; refer to \Supplemental
Characteristics for Option 002 Material Measurement".
4291B RF Impedance/Material Analyzer Technical Data 12-27
Option 002 Material Measurement
Figure 12-20. Typical Dielectric Loss Tangent (tan) Measurement Accuracy (@thickness=1 mm)
Note
This graph shows only frequency dependence of Ea to simplify it. The
typical accuracy of tan is de ned as Ea + Eb; refer to \Supplemental
Characteristics for Option 002 Material Measurement".
12-28 4291B RF Impedance/Material Analyzer Technical Data
Option 002 Material Measurement
Figure 12-21. Typical Dielectric Loss Tangent (tan) Measurement Accuracy (@thickness=3 mm)
Note
This graph shows only frequency dependence of Ea to simplify it. The
typical accuracy of tan is de ned as Ea + Eb; refer to \Supplemental
Characteristics for Option 002 Material Measurement".
4291B RF Impedance/Material Analyzer Technical Data 12-29
Option 002 Material Measurement
Figure 12-22.
Typical Permittivity Measurement Accuracy ("r v.s. Frequency, @thickness=0.3 mm)
Figure 12-23.
Typical Permittivity Measurement Accuracy ("r v.s. Frequency, @thickness=1 mm)
12-30 4291B RF Impedance/Material Analyzer Technical Data
Option 002 Material Measurement
Figure 12-24.
Typical Permittivity Measurement Accuracy ("r v.s. Frequency, @thickness=3 mm)
Figure 12-25. Typical Permeability Measurement Accuracy (@F* =0.5)
4291B RF Impedance/Material Analyzer Technical Data 12-31
Option 002 Material Measurement
Figure 12-26. Typical Permeability Measurement Accuracy (@F* =3)
Figure 12-27. Typical Permeability Measurement Accuracy (@F*=10)
12-32 4291B RF Impedance/Material Analyzer Technical Data
3 F = h ln
c
b
Option 002 Material Measurement
Figure 12-28. Typical Permeability Loss Tangent (tan) Measurement Accuracy (@F* =0.5)
3 F = h ln
Note
c
b
This graph shows only frequency dependence of Ea to simplify it. The
typical accuracy of tan is de ned as Ea + Eb; refer to \Supplemental
Characteristics for Option 002 Material Measurement".
4291B RF Impedance/Material Analyzer Technical Data 12-33
Option 002 Material Measurement
Figure 12-29. Typical Permeability Loss Tangent (tan) Measurement Accuracy (@F* =3)
Note
This graph shows only frequency dependence of Ea to simplify it. The
typical accuracy of tan is de ned as Ea + Eb; refer to \Supplemental
Characteristics for Option 002 Material Measurement".
12-34 4291B RF Impedance/Material Analyzer Technical Data
Option 002 Material Measurement
Figure 12-30. Typical Permeability loss Tangent (tan) Measurement Accuracy (@F* =10)
3 F = h ln
Note
c
b
This graph shows only frequency dependence of Ea to simplify it. The
typical accuracy of tan is de ned as Ea + Eb; refer to \Supplemental
Characteristics for Option 002 Material Measurement".
4291B RF Impedance/Material Analyzer Technical Data 12-35
Option 002 Material Measurement
Figure 12-31. Typical Permeability Measurement Accuracy (r v.s. Frequency, @F* =0.5)
Figure 12-32. Typical Permeability Measurement Accuracy (r v.s. Frequency, @F* =3)
3 F = h ln
12-36 4291B RF Impedance/Material Analyzer Technical Data
c
b
Option 002 Material Measurement
Figure 12-33. Typical Permeability Measurement Accuracy (r v.s. Frequency, @F* =10)
3 F = h ln
c
b
4291B RF Impedance/Material Analyzer Technical Data 12-37
Option 002 Material Measurement
Applicable MUT (Material Under Test) Size
: : : : : : : : : : : : : : : : : : : : : : : : : : : : : : : : : : : : : : : See Table 12-5 and Table 12-6
Maximum DC Bias Voltage / Current
@Using with 16453A : : : : : : : : : : : : : : : : : : : : : : : : : : : : : : : : : : : : : : : : 6 40 V
@Using with 16454A : : : : : : : : : : : : : : : : : : : : : : : : : : : : : : : : : : : : 6 500 mA
Operating Temperature
@Using with 16453A or 16454A : : : : : : : : : : : : : : : : : 055 C to +200 C
Operating Humidity
@ wet bulb temperature <40 C
@Using with 16453A or 16454A : : : : : : : : : : : : : : : : : : up to 95% RH
Table 12-5.
Applicable Dielectric Material Size Using with
16453A
t 3 mm
d 15 mm
Table 12-6.
Applicable Magnetic Material Size Using with 16454A
Fixture
Small
Large
Holder
A
B
C
D
c
8 mm 6 mm 20 mm 20 mm
b
3.1 mm 3.1 mm 6 mm 5 mm
h
3 mm
3 mm 10 mm 10 mm
12-38 4291B RF Impedance/Material Analyzer Technical Data
Material Measurement Accuracy with High Temperature Test Head
Option 002 Material Measurement Accuracy with Option 013 and 014
High Temperature Test Head (Typical)
Dielectric Material Measurement Accuracy with High Temperature Test Head
(Typical)
Conditions of Dielectric Material Measurement Accuracy with High
Temperature Test Head
Environment temperature is within 65 C of temperature at which calibration is
done, and within 0 C to 40 C.
High Temperature High Impedance Test Head must be used.
Bending cable should be smooth and the bending angle is less than 30 .
Cable position should be kept in the same position after calibration measurement.
OPEN/SHORT/50 calibration must be done. Calibration ON.
Measurement points are same as the calibration points.
Averaging (on point) factor must be larger than 32 at which calibration is done.
OSC level must be same as level at which calibration is done.
OSC level is less than or equal to 0.25 Vrms , or greater than 0.25 Vrms and
frequency range is within 1 MHz to 1 GHz.
Environment temperature of the main frame is within 65 C of temperature at
which calibration is done, and within 0 C to 40 C.
1"0
"r 0 Accuracy ( 0 rm ) Same as accuracy at which a normal test head
"rm
is used
Loss Tangent Accuracy of "_ r (1tan) Same as accuracy at which a
normal test head is used
At the following frequency points, instrument spurious characteristics could
occasionally cause measurement errors to exceed speci ed value because of
instrument spurious characteristics.
10.71 MHz
514.645 MHz
17.24 MHz
686.19333 MHz
21.42 MHz
1029.29 MHz
42.84 MHz
1327.38666 MHz
See \EMC" under \Others" in \General
Characteristics".
The excessive vibration and shock could
occasionally cause measurement errors to exceed
speci ed value.
4291B RF Impedance/Material Analyzer Technical Data 12-39
Material Measurement Accuracy with High Temperature Test Head
Typical E ects of Temperature Drift on Dielectric Material Measurement
Accuracy
When environment temperature is without 65 C of temperature at which
calibration is done, add the following measurement error.
1"0
"r 0 Accuracy ( 0 rm ) : : : : : : : : : : : : : : : : : : : : : : : : : : : : : E" + Ea3 + Eb3 [%]
"rm
+ Eb3)
Loss Tangent Accuracy of "_ r (1tan) : : : : : : : : : Etan " + (Ea3100
Where,
E" is "r 0 accuracy when a normal test head is used.
Etan" is loss tangent accuracy when a normal test head is
used.
Ea3 is the e ect of temperature drift on the accuracy as
follows:
Ea3 = Tc 1T
Eb3 is the hysterisis of the e ect of temperature drift on the
accuracy as follows:
Eb3 =
Tc 1T
3
where,
Tc is temperature coecient as follows:
Tc = K1 + K2 + K3
K1 = 1 2 1006 2 (50 + 300f )
0
K2 = 3 2 1006 2 (4 + 50f ) "rm
1
t j1 0 (f=f0 )2j
K3 = 5 2 1003 2 (0:2 + 8f 2 ) "0
rm
1
+ 10 f
1
t j1 0 (f=f0 )2j
+ 10 f
f : Measurement Frequency [GHz]
f0 = p130 [GHz]
"rm
t :Thickness of MUT [mm]
"0 rm :measured value of "0 r
The illustrations of temperature coecient Tc are shown in
Figure 12-34 to Figure 12-36.
1T is di erence of temperature between measurement
condition and calibration measurement condition as follows:
12-40 4291B RF Impedance/Material Analyzer Technical Data
Material Measurement Accuracy with High Temperature Test Head
1T = jTmeas
0 Tcal j
Tmeas : Temperature of Test Head at measurement
condition
Tcal : Temperature of Test Head at calibration
measurement condition
4291B RF Impedance/Material Analyzer Technical Data 12-41
Material Measurement Accuracy with High Temperature Test Head
Figure 12-34.
Typical Frequency Characteristics of Temperature Coecient of "r ' and Loss Tangent Accuracy
(Thickness=0.3 mm)
12-42 4291B RF Impedance/Material Analyzer Technical Data
Material Measurement Accuracy with High Temperature Test Head
Figure 12-35.
Typical Frequency Characteristics of Temperature Coecient of "r ' and Loss Tangent Accuracy
(Thickness=1 mm)
4291B RF Impedance/Material Analyzer Technical Data 12-43
Material Measurement Accuracy with High Temperature Test Head
Figure 12-36.
Typical Frequency Characteristics of Temperature Coecient of "r ' and Loss Tangent Accuracy
(Thickness=3 mm)
12-44 4291B RF Impedance/Material Analyzer Technical Data
Material Measurement Accuracy with High Temperature Test Head
Magnetic Material Measurement Accuracy with High Temperature Test Head
(Typical)
Conditions of Dielectric Material Measurement Accuracy with High
Temperature Test Head
Environment temperature is within 65 C of temperature at which calibration is
done, and within 0 C to 40 C.
High Temperature Low Impedance Test Head must be used.
Bending cable should be smooth and the bending angle is less than 30 .
Cable position should be kept in the same position after calibration measurement.
OPEN/SHORT/50 calibration must be done. Calibration ON.
Measurement points are same as the calibration points.
Averaging (on point) factor must be larger than 32 at which calibration is done.
OSC level must be same as level at which calibration is done.
OSC level is less than or equal to 0.25 Vrms , or greater than 0.25 Vrms and
frequency range is within 1 MHz to 1 GHz.
Environment temperature of the main frame is within 65 C of temperature at
which calibration is done, and within 0 C to 40 C.
10
r 0 Accuracy ( 0 rm ) : Same as accuracy at which a normal test head
rm
is used
Loss Tangent Accuracy of _ r (1tan) Same as accuracy at which a
normal test head is used
At the following frequency points, instrument spurious characteristics could
occasionally cause measurement errors to exceed speci ed value because of
instrument spurious characteristics.
10.71 MHz
514.645 MHz
17.24 MHz
686.19333 MHz
21.42 MHz
1029.29 MHz
42.84 MHz
1327.38666 MHz
See \EMC" under \Others" in \General
Characteristics".
The excessive vibration and shock could
occasionally cause measurement errors to exceed
speci ed value.
4291B RF Impedance/Material Analyzer Technical Data 12-45
Material Measurement Accuracy with High Temperature Test Head
Typical E ects of Temperature Drift on Magnetic Material Measurement
Accuracy
When environment temperature is without 65 C of temperature at which
calibration is done, add the following measurement error.
10
r 0Accuracy ( 0 rm ) : : : : : : : : : : : : : : : : : : : : : : : : : : : : : : : : : : E + Ea3 + Eb3
rm
+ Eb3)
Loss Tangent Accuracy of _ r (1tan) : : : : : : : : : Etan + (Ea3100
Where,
E is 0r accuracy at which a normal test head is used.
Etan is loss tangent accuracy at which a normal test head is
used.
Ea3 is the e ect of temperature drift on the accuracy as
follows:
Ea3 = Tc 1T
Eb3 is the hysterisis of the e ect of temperature drift on the
accuracy as follows:
Eb3 =
Tc 1T
3
where,
Tc is temperature coecient as follows:
Tc = K1 + K2 + K3
K1 = 1 2 1006 2 (50 + 300f )
0
gf 2 j
K2 = 1 2 1002 2 (1 + 10f 2 ) j1 0 0f:F01(fF0 (0rm1)0+1)20+g10
f
rm
fF (0rm 0 1) + 20gf
K3 = 2 2 1006 2 (1 + 30f )
j1 0 0:01fF (0rm 0 1) + 10gf 2 j
f : Measurement Frequency [GHz]
F = h ln cb [mm]
h is the height of MUT [mm]
b is the inner diameter of MUT
c is the outer diameter of MUT
rm 0 is the measured value of permeability
The illustrations of temperature coecient Tc are shown in
Figure 12-37 to Figure 12-39.
12-46 4291B RF Impedance/Material Analyzer Technical Data
Material Measurement Accuracy with High Temperature Test Head
1T is di erence of temperature between measurement
condition and calibration measurement condition as follows:
1T = jTmeas
0 Tcal j
Tmeas : Temperature of Test Head at measurement
condition
Tcal : Temperature of Test Head at calibration
measurement condition
4291B RF Impedance/Material Analyzer Technical Data 12-47
Material Measurement Accuracy with High Temperature Test Head
Figure 12-37.
Typical Frequency Characteristics of Temperature Coecient of r 0 and Loss Tangent Accuracy
(F* = 0.5)
12-48 4291B RF Impedance/Material Analyzer Technical Data
Material Measurement Accuracy with High Temperature Test Head
Figure 12-38.
Typical Frequency Characteristics of Temperature Coecient of r0 and Loss Tangent Accuracy
(F* = 3)
3 F = h ln
c
b
4291B RF Impedance/Material Analyzer Technical Data 12-49
Material Measurement Accuracy with High Temperature Test Head
Figure 12-39.
Typical Frequency Characteristics of Temperature Coecient of r 0 and Loss Tangent Accuracy
(F* = 10)
3 F = h ln
12-50 4291B RF Impedance/Material Analyzer Technical Data
c
b
Furnished Accessories
Furnished Accessories
Accessory
Operating Manual
Quick Start Guide
Programming Manual
Service Manual1
Program Disk Set
Power Cable2
50 Termination
0 Termination
0 S Termination
Low-Loss Capacitor
Calibration Kit Carrying Case
APC-7 End Cap
Fixture Stand3
Pad3
Temperature Coecient Measurement Program
Disk3
BNC Adapter4
mini-DIN Keyboard
HP Instrument BASIC Users Handbook
Handle Kit5
Rack Mount Kit6
Rack Mount and Handle Kit7
Agilent part number
04291-90020
04291-90021
04291-90027
04291-90111
04291-18000
04291-65006
04191-85300
04191-85302
04291-60042
04291-60041
16190-25011
04291-60121
04291-09001
04291-18001
1250-1859
C3757-60401
E2083-90005
5062-3991
5062-3979
5062-3985
1 Option 0BW only
2 The power cable depends on where the instrument is used, see Quick Start Guide
3 Option 013 and 014 only
4 Option 1D5 only
5 Option 1CN only
6 Option 1CM only
7 Option 1CP only
4291B RF Impedance/Material Analyzer Technical Data 12-51
A
Manual Changes
Introduction
This appendix contains the information required to adapt this manual
to earlier versions or con gurations of the analyzer than the current
printing date of this manual. The information in this manual applies
directly to the 4291B RF Impedance/Material Analyzer serial number
pre x listed on the title page of this manual.
Manual Changes
To adapt this manual to your 4291B, see Table A-1 and Table A-2, and
make all the manual changes listed opposite your instrument's serial
number and rmware version.
Instruments manufactured after the printing of this manual may be
di erent from those documented in this manual. Later instrument
versions will be documented in a manual changes supplement that
will accompany the manual shipped with that instrument. If your
instrument's serial number is not listed on the title page of this
manual or in Table A-1, it may be documented in a yellow MANUAL
CHANGES supplement.
In additions to change information, the supplement may contain
information for correcting errors (Errata) in the manual. To keep
this manual as current and accurate as possible, Agilent Technologies
recommends that you periodically request the latest MANUAL
CHANGES supplement.
For information concerning serial number pre xes not listed on the
title page or in the MANUAL CHANGE supplement, contact the
nearest Agilent Technologies oce.
Turn on the line switch or execute the *IDN? command by GPIB to
con rm the rmware version. See the Programming Manual manual
for information on the *IDN? command.
Table A-1. Manual Changes by Serial Number
Serial Pre x or Number
Make Manual Changes
Table A-2. Manual Changes by Firmware Version
Version
Make Manual Changes
Manual Changes A-1
Serial Number
Agilent Technologies uses a two-part, ten-character serial number that
is stamped on the serial number plate (see Figure A-1) attached to the
rear panel. The rst ve characters are the serial pre x and the last
ve digits are the sux.
Figure A-1. Serial Number Plate
A-2 Manual Changes
Input Range and Default Setting
B
When the 4Preset5 key is pressed or the analyzer is turned ON, the
analyzer is set to a known state. There are subtle di erences between
the preset state and the power-up state.
Some power-up states are recalled from non-volatile memory (battery
backup memory). If power to the non-volatile memory is lost,
the analyzer will have certain parameters set to factory settings.
Factory Setting lists the factory settings. The operating time of the
battery backup memory is approximately 72 hours. The battery is
automatically recharged while the instrument is ON. The recharge
time (time required to fully recharge the battery) is approximately 10
minutes.
When line power is cycled the analyzer performs a self-test routine.
Upon successful completion of the self-test routine, the instrument
state is set to the following preset conditions. The same conditions are
true following a \PRES" or \3RST" command via GPIB.
Input Range and Default Setting B-1
4Meas5 4FORMAT5
4Meas5
Function
Range
Preset Value
Active channel
Measurement Mode
Active channel, Dual channel
Measurement Parameter
j Zj
Ch1:Impedance meas. jZj, z , R, X, jYj, y , G, B, j0j, , 0x ,
0y , Cp , Cs , Lp , Ls , Rp , Rs , D, Q
z
Ch2:Impedance meas. jZj, z , R, X, jYj, y , G, B, j0j, , 0x ,
0y , Cp , Cs , Lp , Ls , Rp , Rs , D, Q
"0
Ch1:" meas. j"j, tan , "0 , "00 , jZj, z , R, X, jYj, y ,
G, B, j0j, , 0x , 0y , Cp , Cs , Lp , Ls ,
Rp, Rs , D, Q
"00
Ch2:" meas. j"j, tan , "0 , "00 , jZj, z , R, X, jYj, y ,
G, B, j0j, , 0x , 0y , Cp , Cs , Lp , Ls ,
Rp, Rs , D, Q
0 1
Ch1: meas. jj, tan , 0 , 00 , jZj, z , R, X, jYj,
y , G, B, j0j, , 0x , 0y , Cp , Cs , Lp ,
Ls , Rp , Rs , D, Q
00 1
Ch2: meas. jj, tan , 0 , 00 , jZj, z , R, X, jYj,
y , G, B, j0j, , 0x , 0y , Cp , Cs , Lp ,
Ls , Rp , Rs , D, Q
None or No e ect
Test Fixture
16191A, 16192A, 16193A, User,
(when either the
None, 16193A, 16194A
16193A or
16194A is
selected
User Fixture De nition
Label
No e ect
No e ect
Extension
010 meter to 10 meter
Thickness
0 to 3 mm
No e ect
Outer diameter
No e ect
Inner diameter
No e ect
Power ON
default
Factory
Setting
Active channel
j Zj
z
"0
"00
0 1
00 1
None
No e ect
No e ect
UNDEFINED
UNDEFINED
UNDEFINED
(empty)
0
Factory
Setting
1 After setting material size
4Format5
Function
Format
Expanded Phase
Phase Unit
X-axis Lin/Log
Y-axis Lin/Log
B-2 Input Range and Default Setting
Range
Preset Value
Power ON
default
Linear, Log, Polar, Smith, Admittance,
Complex
ON/OFF
Degree, Radian
Linear, Logarithm
Linear, Logarithm
Linear
Linear
OFF
Degree
Linear
Linear
OFF
Degree
Linear
Linear
4Display5
4Display5
Function
Dual Chan
Split Display
De ne Trace
Select memory trace
Data math
Gain
O set
AUX o set
Range
Preset Value
Power ON
default
ON/OFF
ON/OFF
Data, Memory, Data and Memory
1 to 16 (Total NOP of memory
traces80123)
Data, Data-Mem, Data+Mem,
Data/Mem
012106 to 12106
01002106 to 1002106
01002106 to 1002106
Circuit A, B, C, D, E, F
0121018 to 121018
0121018 to 121018
0121018 to 121018
0121018 to 121018
ON/OFF
ON
OFF
Data
1
ON
OFF
Data
1
Data
Data
1
0
0
A
0
0
0
0
OFF
null string
null string
+10
+30
No e ect
OFF
All Instrument
1
0
0
A
0
0
0
0
OFF
null string
null string
No e ect
OFF
All Instrument
No e ect
No e ect
ON
OFF
USER TRACE
(1-4)
(null string)
83 %
0
ON
OFF
USER TRACE
(1-4)
(null string)
Equivalent Circuit
Equivalent Parameter R1
Equivalent Parameter L1
Equivalent Parameter C0
Equivalent Parameter C1
Disp EQV param
Title
Text
Max 20 Labels
X position
0 to 609
Y position
0 to 421
Graphic/Memory trace Selection
Graphic, Memory trace
Frequency Blank
ON
Display Allocation
All instrument, Half/Half, All BASIC,
BASIC status
Intensity
0 to 100 %
Background Intensity
0 to 100 %
Backlight
ON/OFF
User trace
ON/OFF
User trace headline
Maximum 12 characters
User trace footnote
Maximum 34 characters
Factory
Setting
Graphics
ON
Input Range and Default Setting B-3
4Scale
Ref5
4Scale Ref5
Function
Range
Preset Value
Power ON
default
Scale Coupling
Reference Position
Scale top value (linear scale)
jZj, R, Rp, Rs , X
jYj, G, B
j 0j , 0x
0y
Cp , Cs
Lp , Ls
Coupling, Uncoupling
0 to 10
Coupling
5
Coupling
5
012109 to 12109
012109 to 12109
012109 to 12109
012109 to 12109
012109 to 12109
012109 to 12109
012109 to 12109
012109 to 12109
012109 to 12109
1M
1S
1
1
1 mF
10 H
180
1
1k
1M
1S
1
1
1 mF
10 H
180
1
1k
05002106 to 5002106
05002106 to 5002106
05002106 to 5002106
05002106 to 5002106
05002106 to 5002106
05002106 to 5002106
05002106 to 5002106
05002106 to 5002106
0
0S
01
0F
0H
0180
0
0
0
0S
01
0F
0H
0180
0
0
1210015
1210015
1210015
1210015
1210015
1210015
1210015
1210015
100 k
100 ms
0.2
100 F
1H
36
0.1
100
100 k
100 ms
0.2
100 F
1H
36
0.1
100
D
Q
Scale bottom value (linear scale)
jZj, R, Rp, Rs , X
jYj, G, B
j 0j , 0x , 0y
Cp , Cs
Lp , Ls
D
Q
Scale/Div
jZj, R, Rp, Rs , X
jYj, G, B
j 0j , 0x , 0y
Cp , Cs
Lp , Ls
D
Q
B-4 Input Range and Default Setting
to 1002106
to 1002106
to 1002106
to 1002106
to 1002106
to 1002106
to 1002106
to 1002106
Factory
Setting
4Scale
Function
Reference value
jZj, R, Rp , Rs , X
jYj, G, B
j 0j , 0x , 0y
Cp , Cs
Lp , Ls
D
Q
Scale top value (logarithm scale)
jZj, R, Rp , Rs , X
jYj, G, B
j 0j , 0x , 0y
Cp , Cs
Lp , Ls
D
Q
Scale bottom value (logarithm scale)
jZj, R, Rp , Rs , X
jYj, G, B
j 0j , 0x , 0y
Cp , Cs
Lp , Ls
D
Q
Reference X Value
Reference Y Value
Scale for
Data & Memory Scale
X-axis unit
Y-axis unit
X-axis left value
X-axis right value
Y-axis top value
Y-axis bottom value
X/Y-axis couple
Range
Preset Value
Power ON
default
05002106 to 5002106
05002106 to 5002106
05002106 to 5002106
05002106 to 5002106
05002106 to 5002106
05002106 to 5002106
05002106 to 5002106
05002106 to 5002106
500 k
500 ms
0
500 F
5H
0
0.5
500
500 k
500 ms
0
500 F
5H
0
0.5
500
012109 to 12109
012109 to 12109
012109 to 12109
012109 to 12109
012109 to 12109
012109 to 12109
012109 to 12109
012109 to 12109
1M
1S
1
1 mF
10 H
200
1
1k
1M
1S
1
1 mF
10 H
200
1
1k
05002106 to 5002106
05002106 to 5002106
05002106 to 5002106
05002106 to 5002106
05002106 to 5002106
05002106 to 5002106
05002106 to 5002106
05002106 to 5002106
05002106 to 5002106
05002106 to 5002106
1
1 s
12106
1 nF
10 pH
10 1
1
0
0
Data
Couple
U
U
12106
1.82109
100
0
ON
1
1 s
12106
1 nF
10 pH
10 1
1
0
0
Data
Couple
U
U
12106
1.82109
100
0
ON
Data, Memory 1 to 16
Couple/Uncouple
Maximum 4 characters
Maximum 4 characters
082109 to 82109
082109 to 82109
0121012 to 121012
0121012 to 121012
ON,OFF
Ref5
Factory
Setting
Input Range and Default Setting B-5
4Bw/Avg5 4Cal5
4Bw/Avg5
Function
Range
Preset Value
Power ON
default
Sweep Averaging
Sweep Averaging Factor
Point Averaging
Point Averaging Factor
ON/OFF
1 to 999
ON/OFF
1 to 999
OFF
16
OFF
1
OFF
16
OFF
1
Function
Range
Preset Value
Power ON
default
Fixture Compen - OPEN
Fixture Compen - SHORT
Fixture Compen - LOAD
Cal Kit
Standard Value - OPEN G
Standard Value - OPEN C
Standard Value - SHORT R
Standard Value - SHORT L
Standard Value - LOAD R
Standard Value - LOAD X
Compen Kit
Compen Std. Value - OPEN G
Compen Std Value - OPEN C
Compen Std. Value - SHORT R
Compen Std. Value - SHORT L
Compen Std. Value - LOAD R
Compen Std Value - LOAD X
Compen standard Label
Port extension
Port Extension value
ON/OFF
ON/OFF
ON/OFF
7 mm, User kit
012106 to 12106
0121009 to 121009
012106 to 12106
012106 to 12106
012106 to 12106
012106 to 12106
OFF
OFF
OFF
7 mm
0
82 fF
0
0
50
0
OFF
OFF
OFF
7 mm
0
82 fF
0
0
50
0
012106 to 12106
0121009 to 121009
012106 to 12106
012106 to 12106
012106 to 12106
012106 to 12106
No e ect1
No e ect1
No e ect1
No e ect1
No e ect1
No e ect1
No e ect1
OFF
0s
No e ect1
No e ect1
No e ect1
No e ect1
No e ect1
No e ect1
No e ect1
OFF
0s
Factory
Setting
4Cal5
FFFFFFFFFFFFFFFFFFFFFFFFFFFFFFFFFFFFFFF
1 When SAVE COMPEN KIT is executed.
B-6 Input Range and Default Setting
ON/OFF
010 to 10
Factory
Setting
0
0
0
0
50
0
user
4Bw/Avg5 4Cal5
4Cal5
(" )
Function
Material size - Thickness
LOAD "r 0
LOAD "r 00
LOAD Thickness
4Cal5
Range
Preset Value
Power ON
default
1 m to 4.8 mm
012106 to 12106
012106 to 12106
0 to 12106 m
invalid
not e ect
not e ect
not e ect
invalid
not e ect
not e ect
not e ect
Range
Preset Value
Power ON
default
3.04 mm to 9 mm
3.04 mm to 9 mm
0.01 mm to 3.65 mm
invalid
invalid
invalid
invalid
invalid
invalid
3 mm to 21 mm
3 mm to 21 mm
0.01 mm to 11.6 mm
invalid
invalid
invalid
invalid
invalid
invalid
Factory
Setting
2.1
0
80021006
m
()
Function
Material size for 16454A small
Inner diameter
Outer Diameter
Height
Material size for 16454A large
Inner diameter
Outer Diameter
Height
Factory
Setting
Input Range and Default Setting B-7
4Sweep5 4Source5 4Trigger5
4Sweep5
Function
Delay time
Trigger delay time
Number of points
Coupled channel
Sweep source
Sweep type
List table
List segment
Sweep direction
Range
Preset Value
Power ON
default
0 to 3600 s
0 to 3600 s
2 to 801
ON/OFF
Freq., OSC level, DC-V, DC-I
Linear, Log, List
0 t o15
UP/DOWN
0 ms
0 ms
201
ON
Frequency
Linear
(empty)
0
UP
0 ms
0 ms
201
ON
Frequency
Linear
(empty)
0
UP
Range
Preset Value
Power ON
default
0.2 mV to 1 V
Voltage, dBm, Ampere
1 MHz to 1.8 GHz
ON/OFF
040 V to +40 V
0100 mA to 100 mA
1 V to 40 V
2 mA to 100 mA
I-constant/V-constant
0.5 V
Volt
500 MHz
OFF
0V
0A
1V
2 mA
V-constant
0.5 V
Volt
500 MHz
OFF
0V
0A
1V
2 mA
V-constant
Range
Preset Value
Power ON
default
Hold, Single, Number of group,
Continuous
1 to 999
Free run, External, GPIB, Manual
ON SWEEP/ON POINT
Positive, Negative
Continuous
Continuous
{
Free run
On Sweep
Positive
{
Free run
On Sweep
Positive
Factory
Setting
4Source5
Function
Osc level
Osc level unit
CW Frequency
DC BIAS
Voltage
Current
Voltage limit
Current limit
DC BIAS source
Factory
Setting
4Trigger5
Function
Sweep
Number of Groups
Trigger
Trigger event
Trigger polarity
B-8 Input Range and Default Setting
Factory
Setting
,
,
,
4Start5 4Stop5 4Center5 4Span5 4Marker5
,
,
,
4Start5 4Stop5 4Center5 4Span5
Function
Range
Preset Value
Power ON
default
Frequency
Osc level
DC-V
DC-I
1 MHz to 1.8 GHz
200V to 1 V
040 V to 40 V
0100 mA to 100 mA
1 MHz
200 V
0V
0A
1 MHz
200 V
0V
0A
Frequency
Osc level
DC-V
DC-I
1 MHz to 1.8 GHz
200V to 1 V
040 V to 40 V
0100 mA to 100 mA
1.8 GHz
1V
0V
0A
1.8 GHz
1V
0V
0A
Frequency
Osc level
DC-V
DC-I
1 MHz to 1.8 GHz
200V to 1 V
040 V to 40 V
0100 mA to 100 mA
900.5 MHz
500.1 mV
0V
0A
900.5 MHz
500.1 mV
0V
0A
Frequency
Osc level
DC-V
DC-I
0 to 1.799 GHz
0 to 999.8 mV
0 to 80 V
0 to 200 mA
1.799 GHz
999.8 mV
0V
0A
1.799 GHz
999.8 mV
0V
0A
Range
Preset Value
Power ON
default
Data, Memory 1 to 16,
User trace 1 to 4
Coupling/Uncoupling
Continuous/Discontinuous
ON/OFF
START to STOP
012109 to 12109
012109 to 12109
Data
Data
Coupling
Continuous
OFF
0
0
0
Coupling
Continuous
OFF
0
0
0
Factory
Setting
Start
Stop
Center
Span
4Marker5
Function
Trace using markers
Marker coupling
Marker cont/discont
1marker mode
Fixed 1marker stimulus value
Fixed 1marker value
Fixed 1marker AUX value
Factory
Setting
Input Range and Default Setting B-9
4Marker
!5 4Search5 4Utility5
!
4Marker
5
Function
Zooming aperture
Cross channel
Range
Preset Value
Power ON
default
0 to 100 %
ON/OFF
10 % of span
OFF
10 % of span
OFF
Range
Preset Value
Power ON
default
ON/OFF
p
p
Fixed, MKRVAL/( 2), MKRVAL*( 2),
MKRVAL/2
01002106 to 1002106
ON/OFF
01002106 to 1002106
Positive, Negative
OFF
Fixed
OFF
Fixed
03
03
Positive
Positive
0 to 82109
0 to 8
0 to 80
0 to 0.8
0 to 1002106
ON/OFF
ON/OFF
01002107 to 1002107
10 MHz
8
80
0.8
1
OFF
OFF
03
10 MHz
8
80
0.8
1
OFF
OFF
03
Range
Preset Value
Power ON
default
ON/OFF
ON/OFF
Stimulus, Time, 1/2f
Real-imaginary, Lin magnitude-phase,
Log magnitude-phase, R+jX, G+jB
OFF
OFF
Stimulus
Real-imaginary
OFF
OFF
Stimulus
Real-imaginary
Factory
Setting
4Search5
Function
Width
Width value
Fixed width value
Threshold
Threshold value
Peak polarity
Peak de nition 1x
Frequency
OSC level
DC-V
DC-I
Peak de nition 1y
Search tracking
Partial search
Target value
OFF
0100
Factory
Setting
OFF
0100
4Utility5
Function
Marker list
Statistics
Marker sweep parameter unit
Smith/polar marker
B-10 Input Range and Default Setting
Factory
Setting
4System5
4System5
Function
Logging
Memory partition
Clock time
Clock date
Date mode
Beep done
Beep warning
Limit line
Limit test
Limit beep
Limit segment
Upper limit
Lower limit
Delta limit
Middle value
Stimulus o set
Frequency
OSC level
DC-V
DC-I
Limit line amplitude o set
Range
Preset Value
Power ON
default
ON/OFF
64kRAM-448kBASIC,
128kRAM-334kBASIC,
256kRAM-256kBASIC,
334kRAM-128kBASIC,
448kRAM-64kBASIC
0:00:00 to 23:59:59
3/1/1900 to 12/31/2099
MonDayYear/DayMonYear
ON/OFF
ON/OFF
ON/OFF
ON/OFF
OFF, Path, Fail
1 to 18
012109 to 12109
012109 to 12109
012109 to 12109
012109 to 12109
No e ect
No e ect
No e ect
No e ect
No e ect
No e ect
MonDayYear
ON
OFF
OFF
OFF
OFF
No e ect
No e ect
MonDayYear
ON
OFF
OFF
OFF
OFF
0
0
0
0
0
0
0
0
01.8 GHz to 1.8 GHz
01 to 1 V
040 to 40 V
010021003 to 10021003 A
012109 to 12109
0
0
0
0
0
0
0
0
0
0
Factory
Setting
128kRAM334kBASIC
0:00:00
Input Range and Default Setting B-11
4Local5
Function
GPIB controller mode
Address: 4291
Address: controller
Range
Preset Value
Power ON
default
Factory
Setting
System controller/addressable
0 to 30
0 to 30
No e ect
No e ect
No e ect
No e ect
No e ect
No e ect
addressable
17
21
Range
Preset Value
Power ON
default
Factory
Setting
Standard/Color
ON/OFF
Fixed/Variable
ON/OFF
75 to 600
0 to 5
0 to 5
ON/OFF
Portrait,Landscape
Upper&Lower/Middle&Delt
Start&Stop/Center&Span
Standard
OFF
Fixed
OFF
75
1.0
1.0
ON
Portrait
Upper&Lower
Start&Stop
Standard
OFF
Fixed
OFF
75
1.0
1.0
ON
Portrait
Upper&Lower
Start&Stop
Range
Preset Value
Power ON
default
Factory
Setting
Raw, Cal, Data, Memory, Data trace,
Memory trace
Disk/Memory
LIF/DOS
Data trace,
Memory trace
No e ect
No e ect
Data trace,
Memory trace
No e ect
No e ect
Disk
LIF
4Copy5
Function
Print mode
Copy time
Print color
Print softkey
Print resolution
Print margin (Left)
Print margin (Top)
Formfeed
Orientation
Limit table display mode
List table display mode
OFF
75
1.0
1.0
ON
Portrait
4Save5
Function
Save data de nition
Store device
Initialize disk format
B-12 Input Range and Default Setting
Option 013, 014 Temperature Coecient
Measurement
C
Introduction
Agilent Technologies provides a high temperature test head and a high
temperature xture to achieve an ecient and highly reliable method
for evaluating temperature characteristics.
The other features are as follows:
High Temperature Test Head that can be used within the range of
055 C to 200 C, maintaining high accuracy.
High Temperature Test Fixture that simplify DUT connection.
Espec Temperature Chamber SU-241 is designed to integrated easily
with 4291B.
GPIB as standard
Measuring Port eliminating the needs to create additional
measurement cables access hole.
Warning
The high temperature test head, 16194A, 16453A, and 16454A
has the capability for 055 C to 200 C temperature measurement
in environmental testing. Use globes to prevent scalding when
handling heated parts.
Option 013, 014 Temperature Coecient Measurement C-1
Temperature Coecient Measurement
Setup and Installation Guide
This section provides the information necessary to set up your
analyzer and temperature chamber.
Required Equipment
Equipment Setup
To perform all the steps in this quick start, the following equipment is
required:
4291B RF Impedance/Material Analyzer
mini-DIN Keyboard
Test Head
High Temperature High-impedance Test Head (option 013), or
High Temperature Low-impedance Test Head (option 014)
Fixture Stand (Agilent PN 04291-60121, included with option 013 or
014)
Pad (Agilent PN 04291-09001, included with option 013 or 014)
Calibration Kit (included with 4291B)
Test Fixture
16194A High Temperature SMD Fixture, or
16453A Dielectric Material Test Fixture, or
16454A Magnetic Material Test Fixture
Chamber (Espec Chamber SU-241)
Blank Diskette (2HD is recommended, Agilent PN 9164-0299)
Figure C-1 shows the equipment setup.
Figure C-1. Equipment Setup
C-2 Option 013, 014 Temperature Coecient Measurement
Temperature Coecient Measurement
Figure C-2 shows the test head and test stand setup.
Figure C-2. Test Head and Test Stand Setup
1
2
3
4
5
6
7
8
High Temperature Test Head
Fixture Stand
Specimen Temperature Sensor
Chamber Temperature Sensor
Test Station
Test Station Stand
Pad
Temperature Chamber
Option 013, 014 Temperature Coecient Measurement C-3
Temperature Coecient Measurement
Quick Start
Calibration
When the temperature/humidity becomes the reference values,
perform calibration at the high temperature test head APC-7 R
connector. This calibration procedure is the same as the one for the
impedance/dielectric/magnetic measurements. The USER DEFINED
calibration is required when the high temperature test head is
connected. The analyzer is set to the USER DEFINED calibration
automatically.
Setting the Test Fixture
The test xture should be set on the test head after calibration. The
setup for the 16194A is shown in Figure C-3.
Figure C-3. 16194A Connection
Select your test xture model number using the 4Meas5 hardkey.
Fixture Compensation
How to perform xture compensation for the 16194A is shown
below. For a basic measurement, the Open and Short compensations
are required. However, if you use both the 16194A and the High
Temperature Test Head for High Impedance, or the measurement
frequency is above 500 MHz, the Load compensation is also required.
The procedures for the 16453A and 16454A are shown in the
applicable Fixture Compensation section in each quick start.
C-4 Option 013, 014 Temperature Coecient Measurement
Short Compensation
Temperature Coecient Measurement
1. Loosen the two knobs.
2. Adjust the stage and the pressure arm to t your
shorting device.
3. Move the pressure arm to the outside.
4. Tighten the two knobs.
5. Place the shorting device so that it contacts both
electrodes.
6. Release the pressure arm so that the shorting
device is held by the pressure arm.
Option 013, 014 Temperature Coecient Measurement C-5
Temperature Coecient Measurement
Note
When it is dicult to connect the device to the test xture that is in
the chamber, remove the test xture from the test xture stand. Then
connect the device outside the chamber and set the xture on the test
xture stand again.
When the test xture is ready for the SHORT compensation sequence,
press the following front panel keys:
1. Press 4Cal5 FIXTURE COMPEN COMPEN MENU .
NNNNNNNNNNNNNNNNNNNNNNNNNNNNNNNNNNNNNNNNNNNN NNNNNNNNNNNNNNNNNNNNNNNNNNNNNNNNNNN
2. Press SHORT .
After the SHORT compensation sequence is done, the SHORT
softkey label is underlined.
NNNNNNNNNNNNNNNNN
NNNNNNNNNNNNNNNNN
Open Compensation
1. Remove the shorting device.
2. Adjust the stage and the pressure arm to t your
DUT.
3. Move the pressure arm to the outside.
4. Turn the latch knob and insert it into the hole so
that the pressure is locked.
When the test xture is ready for the Open compensation sequence,
perform the following procedure:
C-6 Option 013, 014 Temperature Coecient Measurement
Temperature Coecient Measurement
1. Press OPEN .
After the OPEN compensation sequence is done, the OPEN softkey
label is underlined.
2. Press DONE: COMPEN if you do not intend to perform the Load
compensation.
If you use both the 16194A and High Temperature Test Head for High
Impedance, or the measurement frequency is above 500 MHz, the
Load compensation is required.
NNNNNNNNNNNNNN
NNNNNNNNNNNNNN
NNNNNNNNNNNNNNNNNNNNNNNNNNNNNNNNNNNNNN
Load Compensation
Connect the Load to the 16194A just as you connected the shorting
device in the Short compensation. The Load device is included with
16194A.
When the test xture is ready for the Load compensation sequence,
perform the following procedure:
1. Press LOAD .
After the Load compensation sequence is done, the LOAD softkey
label is underlined.
2. Press DONE: COMPEN .
NNNNNNNNNNNNNN
NNNNNNNNNNNNNN
NNNNNNNNNNNNNNNNNNNNNNNNNNNNNNNNNNNNNN
Note
When your DUT is leaded type, the compensation procedure is as
follows:
1. Perform the Short Compensation using the biggest shorting device
(Agilent P/N 16191-29004).
2. Perform the Load Compensation using the furnished load device.
3. Replace the pressure arm pin for SMD with one for a leaded
component.
4. Adjust the stage to t your DUT.
5. Perform the Open Compensation.
Option 013, 014 Temperature Coecient Measurement C-7
Temperature Coecient Measurement
If you use both the 16194A and High Temperature Test Head for Low
Impedance, and the measurement frequency is below 500 MHz, the
Load compensation is not required.
Saving Status File
After performing calibration/ xture compensation at your required
settings, save the settings with the calibration/ xture compensation
data to the status le. In this example, setup A is saved using the
name \ZTF".
1. Insert the data diskette (DOS formatted) into the oppy disk drive
slot.
2. Press 4Save5 STATE .
NNNNNNNNNNNNNNNNN
3. Enter the le name "ZTF" and press 4Return5.
4. The message of "SAVING "ZTF.STA" TO DISK" is displayed. The
analyzer saves a status le with a \.STA" extension.
C-8 Option 013, 014 Temperature Coecient Measurement
Error Messages
This section lists the error messages that are displayed on the analyzer
display or transmitted by the instrument over GPIB. Each error
message is accompanied by an explanation, and suggestions are
provided to help in solving the problem. Where applicable, references
are provided to the related chapter of the appropriate manual. The
messages are listed in alphabetical order.
In the explanation of many error commands, section numbers of
the IEEE standard 488.2 are included. Refer to them for further
information about an error with these IEEE section numbers.
222
1st LO OSC TEST FAILED
An \internal test 9: A4A1 1ST LO OSC" fails. The 1st LO OSC ( rst
local oscillator) on the A4A1 1st LO does not work properly. See the
Service Manual for troubleshooting.
223
2nd LO OSC TEST FAILED
An \internal test 10: A3A2 2ND LO" fails. The 2nd LO OSC (second
local oscillator) on the A3A2 2nd LO does not work properly. See the
Service Manual for troubleshooting.
225
3rd LO OSC TEST FAILED
An \internal test 12: A6 3RD LO OSC" fails. The 3rd LO OSC (third
local oscillator) on the A6 receiver IF does not work properly. See the
Service Manual for troubleshooting.
224
A3 DIVIDER OUTPUT FREQUENCY OUT OF SPEC
An \internal test 11: A3A1 DIVIDER" fails. The output frequency
of the divider circuit on the A3A1 ALC is out of its limits. See the
Service Manual for troubleshooting.
243
A6 GAIN TEST FAILED
An \external test 23: A6 GAIN" fails. See the Service Manual for
troubleshooting.
244
A6 VI NORMALIZER TEST FAILED
An \external test 24: A6 VI NORMALIZER" fails. See the Service
Manual for troubleshooting.
Messages-1
Temperature Coecient Measurement
6
ADDITIONAL STANDARDS NEEDED
Error-correction coecients cannot be computed until all the
necessary standards have been measured. Execute all OPEN ,
SHORT , LOAD calibration (SENSe:CORRection1:COLLect[:ACQuire]
{STAN1|STAN2|STAN3} ) before press DONE: CAL
(SENSe:CORRection1:COLLect:SAVE).
NNNNNNNNNNNNNN
NNNNNNNNNNNNNNNNN
NNNNNNNNNNNNNN
NNNNNNNNNNNNNNNNNNNNNNNNNNNNN
132
BACKUP DATA LOST
Data checksum error on the battery backup memory has occurred.
The battery is recharged for approximately 10 minutes after power
was turned on.
-160
Block data error
This error, as well as errors 0161 and 0168, are generated when
analyzing the syntax of a block data element. This particular error
message is used if the analyzer cannot detect a more speci c error.
-168
Block data not allowed
A legal block data element was encountered but was not allowed by
the analyzer at this point in parsing.
240
CABLE ISOL'N TEST FAILED
An \external test 27: " fails. See the Service Manual for
troubleshooting.
10
CALIBRATION ABORTED
The calibration in progress was terminated due to a change of the
stimulus parameter or calibration measurement points. For example,
NNNNNNNNNNNNNNNNNNNNNNNNNNNNNNNNNNNNNNNNNNNNNNNNNNNNN
NNNNNNNNNNNNNNNNNNNNNNNNNNNNNNNNNNNNNNNNNNNNNNNNNN
Changing CAL POINT [FIXED] between CAL POINT [USER]
(SENSe:CORRection1:COLLect:FPOints {FIXed|USER}).
7
CALIBRATION REQUIRED
No valid calibration coecients were found when you attempted to
perform xture compensation. See Users Guide for information on
how to perform calibration.
31
CAN'T CALCULATE EQUIVALENT PARAMETERS
Data is not match to the equivalent circuit and cannot calculate the
parameters.
120
CAN'T CHANGE IN LIST SWEEP
When list sweep is selected, the following parameters are not allowed
to be changed:
Stimulus center, span, start, stop
Number of Point
OSC level
Messages-2
Temperature Coecient Measurement
Modify the list table to change these parameters in the list sweep.
93
CAN'T CHANGE WHILE DUAL CHAN OFF
The cross channel (CALCulate:EVALuate:EFFect:ON 1) cannot be
turned on when dual channel is o . Turn on the dual channel before
the cross channel is turned on.
74
CAN'T CHANGE- ANOTHER CONTROLLER ON BUS
The analyzer cannot assume the mode of system controller until the
system controller is removed from the bus or relinquishes the bus.
16
CAN'T CHANGE-HIGH TEMP TEST HEAD CONNECTED
NNNNNNNNNNNNNNNNNNNNNNNNNNNNNNNNNNNNNNNNNNNNNNNNNNNNNNNNNNN
You cannot execute CAL POINTS [FIXED]
(SENSe:CORRection1:COLLect:FPOints FIXed) or
COMP POINT [FIXED] (SENSe:CORRection2:COLLect:FPOints
FIXed) when the high temperature test head is connected.
NNNNNNNNNNNNNNNNNNNNNNNNNNNNNNNNNNNNNNNNNNNNNNNNNNNNNNNNNNN
108
CAN'T SAVE GRAPHICS WHEN COPY IN PROGRESS
If you attempt to save graphics when a print is in progress, this error
message is displayed. Wait until print is complete, then save graphics
again.
-281
Cannot create program
An attempt to create a program was unsuccessful. A reason for the
failure might include not enough memory.
-140
Character data error
This error, as well as errors 0141 through 0148, are generated when
analyzing the syntax of a character data element. This particular
error message is used if the analyzer cannot detect a more speci c
error.
-148
Character data not allowed
A legal character data element was encountered where prohibited by
the analyzer.
-144
Character data too long
The character data element contains more than twelve characters (see
IEEE 488.2, 7.7.1.4).
-100
Command error
This is a generic syntax error that the analyzer cannot detect more
speci c errors. This code indicates only that a command error, as
de ned in IEEE 488.2, 11.5.1.1.4, has occurred.
Messages-3
Temperature Coecient Measurement
-110
Command header error
An error was detected in the header. This error message is used when
the analyzer cannot detect the more speci c errors described for
errors 0111 through 0119.
67
COMMAND IGNORED - SEGMENT NOT DONE YET
(GPIB only) The GPIB command the analyzer received
is ignored, because the segment is editing . Send
CALCulate:LIMit:SEGMemt:SAVE (limit segment done) or
SENSe:LIST:SEGMent:SAVE (segment done) to terminate editing
segment.
13
COMPENSATION ABORTED
The compensation in progress was terminated due to a change of the
stimulus parameter or calibration measurement points. For example,
NNNNNNNNNNNNNNNNNNNNNNNNNNNNNNNNNNNNNNNNNNNNNNNNNNNNNNNN
NNNNNNNNNNNNNNNNNNNNNNNNNNNNNNNNNNNNNNNNNNNNNNNNNNNNN
Changing COMP POINT [FIXED] between COMP POINT [USER]
(SENSe:CORRection2:COLLect:FPOints {FIXed|USER}) before
pressing DONE: COMPEN (SENSe:CORRection2:COLLect:SAVE).
NNNNNNNNNNNNNNNNNNNNNNNNNNNNNNNNNNNNNN
11
COMPENSATION REQUIRED
No valid xture compensation coecients were found
when you attempted to turn xture compensation
ON ( OPEN ON off |SENSe:CORRection2:OPEN ON,
SHORT ON off |SENSe:CORRection2:SHORt ON, LOAD ON off |
SENSe:CORRection2:LOAD ON). See Users Guide for information on
how to perform compensation.
NNNNNNNNNNNNNNNNNNNNNNNNNNNNNNNNNNN
NNNNNNNNNNNNNNNNNNNNNNNNNNNNNNNNNNNNNN
15
NNNNNNNNNNNNNNNNNNNNNNNNNNNNNNNNNNN
COMPENSATION STD LIST UNDEFINED
(GPIB only) You cannot execute
SENSe:CORRection2:CKIT[1]:STANdard{1-3}[:SELect]
LIST when the xture compensation standard array is not de ned.
190
CORR. CONST. DATA LOST; DEFAULT DATA IS USED
This message is displayed when the correction constants EEPROM
data is lost and turned on in the service mode. See the Service
Manual for troubleshooting.
190
CORR. CONST. DATA LOST; DEFAULT DATA IS USED
This message is displayed when the correction constants EEPROM
data is lost and turned on in the service mode. See the Service
Manual for troubleshooting.
212
CPU BACKUP SRAM R/W ERROR
An \internal test 2: A1 VOLATILE MEMORY" fails. The A1 CPU's
BACKUP SRAM does not work properly. Replace the A1 CPU with a
new one. See the Service Manual for troubleshooting.
Messages-4
Temperature Coecient Measurement
211
CPU INTERNAL SRAM R/W ERROR
An \internal test 2: A1 VOLATILE MEMORY" fails. The A1 CPU's
internal SRAM does not work properly. Replace the A1 CPU with a
new one. See the Service Manual for troubleshooting.
66
CURRENT EDITING SEGMENT SCRATCHED
The current editing the table of list sweep or the limit line is
scratched. It is occur when the operation other than editing the table
is executed before terminate editing the table (SENSe:LIST:SAVE, or
CALCulate:LIMit:SAVE )
-230
Data corrupt or stale
Possibly invalid data. New reading started but not completed since
last access.
-225
Data out of memory
The analyzer has insucient memory to perform the requested
operation.
-222
Data out of range
A legal program data element was parsed but could not be executed
because the interpreted value was outside the legal range as de ned
by the analyzer (see IEEE 488.2, 11.5.1.1.5).
-231
Data questionable
Measurement accuracy is suspect.
-104
Data type error
The parser recognized an unallowed data element. For example,
numeric or string data was expected but block data was encountered.
127
DC BIAS OVERLOAD
Hardware failure. Do not input external DC BIAS. If this message
keeps on being displayed, contact your nearest Agilent Technologies
service oce.
229
DC BIAS TEST FAILED
An \internal test 16: DC BIAS" fails. See the Service Manual for
troubleshooting.
210
DIN CHIP TEST FAILED
An \internal test 1: A1 CPU" fails. The A1 CPU's DIN control chip
does not work properly. Replace the A1 CPU with a new one. See the
Service Manual for troubleshooting.
Messages-5
Temperature Coecient Measurement
204
DSP CHIP TEST FAILED
An \internal test 1: A1 CPU" fails. The A1 CPU's DSP (Digital Signal
Processor) does not work properly. Replace the A1 CPU with a new
one. See the Service Manual for troubleshooting.
213
DSP SRAM R/W ERROR
An \internal test 2: A1 VOLATILE MEMORY" fails. The DSP's SRAM
on the A1 CPU does not work properly. Replace the A1 CPU with a
new one. See the Service Manual for troubleshooting.
214
DUAL PORT SRAM R/W ERROR
An \internal test 2: A1 VOLATILE MEMORY" fails. The DSP's dual
port SRAM on the A1 CPU does not work properly. Replace the A1
CPU with a new one. See the Service Manual for troubleshooting.
111
DUPLICATE FILE EXTENSION
NNNNNNNNNNNNNNNNNNNNNNNNNNNNNNNNNNNNNNNNNNNN
NNNNNNNNNNNNNNNNNNNNNNNNNNNNNNNNNNNNNNNNNNNNNNNNNN
The extension name ( GRAPHICs [ ] or ASCII DATA [ ] |
MMEMory:FNAMe:EXTension{1|2} ) is already used for other le types.
Use other extension name.
203
EEPROM CHECK SUM ERROR
An \internal test 1: A1 CPU" fails. The data (Correction Constants
and so on) stored in the A1 CPU's EEPROM are invalid. See the
Service Manual for troubleshooting.
199
EEPROM WRITE ERROR
Data cannot be stored properly into the EEPROM on the A1 CPU,
when performing the display background adjustment or updating
correction constants in the EEPROM using the adjustment program.
See the Service Manual for troubleshooting.
-200
Execution error
This is the generic syntax error that the analyzer cannot detect more
speci c errors. This code indicates only that an execution error as
de ned in IEEE 488.2, 11.5.1.1.5 has occurred.
-123
Exponent too large
The magnitude of the exponent was larger than 32000 (see IEEE
488.2, 7.7.2.4.1).
205
F-BUS TIMER CHIP TEST FAILED
An \internal test 1: A1 CPU" fails. The A1 CPU's F-BUS (Frequency
Bus) timer does not work properly. Replace the A1 CPU with a new
one. See the Service Manual for troubleshooting.
Messages-6
Temperature Coecient Measurement
218
FAILURE FOUND FROM A/D MUX TO A/D CONVERTER
An \internal test 5: A6 A/D CONVERTER" fails. A trouble is found on
the signal path from the A/D multiplexer to A/D converter on the A6
receiver IF. See the Service Manual for troubleshooting.
217
FAN POWER OUT OF SPEC
An \internal test 4: A2 POST REGULATOR" fails. The voltage of the
fan power supply at the DC bus node 11 is out of its limits. See the
Service Manual for troubleshooting.
208
FDC CHIP TEST FAILED
An \internal test 1: A1 CPU" fails. The A1 CPU's FDC (Flexible Disk
drive control) ship does not work properly. Replace the A1 CPU with
a new one. See the Service Manual for troubleshooting.
-257
File name error
A legal program command or query could not be executed because the
le name on the device media was in error. For example, an attempt
was made to copy to a duplicate le name. The de nition of what
constitutes a le name error is device-speci c.
-256
File name not found
A legal program command could not be executed because the le
name on the device media was not found: for example, an attempt
was made to read or copy a nonexistent le.
230
FLOPPY DISK DRIVE FAILURE FOUND
An \external test 18: DSK DR FAULT ISOL'N" fails. The A53 built-in
FDD ( oppy disk drive) does not work properly. Replace the A53 FDD
with a new one. See the Service Manual for troubleshooting.
220
FRACTIONAL N OSC TEST FAILED
An \internal test 7: A5 FRACTIONAL N OSC" fails. The fractional
N oscillator on the A5 synthesizer does not work properly. See the
Service Manual for troubleshooting.
119
FREQUENCY SWEEP ONLY
Equivalent circuit function is executed in OSC level sweep, DC-I
sweep, DC-V sweep. The equivalent circuit function is available in
frequency sweep only.
95
FREQUENCY SWEEP ONLY
NNNNNNNNNNNNNNNNNNNNNNNNNNNNNNNNNNNNNNNNNNNNNNNNNNNNNNNNNNNNNN
Cannot select MKR X AXIS [1/(2F)] in OSC level sweep, or
DC-V/DC-I sweep.
Messages-7
Temperature Coecient Measurement
239
FRONT ISOL'N TEST FAILED
An \external test 25: FRONT ISOL'N" fails. See the Service Manual
for troubleshooting.
-105
GET not allowed
A Group Execute Trigger (GET) was received within a program
message (see IEEE 488.2, 7.7).
216
GND LEVEL OUT OF SPEC
An \internal test 4: A2 POST REGULATOR" fails. The voltage of
the GND (Ground) at the DC bus node 26 is out of its limits. See the
Service Manual for troubleshooting.
-240
Hardware error
A legal program command or query could not be executed because of
a hardware problem in the analyzer. De nition of what constitutes a
hard ware problem is completely device-speci c. This error message
is used when the analyzer cannot detect the more speci c errors
described for errors 0241 through 0249.
-241
Hardware missing
A legal program command or query could not be executed because of
missing analyzer hardware. For example, an option was not installed.
-111
Header separator error
A character that is not a legal header separator was encountered
while parsing the header. For example, no white space followed the
header, thus *SRE4 is an error.
248
HIGH TMP HIGH Z HEAD TEST FAILED
An \external test 32: HIGH TMP HIGH Z HEAD TEST FAILED" fails.
See the Service Manual for troubleshooting.
249
HIGH TMP LOW Z HEAD TEST FAILED
An \external test 33: HIGH TMP LOW Z HEAD TEST FAILED" fails.
See the Service Manual for troubleshooting.
237
HIGH Z HEAD TEST FAILED
An \external test 30: HIGH Z HEAD" fails. See the Service Manual
for troubleshooting.
-114
Header Sux out of range
The value of a numeric sux attached to a program mnemonic makes
the header invalid.
Messages-8
Temperature Coecient Measurement
237
HI Z HEAD TEST FAILED
An \external test 30: HIGH Z HEAD" fails. See the Service Manual
for troubleshooting.
209
HP-IB CHIP TEST FAILED
An \internal test 1: A1 CPU" fails. The A1 CPU's GPIB chip does not
work properly. Replace the A1 CPU with a new one. See the Service
Manual for troubleshooting.
-224
Illegal parameter value
Used where exact value, from a list of possibilities, was expected.
-282
Illegal program name
The name used to reference a program was invalid. For example,
rede ning an existing program, deleting a nonexistent program, or in
general, referencing a nonexistent program.
-283
Illegal variable name
An attempt was made to reference a nonexistent variable in a
program.
-213
Init ignored
A request for a measurement initiation was ignored as another
measurement was already in progress.
141
INSUFFICIENT MEMORY
If a lot of tasks is executed at same time, memory might be
insucient for a while. (For example, running HP Instrument BASIC
program, printing a screen, and sending or receiving data array by
GPIB are required at same time.) Please wait until nishing some
tasks then execute the next task.
-161
Invalid block data
A block data element was expected, but was invalid for some reason
(see IEEE 488.2, 7.7.6.2). For example, an END message was received
before the length was satis ed.
-101
Invalid character
A syntax element contains a character that is invalid for that type.
For example, a header containing an ampersand (SENS&).
-141
Invalid character data
Either the character data element contains an invalid character or the
particular element received is not valid for the header.
Messages-9
Temperature Coecient Measurement
-121
Invalid character in number
An invalid character for the data type being parsed was encountered.
For example, an alpha character in a decimal numeric or a \9" in octal
data.
148
INVALID DATE
The date entered to set the real time clock is invalid. Reenter correct
date.
106
INVALID FILE NAME
(GPIB only ) The parameter < le name> for MMEMory:DELete
command must have a \_D" or \_S" extension for LIF format, or
\STA" or \.DAT" for DOS format.
77
INVALID MATERIAL SIZE
(For the permeablity measurement) The material size de nition is
wrong. The outer diameter must be larger than the inner.
-103
Invalid separator
The parser was expecting a separator and encountered an illegal
character. For example, the semicolon was omitted after a program
message unit, *RST:INIT.
-151
Invalid string data
A string data element was expected, but was invalid for some reason
(see IEEE 488.2, 7.7.5.2). For example, an END message was received
before the terminal quote character.
-131
Invalid sux
The sux does not follow the syntax described in IEEE 488.2, 7.7.3.2,
or the sux is inappropriate for the analyzer.
160
INVALID X-AXIS VALUE FOR LOG
User trace cannot be displayed in log scale, because,
The right value and left value of the X-axis is same.
The X-axis range is de ned from 0 value to + value.
Change the X-axis right/left value.
207
KEY CHIP TEST FAILED
An \internal test 1: A1 CPU" fails. The A1 CPU's front keyboard
control chip does not work properly. Replace the A1 CPU with a new
one. See the Service Manual for troubleshooting.
115
LIF-DOS COPY NOT ALLOWED
If you try to copy a le between the memory disk and the oppy disk
when the format of the memory disk is di erent from the format of
the oppy disk, this message is displayed.
Messages-10
Temperature Coecient Measurement
118
LIST TABLE EMPTY OR INSUFFICIENT TABLE
The frequency list is empty. To implement the list frequency mode,
add segments to the list table.
238
LO Z HEAD TEST FAILED
An \external test 31: LOW Z HEAD" fails. See the Service Manual
for troubleshooting.
238
LOW Z HEAD TEST FAILED
An \external test 31: LOW Z HEAD" fails. See the Service Manual
for troubleshooting.
-250
Mass storage error
A mass storage error occurred. This error message is used when the
analyzer cannot detect the more speci c errors described for errors
0251 through 0259.
78
MATERIAL SIZE UNDEFINED
(For the permittivity and permeablity measurement) The
DONE (MODIFIED key (under 4Meas5 MATERIAL SIZE ) is pressed or
it is attempt to select the measurement parameter key when the
material sizes are empty. De ne the material size before press these
keys.
NNNNNNNNNNNNNNNNNNNNNNNNNNNNNNNNNNNNNNNNNNNN
245
NNNNNNNNNNNNNNNNNNNNNNNNNNNNNNNNNNNNNNNNN
MAX VCXO LEVEL OUT OF SPEC
Maximum VCXO level is incorrect, in performing an \adjustment test
36: 3RD VCXO LEVEL ADJ" or an \adjustment test 39: SOURCE
VCXO LEVEL ADJ". See the Service Manual for troubleshooting.
33
MEM-TRACE MEMORY FULL
Another memory trace cannot be saved because the total NOP of
memory traces exceeds (801 2 3).
-311
Memory error
An error was detected in the analyzer's memory.
-109
Missing parameter
Fewer parameters were received than required for the header. For
example, the *SRE command requires one parameter, so receiving only
*SRE is not allowed.
32
MUST BE MORE THAN 2 POINTS FOR ANALYSIS
NNNNNNNNNNNNNNNNNNNNNNNNNNNNNNNNNNNNNNNNNNNNNNNNNNNNNNNNNNNNNN
CALCULATE EQV PARAMS (CALCulate:EVALuate:EPARameters) is
pressed when the NOP (number of points) is 2. Set the number of
measurement points to the number lager than 2.
Messages-11
Temperature Coecient Measurement
92
NO ACTIVE MARKER
(GPIB only ) The marker! command cannot be execute when no
marker is displayed on the screen. Turn on the marker before
executing the marker! commands.
9
NO CALIBRATION CURRENTLY IN PROGRESS
NNNNNNNNNNNNNNNNNNNNNNNNNNNNNNNNNNNNNNNNNNNNNNNNNNNNNNNNNNN
The RESUME CAL SEQUENCE softkey (No GPIB command) is not valid
unless a calibration is in progress. Start a new calibration. See \4Cal5
key" in the Operation Manual.
12
NO COMPENSATION CURRENTLY IN PROGRESS
NNNNNNNNNNNNNNNNNNNNNNNNNNNNNNNNNNNNNNNNNNNNNNN
The RESUME COMP SEQ softkey (No GPIB command) is not valid
unless a xture compensation is in progress. Start a new calibration.
See \4Cal5 key" in the Function Reference .
87
NO DATA TRACE
NNNNNNNNNNNNNNNNNNNNNNNNNNNNNNNNNNNNNNNNNNNNNNNNNN
The MARKER ON [DATA] (CALCulate:EVALuate:ON1 "TR1") is
selected when the data trace is not displayed.
113
NO DATA TRACE DISPLAYED
NNNNNNNNNNNNNNNNNNNNNNNNNNNNNNNNNNNNNNNNNNNNNNNNNN
The SCALE FOR [DATA] (DISPlay[:WINDow]:TRACe1:Y[:SCALe] ) is
selected when the data trace is not displayed.
+0
No error
The error queue is empty. Every error in the queue has been read
(SYSTem:ERRor? query) or the queue was cleared by power-on or the
*CLS command.
94
NO FIXED DELTA MARKER
NNNNNNNNNNNNNNNNNNNNNNNNNNNNNNNNNNNNNNNNN
NNNNNNNNNNNNNNNNNNNNNNNNNNNNNNNNNNNNNNNNNNNNNNNNNN
The 1marker cannot move ( 1MKR STIMULUS , FIXED 1MKR VALUE or
FIXED 1 AUX VALUE |CALCulate:EVALuate:REFerence:{X|Y1|Y2}
<numeric> cause the error) because,
The 1marker is not turned on. ! Turn the 1marker ON
(DISPlay[:WINDow]:TRACe:MARKer:RELative ON).
The only xed 1marker can move by FIXED 1MKR VALUE
or FIXED 1 AUX VALUE . ! Press FIXED 1MKR
(DISPlay[:WINDow]:TRACe:MARKer:RELative:REFerence FIXed).
NNNNNNNNNNNNNNNNNNNNNNNNNNNNNNNNNNNNNNNNNNNNNNNNNNNNN
NNNNNNNNNNNNNNNNNNNNNNNNNNNNNNNNNNNNNNNNNNNNNNNNNN
NNNNNNNNNNNNNNNNNNNNNNNNNNNNNNNNNNNNNNNNNNNNNNNNNNNNN
90
NNNNNNNNNNNNNNNNNNNNNNNNNNNNNNNN
NO MARKER DELTA - RANGE NOT SET
The MKR1!SEARCH RNG softkey (CALCulate:EVALuate:BAND:SPAN
DMARker) requires that 1marker is turned ON.
NNNNNNNNNNNNNNNNNNNNNNNNNNNNNNNNNNNNNNNNNNNNNNNNN
Messages-12
Temperature Coecient Measurement
89
NO MARKER DELTA - SPAN NOT SET
The MKR1!SPAN softkey (SENSe:FREQuency:SPAN DMARker, or
SOURcef1j2g:fVOLTagejCURRentg:SPAN DMARker'') requires that the
1marker mode be turned ON.
NNNNNNNNNNNNNNNNNNNNNNNNNNNNNNN
88
NO MEMORY TRACE
NNNNNNNNNNNNNNNNNNNNNNNNNNNNNNNNNNNNNNNNNNNNNNNNNNNNNNNN
The MARKER ON [MEMORY] (CALCulate:EVALuate:ON1 "TR{2-17}")
is selected when the memory trace is not displayed.
114
NO MEMORY TRACE DISPLAYED
NNNNNNNNNNNNNNNNNNNNNNNNNNNNNNNNNNNNNNNNNNNNNNNNNNNNNNNN
The SCALE FOR [MEMORY] (DISPlay[:WINDow]:TRACe{217}:Y[:SCALe] ) is selected when the memory trace is not
displayed.
107
NO STATE/DATA/IBASIC FILES ON DISK
(Front-panel key only ) The RE-SAVE FILE , COPY FILE ,
PURGE FILE , or 4Recall5 key pressed, but there are no les with
extensions ( \_D" or \_S" for LIF format, or \.STA" or \.DAT" for DOS
format) on the oppy disk.
NNNNNNNNNNNNNNNNNNNNNNNNNNNNNNNNNNNNNN
NNNNNNNNNNNNNNNNNNNNNNNNNNNNN
NNNNNNNNNNNNNNNNNNNNNNNNNNNNNNNN
110
NO STATE/DATA/IBASIC FILES ON MEMORY
(Front-panel key only ) The RE-SAVE FILE , COPY FILE ,
PURGE FILE , or 4Recall5 key pressed, but there are no les with
extensions ( \_D" or \_S" for LIF format, or \.STA" or \.DAT" for DOS
format) on the memory disk.
NNNNNNNNNNNNNNNNNNNNNNNNNNNNNNNNNNNNNN
NNNNNNNNNNNNNNNNNNNNNNNNNNNNN
NNNNNNNNNNNNNNNNNNNNNNNNNNNNNNNN
75
NO TEST HEAD CONNECTED
Check the test head connection.
30
NO VALID MEMORY TRACE
If memory traces are to be displayed or otherwise used, a data trace
must rst be stored to memory.
159
NO VALID USER TRACE
The marker cannot be used in user trace because the selected user
trace is OFF.
14
NOT ALLOWED IN DC BIAS SWEEP
NNNNNNNNNNNNNNNNNNNNNNNNNNNNNNNNNNNNNNNNNNNNNNNNNNNNN
The calibration CAL POINTS [USER]
(SENSe:CORRection1:COLLect:FPOints USER) or compensation in
COMP POINT [USER] (SENSe:CORRection2:COLLect:FPOints USER)
cannot be executed in the DC-V/DC-I sweep.
NNNNNNNNNNNNNNNNNNNNNNNNNNNNNNNNNNNNNNNNNNNNNNNNNNNNN
Messages-13
Temperature Coecient Measurement
121
NOT ALLOWED IN FREQUENCY SWEEP
NNNNNNNNNNNNNNNNNNNNNNNNNNNNNNNNNNNNNNNNNNNN
SWEEP DIR [ ] (SOURce{1|2}:SWEep:DIRection DOWN) is pressed
in frequency sweep. Sweep direction down is only available for OSC
level sweep, DC-V, or DC-I sweep.
189
NOT ALLOWED IN SVC MODE
Dual channel cannot be displayed in the service mode.
80
NOT AVAILABLE FOR THIS FIXTURE
(GPIB only) You cannot execute
CALCulate:MATH1[:EXPRession]:NAME {DCO|PER} when
the SYSTem:FIXTure {NONE|16191|16192|16193|16194} is selected.
79
NOT AVAILABLE FOR THIS FORMAT
(For the permittivity and permeability measurement)
You cannot execute POLAR CHART , SMITH CHART , and
ADMITTANCE CHART (DISPlay[:WINDow]:TRACe1:GRATicule:FORMat
{POLar|SMITh|ADMittance}).
NNNNNNNNNNNNNNNNNNNNNNNNNNNNNNNNNNN
NNNNNNNNNNNNNNNNNNNNNNNNNNNNNNNNNNN
NNNNNNNNNNNNNNNNNNNNNNNNNNNNNNNNNNNNNNNNNNNNNNNNNN
47
NOT ENOUGH DATA
(GPIB only ) The amount of data sent to the analyzer is less than that
expected when the data transfer format is binary.
-120
Numeric data error
This error, as well as errors 0121 through 0129, are generated when
parsing a data element that appears to be numeric, including the
nondecimal numeric types. This particular error message is used if the
analyzer cannot detect a more speci c error.
-128
Numeric data not allowed
A legal numeric data element was received, but the analyzer does not
accept it in this position for a header.
140
ON POINT NOT ALLOWED FOR THE CURRENT TRIG
The trigger event mode cannot be changed to the ON POINT mode
because the current trigger source setting does not allow the ON
POINT mode. The trigger event ON POINT mode is available for only
MANUAL, EXTERNAL, and BUS trigger sources.
48
OPTION NOT INSTALLED
(GPIB only ) This error occurs when an GPIB command which is
optional command is sent and the analyzer is not installed the option.
Please con rm options installed to the analyzer using *OPT? command
(see Chanpter 3 of GPIB Command Reference.)
Messages-14
Temperature Coecient Measurement
233
OUTPUT ATTENUATOR TEST FAILED
An \external test 21: OUTPUT ATTENUATOR" fails. See the Service
Manual for troubleshooting.
-220
Parameter error
Indicates that a program data element related error occurred. This
error message is used when the analyzer cannot detect the more
speci c errors described for errors 0221 through 0229.
-108
Parameter not allowed
More parameters were received than expected for the header. For
example, the *SRE command only accepts one parameter, so receiving
*SRE 4,16 is not allowed.
40
PHASE LOCK LOOP UNLOCKED
Sever error. Contact your nearest Agilent Technologies oce.
215
POST REGULATOR OUTPUT VOLTAGE OUT OF SPEC
An \internal test 4: A2 POST REGULATOR" fails. A power supply
voltage of the A2 post-regulator is out of its limits. See the Service
Manual for troubleshooting.
198
POWER ON TEST FAILED
An internal test fails in the power on sequence (the power on self-test
fails). Contact your nearest Agilent Technologies oce or see the
Service Manual for troubleshooting.
231
POWER SWEEP LINEARITY TEST FAILED
An \external test 19: POWER SWEEP LINEARITY" fails. See the
Service Manual for troubleshooting.
22
PRINTER:not on, not connected, out of paper
The printer does not respond to control. Check the supply to the
printer, online status, sheets, and so on.
-284
Program currently running
Certain operations dealing with programs may be illegal while the
program is running. For example, deleting a running program might
not be possible.
-280
Program error
A downloaded program-related execution error occurred. This error
message is used when the analyzer cannot detect the more speci c
errors described for errors 0281 through 0289.
Messages-15
Temperature Coecient Measurement
-112
Program mnemonic too long
The header contains more than twelve characters (see IEEE 488.2,
7.6.1.4.1).
-286
Program runtime error
A program runtime error of the HP Instrument BASIC has occurred.
To get a more speci c error information, use the ERRM$ or ERRN
command of the HP Instrument BASIC.
-285
Program syntax error
A syntax error appears in a downloaded program. The syntax used
when parsing the downloaded program is device-speci c.
-430
Query DEADLOCKED
A condition causing a deadlocked query error occurred (see IEEE
488.2, 6.3.1.7). For example, both input bu er and output bu er are
full and the analyzer cannot continue.
-400
Query errors
This is the generic query error that the analyzer cannot detect more
speci c errors. This code indicates only that a query error as de ned
in IEEE 488.2, 11.5.1.1.7 and 6.3 has occurred.
-410
Query INTERRUPTED
A condition causing an interrupted query error occurred (see IEEE
488.2, 6.3.2.3). For example, a query followed by DAB or GET before
a response was completely sent.
-420
Query UNTERMINATED
A condition causing an unterminated query error occurred (see IEEE
488.2, 6.3.2.2). For example, the analyzer was addressed to talk and
an incomplete program message was received by the controller.
-350
Queue over ow
A speci c code entered into the queue in lieu of the code that caused
the error. This code indicates that there is no room in the queue and
an error occurred but was not recorded.
105
RECALL ERROR: INSTR STATE PRESET
A serious error, for example corrupted data, is detected on recalling a
le, and this forced the analyzer to be PRESET.
242
RECEIVER GAIN OUT OF SPEC
An \external test 25: FRONT ISOL'N" fails. A6 receiver IF gain is
incorrect. See the Service Manual for troubleshooting.
Messages-16
Temperature Coecient Measurement
241
RECEIVER GAIN TEST FAILED
An \external test 22: RECEIVER GAIN" fails. See the Service Manual
for troubleshooting.
219
REF OSC TEST FAILED
An \internal test 6: A5 REFERENCE OSC" fails. The reference
oscillator on the A5 synthesizer does not work properly. See the
Service Manual for troubleshooting.
206
RTC CHIP TEST FAILED
An \internal test 1: A1 CPU" fails. The A1 CPU's RTC (Real Time
Clock) does not work properly. Replace the A1 CPU with a new one.
See the Service Manual for troubleshooting.
227
SAMPLE FREQUENCY OUT OF SPEC
An \internal test 14: A6 SEQUENCER" fails. The sampling frequency
of the sample/hold circuit on the A6 receiver IF is out of its limits.
104
SAVE ERROR
A serious error, for example physically damaged disk surface, is
detected on saving a le.
68
SEGMENT START/STOP OVERLAPPED
Segments are not allowed to be overlapped. Reenter appropriate
value for start or stop value of segments to avoid that segment is not
overlapped.
-330
Self-test failed
A self-test failed. Contact your nearest Agilent Technologies oce or
see the Service Manual for troubleshooting.
-221
Settings con ict
A legal program data element was parsed but could not be executed
due to the current device state (see IEEE 488.2, 6.4.5.3 and
11.5.1.1.5).
228
SOURCE LEVEL TEST FAILED
An \internal test 15: SOURCE LEVEL" fails. See the Service Manual
for troubleshooting.
232
SOURCE LEVEL TEST FAILED
An \external test 20: SOURCE LEVEL" fails. See the Service Manual
for troubleshooting.
Messages-17
Temperature Coecient Measurement
226
SOURCE OSC TEST FAILED
An \internal test 13: A3A1 SOURCE OSC" fails. The source oscillator
on the A3A1 ALC does not work properly. See the Service Manual
for troubleshooting.
221
STEP OSC TEST FAILED
An \internal test 8: A5 STEP OSC" fails. The step oscillator on the
A5 synthesizer does not work properly. See the Service Manual for
troubleshooting.
-150
String data error
This error, as well as errors 0151 and 0158, are generated when
analyzing the syntax of a string data element. This particular error
message is used if the analyzer cannot detect a more speci c error.
-158
String data not allowed
A string data element was encountered but was not allowed by the
analyzer at this point in parsing.
-130
Sux error
This error, as well as errors 0131 through 0139, are generated when
parsing a sux. This particular error message is used if the analyzer
cannot detect a more speci c error.
-138
Sux not allowed
A sux was encountered after a numeric element that does not allow
suxes.
-134
Sux too long
The sux contained more than 12 characters (see IEEE 488.2,
7.7.3.4).
-102
Syntax error
An unrecognized command or data type was encountered. For
example, a string was received when the analyzer was not expecting
to receive a string.
-310
System error
Some error, termed \system error" by the analyzer, has occurred.
-124
Too many digits
The mantissa of a decimal numeric data element contains more than
255 digits excluding leading zeros (see IEEE 488.2, 7.7.2.4.1).
Messages-18
Temperature Coecient Measurement
56
TOO MANY SEGMENTS
The maximum number of segments for the limit line table is 18.
69
TOO MANY SEGMENTS OR POINTS
Frequency list mode is limited to 15 segments or 801 points.
-223
Too much data
A legal program data element of block, expression, or string type was
received that contained more data than the analyzer could handle due
to memory or related device-speci c requirements.
46
TOO MUCH DATA
(GPIB only ) Either there is too much binary data to send to the
analyzer when the data transfer format is binary, or the amount of
data is greater than the number of points.
70
TOO SMALL POINTS OR TOO LARGE STOP
STOP+SPAN/(NOP01) is out of sweep range. Increase NOP or change
STOP value to lower frequency to avoid this error.
235
TRD ISOL'N I TO V TEST FAILED
An \external test 28: TRD ISOL'N I TO V" fails. See the Service
Manual for troubleshooting.
236
TRD ISOL'N V TO I TEST FAILED
An \external test 29: TRD ISOL'N V TO I" fails. See the Service
Manual for troubleshooting.
234
TRD LOSS TEST FAILED
An \external test 22: TRD LOSS" fails. See the Service Manual for
troubleshooting.
-210
Trigger error
A trigger related error occurred. This error message is used when the
analyzer cannot detect the more speci c errors described for errors
0211 through 0219.
-211
Trigger ignored
A GET, *TRG, or triggering signal was received and recognized by the
analyzer but was ignored because of analyzer timing considerations.
For example, the analyzer was not ready to respond.
-113
Unde ned header
The header is syntactically correct, but it is unde ned for the
analyzer. For example, *XYZ is not de ned for the analyzer.
Messages-19
Temperature Coecient Measurement
158
UNIT STRING TOO LONG
(GPIB only ) DISPlay[:WINDow]:TRACe{18-21}:X:UNIT <string> or
DISPlay[:WINDow]:TRACe{18-21}:Y:UNIT <string> commands can
send <string> up to 4 characters.
76
UNKNOWN TEST HEAD CONNECTED
The test head get wrong. Contact your nearest Agilent Technologies
oce.
246
VCXO TUNING VOLTAGE OUT OF LIMIT
VCXO tuning voltage is incorrect, in performing an \adjustment test
36: 3RD VCXO LEVEL ADJ" or an \adjustment test 39: SOURCE
VCXO LEVEL ADJ". See the Service Manual for troubleshooting.
Messages-20
Index
Special characters
1L.F , 7-22
1R.F , 7-22
1mode , 7-21
1X , 7-26
1Y , 7-26
3 , 2-7
4+5, 4-2
4*5, 4-2
0O, 2-7
" , 2-7
4x15, 4-2
1
10833A GPIB cable(1 m), 10-5
10833B GPIB cable(2 m), 10-5
10833C GPIB cable(3 m), 10-5
10833D GPIB cable(0.5 m), 10-5
16091A coaxial termination xture set , 10-3
16092A spring clip test xture , 10-3
16093A/B binding post test xtures , 10-4
16094A probe test xture , 10-4
16191A Component test xture , 1-2
16191A side electrode SMD test xture , 10-3
16192A Component test xture , 1-2
16192A parallel electrode SMD test xture , 10-3
16193A Component test xture , 1-2
16193A small side electrode SMD test xture , 10-3
16194A high temperature component xture , 10-3
16194A High temperature component test xture , 1-3
16453A dielectric material test xture , 10-3
16453A Dielectric material test xture , 1-3
16454A Magnetic material test xture , 1-3, 10-3
4
4291V upgrade kit, 10-2
46021A keyboard , 12-51
Index-1
8
85043B system rack , 10-4
A
accessory , 12-51
accessory part number, 12-51
active channel, 3-2
active channel , 2-4
active channel block, 1-4
active channel block , 3-1
active entry area , 2-8
AD converter, 9-3
addressable , 8-46
addressable only , 8-19
address setting , 8-19
adjust display , 5-42
ADJUST DISPLAY , 5-35
Admittance, 11-4
Agilent part number, 12-51
APC-7 , 2-17
approximate , 12-1
AUTOREC , 8-39, 8-50
auto recall , 8-39, 8-50
auto scaling , 5-49
aux o set , 5-39
averaging , 5-52, 9-4
averaging factor , 5-52
averaging ON Avg , 2-7
Avg , 2-7
NNNNNNNNNNNNNNNNNNNNNNNNNNNNNNNNNNNNNNNNNNNN
B
B, 11-4
background intensity , 5-42
4Back Space5 , 4-3
BACK SPACE , 5-46
BASIC , 8-4
BASIC draw , 5-36
BASIC screen , 5-36
battery backup, B-1
beeper , 8-4
block , 1-1
block diagram , 9-1
brightness , 5-44
Bus , 2-7
bus trigger , 6-13
BW, 7-22
4Bw/Avg5 , 1-5
NNNNNNNNNNNNNNNNNNNNNNNNNNNNNNNN
Index-2
C
C, 11-4
C! , 2-7
C+, 2-7
C+ , 2-7
C+!, 2-7
C+?, 2-7
C?, 2-7
4Cal5 , 1-5
calibration , 5-55
calibration coecient arrays , 9-4
calibration coecients arrays , 8-49
cal kit , 1-2
calkit , 5-60
cal points , 5-55
Capacitance, 11-4
cent, 7-22
4Center5 , 1-5
center value , 2-6
4Chan 15 , 3-2
4Chan 25 , 3-2
channel coupling , 6-4
circuit model, 11-6
clear markers, 7-5
clock , 8-4
Cm!, 2-7
Cm?, 2-7
Cmp, 2-7
CMP, 2-7
CO+, 2-7
color , 5-44
color monitor , 2-10
color printer , 8-23
color reset , 5-44
compen kit , 5-62
compensation coecient arrays , 9-5
compensation points , 5-57
complex permeability , 11-30
complex permittivity , 11-26
complex plane , 5-30
Conductance, 11-4
connectors , 2-9
continuous marker, 7-5
continuous mode, 7-21
controller , 8-45
controller address , 8-19
4Copy5 , 1-6, 8-22
copy abort , 8-29
copy time ON OFF , 8-29
Cor , 2-7
COR , 2-7
coupling channel , 6-4
coupling channels , 3-2
Cpl, 2-5
cross channel, 7-9
Index-3
NNNNNNNNNNNNNNNNNNNNNNNNNNNNNNNNNNNNNNNNNNNNNNNNNNNNN
CROSS CHAN on OFF , 7-9
cw freq , 6-10
cw frequency , 2-6
D
D3M , 2-7
data arrays , 8-49, 9-5
data math , 5-34, 5-38, 9-6
data math gain ON G3 , 2-7
data math o set ON 0O , 2-7
data math ON D0M, D+M, D/M, Hld , 2-7
DATA & MEMORY , 5-33
data only, 8-49
data processing , 9-2
DATA!MEMORY , 5-33
Data-Trace arrays , 8-49
data trace arrays , 9-6
dc bias , 6-10
dc bias option , 10-1
D (Dissipation Factor), 11-4
default color, 5-44
default colors , 5-43
default gain o set , 5-39
delay time , 6-4
1marker , 7-6
1marker, 7-6
1marker!funciton , 7-9
1MKR SWP PARAM , 7-6
1mode , 7-21
delta mode ON OFF, 7-6
digital lter, 9-3
discrete marker, 7-5
discrete mode, 7-21
disk capacity , 8-48
disk format , 8-48
display , 2-4, 5-33
4Display5 , 1-5
display adjustment , 5-42
display allocation , 5-33, 5-36
DATA MATH , 5-35
DISPLAY: DATA , 5-33
display limit table , 8-28
display list sweep table , 8-28
D+M , 2-7
D/M , 2-7
D0M, 2-7
dual channel , 5-33
dual parameter setting , 5-12
NNNNNNNNNNNNNNNNNNNNNNNNNNNNNNNNNNNNNNNNN
NNNNNNNNNNNNNNNNNNNNNNNNNNNNNNNNNNNNN
NNNNNNNNNNNNNNNNNNNNNNNNNNNNNNNNNNNNNNNNNNNN
NNNNNNNNNNNNNNNNNNNNNNNNNNNNN
NNNNNNNNNNNNNNNNNNNNNNNNNNNNNNNNNNNNNNNNN
Index-4
E
edge e ect , 11-27
emc , 12-21
END EDIT , 8-7
entry block , 4-1
4Entry O 5 , 4-3
equivalent circuit , 5-40
equivalent circuit model, 11-6
ERASE TITLE , 5-46
error message, Messages-1
expanded phase ON OFF , 5-30
Ext , 2-7
external program run/cont input , 2-10
external reference, 2-7
external reference input , 2-9
external trigger , 6-13
external trigger input , 2-10
NNNNNNNNNNNNNNNNNNNNNNNNNN
NNNNNNNNNNNNNNNNNNNNNNNNNNNNNNNNNNN
F
factory setting, B-1
fast sweep indicator " , 2-7
le name , 8-50
xed cal points , 5-55
xed compensation points , 5-57
xed delta marker , 7-6
FIXED 1MKR AUX VALUE , 7-6
FIXED 1MKR VALUE , 7-6
xed 1marker, 7-6
xture compensation , 5-57, 5-58, 5-59
xture compensation coecient arrays , 9-5
xture setting , 5-14
xture stand , 1-3
oppy disk , 12-51
oppy disk drive , 2-3
footnote , 5-48
format , 5-30, 9-6
4Format5 , 1-4
frequency base , 6-8
frequency blank , 5-35
front panel , 2-1
function reference , 12-51
NNNNNNNNNNNNNNNNNNNNNNNNNNNNNNNNNNNNNNNNNNNNNNNNNNNNNNNNNNNNNN
NNNNNNNNNNNNNNNNNNNNNNNNNNNNNNNNNNNNNNNNNNNNNNNNNN
G
G, 11-4
gain, 5-39
gain , 5-38
G3 , 2-7
G+jB , 7-19
4G/n5 , 4-2
G&O , 2-7
GPIB , 8-44
GPIB address , 8-19, 8-47
GPIB cable, 10-5
GPIB command reference , 12-51
GPIB interface , 2-10
graphics, 8-49
Index-5
graphics , 5-36
graticule on o , 5-35
H
I
K
handle kit option , 10-2
headline , 5-48
heat sink , 2-14
height , 5-29
high impedance test head , 1-2
high impedance test head delete option , 10-1
high stability frequency reference add option , 10-2
high temperature high impedance test head , 1-3
high temperature high impedance test head add option , 10-1
high temperature low impedance test head , 1-3
high temperature low impedance test head add option , 10-1
Hld , 2-7
HP DeskJet 1200 color printer, 10-4
HP DeskJet 1600CM color printer, 10-4
HP DeskJet 340J color printer, 10-4
HP DeskJet 505 printer, 10-4
HP DeskJet 560C color printer, 10-4
HP DeskJet 694C color printer, 10-4
HP DeskJet 850C color printer, 10-4
hp-hil keyboard cable , 12-51
hp instrument basic users handbook , 12-51
NNNNNNNNNNNNNNNNNNNN
IBASIC , 5-43
I#, 2-7
Impedance, 11-3
Parameters, 11-3
impedance measurement , 5-9, 5-12
initialize, B-1
inner diameter , 5-29
instrument BASIC , 8-4
Instrument data arrays , 8-49
instrument state block , 1-6
Instrument states and internal data arrays , 8-49
intensity , 5-42
internal reference output , 2-10
introduction , 1-1
i/o port , 2-10, 2-11
i/o port pin assignment , 2-11
I-V method , 11-12
key
4Back
+
*
4 5,
4 5,
Space5
4-2
4-2
, 4-3
, 3-2
, 3-2
4Entry O 5 , 4-3
4G/n5 , 4-2
4k/m5, 4-2
4M/5 , 4-2
4Chan 15
4Chan 25
Index-6
terminator key , 4-2
4x15, 4-2
keyboard , 12-51
keyboard cable , 12-51
keyboard connector , 2-10
keyboard template , 12-51
4k/m5, 4-2
knob , 4-2
L
L, 11-4
label , 5-35, 5-45
LCD , 2-4
left peak, 7-14
level monitor , 2-5, 6-11
LIF (logical inter change format) , 8-48
limit line concept , 8-40
limit test , 8-14
linear sweep , 6-5
line switch , 2-3
listener , 8-44
list sweep , 6-5
4Local5 , 1-6, 8-19
logging ON OFF , 8-4
log sweep , 6-5
loss, 7-22
low impedance test head , 1-2
low impedance test head add option , 10-1
low-loss air-capacitor calibration , 11-12
M
main frame , 1-2
man , 2-7
manual changes, A-1
manual trigger , 6-13
marker, 7-20
coupled maker , 3-2
marker , 7-4
4Marker5 , 1-5, 7-3
marker block , 1-5
marker coupling, 7-5
marker data readout , 2-5
marker list, 7-19
marker! , 7-7
marker search, 7-22
marker statistics , 2-5
marker time mode , 7-20
4Marker!5, 1-5
material measurement rmware option , 10-1
material size , 5-22, 5-29
Max, 2-5
MAX , 7-11
max search, 7-11
4Meas5, 1-4
4Meas5 , 5-3
measured input , 2-5
NNNNNNNNNNN
Index-7
measurement block, 1-4
measurement block , 5-1
measurement circuit , 11-12
measure restart , 6-13
memory arrays , 8-49, 9-5
memory disk , 8-48
memory partition , 8-4
memory trace , 5-33, 5-36
memory trace arrays , 8-49, 9-6
memory trace number , 5-33
menu , 2-2
message area, 2-8
Min, 2-5
MIN , 7-11
min search, 7-11
MKR1!CENTER , 7-9
MKR1!SEARCH RNG , 7-15
MKR1!SPAN , 7-9
MKR!REFERENCE , 7-9
MKR!CENTER , 7-9
MKR!LEFT RNG , 7-15
MKR!PEAK DELTA , 7-13
MKR!RIGHT RNG , 7-15
MKR!START , 7-9
MKR!STOP , 7-9
MKR!THRESHOLD , 7-13
MKR ZOOM , 7-9
4M/5, 4-2
modify colors , 5-42
modify compen kit , 5-62, 5-64
mounting post , 2-13
mounting screw, 2-13
NNNNNNNNNNN
NNNNNNNNNNNNNNNNNNNNNNNNNNNNNNNNNNNNN
NNNNNNNNNNNNNNNNNNNNNNNNNNNNNNNNNNNNNNNNNNNNNNNNN
NNNNNNNNNNNNNNNNNNNNNNNNNNNNNNN
NNNNNNNNNNNNNNNNNNNNNNNNNNNNNNNNNNNNNNNNNNN
NNNNNNNNNNNNNNNNNNNNNNNNNNNNNNNNNN
NNNNNNNNNNNNNNNNNNNNNNNNNNNNNNNNNNNNNNNN
NNNNNNNNNNNNNNNNNNNNNNNNNNNNNNNNNNNNNNNNNNNNNN
NNNNNNNNNNNNNNNNNNNNNNNNNNNNNNNNNNNNNNNNNNN
NNNNNNNNNNNNNNNNNNNNNNNNNNNNNNN
NNNNNNNNNNNNNNNNNNNNNNNNNNNN
NNNNNNNNNNNNNNNNNNNNNNNNNNNNNNNNNNNNNNNNNNN
NNNNNNNNNNNNNNNNNNNNNNNNNN
N
next peak, 7-14
NEXT PEAK (SEANPK), 7-14
NEXT PEAK LEFT (SEANPKL), 7-14
NEXT PEAK RIGHT (SEANPKR), 7-14
nominal , 12-1
non-volatile memory, B-1
nop , 6-4
notations , 2-7
number of points , 6-4
numeric keypad , 4-2
NNNNNNNNNNNNNNNNNNNNNNNNNNNNN
NNNNNNNNNNNNNNNNNNNNNNNNNNNNNNNNNNNNNNNNNNNN
NNNNNNNNNNNNNNNNNNNNNNNNNNNNNNNNNNNNNNNNNNNNNNN
Index-8
O
o set , 5-38
option 001 add dc bias , 10-1
option 002 add material measurement rmware , 10-1
option 011 delete high impedance test head , 10-1
option 012 add low impedance test head , 10-1
option 013 add high temperature high impedance test head , 10-1
option 014 add high temperature low impedance test head , 10-1
option 0BW add service manual , 10-2
option 1D5 , 2-9, 2-10
option 1D5 add high stability frequency reference , 10-2
Option Keyboard less, 10-2
options available , 10-1
order base , 6-8
osc level , 6-10
outer diameter , 5-29
P
parallel circuit model, 11-6
Parallel Resistance, 11-4
part number , 12-51
PART SRCH on OFF , 7-15
pass/fail , 2-5
Peak, 2-5
PEAK (SEAM PEAK), 7-14
PEAK!CENTER , 7-9
peak de nition, 7-26
PEAK DEF MENU , 7-11
peak delta, 7-13
PEAK DELTA: 1X , 7-13
PEAK DELTA: 1Y , 7-13
Peak menu , 7-13
PEAK PLRTY POS neg , 7-13
peak polarity, 7-13
peak polarity , 7-26
PEN , 5-43
pen color , 5-43
performance , 12-1
performance test , 12-1
permeability measurement , 5-23, 11-29
permittivity measurement , 5-17, 11-26
phase unit , 5-30
POINT AVG FACTOR , 5-52
POINT AVG on OFF , 5-52
port extension , 5-66, 9-5, 11-16
power , 2-10
power level , 2-6
4Preset5 , 1-6, 2-3, 8-21
preset marker , 7-5
preset state, B-1
printer, 10-4
printer address , 8-19
printer port , 2-10
print standard , 8-26
NNNNNNNNNNNNNNNNNNNNNNNNNNNNNNNNNNNNNNNNNNNNNNNNNN
NNNNNNNNNNNNNN
NNNNNNNNNNNNNNNNNNNNNNNNNNNNNNNNNNNNN
NNNNNNNNNNNNNNNNNNNNNNNNNNNNNNNNNNNNNNNNN
NNNNNNNNNNNNNNNNNNNNNNNNNNNNNNNNNNNNNNNNNNNN
NNNNNNNNNNNNNNNNNNNNNNNNNNNNNNNNNNNNNNNNNNNN
NNNNNNNNNNNNNNNNNNNNNNNNNNNNNNNNNNNNNNNNNNNNNNNNNNNNNNNN
NNNNNNNNNNN
NNNNNNNNNNNNNNNNNNNNNNNNNNNNNNNNNNNNNNNNNNNNNNNNNN
NNNNNNNNNNNNNNNNNNNNNNNNNNNNNNNNNNNNNNNNNNNNNNNNNN
Index-9
programme menu , 8-4
programming guide , 12-51
Q
Q, 7-22
Q (Quality Factor), 11-4
Quick Start Guide , 12-51
R
R, 11-3
rack mount and handle kit option , 10-2
rack mount kit option , 10-2
raw data arrays , 8-49, 9-4
Reactance, 11-3
rear panel , 2-9
4Recall5 , 1-6, 8-39
recall color , 5-43
recall le , 8-39
recharge time, B-1
reference level , 2-5
reference oven output , 2-10
reference position , 5-49
reference value , 5-49
relaxation time , 7-19
REMOTE indicator , 2-3
Resistance, 11-3
right peak, 7-14
R+jX , 7-19
Rp , 11-4
Rs , 11-3
run/cont input , 2-10
S
sample program disk , 12-51
4Save5 , 1-6, 8-30
save color , 5-43
SAVE COLORS , 5-43
scale coupling , 5-50
scale/div , 2-5
scale for data , 5-50
scale for memory , 5-50
scale per div , 5-49
4Scale Ref5 , 1-5
scale reference , 5-49
scaling , 9-6
scan speed of 31.5 kHz, 2-10
screen display , 2-4
search, 7-22
4Search5 , 1-5
SEARCH LEFT (SEAL), 7-12
search menu , 7-11
SEARCH: PEAK , 7-11
search range, 7-15
SEARCH RANGE MENU , 7-11
search range menu , 7-15
NNNNNNNNNNNNNNNNNNNNNNNNNNNNNNNNNNN
NNNNNNNNNNNNNNNNNNNNNNNNNNNNNNNNNNN
NNNNNNNNNNNNNNNNNNNNNNNNNNNNNNNNNNNNNN
NNNNNNNNNNNNNNNNNNNNNNNNNNNNNNNNNNNNNNNNNNNNNNNNNNNNN
Index-10
NNNNNNNNNNNNNNNNNNNNNNNNNNNNNNNNNNNNNN
SEARCH RIGHT (SEAR), 7-12
SEARCH TRK on OFF , 7-11
segment , 6-7, 8-40
SEL'D UTRC ON off , 5-48
SELECT LETTER , 5-46
serial number, A-2
series circuit model, 11-6
service manual , 12-51
service manual add option, 10-2
service menU , 8-5
Smith polar marker , 7-19
smth/polar menu , 7-19
4Source5 , 1-5, 6-10
SPACE , 5-46
4Span5 , 1-5
span value , 2-6
speci cations , 12-1
split display , 5-33
standard model , 5-61
4Start5 , 1-5, 6-14
start value , 2-6
state, 8-49
statistics ON OFF , 7-19
status notations , 2-7
step key , 4-2
stimulus block , 1-5
4Stop5 , 1-5
stop value , 2-6
storage devices , 8-48
sub marker , 7-5
SUB MKR , 7-12
Susceptance, 11-4
Svc, 2-7
4Sweep5 , 1-5, 6-3
SWEEP AVG FACTOR , 5-52
SWEEP AVG ON off , 5-52
SWEEP AVG RESTART , 5-52
sweep direction , 6-5
sweep hold , 6-12
sweep time , 6-4
sweep type , 6-5
4System5, 1-6
4System5 , 8-3
system accessory, 10-4
system controller , 8-19, 8-45, 8-46
system overview , 1-2, 9-1
system rack, 10-4
NNNNNNNNNNNNNNNNNNNNNNNNNNNNNNNNNNNNNNNNNNNNNNNNNNNNN
NNNNNNNNNNNNNNNNNNNNNNNNNNNNNNNNNNNNNNNNNNNNNNNNNNNNN
NNNNNNNNNNNNNNNNNNNNNNNNNNNNNNNNNNNNNNNNN
NNNNNNNNNNNNNNNNN
NNNNNNNNNNNNNNNNNNNNNNN
NNNNNNNNNNNNNNNNNNNNNNNNNNNNNNNNNNNNNNNNNNNNNNNNNN
NNNNNNNNNNNNNNNNNNNNNNNNNNNNNNNNNNNNNNNNNNNNNNNNNN
NNNNNNNNNNNNNNNNNNNNNNNNNNNNNNNNNNNNNNNNNNNNNNNNNNNNN
Index-11
T
talker , 8-44
Targ, 2-5
TARGET , 7-11
TARGET (SEATARG), 7-12
target menu , 7-12
target search, 7-11
te on , 5-64
terminator key , 4-2
test head , 2-15
test station , 1-2, 2-13, 2-14
test station connector , 2-3
TEXT MARKER , 5-43
, 11-3
thickness , 5-22
threshold , 7-13
THRESHOLD on OFF , 7-13
threshold value, 7-26
THRESHOLD VALUE , 7-13
time stamp , 8-29
tint , 5-44
title , 2-8, 5-35, 5-46
tracking delta marker , 7-6
TRACKING 1MKR , 7-6
4Trigger5 , 1-5, 6-12
trigger event , 6-13
trigger input , 2-10
trigger signal polarity , 6-13
typical , 12-1
typically , 12-1
NNNNNNNNNNNNNNNNNNNN
NNNNNNNNNNNNNNNNNNNN
NNNNNNNNNNNNNNNNNNNNNNNNNNNNNNNNNNN
NNNNNNNNNNNNNNNNNNNNNNNNNNNNNNNNNNNNNNNNNNNNNNNNNN
NNNNNNNNNNNNNNNNNNNNNNNNNNNNNNNNNNNNNNNNNNNNNNN
NNNNNNNNNNNNNNNNNNNNNNNNNNNNNNNNNNNNNNNNN
Index-12
U
upgrade kit, 10-2
user de ned cal points , 5-55
user de ned compensation points , 5-57
user kit , 5-64
user trace , 5-47
user trace format , 5-31
user trace scale , 5-51
4Utility5 , 1-5
utility menu , 7-18
V
V#, 2-7
video port, 2-10
video signal, 2-10
W
warm up time , 12-1
width function, 7-16
width search, 7-22
width value , 2-5
X
X, 11-3
Y
jYj, 11-4
Z
jZj, 11-3
_ 11-4
Y,
_ 11-3
Z,
ZOOMING APERTURE , 7-9
NNNNNNNNNNNNNNNNNNNNNNNNNNNNNNNNNNNNNNNNNNNNNNNNNN
Index-13
REGIONAL SALES AND SUPPORT OFFICES
For more information about Agilent Technologies test and measurement products, applications, services, and
for a current sales office listing, visit our web site: http://www.agilent.com/find/tmdir. You can also contact one
of the following centers and ask for a test and measurement sales representative.
11/29/99
United States:
Agilent Technologies
Test and Measurement Call Center
P.O.Box 4026
Englewood, CO 80155-4026
(tel) 1 800 452 4844
Canada:
Agilent Technologies Canada Inc.
5150 Spectrum Way
Mississauga, Ontario
L4W 5G1
(tel) 1 877 894 4414
Europe:
Agilent Technologies
Test & Measurement
European Marketing Organization
P.O.Box 999
1180 AZ Amstelveen
The Netherlands
(tel) (31 20) 547 9999
Japan:
Agilent Technologies Japan Ltd.
Call Center
9-1, Takakura-Cho, Hachioji-Shi,
Tokyo 192-8510, Japan
(tel) (81) 426 56 7832
(fax) (81) 426 56 7840
Latin America:
Agilent Technologies
Latin American Region Headquarters
5200 Blue Lagoon Drive, Suite #950
Miami, Florida 33126
U.S.A.
(tel) (305) 267 4245
(fax) (305) 267 4286
Australia/New Zealand:
Agilent Technologies Australia Pty Ltd
347 Burwood Highway
Forest Hill, Victoria 3131
(tel) 1-800 629 485 (Australia)
(fax) (61 3) 9272 0749
(tel) 0 800 738 378 (New Zealand)
(fax) (64 4) 802 6881
Asia Pacific:
Agilent Technologies
24/F, Cityplaza One, 1111 King’s Road,
Taikoo Shing, Hong Kong
(tel) (852)-3197-7777
(fax) (852)-2506-9284