1
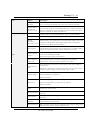
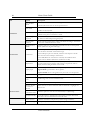
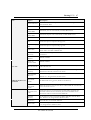
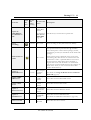
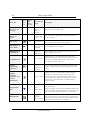
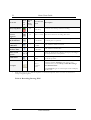
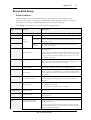
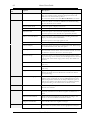
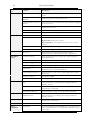
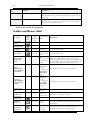
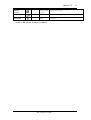
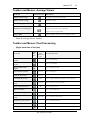
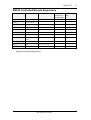
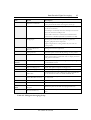
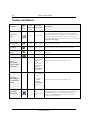
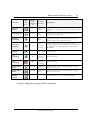
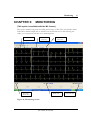
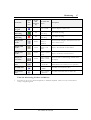
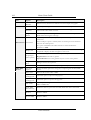
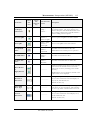
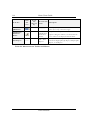
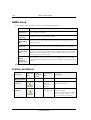
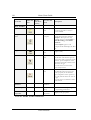
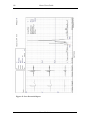
Late Potential Signal Averaging
89
Numerical Results
Averaged Beats
Displays the number of averaged normal beats captured during the study.
HR Average in beat/min
High Frequency QRS
Duration in Milliseconds
from ONSET to OFFSET
Displays the width of the filtered QRS containing only high frequencies. A
higher number indicates higher patient risk.
RMS LASTS 40 milliseconds in Microvolts
Displays the total activity for the last (40ms) portion of the QRS. A lower
number indicates higher patient risk.
DURATION UNDER 40
Microvolts in Milliseconds
Shows the period in ms from offset of the QRS till the first point of 40uV
activity. A higher number indicates higher patient risk.
H.F. Noise: in Microvolts
Quality assurance. A lower number corresponds to higher result accuracy.
The maximum number should not exceed 1 µV.
Table 20: LP Signal Averaging Numerical Results
The results are calculated automatically. You can overrule the automatic positioning
of the ONSET/OFFSET markers with the direction keys.
NV-54/PCECG1200