1
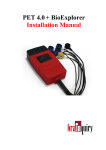
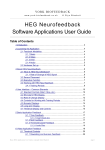
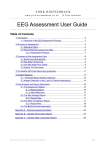
YORK BIOFEEDBACK
w w w. yo r k - b io f e e d b a c k . co . u k
© Glyn Blackett
Basic Breathing
Software Application User Guide
Table of Contents
1 Introduction.......................................................................................................2
2 Launching the Application.................................................................................3
2.1 Hardware Set-up...................................................................................3
3 Measuring the Breath........................................................................................4
3.1 Breath Detection...................................................................................4
3.1.1 Breathing Calibration................................................................4
3.1.2 Manual Re-calibration...............................................................4
3.2 Derived Breathing Parameters..............................................................5
4 User Interface...................................................................................................6
4.1 Main Window........................................................................................6
4.1.1 Standard Controls (Start / Stop, etc.)........................................6
4.1.2 (Short Term) Breath Display......................................................7
4.1.3 Numeric Displays......................................................................7
4.1.4 Long Term Displays and Controls.............................................8
4.1.5 Threshold Display and Controls................................................9
4.1.6 Audio Feedback Controls........................................................10
4.1.6.1 Midi.......................................................................................10
4.1.6.2 Breath Tone...........................................................................11
4.1.6.3 Threshold..............................................................................11
4.2 Support Window..................................................................................11
5 Session Reports..............................................................................................13
5.1 Report Options....................................................................................13
5.2 Adding Notes to a Report....................................................................13
5.3 Sample Session Report......................................................................14
6 Application Report...........................................................................................15
6.1 Report Options....................................................................................15
Basic Breathing Application User Guide, copyright Glyn Blackett
page 1
1 Introduction
This guide introduces the Basic Breathing biofeedback application, part of York Biofeedback's
Mind-Body Training Tools suite. This set of applications is designed to develop skills in mind-body
awareness and self-regulation, particularly in a context of mindfulness and meditation practice.
The purpose of the guide is to teach you how to use the software, though it is more of a reference
than a tutorial. Other training material is available on the York Biofeedback website (address
above).
The application monitors breathing via temperature of the inhaled and exhaled air. This is the only
input parameter in the application – some of the other applications in the suite monitor breathing
plus some other parameter – for example the EMG & Breathing application measures muscle
tension in addition. These applications offer most of the capabilities of the basic breathing
application and more, but the Basic Breathing application is simpler and may play a useful role in
your learning process.
In keeping with others in the suite, the Basic Breathing application was designed to support your
aims, not to supplant them. Achieving some particular breathing state is not necessarily the only
consideration – the biofeedback application is designed to enhance or expand your subjective
awareness. I gave particular attention to the design of audio feedback, allowing for eyes-closed
practice. You can choose how much and how often the feedback is activated, and thus how intrusive
it is.
The guide assumes that you have read the Software Installation and Set-up Guide, and therefore
know how to start the application.
The application works with several devices. For an up to date list of supported hardware, please see
the York Biofeedback website.
Basic Breathing Application User Guide, copyright Glyn Blackett
page 2
2 Launching the Application
Figure 1 above shows the Breathing tab of the Platform. Press the button labelled 1 to launch the
application. Make sure you have your BioEra licence key (dongle) inserted into a USB socket. After
a few seconds two new windows will appear on your screen.
2.1 Hardware Set-up
The physical aspects of hardware set-up (how to connect and use your sensors, etc.) are dependent
upon the type of amplifier you are using, and are covered in a separate document (Hardware Set-up
Guide).
Before you start the application you configure the device set-up
options, accessible by clicking a button in the Set-up tab of the
Platform. In the dialog, select the type of amplifier (biofeedback
device) you are using, in the breath source control. Note, all the
source settings are remembered the next time you start the
Platform. (See the Installation and Set-up Guide for further details
of device set-up.)
Figure 2 – amplifier status
One of the device options is 'Simulator'. In simulator mode, you
can learn how to use the software without the encumbrance of
sensors, leads etc. (The application simply uses recorded data as a source.)
Once you have started the application, you should see your device selection reflected in the device
status display in the top right corner of the main window (see figure 2). The lamp (shown as a red
square in figure 2) should change to green when you press the play button. If you do not see this
happen, it means that the application has not been able to establish a connection with your device.
Check it is plugged in and that the batteries are not flat.
For some devices, you'll see a button rather than just text. Pressing this button opens up a dialog
that allows you to adjust settings related to the device, such as COM port. The specifics depend on
the device – see the Hardware Set-up Guide for more details.
Basic Breathing Application User Guide, copyright Glyn Blackett
page 3
3 Measuring the Breath
3.1 Breath Detection
The breath sensor is actually a temperature sensor placed just below the nostril. From the changing
temperature of inhaled and exhaled air, the system is able to detect the turning points of the breath
and therefore derive breathing rate. This method depends on a reasonable current of air coming
through the nostril. It should still work if you breathe with your mouth open as long as your nose is
not completely blocked. Speech will disrupt the normal air current, and will give rise to unreliable
breathing calculations.
3.1.1
Breathing Calibration
The breath detection method requires a short period of time to calibrate to your breath. This
happens automatically during the first 20 seconds of any session (i.e. after you press 'play'). It's
important that you breathe naturally and evenly, and not too slowly, through the nose, during this
time. Note that the breath signal will not display properly until proper calibration is established. If
the initial automatic calibration does not work, you can recover either by pressing stop and then
start again, or by following the procedure described in the following section.
3.1.2
Manual Re-calibration
If for any reason you lose reliable breath detection during a session (e.g. you have to remove and
reattach the sensor) there is a way to recover: in the support window, you can press a button labelled
'Calibrate'. You should breathe naturally and evenly and not too slowly for a few breaths prior to
pressing. If this doesn't work you can stop and restart the application. Generally the breath detection
once established is very reliable and you should not need to re-calibrate during normal use.
Figure 3 shows you what a well-calibrated breath signal looks like (in the support window). The
upper trace is the temperature of inhaled / exhaled air, while the middle trace is its first derivative or
gradient. The yellow dotted lines are thresholds used for the detection of the breath turning points.
They should be reasonably far apart, but close enough to the centre that the trace will easily and
consistently cross to register a turning point.
Basic Breathing Application User Guide, copyright Glyn Blackett
page 4
Figure 3 – A well-calibrated breathing signal
3.2 Derived Breathing Parameters
From the detection of the breath turning points, the software calculates:
• breathing rate, and average breathing rate (the averaging period is 1 minute)
• the ratio between the (durations of the) inhalation phase and exhalation phase of the breath. This
is shortened to 'I:E Ratio' (or simply 'I:E'). A 1-minute average is also calculated.
These two parameters are shown in the long term displays (figure 6), and can be used as the basis of
audio feedback (section 4.1.6).
Basic Breathing Application User Guide, copyright Glyn Blackett
page 5
4 User Interface
1. Standard Controls
2. Short Term Display
3. Threshold
Display
6. Numeric
Displays
4. Long Term Displays
5. Audio Controls
Figure 4 – Main window
When you first start the application from the Platform, you will see two windows. The main
window is shown in figure 4 above, while the support window is shown later (figure 9).
The support window allows you to check that breath detection is working properly (see the
discussion of breath calibration in section 3.1). I expect that most users will rarely need to make
reference to it.
4.1 Main Window
This section explains how to configure the controls in the main window.
4.1.1
Standard Controls (Start / Stop, etc.)
A set of buttons – Play, Stop and Pause – are the same in all the applications in the suite. They
should be self-explanatory.
The button marked with a red asterisk is a simple event marker. You can use it to mark adventitious
happenings and changes in session conditions (e.g. you turn on or off breath pacing). It is
particularly useful for coaches and therapists. Events thus marked are represented in the long term
chart (see section 4.1.4 below) by a vertical white line. They are also recorded in the session data
file and are shown in session report charts (as dotted vertical lines) (see section 5).
Note that pressing the escape key during a session has the same effect as pressing the red asterisk
with your mouse (i.e. it is an alternative).
Basic Breathing Application User Guide, copyright Glyn Blackett
page 6
4.1.2
(Short Term) Breath Display
Figure 5 – Short term display and controls
The chart (figure 5 above, and 2 in figure 4) shows the breath trace in green-yellow – it rises on the
inhalation and falls on the exhalation.
Note there is no vertical range control for the breath signal. This should automatically be adjusted to
fit the display, during the calibration process. (If it goes off the top or bottom, it means recalibration
is needed. Use the recalibrate button in the support window, as described section 3.1.) Each breath
starts from the same point on the vertical axis – sometimes you see this as jumps in the signal.
There is a single control connected with this display – you can see it below the chart at the left. It
sets the horizontal scale or time range – the length of time it takes the trace to traverse the whole
chart.
4.1.3
Numeric Displays
These are positioned at the bottom of the main window, just above the audio feedback controls (6 in
figure 4 above) and should be self-explanatory.
Averages are calculated over a 60 second interval.
Basic Breathing Application User Guide, copyright Glyn Blackett
page 7
4.1.4
Long Term Displays and Controls
1
2
Figure 6 – Long term displays and controls
There are two long-term charts, shown in figure 6 (and labelled 5 in figure 4), displaying breathing
rate (blue trace) and inhalation-exhalation (I:E) ratio (red trace). Two combo boxes positioned
above the charts (1 and 2 in figure 6) control the display of the traces.
LT Period
Controls the horizontal (time) range of both charts.
Breathing
Rate Range
Controls the vertical range of the blue breathing rate trace.
Make this range larger if the blue trace appears to be off the top of the chart. You
can reduce it for greater sensitivity, as your breathing slows down.
The I:E ratio trace (middle chart) has a fixed scale of 0 to 2. The bold line in the centre of the chart
represents 1.0, at which point the inhalation and exhalation are equal in length. When the trace is
above this line it means that the inhalation is longer than the exhalation, and when it drops below it
means the exhalation is longer. The exhalation is usually longer in relaxed breathing.
Basic Breathing Application User Guide, copyright Glyn Blackett
page 8
4.1.5
Threshold Display and Controls
The essence of threshold-based feedback is
that a discrete feedback event is triggered
whenever the feedback parameter exceeds
some limit. For this application the main
feedback event is a sound such as a bell-ring,
but also a lamp lights up (3 in figure 7, not lit
in this case). (Audio aspects of thresholdbased feedback are covered in section 4.1.6
below.)
2
1
4
The value of using the threshold is that the
feedback is generally less intrusive, freeing
you to focus on your direct experience. The
feedback only comes in when you've drifted
out of your desired psychophysiological state.
5
The bar graph has either one or two movable
bars (4 and 5 in figure 7) which define the
threshold levels. To change these, simply drag
the bars with your mouse. The actual values of
the levels are shown in two numeric displays
immediately below the graph (labelled 6 in
figure 7).
You can set different conditions to be met for
the threshold event to be triggered, via combo
box 2 in figure 7. The options are listed in the
table below.
3
6
Figure 7 – Threshold
display & controls
Between
Two limits are used; the condition is met whenever the parameter is both below the
upper limit and above the lower limit.
Outside
Two limits are used; the condition is met whenever the parameter is either above the
upper limit or below the lower limit.
Above
A single limit is used; the condition is met when the parameter is above this.
Below
A single limit is used; the condition is met when the parameter is below this.
You can set the parameter used as the basis of this feedback, using a combo box (1 in figure 7). You
can choose from the following:
Br. Rate
Breathing rate. The range is the same as that of the long term display (combo box 2
in figure 6).
I:E Ratio
Inhalation to exhalation ratio. The range is fixed at 0 to 2.
For example suppose you wish to maintain a steady breathing rate of around 6 breaths per minute.
You can set the threshold feedback to inform you if the breath is either too fast or too slow. To set
this up, you would set the condition to 'outside', then drag the threshold levels so that the upper is
say around 7 bpm and the lower is say around 5 bpm.
Basic Breathing Application User Guide, copyright Glyn Blackett
page 9
4.1.6
(1)
Audio Feedback Controls
(2)
(3)
(4)
(5)
(6)
(7)
(8)
Figure 8 – Audio feedback controls
Audio feedback allows you to use the application with eyes closed – useful in meditation practice.
You can choose how much and how often the feedback is activated, and thus how intrusive it is. The
controls (figure 8) are found at the bottom of the main window (labelled 6 in figure 4).
There are three forms of audio feedback available: midi, breath tone and threshold-based. With
each, you can choose which breathing parameter to base the feedback on.
Each has an on/off button (appearing as green triangles 2,5 & 7 in figure 8, but switching to red
squares when the feedback is turned on). Each also has an independent volume control (sliders 3, 6
and 8 in figure 8) graded on a scale of 0-100.
For midi and breath tone feedback, it is necessary to use a range for the feedback parameter, just as
for graphical feedback. The range defines what values of the parameter correspond to the highest
and lowest notes available. Rather than creating separate controls, the ranges are taken from the
graphical range controls – details are given in the tables below.
4.1.6.1
Midi
When midi feedback is turned on, a musical note is played repeatedly, whose pitch varies with the
chosen feedback parameter. The trigger for a note is the beginning of the inhalation.
You can set some options for midi feedback, notably the instrument (piano by default) from the
Platform (i.e. before starting the application). See the Installation and Set-up Guide for further
details.
Combo box 1 in figure 8 controls the parameter used. You can choose from those listed in the table
below. Generally, the lower the parameter the deeper the midi note.
Br. Rate
The slower the breathing, the deeper the pitch.
The pitch range is mapped to a parameter range defined by the breathing rate range
control in the long term chart (3 in figure 14) (actually this sets the upper limit,
while the lower limit is fixed at 3.0 bpm).
I:E Ratio
The higher the I:E ratio (in other words the longer the inhalation relative to the
exhalation) the higher the pitch.
The pitch range is mapped to a fixed parameter range of 0 to 2.
Threshold
The pitch varies with the parameter that is selected for threshold 1 (i.e. in control 1
in figure 7). The higher the parameter, the higher the pitch. The pitch range is
mapped to a parameter range defined by the two threshold levels – the advantage
of this option is that you can adjust the levels to precisely control the parameter
range and thus the sensitivity of the feedback.
This only makes sense if you have two threshold levels visible, so you should
select 'outside' for the threshold condition (control 2 in figure 7).
Basic Breathing Application User Guide, copyright Glyn Blackett
page 10
4.1.6.2
Breath Tone
A tone is played which follows the breath. The pitch gently ascends and descends in pitch for each
inhalation / exhalation respectively. (Each breath has a relatively narrow range in pitch.) The tone
sounds during the movement of the breath, and falls silent at the turning points. This form of
feedback is very useful if you are using the breath as the focus of your meditation.
At an overarching level, the pitch varies with the selected feedback parameter – the lower the
parameter value, the deeper the pitch.
Control 4 in figure 8 allows you to choose which parameter to use as the basis of feedback. The
choices are the same as for midi feedback, i.e. they are listed in the above table.
The 'threshold' option works in a similar way to midi feedback – i.e. the parameter used is the same
as that selected for the threshold (control 1 in figure 7) and the two threshold levels define the
parameter range over which the pitch varies.
4.1.6.3
Threshold
Threshold-based feedback was introduced in section 4.1.5 above.
When this option is activated, a sound is played whenever the threshold condition is met. You can
configure the threshold as described in section 4.1.5: to summarise, you can choose which
parameter is the basis for feedback, the threshold condition (e.g. above or below the limit, etc.) and
the levels of the threshold.
The value of using the threshold is that the feedback is generally less intrusive, freeing you to focus
on your direct experience. The feedback only comes in when you've drifted out of your desired
psychophysiological zone.
The audio files can be found in a folder named 'media' in the breathing designs sub-folder (i.e.
generally speaking C:\Program Files\BioEraPro\design\YBF\Breath\media\ ). There are three files,
named '1.wav', '2.wav' and '3.wav'. If the threshold condition is set to 'outside' and the upper
threshold is exceeded, then file '2.wav' is played, or else if the lower limit is crossed then file '3.wav'
is played. For all other threshold conditions, file '1.wav' is played.
You can have the application play sounds of your choice by simply substituting these files with your
own. For example you could record a message in your own voice. There are lots of programs that
you can use to do this, such as “Audacity”, a freeware application. Your recording needs to be saved
in WAV format.
4.2 Support Window
Figure 9 shows the support window. It displays the raw temperature signal together with various
aspects of the breath detection method (see section 3.1). The support window allows you to check
the breathing calibration is ok, but for the most part you shouldn't need it.
The two lamp displays at the bottom (shown turned off) will flash briefly whenever the application
detects (i) beginning of the exhalation (left), and (ii) beginning of the inhalation (right).
Press the 'Calibrate' button to recalibrate the breath as described in section 3.1.
Basic Breathing Application User Guide, copyright Glyn Blackett
page 11
Basic Breathing Application User Guide, copyright Glyn Blackett
page 12
5 Session Reports
The application records data so that you can generate a report for your sessions. The report contains
summary data and graphs showing the progression of the feedback parameters over the whole
session. (Note that during the first 25 seconds of the session, data are not written – it is likely to be
inaccurate anyway due to the breath calibration process.)
To generate and open a session report, click the button labelled 2 in figure 1. A dialog window
opens in which you can select various options (see figure 10).
The software creates the report in html format. It will be opened using your computer's default web
browser, e.g. Internet Explorer. (Note that a live internet connection is not needed.) The html file is
saved, so you can for example email it to someone. See the Installation and Set-up Guide for details
of file storage.
5.1 Report Options
Most of the options should be self-explanatory.
If you change your mind about options on seeing your report, you can regenerate the report by
clicking the report button (2 in figure 1), then checking 'Overwrite existing report' (top left in the
dialog).
Combo box controls allow you to set maximum values for breathing rate and I:E ratio. Setting a
maximum is a basic way of excluding “artefacts”, for example if you sniffed causing a breathing
rate calculation much higher than baseline.
5.2 Adding Notes to a Report
You can choose to write some notes for your session report. Checking 'Add notes to report' (top
right of the dialog) allows you to do this.
You may wish to add notes after having first seen the report. In this case, simply click the button (2
in figure 1) again, and check the Add notes option. This will regenerate the report with your added
notes.
Basic Breathing Application User Guide, copyright Glyn Blackett
page 13
5.3 Sample Session Report
Training Session Report
Breathing Summary Data
Parameter
Mean
Max
Breathing Rate
7.2 bpm 11.5 bpm 4.8 bpm 1.5 bpm
I:E Ratio
1.01
1.44
Basic Breathing Application User Guide, copyright Glyn Blackett
Min
0.78
S.D.
0.12
page 14
6 Application Report
An application report summarises all the sessions for the currently selected user, in charts and a
table.
To generate and open an application report, click the button labelled 3 in figure 1. A dialog window
opens in which you can select various options (see figure 11).
As with session reports, the software creates the application report in html format. It will be opened
using your computer's default web browser, e.g. Internet Explorer. (Note that a live internet
connection is not needed.) The html file is saved, so you can for example email it to someone. See
the Installation and Set-up Guide for details of file storage.
6.1 Report Options
The application report options dialog is an adapted version of the session report options dialog.
Many of the options are the same, and should be self-explanatory. See section 5.1 above.
As with all of the application reports in the suite, there is a chart for each of the main parameters
tracked in the application – in the case of the breathing application that means breathing rate and
inhalation to exhalation ratio. For each chart you can opt for line graphs for the maximum,
minimum and mean. The line graphs have one point per session.
Basic Breathing Application User Guide, copyright Glyn Blackett
page 15