1
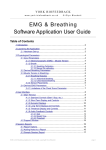
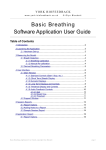
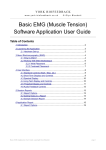
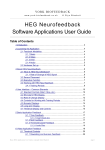
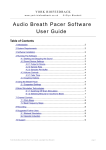
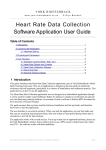
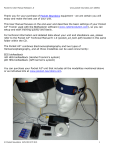
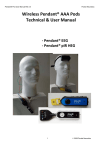
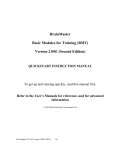
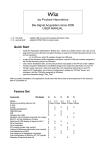
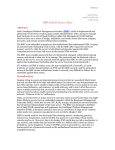
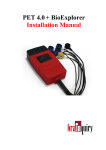
YORK BIOFEEDBACK
w w w. yo r k - b io f e e d b a c k . co . u k
© Glyn Blackett
HEG Neurofeedback with Breathing
Software Application User Guide
Table of Contents
1 Introduction.......................................................................................................2
2 Launching the Application.................................................................................3
2.1 Hardware Set-up...................................................................................3
3 Physiological Parameters..................................................................................4
3.1 Breathing..............................................................................................4
3.1.1 Breathing Calibration................................................................4
Manual Re-calibration..........................................................................4
3.1.2 Derived Breathing Parameters..................................................5
3.2 HEG......................................................................................................5
3.2.1 HEG Rate of Change................................................................6
3.2.2 Sensor Placement....................................................................6
3.2.3 Executive Function...................................................................6
3.2.4 Working with HEG Neurofeedback...........................................7
4 User Interface...................................................................................................9
4.1 Main Window........................................................................................9
4.1.1 Standard Controls (Start / Stop, etc.)........................................9
4.1.2 Short-term HEG Display.........................................................10
4.1.3 Rate of Change Display..........................................................11
4.1.4 Numeric Displays....................................................................12
4.1.5 Breath Display........................................................................12
4.1.6 Long-term Display...................................................................13
4.1.7 Threshold Displays and Controls............................................14
4.1.8 Audio Feedback......................................................................15
Midi.................................................................................................... 15
Breath Tone........................................................................................ 16
Threshold...........................................................................................17
4.2 Support Window.................................................................................18
5 Session Reports..............................................................................................19
5.1 Report Options....................................................................................19
5.2 Adding Notes to a Report....................................................................19
5.3 Sample Session Report......................................................................20
6 Application Report...........................................................................................22
6.1 Report Options....................................................................................22
HEG & Breathing Application User Guide, copyright Glyn Blackett
page 1
1 Introduction
This guide introduces the Hemoencephalography (HEG) Neurofeedback with Breathing application,
part of York Biofeedback's Mind-Body Training Tools suite. This set of applications is designed to
develop skills in mind-body awareness and self-regulation, particularly in a context of mindfulness
and meditation practice.
The guide has two purposes: firstly to explain what HEG actually is, and secondly to teach you how
to use the software – though it is more of a reference than a tutorial. Other training material is
available on the York Biofeedback website (address above).
HEG is a way of measuring changes in the brain's metabolic (energy-consuming) activity. The brain
consumes more energy when you engage in mental activities that require focus. HEG
neurofeedback is thus a means of training or exercising the brain at a physiological level, with the
aim of boosting mental performance and emotional balance. Neurofeedback training seems to
induce lasting change – it stimulates neuroplasticity in the brain.
Typically the HEG sensor is positioned over the forehead, where it monitors the Prefrontal Cortex
(PFC). This region of the brain is heavily involved in executive function (described in section 3.2.3).
If you're new to HEG neurofeedback, I suggest the basic HEG neurofeedback application is the
place to start. The HEG neurofeedback with breathing application offers some of the same
capability, but I designed it to be more directly relevant to mindfulness practice by monitoring both
breathing and brain state changes. The feedback is designed firstly to help you focus on the breath,
and secondly to flag drops in brain activation, which I see as opportunities for distractions to arise.
In other words the feedback cues you to intensify your awareness at these times, so that you don't
drift towards sleepiness, dullness, agitation, etc.
Whilst training brain activity should support mindfulness practice, it is a means to an end, not an
end in itself. I designed the software so that the feedback should enhance your subjective awareness
rather than detract from it.
The guide assumes that you have read the Software Installation and Set-up Guide, and therefore
know how to start the application.
The application works with several devices. For an up to date list of supported hardware, please see
the York Biofeedback website.
HEG & Breathing Application User Guide, copyright Glyn Blackett
page 2
2 Launching the Application
1
2
3
Figure 1 – HEG Neurofeedback Tab of the Platform Application
Figure 1 above shows the HEG Neurofeedback tab of the Platform application. Press the button
labelled 1 to launch the application. Make sure you have your BioEra licence key (dongle) inserted
into a USB socket. After a few seconds two new windows will appear on your screen.
2.1 Hardware Set-up
The physical aspects of hardware set-up (how to connect and use your sensors, etc.) are dependent
upon the type of amplifier you are using, and are covered in a separate document (Hardware Set-up
Guide).
Before you start the application you configure the device set-up
options, accessible by clicking a button in the Set-up tab of the
Platform. In the dialog, select the type of amplifier (biofeedback
device) you are using, in both the HEG and the breath source
controls. Note, all the source settings are remembered the next
time you start the Platform. See the Installation and Set-up Guide
for further details of device set-up.
Figure 2 – amplifier status
You may select 'Simulator' in each of the source controls. In
simulator mode, you can learn how to use the software without
the encumbrance of actually sampling the breath. (The application simply uses recorded data as a
source.)
Once you have started the application, you should see this choice reflected in the device status
display in the top right corner of the main window (see figure 2). The lamp (shown as a red square
in figure 2) should change to green when you press the play button. If you do not see this happen, it
means that the application has not been able to establish a connection with your device. Check it is
plugged in and that the batteries are not flat.
For some devices, you'll see a button rather than just text. Pressing this button opens up a dialog
that allows you to adjust settings related to the device, such as COM port. The specifics depend on
HEG & Breathing Application User Guide, copyright Glyn Blackett
page 3
the device – see the Hardware Set-up Guide for more details.
If you're using different devices for measuring HEG and breath, you'll see two buttons (labelled '1'
and '2', and also two lamps. Clicking the buttons allows you to configure device settings – '1' for the
HEG device and '2' for the breath device. For some device types there are no settings to configure
so the buttons are inactive. Again the lamps should turn green when the devices start (the left for the
HEG device and the right for the breath device).
3 Physiological Parameters
This section describes the physiological parameters that the application measures, namely breath
and HEG.
3.1 Breathing
The breath sensor is actually a temperature sensor placed just below the nostril. From the changing
temperature of inhaled and exhaled air, the system is able to detect the turning points of the breath
and therefore derive breathing rate. This method depends on a reasonable current of air coming
through the nostril. It should still work if you breathe with your mouth open as long as your nose is
not completely blocked. Speech will disrupt the normal air current, and will give rise to unreliable
breathing calculations.
3.1.1
Breathing Calibration
The breath detection method requires a short period of time to calibrate to your breath. This
happens automatically during the first 20 seconds of any session (i.e. after you press 'play'). It's
important that you breathe naturally and evenly, and not too slowly, through the nose, during this
time. Note that the breath signal will not display properly until proper calibration is established.
Manual Re-calibration
If for any reason you lose reliable breath detection during a session (e.g. you have to remove and
reattach the sensor) there is a way to recover: in the support window, there is a button labelled
'Calibrate', that you simply press. You should breathe naturally and evenly and not too slowly for a
few breaths prior to pressing. If this doesn't work you can stop and restart the application. Generally
the breath detection once established is very reliable and you should not need to re-calibrate during
normal use.
Figure 3 shows you what a well-calibrated breath signal looks like (in the support window). The
upper trace is the temperature of inhaled / exhaled air, while the middle trace is its first derivative or
gradient. The yellow dotted lines are thresholds used for the detection of the breath turning points.
They should be reasonably far apart, but close enough to the centre that the trace will easily and
consistently cross to register a turning point.
HEG & Breathing Application User Guide, copyright Glyn Blackett
page 4
Figure 3 – A well-calibrated breathing signal
3.1.2
Derived Breathing Parameters
From the detection of the breath turning points, the software calculates:
• Breathing rate, and average breathing rate (the averaging period is 1 minute).
• The ratio between the (durations of the) inhalation phase and exhalation phase of the breath.
This is shortened to 'I:E Ratio' (or simply 'I:E'). A 1-minute average is also calculated.
These two are shown in the long term display (see section 4.1.6 and figure 8), and can be used as
the basis of audio feedback (section 4.1.8). They are also shown in the numeric displays (see section
4.1.4).
3.2 HEG
HEG is a way of measuring changes in the brain's metabolic activity. There are two forms of HEG
sensor, known as nIR (near infra-red) and pIR (passive infra-red). The former was developed by Dr
Hershel Toomim and the latter by Dr Jeffrey Carmen. For the purposes of training they seem to be
largely equivalent, and the software works with both types. In either case the sensor detects changes
in blood flow and metabolic activation (these two being tightly coupled in the brain). Again in
either case, the sensor detects activity only in the outer region of the brain (known as the cortex),
and only from an area close to the sensor.
By 'metabolic activity' I mean energy-consuming processes in brain cells. The brain consumes more
energy when you engage in mental activities that require focus. HEG neurofeedback is thus a means
of training or exercising the brain at a physiological level, with the aim of boosting mental
performance and emotional balance. In HEG neurofeedback we train the signal upwards (not
downwards).
HEG & Breathing Application User Guide, copyright Glyn Blackett
page 5
Typically the HEG sensor is positioned over the forehead, where it monitors the Prefrontal Cortex
(PFC). This region of the brain is heavily involved in executive function – described more fully in
section 3.2.3. Thus HEG is a vehicle for training executive function.
3.2.1
HEG Rate of Change
The absolute value of the HEG signal is of little relevance – we can't infer anything about brain
state from it. Rather, it is changes in the HEG reading that count. To repeat: when the HEG signal
increases we infer the brain became more active. For this reason it is useful to calculate the rate of
change of the HEG signal. Much of the feedback in the application is actually based on this
calculation – for example see section 4.1.8 (on audio feedback) below.
The rate of change is equivalent to the slope or gradient of the HEG graph.
A zero rate of change means that the HEG reading is stable or unchanging, and that the brain is
maintaining its energy level, without either increasing or decreasing it. This state doesn't tend to last
very long!
When the brain is activating, the rate of change is above zero (the HEG signal is increasing) and the
higher the rate of change the stronger the activation.
When the brain is becoming less energetically active, the rate of change is less than zero, or
negative. (The HEG signal is falling.)
3.2.2
Sensor Placement
The standard location for the sensor is the centre of the forehead. The region of the brain behind this
point is a particularly important are known as the Prefrontal Cortex (PFC). The PFC has been
described as the brain's executive control centre. Its functions are discussed in the following section.
You could use any other site on the scalp for HEG neurofeedback, but I advise you to know what
you are doing if you decide to move away from the centre of the forehead. It's possible that you
could unwittingly train an unhelpful imbalance. Also note that hair blocks the signal – in other
words the sensor cannot see through hair.
3.2.3
Executive Function
To summarise, HEG neurofeedback trains up increased activity in a key brain region, the PFC.
More highly evolved in humans than in any other species, the PFC endows us with our uniquely
human abilities, traits and intelligences – a set of skills known in neuroscience as executive
function, and including:
• The ability to hold the mind steady in its focus.
• Body regulation – by modulating the Autonomic Nervous System (ANS) the PFC influences
many of the body's automatic visceral responses.
• Emotional balance – the ability to temper over-arousal and over-stimulation, and to summon
and maintain energy and clarity in the absence of external stimulation. Also the ability to
modulate emotion-triggering signals coming from other brain regions such as the amygdala
(which triggers fear and anger).
• Motivation and emotional drive – the ability to formulate values, goals and purposes.
• The ability to formulate a considered plan of action, and to hold to it in the face of
distractions, as well as to update it appropriately. The ability to check impulsiveness.
• Empathy – the ability to appreciate the minds of other people, and to understand how our own
behaviour impinges upon them. Ultimately this includes our moral awareness.
HEG & Breathing Application User Guide, copyright Glyn Blackett
page 6
PFC functioning has been found to be compromised in several emotional and neurological
disorders, including depression and ADHD. HEG neurofeedback can be used therapeutically with
these disorders, but you don't have to have a disorder to benefit – HEG neurofeedback is an optimal
performance training tool.
Data suggests HEG neurofeedback produces lasting benefits – it's thought that it stimulates
structural change in the brain. In other words it stimulates the brain's neuroplasticity.
3.2.4
Working with HEG Neurofeedback
This section gives some guidelines on how to direct and apply the mind in order to increase the
HEG signal (measured at the forehead).
Aim to feel intensely awake, alert and present. Imagine that something very significant is about to
happen, something that you'll want to remember all your life. The mind is rapt, poised, expectant,
with all the senses “peeled”, and yet calm and still.
Your intent is to move the graph upwards. Imagine that you could move it by the power of your
intent, as though you had a psychic power. A useful metaphor can be found in the “Star Wars” series
of films, in which Jedi knights such as Luke Skywalker learn to to channel the mystical “force”.
You need some emotional commitment behind your intent. You have to really want that graph to
move upwards. And yet this motivation must remain positive – if it tips over into frustration or selfcriticism or “performance anxiety” then this will work against you. Don't be overly attached to the
outcome of your exertions. Appreciate that your brain has limitations. The graph will not always
head upwards – at times your brain will tire. Take mini-breaks when you need to, then re-engage
your intent.
On the other hand, the occasions at which the graph drops are your working ground, or your
learning ground. With practice you'll learn to turn them around so that the HEG signal quickly
returns to increase.
What kind of influences cause the HEG signal to drop? In my experience there are two main ones:
• The mind becomes bored or fatigued, and drifts into a slothful, low-energy or even sleepy state.
• Negative emotion, perhaps triggered by a passing thought or memory, or perhaps by a negative
judgement of your own performance.
In either case, the practice is to rebalance the brain as quickly as possible.
Sometimes the signal begins to fall, but you're not consciously aware of any reason for it (neither of
the above two seem to apply). I think it's best to understand these occasions as openings for
distraction – if you let the trend continue unchecked for long, the mind will drift into some form of
distraction, but if you respond and turn the signal round, no problem.
Responding to mild boredom often isn't easy. Looking at a line on a computer screen is inherently a
pretty boring situation. I think this is an important part of the context for training. You have to
generate the arousal internally, not rely on the external stimulation. If you were watching a really
interesting film, it might be a lot easier to maintain brain activation, but you're probably already
good at that and don't need to practise. On the other hand you don't need to focus exclusively on the
graph – you can broaden your focus out to include your environment, and other sensory channels
besides vision, as long as you can maintain your intent.
Be careful not to over-train. As with physical exercise, there is a window of opportunity for change
– not enough effort, and nothing really changes in the longer term, but over-do it and you risk
fatiguing the brain and perhaps giving yourself a headache. However there is no reason to think that
over-training can cause lasting problems.
In the very early days of training, I suggest no more than five minutes of active training at a time,
HEG & Breathing Application User Guide, copyright Glyn Blackett
page 7
but you can probably quite quickly build up to 20 minute sessions or longer, though it is reasonable
to take rests during this time.
Remember that HEG neurofeedback sessions are about exercising the brain. If brain activation
increases but then falls back again – well you've still exercised the brain. Compare it to lifting
dumbells – you have to lower them back again. In other words, achieving a net increase over the
course of a HEG training sessions is not the important thing. Don't get overly focused on the
numbers. You can assume that if you practise (exercise) regularly, neuroplastic changes will happen
in the brain automatically in the longer term.
My design intent has been to support mind training (not simply brain training), by enhancing and
augmenting your subjective awareness, rather than detracting from it. This is another reason not to
get overly focused on the feedback or overly goal-oriented with respect to the feedback. Instead find
a way for the feedback to enhance your subjective awareness. In practice this means letting the
feedback be more in the background of your broad awareness. Audio feedback is useful in this
regard as it allows you to practise without watching the screen.
Keep emotionally positive as much as you can, or at least avoid falling into negative emotions.
Getting frustrated when the signal doesn't go up, and getting anxious if it doesn't go up or you think
you can't make it go up, are two traps that can cause drops in the signal.
Another point worth making is that, in the context of training it is sometimes enough just to
maintain the brain's energy level, without needing to increase metabolic activity. (Of course there is
ultimately a ceiling to the HEG signal – it can't keep on increasing for ever more.) In other words,
training is about avoiding drops rather than achieving gains.
HEG & Breathing Application User Guide, copyright Glyn Blackett
page 8
4 User Interface
When you first start the application from the Platform, you will see two windows. The main
window is shown in figure 4 below, while the support window is shown later (figure 10).
The support window allows you to check that breath detection is working properly (see the
discussion of breath calibration in section 3.1.1). I expect that most users will rarely need to make
reference to it.
1. Standard controls
2. Short-term
HEG display
3. Rate of change display
3. Breath
display
8. HEG
threshold
controls
4. Breathing
threshold
controls
7. Numeric
displays
6. Long term display
5. Audio feedback controls
Figure 4 – User interface
4.1 Main Window
This section explains the controls in the main window, how to configure feedback.
4.1.1
Standard Controls (Start / Stop, etc.)
A set of buttons – Play, Stop and Pause – are the same in all the applications in the suite. They
should be self-explanatory.
The 'Epoch' control sets the time period at which data is written to the session data file. This data
file is used to generate session reports, which are described in section 5 below. For the HEG
application, only HEG data is written. Choosing a lower time period generates more data. For
example, if you select 2 seconds, then the application will write HEG readings to the session data
file once every two seconds.
The button marked with a red asterisk is a simple event marker. You can use it to mark adventitious
happenings and changes in session conditions (e.g. you turn on or off breath pacing). It is
particularly useful for coaches and therapists. Events thus marked are represented in the long term
HEG & Breathing Application User Guide, copyright Glyn Blackett
page 9
chart (see section 4.4 below) by a vertical white line. They are also recorded in the session data file
and are shown in session report charts (as dotted vertical lines) (see section 5).
Note that pressing the escape key during a session has the same effect as pressing the red asterisk
with your mouse (i.e. it is an alternative).
4.1.2
Short-term HEG Display
1
2
3
Figure 5 – Short-term HEG display
The chart in figure 5 above shows the progression of the HEG signal over the short term. Note this
chart operates in auto-centre mode. The trace will be continually adjusted so that it's (most recent)
right hand section displays in the middle of the vertical range.
The three (sometimes four) combo-box controls, positioned below the chart and described in the
following table, can be used to configure this chart.
Average
Controls the level of smoothing of the HEG signal. With a shorter average you will
see all the fine-grained changes. With a longer average these are smoothed out, but
the signal will be slower in responding to change.
Range
Controls the vertical scale of the display, or the difference between the upper and
lower limits of the vertical axis.
Note that in auto-centre mode, the scale is fixed but the actual upper and lower
limits are constantly changing.
Selecting 'Auto' produces a different behaviour: the system will automatically
calculate the best range to best fit the chart based on the variation over the period
of the chart. In this case the range will not stay fixed but will vary over the session.
Period
This controls the length of time it takes for the traces to traverse the whole chart
from right to left – or in other words the horizontal range.
HEG & Breathing Application User Guide, copyright Glyn Blackett
page 10
Note that increasing the period after processing has started can have unpredictable
consequences, so I recommend you make your selection before pressing play.
Unit
4.1.3
Only available for some device types. Select either Fahrenheit or Celcius as the
unit (of infra-red temperature). This applies to all the displays, not just the shortterm HEG chart.
Rate of Change Display
1
2
3
Figure 6 – HEG rate of change display
This chart (figure 6) shows the HEG rate of change, or in other words the gradient or slope of the
HEG trace shown in the short-term HEG chart (section 4.1.2 above). The central horizontal line is
zero. When the trace goes above this line, it means the HEG signal is increasing and its colour is
green. When the trace falls below the line it means the HEG signal is falling and its colour changes
to red. The further away from the zero line, the faster the HEG signal is changing.
Since the goal of training is to increase or at least maintain the HEG reading, you should aim to
keep this graph “in the green” as much as possible.
The bar graph at the right of the display shows the current rate of change – this chart always has the
same scale as the adjacent chart.
The three combo-box controls, positioned below the chart and described in the following table, can
be used to configure this chart.
Rate of
Change Avg
Controls the level of smoothing of the signal. With a shorter average you will see
all the fine-grained changes. With a longer average these are smoothed out, but the
signal will be slower in responding to change.
I suggest a setting of 10 seconds as a starting point.
Sensitivity
Controls the vertical scale or range of the display. With a higher sensitivity setting,
HEG & Breathing Application User Guide, copyright Glyn Blackett
page 11
the range will be smaller, so changes will appear more prominently.
The zero line is always fixed in the centre of the chart.
If the trace tends to disappear off the top or bottom of the chart, choose a lower
sensitivity. Conversely if the trace is bunched tightly around the zero line, choose a
higher sensitivity.
Period
This controls the length of time it takes for the traces to traverse the whole chart
from right to left – or in other words the horizontal range.
Note that increasing the period after processing has started can have unpredictable
consequences, so I recommend you make your selection before pressing play.
4.1.4
Numeric Displays
1
2
3
4
Figure 7 – Numeric displays and associated controls
The numeric displays (figure 7) are situated at the bottom of the main window above the audio
feedback controls. They should be mostly self-explanatory except for these:
Baseline
The HEG reading at the beginning of the session, or more precisely 30 seconds
into the session (to allow a settling period).
Reset BL
Pressing this button resets the baseline to the current HEG reading.
Gain
Current HEG reading minus the baseline. This allows you to assess the overall
change achieved in your session. (Note the overall gain does not necessarily reflect
the worth of the training session. If it is low it doesn't mean you didn't do useful
work.)
Averages are calculated over 60 seconds.
4.1.5
Breath Display
This is simply shows a bar graph of the breath (see 3 in figure 4 above). The bar increases in height
during inhalation and drops back again during exhalation. The signal is automatically calibrated so
it will fit to the chart; each breath begins at the same place. During the initial calibration phase (see
section 3.1.1) the chart will not display properly. If it doesn't look right after this, the system may
not have calibrated to your breath properly (you can recalibrate the breath signal – see section
3.1.1).
HEG & Breathing Application User Guide, copyright Glyn Blackett
page 12
4.1.6
Long-term Display
1
2
3
Figure 8 – Long-term displays
Figure 8 shows the variation of the parameters (HEG, breathing rate and I:E ratio) in the longer
term (five minutes and upwards). Like the short-term display this chart operates in auto-centre
mode. The trace will be continually adjusted so that it's (most recent) right hand section displays in
the middle of the vertical range. Click on the coloured squares (top left) to select which parameter
scale is displayed. There are three associated combo-box controls (labelled 1 to 3 in figure 8).
HEG
Controls the vertical scale of the (upper) HEG chart, or the difference between the
upper and lower limits of the vertical axis. Click the orange square (upper left of
chart) to see this scale displayed on the chart's vertical axis.
In auto-centre mode the scale is fixed, but the actual upper and lower limits are
constantly changing.
Selecting 'Auto' produces a different behaviour: the system will automatically
calculate the range to best fit the chart based on the variation over the period of the
chart. In this case the range will not stay fixed but will vary over the session.
BR Range
Controls the vertical range of the blue breathing rate trace in the lower chart.
Make this range larger if the blue trace appears to be off the top of the chart. You
can reduce it for greater sensitivity, as your breathing slows down.
Period
Controls the horizontal (time) range – in other words how long it takes the trace to
traverse from right to left.
Note that increasing the period after processing has started can have unpredictable
consequences, so I recommend you make your selection before pressing play.
The red I:E ratio trace has a fixed range of 0 to 2. The bold line in the centre of the chart is at 1.0,
meaning that when the red trace is below the line, the exhalation phase lasts longer than the
inhalation phase (usually desirable).
HEG & Breathing Application User Guide, copyright Glyn Blackett
page 13
4.1.7
Threshold Displays and Controls
The essence of threshold-based feedback is that
a discrete feedback event (such as a bell-ring) is
triggered whenever the feedback parameter
exceeds some limit. The value of using the
threshold is that the feedback is generally less
intrusive, freeing you to focus on your direct
experience. The feedback only comes in when
you've drifted out of your desired
psychophysiological state.
In the HEG Neurofeedback with Breathing
application there are two threshold displays, one
for HEG and one for breathing rate. They are
situated at either side of the long term display
(HEG to the left, 8 in figure 4, and breathing rate
to the right, 4 in figure 4). The HEG threshold
display and controls are shown in figure 9 – the
other threshold is functionally similar.
1
2
3
3
The HEG threshold is based on the rate of
6
7
4
5
change, as in the Basic HEG application. The
control settings for the HEG Rate of Change
Figure 9 – Threshold displays and controls
display (see section 4.1.3 above) apply to the
threshold signal too – the averaging is the same
and the range of the bar graph (sensitivity) is the same as the rate of change chart.
For the breathing rate threshold, the range of the bar graph is the same as that of the long term
display (set using combo box 2 in figure 8).
For this application the main feedback event is a sound such as a bell-ring, but also the lamps light
up (3 in figure 9, not lit in this case). (Audio aspects of threshold-based feedback are covered in
section 4.1.8 below.)
The bar graph has either one or two movable levels (two are shown in figure 9, labelled 1 and 2)
which define the threshold limits. To change these limits simply drag the bars with your mouse. The
numeric displays 4 and 5 show the settings.
You can set different conditions to be met for the threshold event to be triggered, via the combo box
control (6 in figure 9). The options are listed in the table below.
Between
Two limits are used; the condition is met whenever the parameter is both below the
upper limit and above the lower limit.
Outside
Two limits are used; the condition is met whenever the parameter is either above the
upper limit or below the lower limit.
Above
A single limit is used; the condition is met when the parameter is above this.
Below
A single limit is used; the condition is met when the parameter is below this.
Off
The threshold will not be active. Use this option if you're only interested in one of the
two thresholds (i.e. turn the one you're not interested in off).
The HEG threshold has an additional control (7 in figure 9) which allows you to say that feedback
HEG & Breathing Application User Guide, copyright Glyn Blackett
page 14
should be triggered only if the threshold condition is met for a certain period of time. This is a way
of in effect, filtering out fluctuations of brief duration, which you may not consider as significant –
especially if you have a relatively low level of averaging. The control sets the length of time needed
to trigger feedback. If you don't want to use this feature, leave it set at zero.
As an example of how you might use threshold-based feedback, suppose you wish to maintain a
steady breathing rate of around 6 breaths per minute, while at the same time keeping a steady level
or increase in the HEG signal. First, set the HEG threshold to warn you if the HEG signal starts to
decrease – set the condition to 'below' and drag the (single) level to around zero. Second, set the
breathing rate threshold feedback (right side) to inform you if the breath is either too fast or too
slow – set the condition to 'outside', then drag the threshold levels so that the upper is say around 7
bpm and the lower is say around 5 bpm.
4.1.8
Audio Feedback
1
2
3
4
5
6
7
8
Figure 10 – Audio feedback controls
Audio feedback allows you to use the application with eyes closed – useful in meditation practice.
You can choose how much and how often the feedback is activated, and thus how intrusive it is. The
controls (figure 9) are found at the bottom of the main window.
There are three forms of audio feedback available. With each, you can choose which physiological
parameter to base the feedback on.
Each has an on/off button (appearing as green triangles 2,5 & 7 in figure 9, but switching to red
squares when the feedback is turned on). Each also has an independent volume control (sliders 3, 6
and 8 in figure 9) graded on a scale of 0-100.
For midi and breath tone feedback, it is necessary to use a range of the feedback parameter, just as
for graphical feedback. The range defines what values of the parameter correspond to the highest
and lowest notes available. Rather than creating separate controls, the ranges are taken from the
graphical range controls – details are given below.
Midi
When midi feedback is turned on, a musical note is played repeatedly, whose pitch varies with the
chosen feedback parameter.
The combo box (1 in figure 9) controls the parameter used as the basis of midi feedback. You can
choose from those listed in the table below. Note that changing the selected parameter causes the
application to restart processing, so it is better to make your choice before you start your session.
The pitch varies over a parameter range set by other controls – see the table below for details.
HEG
When the HEG signal rises, the midi note rises in pitch. Notes are played
every half-second.
The pitch range is mapped to the parameter range defined by the 'Range'
control in the short term display (2 in figure 5).
The midi feedback has an “auto-centre” feature, analogous to that of the shortterm HEG display. This means that when the HEG signal change has been
large enough that the midi note reaches either its highest or its lowest pitch,
HEG & Breathing Application User Guide, copyright Glyn Blackett
page 15
then pitch is recalibrated so that the current HEG reading gives a note right in
the middle of the pitch range.
Breathing Rate
The faster the breathing, the higher the pitch of the midi notes.
One note is played for each breath. The trigger is the beginning of the
inhalation. The note reflects the duration last breath completed.
The pitch range is mapped to a parameter range defined by the breathing rate
range control in the long term chart (2 in figure 8) (actually this sets the upper
limit, while the lower limit is fixed at 3.0 bpm).
HEG Threshold
HEG rate of change controls the pitch – the faster the rate of change the higher
the pitch. The pitch range is mapped to the parameter range defined by the two
(HEG) threshold levels. The advantage of this option is that it allows you to
precisely control the parameter range and thus the sensitivity of the feedback,
by moving the threshold levels.
This only makes sense if you have two threshold levels visible, so you should
select 'outside' for the threshold condition (control 2 in figure 7).
Inverse HEG Thr. This option works in the same way as the above (HEG threshold) except that
the faster the rate of change, the lower the pitch (i.e. the mapping between the
parameter range and the pitch range is inverted).
BR Threshold
Again breathing rate controls the pitch, as in the breathing rate option above,
but this time the parameter range over which the pitch varies is controlled by
the breathing rate threshold levels (analogously to the HEG threshold option
above).
You can set some options for midi feedback, notably the instrument (piano by default) from the
Platform (i.e. before starting the application). See the Installation and Set-up Guide for further
details.
Breath Tone
A tone is played which follows the breath. The pitch gently ascends and descends in pitch for each
inhalation / exhalation respectively. (Each breath has a relatively narrow range in pitch.) The tone
sounds during the movement of the breath, and falls silent at the turning points. This form of
feedback is very useful if you are using the breath as your point of focus.
At an overarching level, the pitch varies with the selected feedback parameter – the lower the
parameter value, the deeper the pitch.
A combo box control (4 in figure 9) allows you to choose which parameter to use as the basis of
feedback. Note that changing your selection forces the application to restart processing. The choices
are listed in the following table.
HEG Threshold HEG rate of change controls the pitch – the faster the rate of change the higher
the pitch. The pitch range is mapped to the parameter range defined by the two
(HEG) threshold levels. The advantage of this option is that it allows you to
precisely control the parameter range and thus the sensitivity of the feedback,
by moving the threshold levels.
This only makes sense if you have two threshold levels visible, so you should
select 'outside' for the threshold condition (control 2 in figure 7).
The rate of change is averaged over the course of a breath, then this value is
HEG & Breathing Application User Guide, copyright Glyn Blackett
page 16
used to calculate the pitch for the next breath.
This option is designed to help you focus on the breath at the same time as
having the feedback warn you when the brain begins to deactivate.
Inverse HEG
Threshold
This option works in the same way as the above (HEG threshold) except that
the faster the rate of change, the lower the pitch (i.e. the mapping between the
parameter range and the pitch range is inverted).
I personally find the inverse option to be more natural – when I'm doing well,
the pitch is low, which I find more aesthetically pleasing.
Breathing Rate The faster the breathing, the higher the pitch of the midi notes.
The breathing rate calculated for one breath is used to determine the pitch of the
tone over the next breath.
The pitch range is mapped to a parameter range defined by the breathing rate
range control in the long term chart (2 in figure 8) (actually this sets the upper
limit, while the lower limit is fixed at 3.0 bpm).
BR Threshold
Again breathing rate controls the pitch, as in the breathing rate option above,
but this time the parameter range over which the pitch varies is controlled by
the breathing rate threshold levels (analogously to the HEG threshold option
above).
Threshold
Threshold-based feedback was introduced in section 4.1.7 above.
When this option is activated, a sound is played whenever either of the threshold conditions is met.
You can choose to deactivate either of the thresholds, so that the feedback sound only relates to one.
You can configure the two thresholds as described in section 4.1.7. To summarise, you can set the
threshold condition (e.g. above or below the level) and also drag the bars in the display to control
the threshold limits.
The value of using the threshold is that the feedback is generally less intrusive, freeing you to focus
on your direct experience. The feedback only comes in when you've drifted out of your desired
psychophysiological zone.
For the sound, the software actually plays back a recorded file. This is one of a set of files found in
the 'media' folder in the HEG with Breathing designs sub-folder (i.e. generally speaking C:\Program
Files\BioEraPro\design\YBF\HEG_Breathing\media\ ). There are six files, named '1.wav', '2.wav'
and '3.wav', etc. – 1 to 3 apply to the HEG threshold while 4 to 6 apply to the breathing rate
threshold.
If the HEG threshold condition is set to 'outside' and the upper threshold is exceeded, then file
'2.wav' is played, or else if the lower limit is crossed then file '3.wav' is played. For all other
threshold conditions, file '1.wav' is played. If the breathing rate threshold is set to 'outside' and the
upper threshold is exceeded, then file '5.wav' is played, or else if the lower limit is crossed then file
'6.wav' is played. For all other threshold conditions, file '4.wav' is played.
You can have the application play sounds of your choice by simply substituting these files with your
own. For example you could record a message in your own voice. There are lots of programs that
you can use to do this, such as “Audacity”, a freeware application. Your recording needs to be saved
in WAV format.
HEG & Breathing Application User Guide, copyright Glyn Blackett
page 17
4.2 Support Window
Figure 10 shows the support window. It displays the breath's (air) temperature signal together with
various aspects of the breath detection method (see section 3.1.1).
The two lamp displays at the bottom (black squares in the figure as they are turned off) will flash
briefly whenever the application detects (i) beginning of the exhalation (left lamp), and (ii)
beginning of the inhalation (right lamp).
Press the 'Calibrate' button to recalibrate the breath as described in section 3.1.1.
Figure 11 – support window. The charts show aspects of the calculation of the breath's turning
points. In the bottom left is the button used to recalibrate the breath (see section 3.1.1).
HEG & Breathing Application User Guide, copyright Glyn Blackett
page 18
5 Session Reports
The application records data so that you can generate a report for your sessions. The report contains
summary data and graphs showing the progression of the feedback parameters over the whole
session.
Note that the HEG data in the session data file is averaged according to the setting of the short-term
HEG display (control 1 in figure 5).
To generate and open a session report, click the button labelled 2 in figure 1. A dialog window
opens in which you can select various options (see figure 11 below).
The software creates the report in html format. It will be opened using your computer's default web
browser, e.g. Internet Explorer. (Note that a live internet connection is not needed.) The html file is
saved, so you can for example email it to someone. See the Installation and Set-up Guide for details
of file storage.
Figure 12 – Report options
5.1 Report Options
Most of the options should be self-explanatory.
If you change your mind about options on seeing your report, you can regenerate the report by
clicking the report button (2 in figure 1), then checking 'Overwrite existing report'.
Options relating to either HEG data or breathing data are found under separate tabs.
Combo box controls allow you to set maximum or minimum values for several of the parameters.
Setting these limits is a basic way of excluding “artefacts”, for example if you moved during the
session, so that the flow of air over the HEG sensor caused cooling. Data points outside these limits
are excluded.
5.2 Adding Notes to a Report
You can choose to write some notes for your session report. Checking 'Add notes to report' (top
right of the dialog) allows you to do this.
You may wish to add notes after having first seen the report. In this case, simply click the button (2
in figure 1) again, and check the Add notes option. This will regenerate the report with your added
notes.
HEG & Breathing Application User Guide, copyright Glyn Blackett
page 19
5.3 Sample Session Report
Training Session Report
Training Application
HEG Neurofeedback with Breathing
User Name
Default User
Session Date
28/03/12 22:01
HEG Summary Data
Parameter
Value
Starting Reading
92.46
End Reading
92.96
Max Reading
92.99
Net Change
0.51
HEG & Breathing Application User Guide, copyright Glyn Blackett
page 20
Breathing Summary Data
Parameter
Mean
Max
Breathing Rate
6.2 bpm 10.7 bpm 4.6 bpm 1.1 bpm
I:E Ratio
0.82
1.27
HEG & Breathing Application User Guide, copyright Glyn Blackett
Min
0.50
S.D.
0.13
page 21
6 Application Report
An application report summarises all the sessions for the currently selected user, in charts and a
table.
To generate and open an application report, click the button labelled 3 in figure 1. A dialog window
opens in which you can select various options (see figure 11).
As with session reports, the software creates the application report in html format. It will be opened
using your computer's default web browser, e.g. Internet Explorer. (Note that a live internet
connection is not needed.) The html file is saved, so you can for example email it to someone. See
the Installation and Set-up Guide for details of file storage.
Figure 13 – Report options
6.1 Report Options
The application report options dialog is an adapted version of the session report options dialog.
Many of the options are the same, and should be self-explanatory. See section 5.1 above.
As with all of the application reports in the suite, there is a chart for each of the main parameters
tracked in the application – in the case of the HEG & Breathing application that means HEG score,
breathing rate and inhalation to exhalation ratio. For each chart you can opt for line graphs for the
maximum, minimum, mean and net change. The line graphs have one point per session.
HEG & Breathing Application User Guide, copyright Glyn Blackett
page 22