1
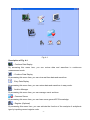
Click the “
” icon to enter the submenu interface. And then click the “Data Replay”
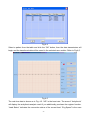
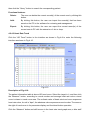
button. The interface as shown in Fig. 4-8.
When you want to view someone’s ECG wave, select his/her archive in archives list on the
right by clicking its row. And then all the ECG belonging to this user will be displayed on the
left area. Every row of contractible ECG wave on the lower left displays ECG wave for 30
seconds.
Fig. 4-8
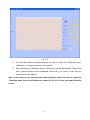
From the interface as shown in Fig.4-8, the user may review the ECG wave measured in
the continue mode. For example as in Fig.4-8, the user can use a green selecting box to
select a section of ECG wave. Shift mouse and click any dot in ECG wave can pitch on the
section of ECG wave, then its amplificatory wave will be displayed on the above wave box
and its corresponding record information (its heart rate value and measuring “Time” of the
original record) will be shown on the right area of the interface.
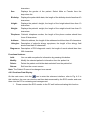
V-scale Amplify: The user can review the different proportional display of the section of
ECG wave by setting the display scale. By clicking the “Previous Page” or the “Next Page”
button, the user can view the previous or next page data items.
- 16 -