1
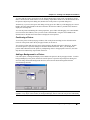
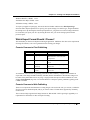
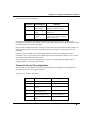
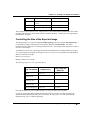
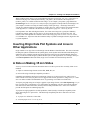
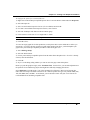
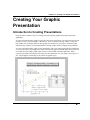
Chapter 13: Creating Your Graphic Presentation
Creating Your Graphic
Presentation
Introduction to Creating Presentations
Origin provides a number of tools for creating presentation quality graphs both in Origin and in other
applications.
To create presentation quality graphs in Origin, develop custom graphs using one of Origin's built-in graph
templates or create your own template. Alternatively, create a custom layout page window. The layout
page window acts as a display panel for other graphs and worksheets in your project. In both the graph
and layout page windows, you can add annotations and other graphic labels to complete the presentation.
To create presentation quality graphs in other applications, share your Origin graph with other applications
or export your graph or layout page from Origin. When sharing graphs with other applications, Origin acts
as an OLE server providing a graphic object to link or insert (embed) in another application. When
exporting your graph or layout page from Origin, use the Clipboard or save your graph or layout page to a
file. Origin supports a broad range of file formats for graphic export.
Introduction to Creating Presentations • 403
Chapter 13: Creating Your Graphic Presentation
Using the Layout Page Window
The layout page window acts as a “display panel” for worksheets and graphs which are created and edited
in associated child windows. The worksheets and graphs displayed in the layout page window are pictures,
or objects. Arrange the pictures in the layout page window to create a custom presentation to print from
Origin or to export to the Clipboard or a graphic file.
To learn more about using the layout page window, see Tutorial 6, "Creating Presentations with the Layout
Page" in the Getting Started Manual.
Opening a Layout Page Window
To open a layout page window, perform the following:
1) Select File:New. This menu command opens the New dialog box.
2) Select Layout from the Window Type list box.
3) Click OK to close the dialog box and open the layout page window.
Layout page windows are named Layout1, Layout2, etc.
Adding a Graph or Worksheet Picture to the Layout Page
Window
To add a graph or worksheet to the layout page window, perform the following:
1) Select Layout:Add Graph or Layout:Add Worksheet when the desired layout page window is active.
This menu command opens the Select Graph (or Worksheet) Object dialog box.
2) Click on the desired graph or worksheet window name in the list box provided.
3) Click OK.
4) Click once in the layout page window to create a picture with a default size. Alternatively, drag out a
box in the layout page window to create a picture of the specified size. Release the mouse button and a
picture (object) of the associated graph or worksheet is displayed.
If the source window is a worksheet window, the worksheet grid and cell values display as a picture in the
layout page window. Text labels in the worksheet window will not display in the layout page window.
If the source window is a graph window, all graphics within the page display in the layout page window.
Thus, text labels and other objects display in the layout page window if the label at least partially displays
inside the page of the graph window. (The gray area in the graph window is outside of the page.)
Working with Pictures in the Layout Page Window
To enhance your graphic presentation, Origin provides tools to customize the display of pictures in the
layout page window. Pictures in the layout page are graphic objects. Thus, they can be moved, sized, and
have their backgrounds altered like other graphic objects. However, layout page pictures differ from other
Using the Layout Page Window • 404
Chapter 13: Creating Your Graphic Presentation
graphic objects in that they provide a visual representation of the contents of selected windows in your
project.
Making Changes to the Contents of a Picture
To alter the display of the picture in the layout page window, edit the source graph or worksheet in the
associated child window. To make the graph or worksheet window active, right-click on the picture in the
layout page and select Go to Window from the shortcut menu. After changing the display of the graph or
worksheet, make the layout page window active to view the changes. If the layout page window does not
immediately display the changes, select Window:Refresh to update the window.
Selecting Pictures
Selecting One Picture
To select a picture in the layout page window, click on the picture. Alternatively, drag a box around the
picture with the Pointer tool (default mouse display). Release the mouse button and a highlighted
boundary with control handles displays around the picture. To de-select the picture, click anywhere in the
layout page window (off of the picture).
Selecting More than One Picture
To select more than one picture in the layout page window, SHIFT+click on the desired pictures.
Alternatively, drag a box around the desired pictures using the Pointer tool (default mouse display).
Sizing a Picture
To change the size of the picture in the layout page window, click on the picture to display its bounding
box with control handles. Drag on the control handles to resize the picture. The horizontal and vertical
control handles allow sizing in the associated direction while the diagonal control handles allow sizing
both horizontally and vertically. When dragging the control handles, an outline of the picture changes size.
The picture remains at its current size, shape, and position until you release the mouse button. Click off the
picture (but in the layout page window) to de-select the picture. (Your ability to resize and position the
object with the control handles can be limited by settings in the Object Properties dialog box. To open this
dialog box, double-click on the object.)
Note: Reducing or expanding the size of a worksheet picture in the layout page window controls the
display of the number of rows or columns in the picture. The actual size of the worksheet picture grid -that is the size of the cells and the text -- remains unchanged.
Proportionally Sizing a Picture
If you changed the proportions of the picture when resizing, return the picture to its original proportions
by pressing ALT while clicking and dragging on a control handle. (You can release the ALT key after you
click on the control handle.) The picture returns to its original proportions and then sizes proportionally as
you drag the control handle. Release the mouse button to display the resized picture with the original
proportions.
Using the Layout Page Window • 405
Chapter 13: Creating Your Graphic Presentation
To ensure that the picture's proportions are not changed during future sizing, make sure that Keep Aspect
Ratio is checked on the shortcut menu or select the Keep Aspect Ratio check box on the Dimensions tab in
the picture's Object Properties dialog box (double-click on the picture to open this dialog box).
Alternatively, to preserve the aspect ratio during resizing, press the CTRL key while dragging on a control
handle. Drag the control handle to the desired location. Release the CTRL key and the mouse button to
display the resized picture.
To resize the picture maintaining the current proportions, press CTRL while dragging on a control handle.
(You can release the CTRL key after you click on the control handle.) Drag the control handle to the
desired location. Release the mouse button to display the resized picture.
Positioning a Picture
To move the picture in the layout page window, click on the picture and drag it to the desired location.
Click off of the picture (but in the layout page window) to de-select it.
You can also position and resize the picture using settings in the Object Properties dialog box. Doubleclick on the picture to open this dialog box and select the Dimensions tab. Here, you can adjust the
position and/or dimensions of the picture by manipulating values in the appropriate text boxes, the Units
drop-down list and the Keep Aspect Ratio check box.
Adding a Background to a Picture
Like other objects, a background display can be added to the picture in the layout page window. To add a
background display to the picture, double-click on the picture to open the Object Properties dialog box.
Select the Image tab and the Background check box, then select the desired background from the
associated drop-down list.
Note: You can apply this background to a single, or to every object in the window. However, once
applied to every object in the window, the background display must be removed from pictures individually.
Using the Layout Page Window • 406
Chapter 13: Creating Your Graphic Presentation
Aligning Pictures
Origin provides three methods of aligning pictures in the layout page window:
1) Using the object grid to align pictures.
2) Using the Object Edit toolbar to align pictures.
3) Using the Object Properties dialog to align pictures.
Aligning Pictures with the Object Grid
Enable the display of the object grid by selecting View:Show Grid when the layout page window is active.
This menu command is checked when the object grid is displayed. Use the grid lines to facilitate
positioning of pictures in the window. To ensure that the pictures position on a grid line, select
Format:Snap to Grid when the layout page window is active.
Aligning Pictures with the Object Edit Toolbar
Use the Object Edit toolbar (View:Toolbars) to align pictures (or any other objects) in the layout page
window. The buttons on the Object Edit toolbar control the display of the active object(s) in the window.
Click on the desired picture to make it active. To make more than one picture active, SHIFT+click on the
desired pictures. Alternatively, drag a box around the desired pictures to select the group.
Aligning Pictures using the Object Properties Dialog Box
Double-click on the picture to open the Object Properties dialog box. Select the Dimensions tab and edit
the Left or Top values in the Position Group. Manually editing these boxes for multiple objects will allow
you to precisely align them vertically or horizontally.
Enhancing the Redraw Speed in a Layout Page Window
Origin provides two methods of increasing the redraw speed of the layout page window:
1) Show picture placeholders.
2) Display the pictures in Page View mode independent of the view mode of the associated child window.
Displaying Picture Placeholders
The pictures in the layout page window can be displayed with placeholders to increase the redraw speed of
the window. To display a picture placeholder, click to select the desired picture and then select
Layout:Set Picture Holder. This menu command is checked when a placeholder is displayed for the
selected picture. To disable the placeholder display, click to select the desired placeholder and then select
Layout:Clear Picture Holder. Alternatively, enable/disable the Use Picture Holder check box on the
Image tab of the picture's Object Properties dialog box or right-click on the object and Set/Clear Picture
Holder.
The picture placeholders can be moved and sized following the same procedure for the pictures. In
addition, you can double-click on the placeholder to open the associated Object Properties dialog box.
Using the Layout Page Window • 407
Chapter 13: Creating Your Graphic Presentation
Changes made in the Background drop-down list are visible when you disable the picture placeholder
display.
Note: When printing the layout page window, the pictures print out independent of the display of picture
placeholders.
Controlling the View Modes
Origin provides an option to display all pictures (and additional objects) in the layout page window in the
Page View mode, independent of the view mode of the picture’s child window. The Page View mode
provides faster screen updating than the Print View mode. To display pictures (and objects) in the layout
page window in the Page View mode, select Layout:Global Speed Control. Alternatively, right-click in
the layout page window but off the page and select Global Speed Control from the shortcut menu. This
menu command is checked when displaying pictures in Page View mode. To disable this option, re-select
the menu command.
Because the Page View mode uses the screen driver to generate the display instead of the printer driver,
text placement may not be accurate in the layout page window when the Global Speed Control menu
command is selected. This is irrelevant, however, as all editing is performed in the associated child
window. Check text placement in the child window by selecting View:Print View when the child window
is active. Pictures in the layout page window print as displayed in the child window’s Print View mode.
Sharing Your Origin Graph with Another Application
There are two methods to include Origin graphs in presentations developed in other applications:
importing your graph or sharing your graph.
1) When you import your Origin graph into another application, the application displays a picture of your
graph. The picture displayed in the application cannot be edited using Origin tools.
2) When you share your Origin graph with another application, the application displays an object which
can be edited using Origin tools. The object can also be linked and updated if the source Origin graph
changes.
When sharing Origin graphs with other applications, Origin acts as an OLE server. The following sections
provide instructions on how to share Origin objects with OLE compatible applications.
Should I Insert My Graph or Create a Link to My Graph?
There are two methods of sharing Origin objects with OLE compatible applications: inserting your graph
or creating a link to your graph. The major difference between inserting (or embedding) your graph into
another application and creating a link to your graph in another application is where the data is stored.
1) When you insert your graph into another application, the data is stored in the destination application,
not in Origin.
Sharing Your Origin Graph with Another Application • 408
Chapter 13: Creating Your Graphic Presentation
2) When you create a link to your graph in another application, the data is stored in the Origin file, not the
destination application. The destination application saves a link to the Origin file, and displays a
representation of the linked graph.
Note: The destination application is the OLE container application.
Inserting vs. Linking Your Graph
To: Reduce the destination document file size. Do this: Link your graph to the destination application
file.
To: Display your graph in more than one destination document; changes made to the source graph will be
reflected in all documents. Do this: Link your graph to the destination application file.
To: Create a single, self-contained destination document that contains information on your graph. Do
this: Insert your graph into the destination application file.
Controlling the Size of your Linked or Inserted Graph
Control the size of an inserted or linked image using the settings on the Page tab of the Options dialog box
(Tools:Options). For more information, see the "Setting Your Preferences, the Page Tab".
Inserting Your Graph into Another Application
Origin provides three methods to insert your graph into another application.
1) Insert your graph using the Clipboard. The graph need not be saved to a graph window file or a project
file.
2) Insert your graph window file (*.OGG). The graph must already be saved to a graph window file.
3) Create and insert a new graph.
Pasting Your Graph from the Clipboard into Another Application
To insert the page of the active graph window as an object into another application, perform the following:
1) In Origin, select Edit:Copy Page.
2) In the destination application (such as Microsoft® Word), select Edit:Paste Special. In Word, this
menu command opens the Paste Special dialog box.
3) Select Origin Graph Object from the As list box.
4) Select the Paste radio button.
5) Click OK.
Sharing Your Origin Graph with Another Application • 409
Chapter 13: Creating Your Graphic Presentation
Your graph displays as an object in the destination application.
To control the default size of the object in the destination application, edit the Copy Page group on the
Page tab of the Options dialog box (Tools:Options).
Note: Pressing CTRL+C or selecting Edit:Copy Page (Origin) and CTRL+V or Edit:Paste (destination
application), produces the same result.
Inserting an Existing Origin Graph Window File (*.OGG) into Another
Application
To insert the page of an existing *.OGG graph window file as an object into another application, perform
the following:
1) In the destination application (such as Word), select Insert:Object. In Word, this menu command
opens the Object dialog box.
2) Select the Create from File tab.
3) Click Browse. This action opens the Browse dialog box.
4) Select the desired *.OGG file.
5) Click OK.
6) In the Object dialog box, make sure the Link to File check box is not selected.
7) Click OK.
Your graph displays as an object in the destination application.
Creating (and Inserting) a New Graph in Another Application
To create and insert the page of a graph window as an object in another application, perform the following:
1) In the destination application (such as Word), select Insert:Object. In Word, this menu command
opens the Object dialog box.
2) Select the Create New tab.
3) Select Origin Graph from the Object Type list box.
4) Click OK. This action creates a new instance of Origin displaying a Graph in Documentn window.
5) If the new instance of Origin isn’t the active application, make it active.
6) In the new instance of Origin, create the desired graph window.
7) With the graph window active, select File:Update Documentn.
8) Select File:Exit and Return to Documentn. This menu command closes the new instance of Origin
and returns activity to the destination application (in this example, Word).
Sharing Your Origin Graph with Another Application • 410
Chapter 13: Creating Your Graphic Presentation
Editing an Inserted Graph in the Destination Application
After an Origin object is inserted into a destination application, it can be edited using Origin’s tools.
Double-click on the object to edit it. This action opens an instance of Origin displaying the graph in a
graph window. Make changes to the graph in this instance of Origin.
To update the inserted object, select File:Update DestinationApplication.
To close the instance of Origin and return to the destination application, select File:Exit and Return to
DestinationApplication.
Using In-place Activation to Edit the Inserted Graph
Origin objects that are inserted into a destination application can also be edited within the window of the
destination application, using tools provided by Origin. This editing method is called in-place activation.
To enable in-place activation, select the Enable OLE In-place Activation check box on the Graph tab of the
Options dialog box (Tools:Options). Click OK to close the dialog box. Click Yes when asked to “Save as
Origin’s startup options?”. Exit Origin.
To use in-place activation, double-click on the inserted (not linked) Origin graph in the destination
application. Origin’s graph is activated “in-place” and ready for editing.
Note: Though Origin supports in-place activation, this is not a recommended method to edit Origin graphs
that are inserted in other applications. When using in-place activation, you do not have access to many
useful Origin features - in particular, to the worksheet windows that may contain data plotted in the graph.
Creating a Link to Your Graph in Another Application
Linking a Graph from a Saved Project File (*.OPJ) to Another Application
To create a link to a graph in a saved Origin project file, perform the following:
1) Open the project that includes the desired graph window.
2) With the graph window active, select Edit:Copy Page.
3) In the destination application (such as Word), select Edit:Paste Special. In Word, this menu command
opens the Paste Special dialog box.
4) Select Origin Graph Object (or Picture) from the As list box.
5) Select the Paste Link radio button.
6) Click OK.
Your graph displays as an object in the destination application.
To control the default size of the object in the destination application, edit the Copy Page group on the
Page tab of the Options dialog box (Tools:Options).
Sharing Your Origin Graph with Another Application • 411
Chapter 13: Creating Your Graphic Presentation
Linking a Graph from a Saved Origin Graph Window File (*.OGG) to
Another Application
To create a link to a graph in a saved Origin graph window file, perform the following:
1) In the destination application (such as Word), select Insert:Object. In Word, this menu command
opens the Object dialog box.
2) Select the Create from File tab.
3) Click Browse. This action opens the Browse dialog box.
4) Select the desired *.OGG file.
5) Click OK.
6) In the Object dialog box, select the Link to File check box.
7) Click OK.
Your graph displays as an object in the destination application.
Editing a Linked Graph in the Destination Application
After you have created a link to your graph in the destination application, you can edit your graph using
Origin’s tools. Begin the editing process by opening the Origin project or graph window file that contains
the source for the linked object. Edit the graph using Origin’s tools. Alternatively, you can double-click
on the linked object in the destination application. This action opens an instance of Origin displaying the
linked graph in a graph window. Make changes to the graph in this instance of Origin.
After making changes to the graph in Origin, select Edit:Update Client from the Origin menu bar.
Alternatively, redirect window activity to the destination application. Update the link within the
destination application. For instructions on updating the link, consult the destination application’s
documentation.
Exporting Your Graph or Layout Page
Graphs and layout pages can be exported to other applications by creating a graphics file or by using the
Clipboard. When you import your Origin graph or layout page into another application, the application
displays a picture of your graph or layout page. The picture displayed in the application cannot be edited
using Origin tools. Rather, use the importing application’s tools to edit the picture.
Exporting Your Graph or Layout Page Using the Clipboard
To paste the page of the active graph or layout page window as a picture in another application, perform
the following:
1) In Origin, select Edit:Copy Page.
2) In the importing application (such as Word), select Edit:Paste Special. In Word, this menu command
opens the Paste Special dialog box.
Exporting Your Graph or Layout Page • 412
Chapter 13: Creating Your Graphic Presentation
3) Select Picture from the As list box.
4) Select the Paste radio button.
5) Click OK.
Your graph or layout page displays as a picture in the destination application.
To control the default size of the picture in the destination application, edit the Copy Page group on the
Page tab of the Options dialog box (Tools:Options).
Exporting Your Graph or Layout Page to an Image File
Origin supports 17 file formats for Graphic Export (GIF, standard on OriginPro, is available as an Add-on
for Origin). These files fall into two categories: raster and vector.
Raster Formats define a fixed size array of (rows and columns) of colors. These formats take
proportionately larger file space for increased detail and do not scale well. Raster file size is a function of
resolution and color density. Raster formats are best used when you must reproduce graphs and layout
pages with much detail and many colors, and where scalability is not a concern.
Vector formats contain instructions on how to draw an image and may contain additional information about
size and resolution. These formats scale well (within limits), but must be interpreted by a target
application, and this is subject to error. File size is proportional to the complexity of the image. Vector
formats are best used for graphs and layout pages with little detail and few colors, or for applications where
scalability is needed.
Origin can export graphs in the following raster and vector image formats:
Adobe Illustrator (*.AI): vector
Bitmap (*.BMP): raster
Computer Graphics Metafile (*.CGM): vector
AutoCAD Drawing Interchange (*.DXF): vector
Encapsulated PostScript (*.EPS): vector
Enhanced Metafile (*.EMF): vector
Graphics Image Format (*.GIF); raster (Origin Add-on)
JPEG, Joint Photographic Experts Group (*.JPG): raster
Zsoft PC Paintbrush Bitmap (*.PCX): raster
Portable Network Graphics (*.PNG): raster
Truevision Targa (*.TGA): raster
Portable Document Format (*.PDF): vector
Adobe PhotoShop (*.PSD): raster
TIFF, Tag Image File (*.TIF): raster
Exporting Your Graph or Layout Page • 413
Chapter 13: Creating Your Graphic Presentation
Windows Metafile (*.WMF): vector
X-Windows Pix Map (*.XPM): raster
X-Windows Dump (*.XWD): raster
To export your graph or layout page, activate the desired window and then select File:Export Page.
Select the 'Show Export Options' box to specify your export settings; For each file type, Origin remembers
the settings used. By checking the Show Export Options box, you gain access to these settings which will
be saved when you export your file. By clearing the check box, you use the settings specified in the
previous export.
Which Export Format Should I Choose?
The format that you choose will depend on the target application. Publishers often have strict requirements
for image file formats, so be sure to get details before creating your images.
Formats Common to Print Publishing
Extension
Format Name
Features
TIF
Tag Image File
Raster format, ColorSpace options,
Monochrome to True Color, File
compression
TGA
Truevision Targa
Raster format, 256 color to True
Color
EPS
Encapsulated
Postscript
Vector format, ColorSpace options,
True Color
PDF
Portable Document
Format
Vector format, ColorSpace options,
True Color
As mentioned, vector formats are generally preferred for their scalability. It might seem reasonable to
expect that vector images should be infinitely scaleable, but the information to describe these images can
be sizable if the plotted data sets are very large. Origin provides the option to limit resolution for vector
formats (Tools:Options, Page tab). For formats that have ColorSpace options, publishers typically prefer
CYMK over RGB.
Formats Common to Web Publishing
There are two important considerations in creating images to be used on the web; you want to (1) minimize
file size to increase download speed, and (2) you want to choose a format that is supported by commonly
used browsers.
The two most widely supported web image formats are JPG and GIF. PNG is growing in popularity as a
replacement for GIF because it does not require licensing.
Exporting Your Graph or Layout Page • 414
Chapter 13: Creating Your Graphic Presentation
Formats Common to Web Publishing
Extension
Format Name
Features
JPG
Joint Photographic
Experts Group
Raster, Grayscale or True Color,
Adjustable compression (lossy)
GIF
Graphics Image
Format
Raster, 256 color, Lossless
compression
PNG
Portable Network
Graphics
Raster, Monochrome, 16 or 256
colors, or True Color (24 bit RGB),
Lossless compression
Note that you must balance color and detail with download speed; the lower the color density and
resolution, the faster the download speed. However, there may be times when you decide to sacrifice some
download speed for more color or sharpness.
Origin provides a default color palette of 24 colors chosen from colors found on the Windows palette. So,
unless you need custom or True Color, GIF and 256 Color PNG images are a logical choice for web
publishing.
If custom colors are needed, (you can add a limited number of colors to your Origin palette up to a
maximum of 40), or you are setting color by RGB value, then you will do better with True Color. In such
cases, PNG or JPG would be the better choices.
Since web pages are viewed on a computer screen, export at a resolution that approximates that of a
computer monitor – 72 to 96 dots per inch (dpi).
Formats for Use by Other Applications
If you intend to edit your graphic file in another application, then you should choose that application's
native file format or one of its supported formats.
Formats for Use by Other Applications
Extension
Format Name (type)
Owner Application
AI
Adobe Illustrator (vector)
Abobe Illustrator
BMP
Bitmap (raster)
Windows Paint
CGM
Computer Graphics Metafile
(vector)
Wordperfect
DXF
AutoCAD Drawing
Interchange (vector)
AutoCAD
EMF
Enhanced Metafile (vector)
MS Office Applications
PCX
Zsoft PC Paintbrush Bitmap
(raster)
PC Paintbrush
Exporting Your Graph or Layout Page • 415
Chapter 13: Creating Your Graphic Presentation
Extension
Format Name (type)
Owner Application
PDF
Portable Document Format
(vector)
Adobe Acrobat
PSD
Adobe Photoshop (raster)
Adobe Photoshop
WMF
Windows Metafile (vector)
MS Office Applications
These formats may be raster or vector. There are fewer vector format editors available and some of those
programs will 'rasterize' a vector format when it is loaded in the editor. Consult your owner application’s
documentation for details.
Controlling the Size of the Exported Image
The physical page size of exported Clipboard (Edit:Copy Page) and vector images (File:Export Page…)
is controlled by settings on the Page tab of the Options dialog box (Tools:Options). For further
information on this dialog box, see "Setting Your Preferences". The settings on the Page tab do not affect
the size of raster images.
To illustrate the effect of the various Page tab options on the dimensions of Clipboard and vector images,
we created a simple Origin graph, with a page size of 10.5 in. by 8.13 in., and exported it to MS Word 97.
Monitor resolution was 96 dpi.
Ratio was set to 100 (%).
Margin Control was set to Page.
The following image sizes were reported by Word.
Page Tab Options
Clipboard (in.)
Vector Image File
(EMF) (in.)
Simple
8.13 x 10.5
8.13 x 10.5
Avanced,
Resolution=96
8.13 x 10.5
8.13 x 10.5
Advanced,
Resolution=300
8.13 x 10.5
25.4 x 32.8
Advanced,
Resolution=600
8.13 x 10.5
50.8 x 65.6
Advanced, Keep Size
8.13 x 10.5
8.13 x 10.5
Note that the dimensions of the Clipboard image were only affected by the Copy Ratio.
Conversely, testing showed that the dimensions of the inserted vector file were affected only by the
Advanced settings (Resolution) and were not affected by the Copy Ratio. Note that reported image
dimensions may vary by container application.
Exporting Your Graph or Layout Page • 416
Chapter 13: Creating Your Graphic Presentation
When producing raster images, keep in mind that the image has no fixed size; the “size” of the image is a
function of the page size (normally determined by your printer), the resolution of the output device
(monitor, printer, etc.) and the resolution of the image. If, for example, your printer’s page dimensions
(Format:Page) are 10.5 in. by 8.13 in., and you export your graph as a 600 dpi TIF file, then display it on
your computer’s monitor at 96 dpi, the rendered image will be quite large – much larger than can be
viewed on a computer monitor at a resolution of 96 dpi. However, when you print your graph with a 600
x 600 dpi printer, it is rendered at the dimensions of the printer’s page size – 10.5 in. by 8.13 in.
It is important to note that while high resolution, True Color raster images do a good job of faithfully
reproducing complex graphs, file sizes can be very large and in some cases, the export may fail. For
instance, a 600 x 600 dpi TIF file rendered in 24-bit color using a page size of 10.5 in. x 8.13 in. will be
over 90 MB in size. Experience has shown that the ability to produce such high resolution, high color files
is system dependent.
Inserting Origin Data Plot Symbols and Lines in
Other Applications
Origin installs a True Type font set called Origin into the Windows \FONTS folder. This font set includes
the data plot symbols available from the symbol gallery on the Symbol tab of the Plot Details dialog box,
and the line styles available from the Style drop-down list on the Line tab of the Plot Details dialog box.
Thus, you can now include Origin's symbols and line styles in other applications. For example, when you
select Insert:Symbol in Microsoft Word, Origin is now available from the Font drop-down list.
A Note on Making 35 mm Slides
A survey of service bureau websites showed that most were able to process files created by either of two
methods:
1) Export to common image formats such as EPS, BMP, JPG, etc.
2) Print to file using a PostScript compatible print driver
It should be noted that the submission requirements of these service bureaus will vary and it is best to
check with the service that you plan to use for suggested file formats, print drivers, image sizes, etc. Some
sites even make available a downloadable driver for generating 35 mm slide-convertible files.
To Export your graph using one of Origin’s graphic export image formats, select File:Export Page. Try to
keep your file sizes to a minimum, as you will probably be submitting your files electronically and large
files will increase data transfer times, and may increase slide production costs. Some service bureaus
provide an FTP option for submitting large files.
To prepare an Origin graphic file for slide production, install (locally) a PostScript compatible printer
driver and configure it to print to File. This PostScript compatible print driver must allow one of the
following:
1) A “paper size” defined as 35 mm slide.
2) A custom paper size of 7.33 in. by 11 in.
Inserting Origin Data Plot Symbols and Lines in Other Applications • 417
Chapter 13: Creating Your Graphic Presentation
To configure the printer for a custom (slide) size
1) Right-click on the PostScript compatible printer driver icon in the Printers folder and select Properties.
2) Select the Paper tab.
3) Select 35 mm from the Paper Size list box (if it is available) and click OK.
4) If 35 mm is not available in the Paper Size list box, select Custom.
5) Select the Landscape radio button in the Orientation group.
6) Click Custom to set the size of 7.33" length and 11" width.
Note: Some drivers will allow you to change the "Custom" name to "35 mm".
7) Click OK (twice).
To create an Origin graph file for slide production, set this printer driver as the default driver before you
start Origin. If you have already created your graph using another print driver, you should update your
graph to use your PostScript compatible print driver with custom paper size:
1) Select File:Page Setup.
2) Select the Printer button.
3) Choose your PostScript compatible printer from the Printer Name drop-down list. Even if it is already
selected, click the OK button.
4) Click OK.
5) Say Yes to the dialog asking whether you want to resize the page to match the printer.
Before you print the graph in Origin, select View:Print View. In Print View you can make adjustments to
the positions of text and drawing objects that might have shifted by changing print drivers.
Select File:Print to print the graph. You will be prompted for a file name. Most service bureaus that
make slides will accept a file name extension of .PS. Other acceptable files types may include: PRN, EPS,
TIF, GIF, BMP, PNG, and PDF. As mentioned, you are advised to check with your service bureau for
recommendations on submitting compatible files.
A Note on Making 35 mm Slides • 418