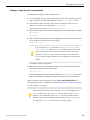
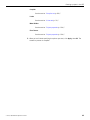
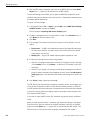
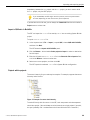
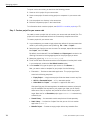
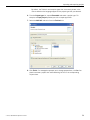
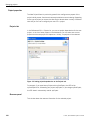
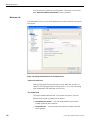
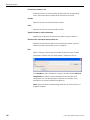
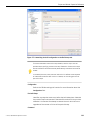
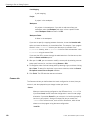
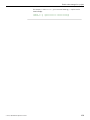
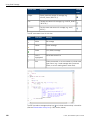
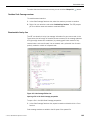
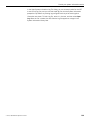
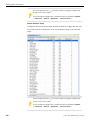
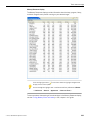
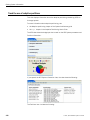
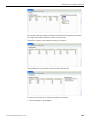
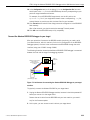
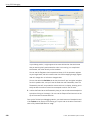
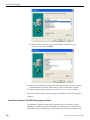
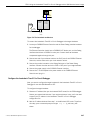
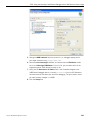
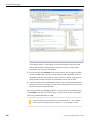
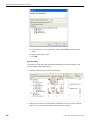
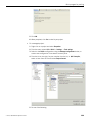
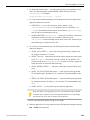
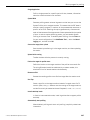
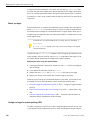
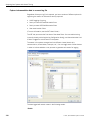
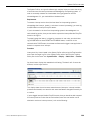
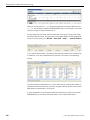
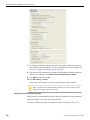
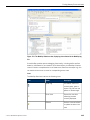
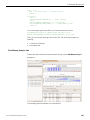
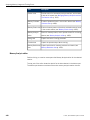
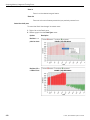
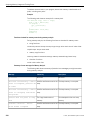
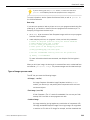
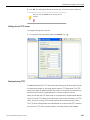
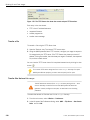
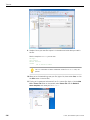
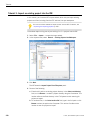
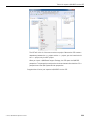
1
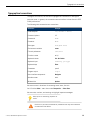
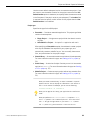
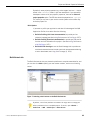
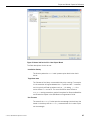
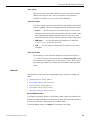
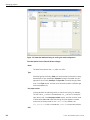
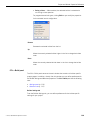
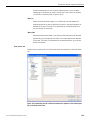
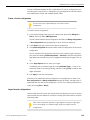
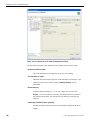
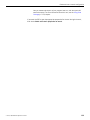
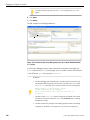
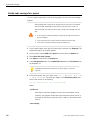
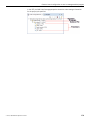
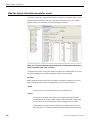
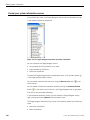
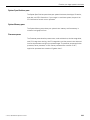
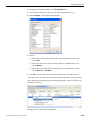
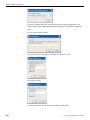
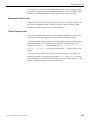
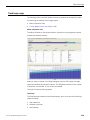
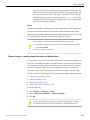
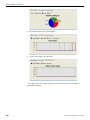
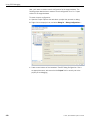
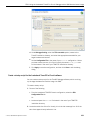
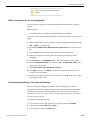
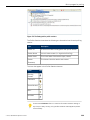
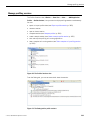
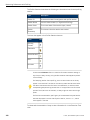
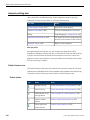
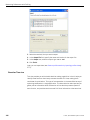
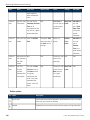
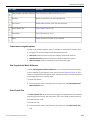
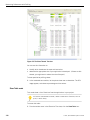
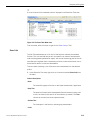
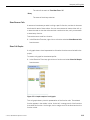
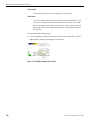
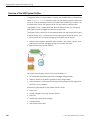
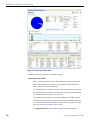
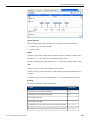
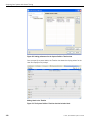
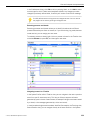
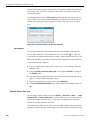
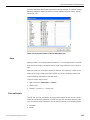
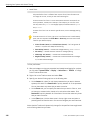
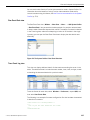
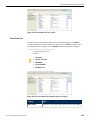
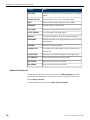
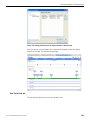
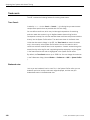
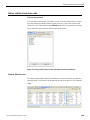
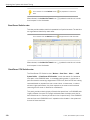
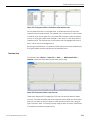
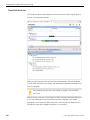
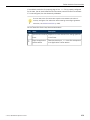
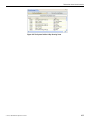
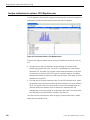
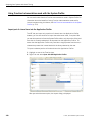
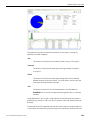
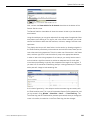
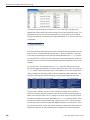
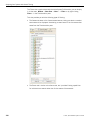
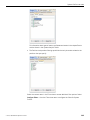
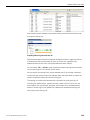
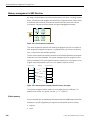
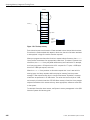
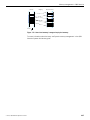
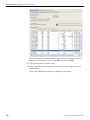
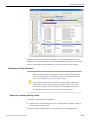
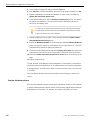
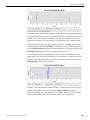
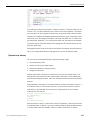
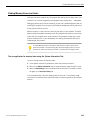
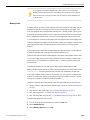
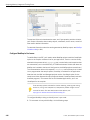
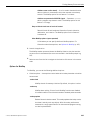
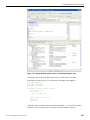
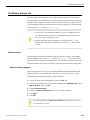
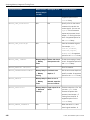
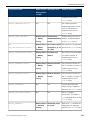
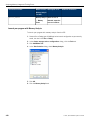
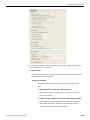
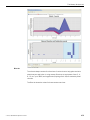
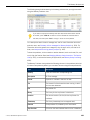
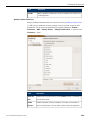
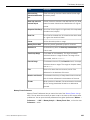
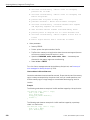
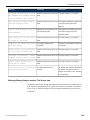
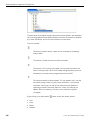
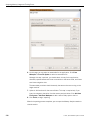
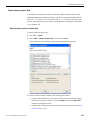
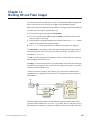
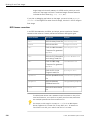
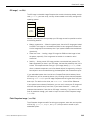
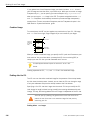
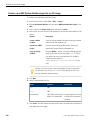
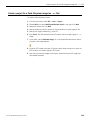
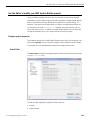
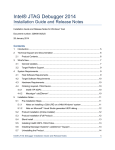
Interpret profiling data
The value of the result of: Time/Root Time×100
Binary
The name of the binary container.
Show Reverse Calls
A reverse call tree shows you what is calling a specific function, and how its time was
distributed for each of those callers. You can use a reverse call tree to either drill up
or down the stack to view the callers and their contribution time, until you encounter
a thread entry function.
To show the source code for a function:
1. In the Execution Time view, right-click on a function and select Show Reverse Calls
from the menu.
Show Call Graphs
A call graph shows a visual representation of how the functions are called within the
project.
To create a call graph for the selected profile:
1. In the Execution Time view, right-click on a function and select Show Call Graphs
from the menu.
Figure 65: A simple example of a call graph.
This call graph shows a pictorial representation of the function calls. The selected
function appears in the middle, in blue. On the left, in orange, are all of the functions
that called this function. On the right, also in orange, are all of the functions that this
function called.
©
2014, QNX Software Systems Limited
315