1
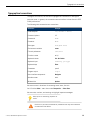
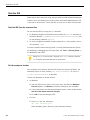
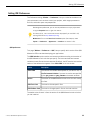
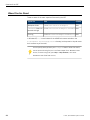
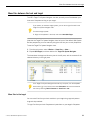
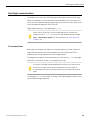
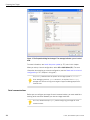
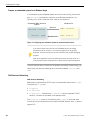
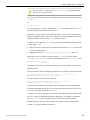
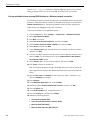
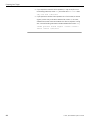
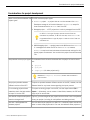
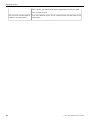
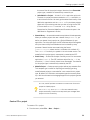
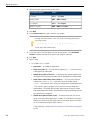
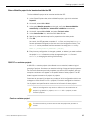
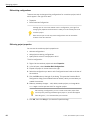
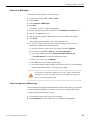
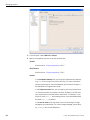
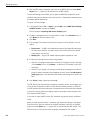
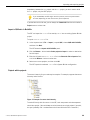
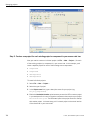
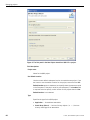
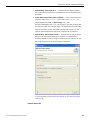
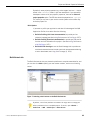
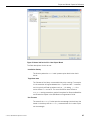
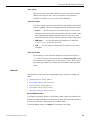
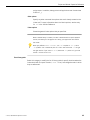
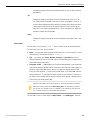
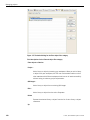
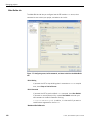
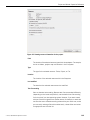
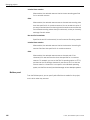
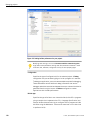
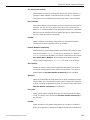
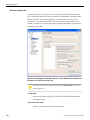
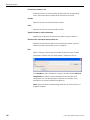
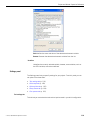
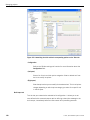
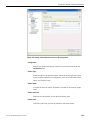
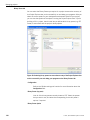
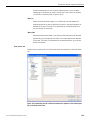
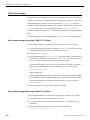
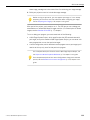
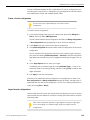
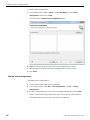
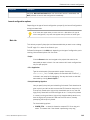
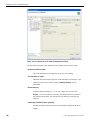
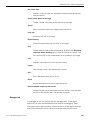
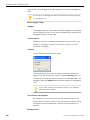
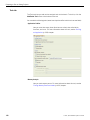
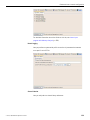
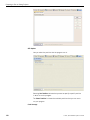
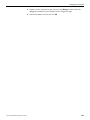
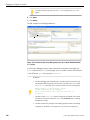
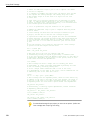
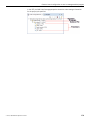
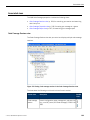
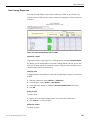
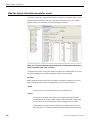
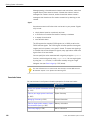
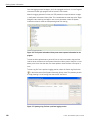
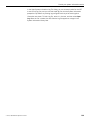
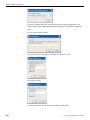
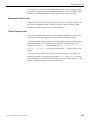
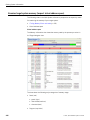
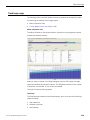
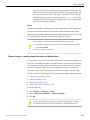
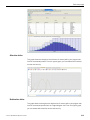
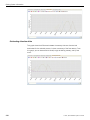
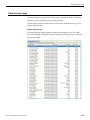
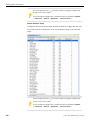
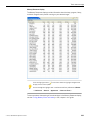
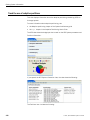
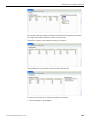
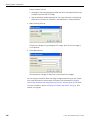
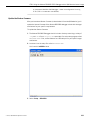
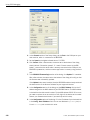
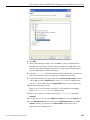
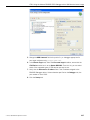
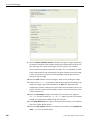
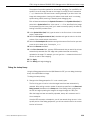
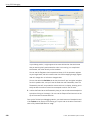
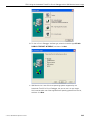
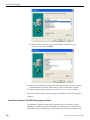
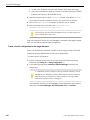
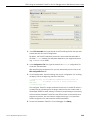
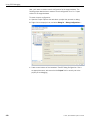
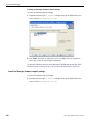
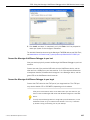
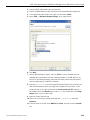
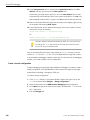
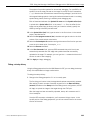
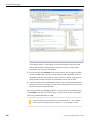
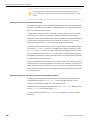
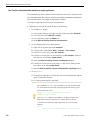
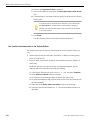
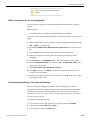
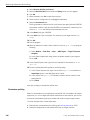
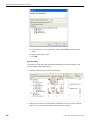
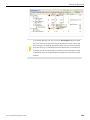
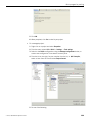
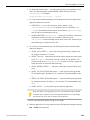
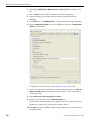
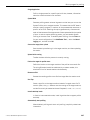
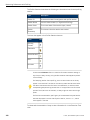
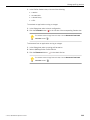
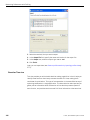
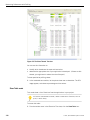
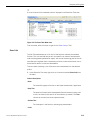
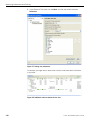
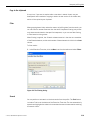
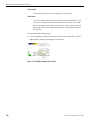
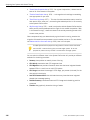
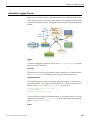
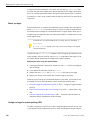
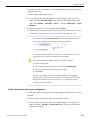
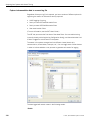
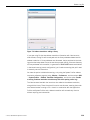
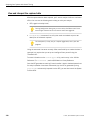
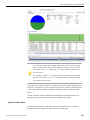
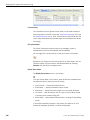
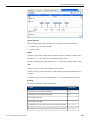
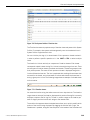
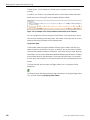
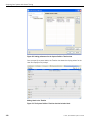
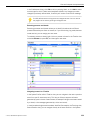
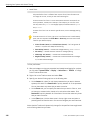
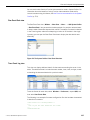
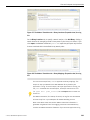
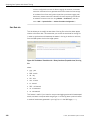
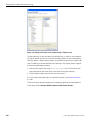
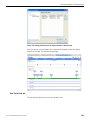
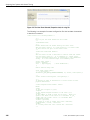
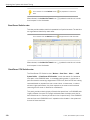
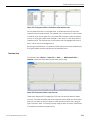
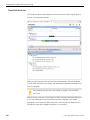
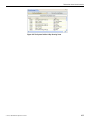
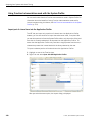
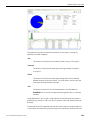
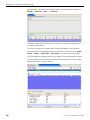
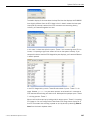
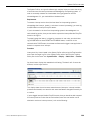
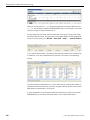
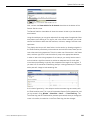
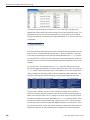
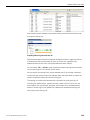
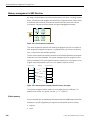
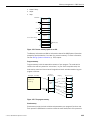
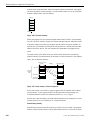
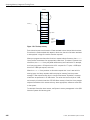
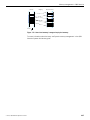
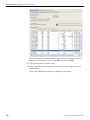
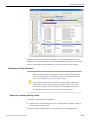
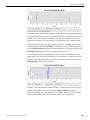
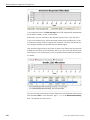
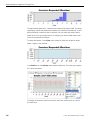
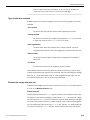
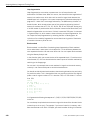
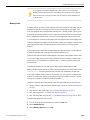
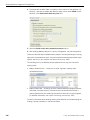
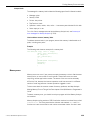
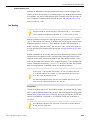
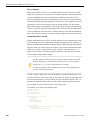
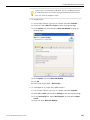
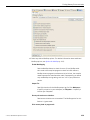
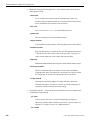
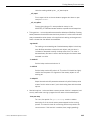
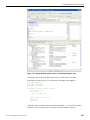
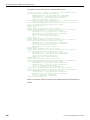
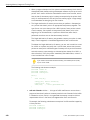
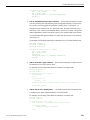
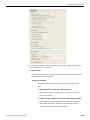
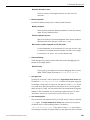
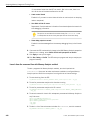
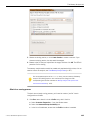
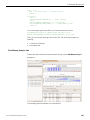
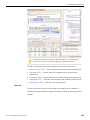
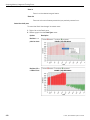
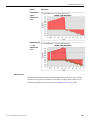
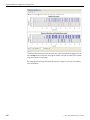
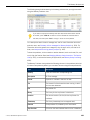
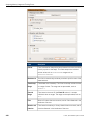
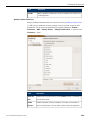
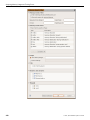
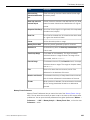
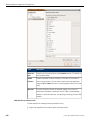
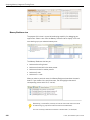
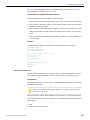
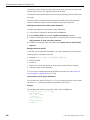
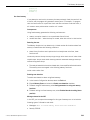
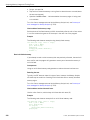
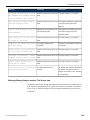
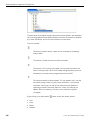
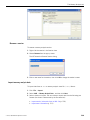
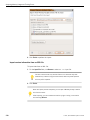
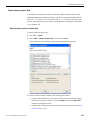
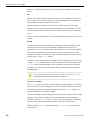
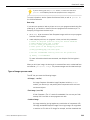
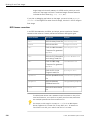
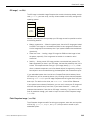
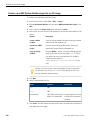
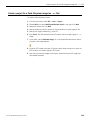
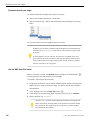
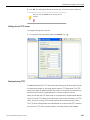
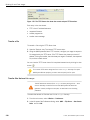
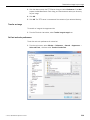
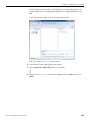
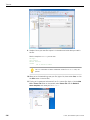
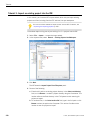
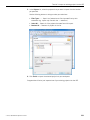
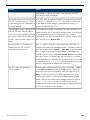
Memory optimization
This example chart shows memory allocation and deallocation events that are generated
by the malloc and free functions and their derivatives. The X-axis represents the event
number (which can change to a timestamp), and the Y-axis represents the size (in
bytes) of the allocation (if a positive value), or the deallocation (if a negative value).
Let's take a closer look at the bottom portion of the chart. The Page field shows the
scrollable page number, the Total Points field shows how many recorded events there
are, the Points per page field shows how many events can fit onto this page, and the
Total Pages field shows how many chart pages there are in total.
For this example, there are 202 events that fit within the chart; however for some
larger charts, all of them would not likely fit on this single chart. If that were the case,
there are several choices available. First, you can attempt to reduce the value in the
Points per page field to 50, for example.
However, in the case where the number of events is large (the X-axis value is a large
number, 1482 events), changing the value of Points per page field might not
significantly improve the visual appearance of the data in the chart. For this example,
there are 1482 events, and all of these events don't fit on a single chart:
©
2014, QNX Software Systems Limited
413