1
Analyzing Your System with Kernel Tracing
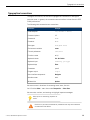
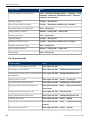
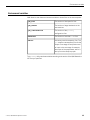
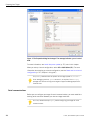
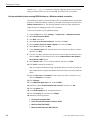
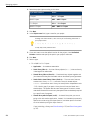
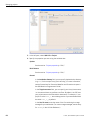
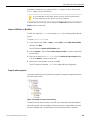
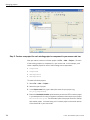
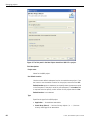
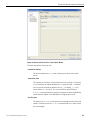
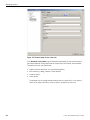
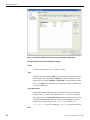
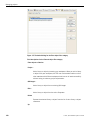
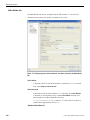
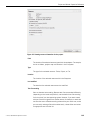
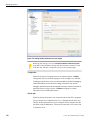
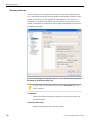
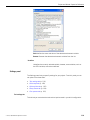
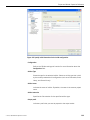
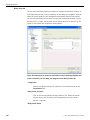
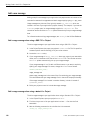
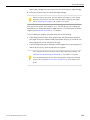
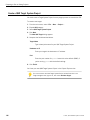
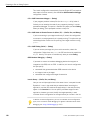
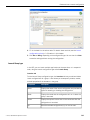
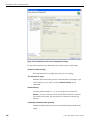
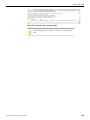
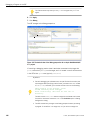
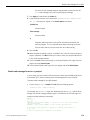
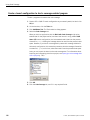
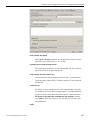
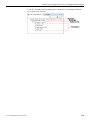
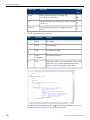
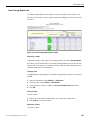
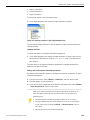
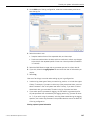
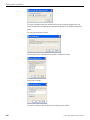
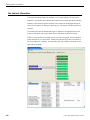
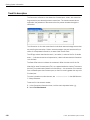
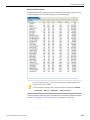
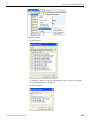
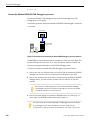
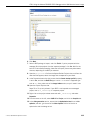
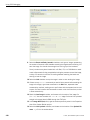
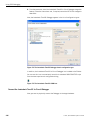
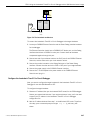
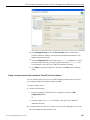
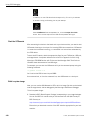
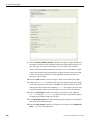
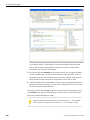
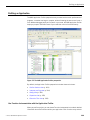
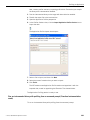
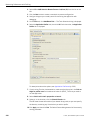
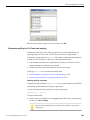
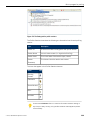
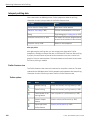
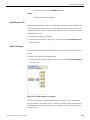
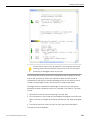
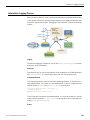
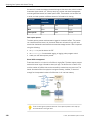
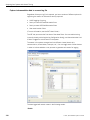
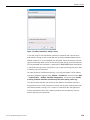
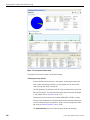
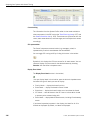
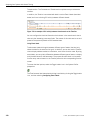
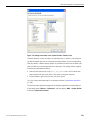
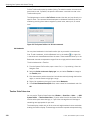
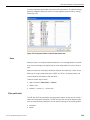
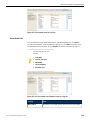
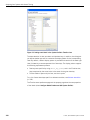
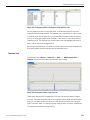
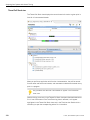
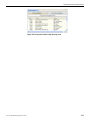
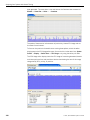
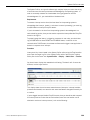
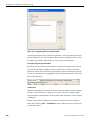
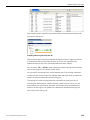
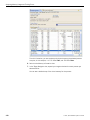
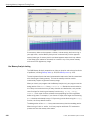
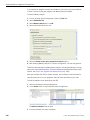
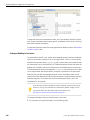
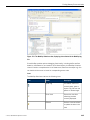
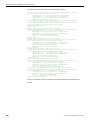
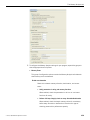
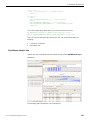
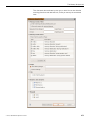
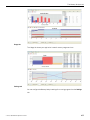
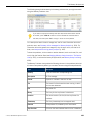
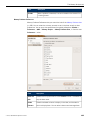
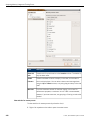
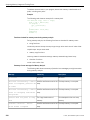
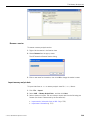
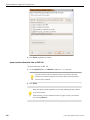
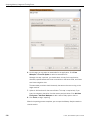
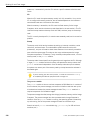
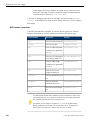
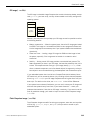
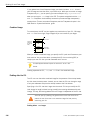
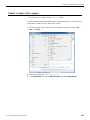
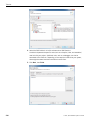
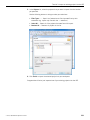
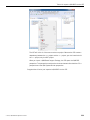
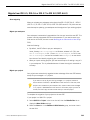
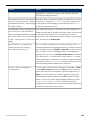
Figure 93: The User Event Data tab (Properties view) for a log file.
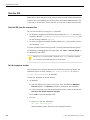
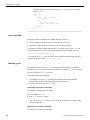
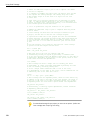
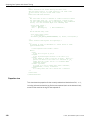
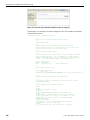
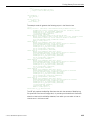
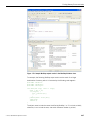
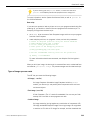
The following is an example of an event configuration file that has been documented
to describe its contents:
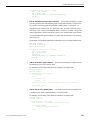
<?xml version="1.0" encoding="UTF-8" ?>
<!-Root tag for the event definition file format
-->
<eventdefinitions>
<!-Events definitions are broken down by the event class.
The user event class is '6' (from <trace.h>); all event codes
in this section are part of this event class.
-->
<eventclass name="User Events">
<!-The user
the user
(32 bit)
string.
event we want to describe is coded as event #12 within
event class (6). It is composed of a single 4 byte
unsigned integer that is followed by a null terminated
In C the structure might look something like:
struct event_twelve {
uint32_t myvalue;
char
mystring[28];
};
/* Null Terminated */
And be emitted using code:
stuct event_twelve event;
... /* Fill event */
TraceEvent(_NTO_TRACE_INSERTCUSEREVENT, 12, &event, sizeof(event));
-->
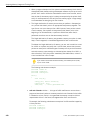
<event sformat="%4u1x myvalue %1s0 mystring" />
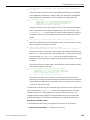
<!-In general an event is described as a serial series of event
payload definitions:
%<size><signed><count><format> <label>
Where:
<size>
Is the size in bytes (1,2,4,8)
<signed>
Is the signed/unsigned attribute of the value (s,u)
<count>
Is the number of items to read (ie an array). There is a
special case where if the <size> is 1 and there is _NO_
format then the <count> can be 0 to accomodate NULL
terminated strings.
<format> (optional)
Is a hint as to how to format this value: d=decimal,
x=hexadecimal, o=octal, c=character
<label>
Is a string label that can't contain the % character
-->
366
©
2014, QNX Software Systems Limited