1
Display Group
Impact Reference Guide
Display Group
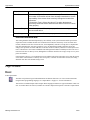
Chart
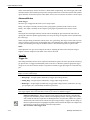
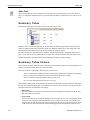
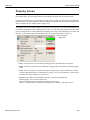
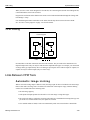
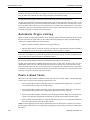
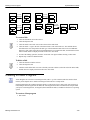
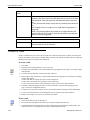
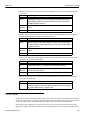
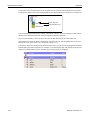
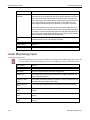
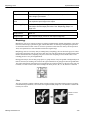
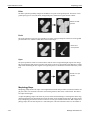
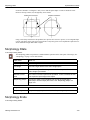
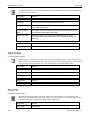
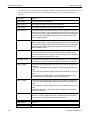
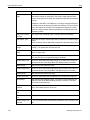
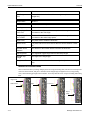
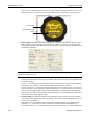
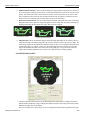
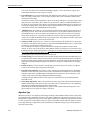
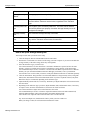
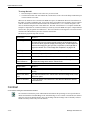
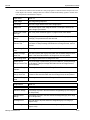
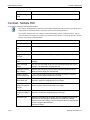
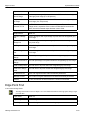
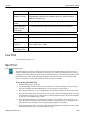
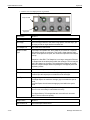
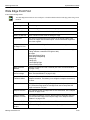
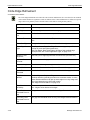
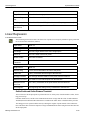
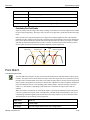
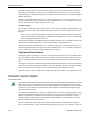
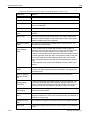
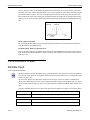
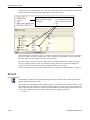
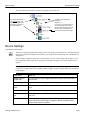
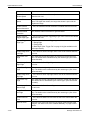
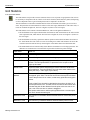
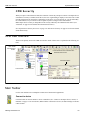
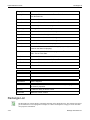
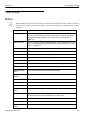
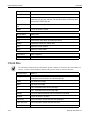
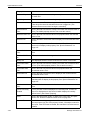
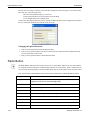
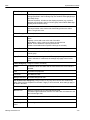
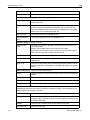
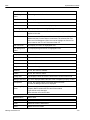
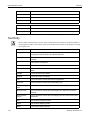
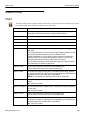
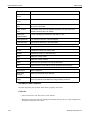
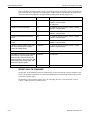
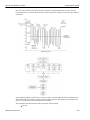
The Chart control presents a graphic display of data from a vision program. Several different types of charts
are available and up to five categories of data series can be plotted.
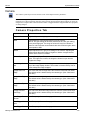
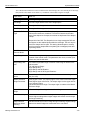
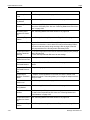
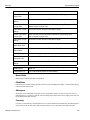
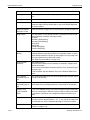
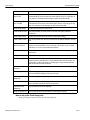
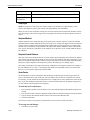
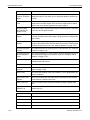
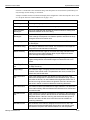
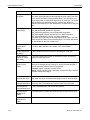
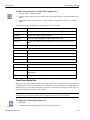
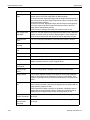
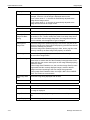
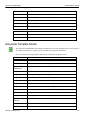
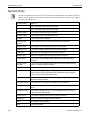
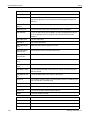
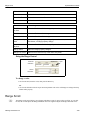
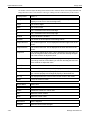
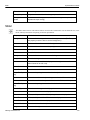
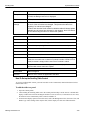
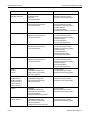
Property Name
What it is
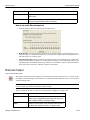
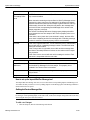
Chart Setup
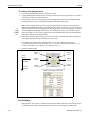
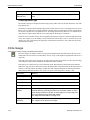
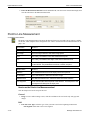
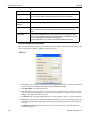
When you click in the value field, the chart property editor is displayed.
(See page “Edit Chart Properties” on page 4-84 for details.)
Height
The control’s height.
Width
The control’s width.
X
The X coordinate of the control’s left edge.
Y
The Y coordinate of the control’s top edge.
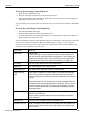
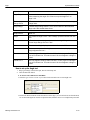
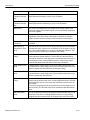
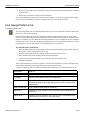
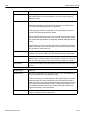
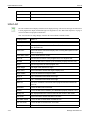
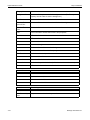
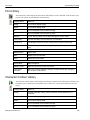
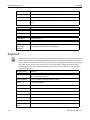
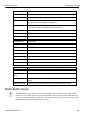
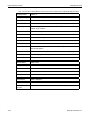
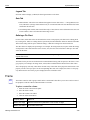
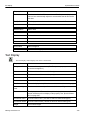
Series 1 Category
The first data series category name. Categories are grouped together on
the chart.
For Vertical Bar charts, you can provide multiple category names for each
series separated by a delimiter (comma by default). Each
"name+indexNumber" in the category is paired with the corresponding
data bar. If there is more data than category names for a series, the
remaining data bars will have the index number for a label.
For Pie Charts, this is the comma delimited string for the pie slice labels.
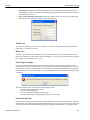
See “Defining a Pie Chart” on page 4-86
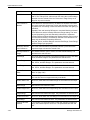
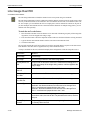
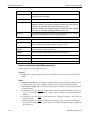
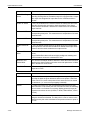
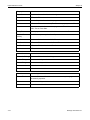
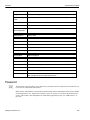
Series 1 Color
Click in the value field to choose the series display color.
For Pie Charts, this is the color of the first data value.
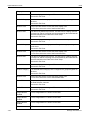
Series 1 Data
The data to be plotted for this series. The data can be a String, Real list,
or Integer list. Values in a String must be separated by the Data Delimiter
character defined on the Data Tab in Chart Setup.
NOTE: For Pie Charts see “Defining a Pie Chart” on page 4-86
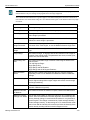
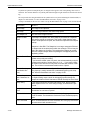
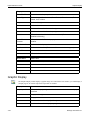
Series 1 Name
The name displayed in the legend. The name must be unique among all
series.
Not used for Pie Chart
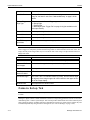
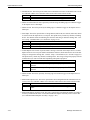
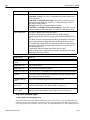
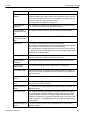
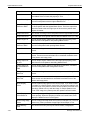
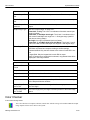
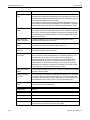
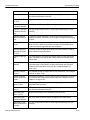
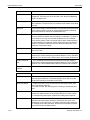
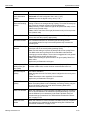
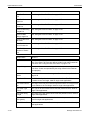
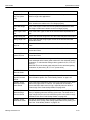
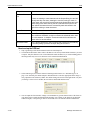
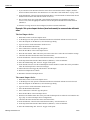
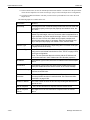
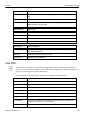
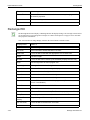
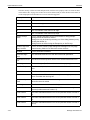
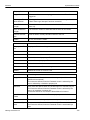
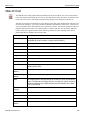
Series 2 Category
The second data series category name. Categories are grouped together
on the chart.
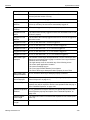
Not used for Pie Chart
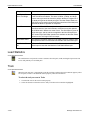
Series 2 Color
Click in the value field to choose the series display color.
For Pie Chart, this is the color of the second data value.
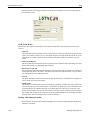
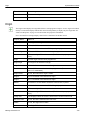
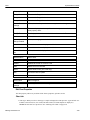
Series 2 Data
The data to be plotted for this series. The data can be a String, Real list,
or Integer list. Values in a String must be separated by the Data Delimiter
character defined on the Data Tab in Chart Setup.
Not used for Pie Chart
Datalogic Automation Inc.
4-82