1
Agilent EasyEXPERT
User’s Guide
Volume 1
Agilent Technologies
Notices
© Agilent Technologies, Inc. 2013
Warranty
No part of this manual may be reproduced
in any form or by any means (including
electronic storage and retrieval or translation into a foreign language) without prior
agreement and written consent from Agilent Technologies, Inc. as governed by
United States and international copyright
laws.
The material contained in this document is provided “as is,” and is subject to being changed, without notice,
in future editions. Further, to the
maximum extent permitted by applicable law, Agilent disclaims all warranties, either express or implied,
with regard to this manual and any
information contained herein, including but not limited to the implied warranties of merchantability and fitness
for a particular purpose. Agilent shall
not be liable for errors or for incidental or consequential damages in connection with the furnishing, use, or
performance of this document or of
any information contained herein.
Should Agilent and the user have a
separate written agreement with
warranty terms covering the material
in this document that conflict with
these terms, the warranty terms in
the separate agreement shall control.
Manual Part Number
B1540-90000
Edition
Edition 1, June 2013
Agilent Technologies, Inc.
5301 Stevens Creek Blvd
Santa Clara, CA 95051 USA
Technology Licenses
The hardware and/or software described in
this document are furnished under a
license and may be used or copied only in
accordance with the terms of such license.
Restricted Rights Legend
If software is for use in the performance of
a U.S. Government prime contract or subcontract, Software is delivered and licensed
as “Commercial computer software” as
defined in DFAR 252.227-7014 (June 1995),
or as a “commercial item” as defined in
FAR 2.101(a) or as “Restricted computer
software” as defined in FAR 52.227-19
(June 1987) or any equivalent agency regulation or contract clause. Use, duplication
or disclosure of Software is subject to Agilent Technologies’ standard commercial
license terms, and non-DOD Departments
and Agencies of the U.S. Government will
receive no greater than Restricted Rights as
defined in FAR 52.227-19(c)(1-2) (June
1987). U.S. Government users will receive
no greater than Limited Rights as defined in
FAR 52.227-14 (June 1987) or DFAR
252.227-7015 (b)(2) (November 1995), as
applicable in any technical data.
For B1500A Users
Agilent B1500A supports the following measurement resources. For reading this
manual, ignore the information about the other resources.
•
HPSMU High power source/monitor unit (B1510A)
•
MPSMU Medium power source/monitor unit (B1511A/B1511B)
•
MCSMU Medium current source/monitor unit (B1514A)
•
HRSMU High resolution source/monitor unit (B1517A)
•
MFCMU or CMU Multi frequency capacitance measurement unit (B1520A)
•
HVSPGU or SPGU High voltage semiconductor pulse generator unit (B1525A)
•
WGFMU Waveform generator/fast measurement unit (B1530A)
For B1505A Users
Agilent B1505A supports the following measurement resources. For reading this
manual, ignore the information about the other resources.
•
HPSMU High power source/monitor unit (B1510A)
•
MPSMU Medium power source/monitor unit (B1511A)
•
HCSMU High current source/monitor unit (B1512A)
•
MCSMU Medium current source/monitor unit (B1514A)
•
HVSMU High voltage source/monitor unit (B1513A/B1513B)
•
MFCMU or CMU Multi frequency capacitance measurement unit (B1520A)
•
HVMCU High voltage medium current unit (N1266A with one B1513B and two
B1514A/B1512A)
•
UHCU Ultra high current unit (N1265A with two B1514A/B1512A)
•
UHVU Ultra high voltage unit (N1268A with two B1514A/B1512A)
In This Manual
This manual describes the reference information of Agilent Technologies EasyEXPERT
which is the system software of Agilent Technologies B1500 device analyzer series.
This manual consists of the following chapters.
1. Main GUI
Provides the reference information of the EasyEXPERT main GUI.
2. Classic Test Definition
Provides the reference information of the classic test setup GUI.
3. Application Test Definition
Provides the reference information of the application test definition setup GUI.
4. Function Details
Explains the several functions and the initial settings of the B1500/EasyEXPERT.
5. Built-in Programming Tool
Provides the reference information of the built-in mathematical functions and the
read-out functions.
User’s Guide Vol. 2 consists of the following chapters.
6. Remote Control Interface
7. Utilities
8. Application Library
9. If You Have a Problem
10. Error Messages
NOTE
To get the latest firmware/software/manual/support information, go to
www.agilent.com and type in EasyEXPERT in the Search field at the top of the page.
Contents
1. Main GUI
Start EasyEXPERT. . . . . . . . . . . . . . . . . . . . . . . . . . . . . . . . . . . . . . . . . . . . . . . . . . . . . . 1-4
Workspace Configurator . . . . . . . . . . . . . . . . . . . . . . . . . . . . . . . . . . . . . . . . . . . . . . . . 1-5
If there is no workspace. . . . . . . . . . . . . . . . . . . . . . . . . . . . . . . . . . . . . . . . . . . . . . . 1-5
If there is one workspace. . . . . . . . . . . . . . . . . . . . . . . . . . . . . . . . . . . . . . . . . . . . . . 1-6
If there are multiple workspace . . . . . . . . . . . . . . . . . . . . . . . . . . . . . . . . . . . . . . . . . 1-8
Main Screen . . . . . . . . . . . . . . . . . . . . . . . . . . . . . . . . . . . . . . . . . . . . . . . . . . . . . . . . . 1-11
Main Screen GUI. . . . . . . . . . . . . . . . . . . . . . . . . . . . . . . . . . . . . . . . . . . . . . . . . . . . 1-12
Run Option . . . . . . . . . . . . . . . . . . . . . . . . . . . . . . . . . . . . . . . . . . . . . . . . . . . . . . . . 1-19
Data Display Manager . . . . . . . . . . . . . . . . . . . . . . . . . . . . . . . . . . . . . . . . . . . . . . . 1-20
Data Display Properties . . . . . . . . . . . . . . . . . . . . . . . . . . . . . . . . . . . . . . . . . . . . . . 1-21
Test Result Editor . . . . . . . . . . . . . . . . . . . . . . . . . . . . . . . . . . . . . . . . . . . . . . . . . . . 1-23
Test Results Data Filter . . . . . . . . . . . . . . . . . . . . . . . . . . . . . . . . . . . . . . . . . . . . . . 1-23
Export in My Format . . . . . . . . . . . . . . . . . . . . . . . . . . . . . . . . . . . . . . . . . . . . . . . . . 1-24
Test Results Data Folder Export. . . . . . . . . . . . . . . . . . . . . . . . . . . . . . . . . . . . . . . . 1-24
Test Results Data Auto Export . . . . . . . . . . . . . . . . . . . . . . . . . . . . . . . . . . . . . . . . . 1-26
Test Results Data Properties . . . . . . . . . . . . . . . . . . . . . . . . . . . . . . . . . . . . . . . . . . 1-28
Application Test . . . . . . . . . . . . . . . . . . . . . . . . . . . . . . . . . . . . . . . . . . . . . . . . . . . . . . 1-29
Tracer Test . . . . . . . . . . . . . . . . . . . . . . . . . . . . . . . . . . . . . . . . . . . . . . . . . . . . . . . . . . . 1-31
Graph Setup Tool. . . . . . . . . . . . . . . . . . . . . . . . . . . . . . . . . . . . . . . . . . . . . . . . . . . . 1-37
Option Tool . . . . . . . . . . . . . . . . . . . . . . . . . . . . . . . . . . . . . . . . . . . . . . . . . . . . . . . . 1-37
Replay traces. . . . . . . . . . . . . . . . . . . . . . . . . . . . . . . . . . . . . . . . . . . . . . . . . . . . . . . 1-39
Select reference traces . . . . . . . . . . . . . . . . . . . . . . . . . . . . . . . . . . . . . . . . . . . . . . 1-40
Select tracking traces. . . . . . . . . . . . . . . . . . . . . . . . . . . . . . . . . . . . . . . . . . . . . . . . 1-41
Color and thickness . . . . . . . . . . . . . . . . . . . . . . . . . . . . . . . . . . . . . . . . . . . . . . . . . 1-41
Oscilloscope View. . . . . . . . . . . . . . . . . . . . . . . . . . . . . . . . . . . . . . . . . . . . . . . . . . . 1-42
Arithmetic Operation Area . . . . . . . . . . . . . . . . . . . . . . . . . . . . . . . . . . . . . . . . . . . . 1-47
Quick Test . . . . . . . . . . . . . . . . . . . . . . . . . . . . . . . . . . . . . . . . . . . . . . . . . . . . . . . . . . . 1-48
Repeat Measurement Setup . . . . . . . . . . . . . . . . . . . . . . . . . . . . . . . . . . . . . . . . . . . . 1-50
Agilent EasyEXPERT User’s Guide Vol. 1, Edition 1
Contents
Thermo-trigger List . . . . . . . . . . . . . . . . . . . . . . . . . . . . . . . . . . . . . . . . . . . . . . . . . . 1-53
Organize Preset Group . . . . . . . . . . . . . . . . . . . . . . . . . . . . . . . . . . . . . . . . . . . . . . . . . 1-56
Calibration . . . . . . . . . . . . . . . . . . . . . . . . . . . . . . . . . . . . . . . . . . . . . . . . . . . . . . . . . . . 1-58
Module Self Calibration . . . . . . . . . . . . . . . . . . . . . . . . . . . . . . . . . . . . . . . . . . . . . . 1-58
SMU Zero Cancel . . . . . . . . . . . . . . . . . . . . . . . . . . . . . . . . . . . . . . . . . . . . . . . . . . . 1-59
CMU Calibration . . . . . . . . . . . . . . . . . . . . . . . . . . . . . . . . . . . . . . . . . . . . . . . . . . . . 1-60
Configuration. . . . . . . . . . . . . . . . . . . . . . . . . . . . . . . . . . . . . . . . . . . . . . . . . . . . . . . . . 1-64
Main Frame . . . . . . . . . . . . . . . . . . . . . . . . . . . . . . . . . . . . . . . . . . . . . . . . . . . . . . . . 1-64
Modules. . . . . . . . . . . . . . . . . . . . . . . . . . . . . . . . . . . . . . . . . . . . . . . . . . . . . . . . . . . 1-65
ASU . . . . . . . . . . . . . . . . . . . . . . . . . . . . . . . . . . . . . . . . . . . . . . . . . . . . . . . . . . . . . . 1-66
Switching Matrix. . . . . . . . . . . . . . . . . . . . . . . . . . . . . . . . . . . . . . . . . . . . . . . . . . . . 1-67
SMU/PG Selector . . . . . . . . . . . . . . . . . . . . . . . . . . . . . . . . . . . . . . . . . . . . . . . . . . . 1-69
Module Selector . . . . . . . . . . . . . . . . . . . . . . . . . . . . . . . . . . . . . . . . . . . . . . . . . . . . 1-69
Dual HCSMU Combination . . . . . . . . . . . . . . . . . . . . . . . . . . . . . . . . . . . . . . . . . . . . 1-71
UHC Expander / Fixture . . . . . . . . . . . . . . . . . . . . . . . . . . . . . . . . . . . . . . . . . . . . . . 1-72
HVSMU Current Expander . . . . . . . . . . . . . . . . . . . . . . . . . . . . . . . . . . . . . . . . . . . . 1-75
UHV Expander . . . . . . . . . . . . . . . . . . . . . . . . . . . . . . . . . . . . . . . . . . . . . . . . . . . . . . 1-77
SMU Output Setting Limits. . . . . . . . . . . . . . . . . . . . . . . . . . . . . . . . . . . . . . . . . . . . 1-78
Event Log . . . . . . . . . . . . . . . . . . . . . . . . . . . . . . . . . . . . . . . . . . . . . . . . . . . . . . . . . . 1-78
Extended Configuration . . . . . . . . . . . . . . . . . . . . . . . . . . . . . . . . . . . . . . . . . . . . . . 1-79
Switching Matrix Operation Panel. . . . . . . . . . . . . . . . . . . . . . . . . . . . . . . . . . . . . . . . 1-81
Standby Channel Definition . . . . . . . . . . . . . . . . . . . . . . . . . . . . . . . . . . . . . . . . . . . . . 1-83
Data Display . . . . . . . . . . . . . . . . . . . . . . . . . . . . . . . . . . . . . . . . . . . . . . . . . . . . . . . . . 1-84
Data Display GUI . . . . . . . . . . . . . . . . . . . . . . . . . . . . . . . . . . . . . . . . . . . . . . . . . . . . 1-86
Display Setup. . . . . . . . . . . . . . . . . . . . . . . . . . . . . . . . . . . . . . . . . . . . . . . . . . . . . . . 1-95
Graph Properties . . . . . . . . . . . . . . . . . . . . . . . . . . . . . . . . . . . . . . . . . . . . . . . . . . . . 1-96
List Display Properties . . . . . . . . . . . . . . . . . . . . . . . . . . . . . . . . . . . . . . . . . . . . . . . 1-97
Tool Bar . . . . . . . . . . . . . . . . . . . . . . . . . . . . . . . . . . . . . . . . . . . . . . . . . . . . . . . . . . . 1-97
Data Status . . . . . . . . . . . . . . . . . . . . . . . . . . . . . . . . . . . . . . . . . . . . . . . . . . . . . . . 1-100
Agilent EasyEXPERT User’s Guide Vol. 1, Edition 1
Contents
Setup Summary. . . . . . . . . . . . . . . . . . . . . . . . . . . . . . . . . . . . . . . . . . . . . . . . . . . . 1-101
Miscellaneous Operations . . . . . . . . . . . . . . . . . . . . . . . . . . . . . . . . . . . . . . . . . . . 1-102
Preview . . . . . . . . . . . . . . . . . . . . . . . . . . . . . . . . . . . . . . . . . . . . . . . . . . . . . . . . . . . . 1-108
Preview Window GUI . . . . . . . . . . . . . . . . . . . . . . . . . . . . . . . . . . . . . . . . . . . . . . . 1-108
Preview Settings . . . . . . . . . . . . . . . . . . . . . . . . . . . . . . . . . . . . . . . . . . . . . . . . . . . 1-110
Text File Export settings . . . . . . . . . . . . . . . . . . . . . . . . . . . . . . . . . . . . . . . . . . . . . . . 1-111
2. Classic Test Definition
I/V Sweep . . . . . . . . . . . . . . . . . . . . . . . . . . . . . . . . . . . . . . . . . . . . . . . . . . . . . . . . . . . . 2-4
Channel Setup. . . . . . . . . . . . . . . . . . . . . . . . . . . . . . . . . . . . . . . . . . . . . . . . . . . . . . . 2-5
Measurement Setup . . . . . . . . . . . . . . . . . . . . . . . . . . . . . . . . . . . . . . . . . . . . . . . . . . 2-6
Multi Channel I/V Sweep . . . . . . . . . . . . . . . . . . . . . . . . . . . . . . . . . . . . . . . . . . . . . . . 2-9
Channel Setup. . . . . . . . . . . . . . . . . . . . . . . . . . . . . . . . . . . . . . . . . . . . . . . . . . . . . . 2-10
Measurement Setup . . . . . . . . . . . . . . . . . . . . . . . . . . . . . . . . . . . . . . . . . . . . . . . . . 2-11
I/V List Sweep . . . . . . . . . . . . . . . . . . . . . . . . . . . . . . . . . . . . . . . . . . . . . . . . . . . . . . . 2-13
Channel Setup. . . . . . . . . . . . . . . . . . . . . . . . . . . . . . . . . . . . . . . . . . . . . . . . . . . . . . 2-14
Measurement Setup . . . . . . . . . . . . . . . . . . . . . . . . . . . . . . . . . . . . . . . . . . . . . . . . . 2-15
Define vector data. . . . . . . . . . . . . . . . . . . . . . . . . . . . . . . . . . . . . . . . . . . . . . . . . . . 2-18
I/V-t Sampling. . . . . . . . . . . . . . . . . . . . . . . . . . . . . . . . . . . . . . . . . . . . . . . . . . . . . . . . 2-21
Channel Setup. . . . . . . . . . . . . . . . . . . . . . . . . . . . . . . . . . . . . . . . . . . . . . . . . . . . . . 2-22
Measurement Setup . . . . . . . . . . . . . . . . . . . . . . . . . . . . . . . . . . . . . . . . . . . . . . . . . 2-23
C-V Sweep . . . . . . . . . . . . . . . . . . . . . . . . . . . . . . . . . . . . . . . . . . . . . . . . . . . . . . . . . . . 2-26
Channel Setup. . . . . . . . . . . . . . . . . . . . . . . . . . . . . . . . . . . . . . . . . . . . . . . . . . . . . . 2-27
Measurement Setup . . . . . . . . . . . . . . . . . . . . . . . . . . . . . . . . . . . . . . . . . . . . . . . . . 2-28
Direct Control . . . . . . . . . . . . . . . . . . . . . . . . . . . . . . . . . . . . . . . . . . . . . . . . . . . . . . . . 2-30
Channel Setup. . . . . . . . . . . . . . . . . . . . . . . . . . . . . . . . . . . . . . . . . . . . . . . . . . . . . . 2-31
Measurement Setup . . . . . . . . . . . . . . . . . . . . . . . . . . . . . . . . . . . . . . . . . . . . . . . . . 2-33
Advanced Setup . . . . . . . . . . . . . . . . . . . . . . . . . . . . . . . . . . . . . . . . . . . . . . . . . . . . 2-34
Command Setup . . . . . . . . . . . . . . . . . . . . . . . . . . . . . . . . . . . . . . . . . . . . . . . . . . . . 2-36
Agilent EasyEXPERT User’s Guide Vol. 1, Edition 1
Contents
compenReZ . . . . . . . . . . . . . . . . . . . . . . . . . . . . . . . . . . . . . . . . . . . . . . . . . . . . . . . . 2-38
compenImZ . . . . . . . . . . . . . . . . . . . . . . . . . . . . . . . . . . . . . . . . . . . . . . . . . . . . . . . . 2-39
compenReY . . . . . . . . . . . . . . . . . . . . . . . . . . . . . . . . . . . . . . . . . . . . . . . . . . . . . . . . 2-40
compenImY . . . . . . . . . . . . . . . . . . . . . . . . . . . . . . . . . . . . . . . . . . . . . . . . . . . . . . . . 2-41
Function Setup . . . . . . . . . . . . . . . . . . . . . . . . . . . . . . . . . . . . . . . . . . . . . . . . . . . . . . . 2-42
Auto Analysis Setup . . . . . . . . . . . . . . . . . . . . . . . . . . . . . . . . . . . . . . . . . . . . . . . . . . . 2-43
Display Setup . . . . . . . . . . . . . . . . . . . . . . . . . . . . . . . . . . . . . . . . . . . . . . . . . . . . . . . . 2-46
SMU Range Setup Window . . . . . . . . . . . . . . . . . . . . . . . . . . . . . . . . . . . . . . . . . . . . . 2-48
ADC and Integration Time Setup Window . . . . . . . . . . . . . . . . . . . . . . . . . . . . . . . . . 2-50
Pulse Setup Window . . . . . . . . . . . . . . . . . . . . . . . . . . . . . . . . . . . . . . . . . . . . . . . . . . 2-51
Advanced Setup Window . . . . . . . . . . . . . . . . . . . . . . . . . . . . . . . . . . . . . . . . . . . . . . . 2-53
Range Setup Window . . . . . . . . . . . . . . . . . . . . . . . . . . . . . . . . . . . . . . . . . . . . . . . . . . 2-55
Advanced Setup Window for C-V Sweep . . . . . . . . . . . . . . . . . . . . . . . . . . . . . . . . . . 2-57
Switching Matrix Control . . . . . . . . . . . . . . . . . . . . . . . . . . . . . . . . . . . . . . . . . . . . . . . 2-59
SPGU Control. . . . . . . . . . . . . . . . . . . . . . . . . . . . . . . . . . . . . . . . . . . . . . . . . . . . . . . . . 2-61
Advanced Setup Window for SPGU Control . . . . . . . . . . . . . . . . . . . . . . . . . . . . . . 2-62
SPGU Pulse Setup Window . . . . . . . . . . . . . . . . . . . . . . . . . . . . . . . . . . . . . . . . . . . . . 2-63
Load Z Setup Window . . . . . . . . . . . . . . . . . . . . . . . . . . . . . . . . . . . . . . . . . . . . . . . . . 2-65
Pulse Switch Setup Window . . . . . . . . . . . . . . . . . . . . . . . . . . . . . . . . . . . . . . . . . . . . 2-66
SPGU ALWG Setup Window . . . . . . . . . . . . . . . . . . . . . . . . . . . . . . . . . . . . . . . . . . . . 2-67
Define ALWG Waveform Window . . . . . . . . . . . . . . . . . . . . . . . . . . . . . . . . . . . . . . . . 2-68
Waveform Pattern Editor . . . . . . . . . . . . . . . . . . . . . . . . . . . . . . . . . . . . . . . . . . . . . 2-71
3. Application Test Definition
Test Definition Window . . . . . . . . . . . . . . . . . . . . . . . . . . . . . . . . . . . . . . . . . . . . . . . . . 3-3
Agilent EasyEXPERT User’s Guide Vol. 1, Edition 1
Contents
Test Specification . . . . . . . . . . . . . . . . . . . . . . . . . . . . . . . . . . . . . . . . . . . . . . . . . . . . . . 3-5
Define Layout . . . . . . . . . . . . . . . . . . . . . . . . . . . . . . . . . . . . . . . . . . . . . . . . . . . . . . 3-10
Test Output . . . . . . . . . . . . . . . . . . . . . . . . . . . . . . . . . . . . . . . . . . . . . . . . . . . . . . . . . . 3-14
Analysis Parameter Definition . . . . . . . . . . . . . . . . . . . . . . . . . . . . . . . . . . . . . . . . . 3-15
Test Contents . . . . . . . . . . . . . . . . . . . . . . . . . . . . . . . . . . . . . . . . . . . . . . . . . . . . . . . . 3-16
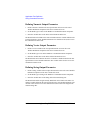
Defining/Editing Test Contents . . . . . . . . . . . . . . . . . . . . . . . . . . . . . . . . . . . . . . . . 3-17
Debugging Test Contents . . . . . . . . . . . . . . . . . . . . . . . . . . . . . . . . . . . . . . . . . . . . . 3-21
Variable Inspector . . . . . . . . . . . . . . . . . . . . . . . . . . . . . . . . . . . . . . . . . . . . . . . . . . . 3-22
External Variable Setup . . . . . . . . . . . . . . . . . . . . . . . . . . . . . . . . . . . . . . . . . . . . . . 3-23
Local Variable Definition . . . . . . . . . . . . . . . . . . . . . . . . . . . . . . . . . . . . . . . . . . . . . . . 3-24
Program Component. . . . . . . . . . . . . . . . . . . . . . . . . . . . . . . . . . . . . . . . . . . . . . . . . . . 3-26
Auto Analysis . . . . . . . . . . . . . . . . . . . . . . . . . . . . . . . . . . . . . . . . . . . . . . . . . . . . . . . . 3-27
Data Display Control. . . . . . . . . . . . . . . . . . . . . . . . . . . . . . . . . . . . . . . . . . . . . . . . . . . 3-30
Display Data Setup . . . . . . . . . . . . . . . . . . . . . . . . . . . . . . . . . . . . . . . . . . . . . . . . . . . . 3-31
GPIB I/O . . . . . . . . . . . . . . . . . . . . . . . . . . . . . . . . . . . . . . . . . . . . . . . . . . . . . . . . . . . . 3-33
Message . . . . . . . . . . . . . . . . . . . . . . . . . . . . . . . . . . . . . . . . . . . . . . . . . . . . . . . . . . . . 3-38
Data Store Control . . . . . . . . . . . . . . . . . . . . . . . . . . . . . . . . . . . . . . . . . . . . . . . . . . . . 3-39
Command Execution. . . . . . . . . . . . . . . . . . . . . . . . . . . . . . . . . . . . . . . . . . . . . . . . . . . 3-40
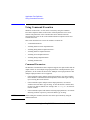
Using Command Execution . . . . . . . . . . . . . . . . . . . . . . . . . . . . . . . . . . . . . . . . . . . . . 3-42
Command Parameters . . . . . . . . . . . . . . . . . . . . . . . . . . . . . . . . . . . . . . . . . . . . . . . 3-42
Defining Numeric/Vector Input Parameter. . . . . . . . . . . . . . . . . . . . . . . . . . . . . . . 3-43
Defining String/Numeric Input Parameters . . . . . . . . . . . . . . . . . . . . . . . . . . . . . . 3-43
Defining Numeric Output Parameter . . . . . . . . . . . . . . . . . . . . . . . . . . . . . . . . . . . . 3-44
Defining Vector Output Parameter. . . . . . . . . . . . . . . . . . . . . . . . . . . . . . . . . . . . . . 3-44
Defining String Output Parameter . . . . . . . . . . . . . . . . . . . . . . . . . . . . . . . . . . . . . . 3-44
Defining Format Field . . . . . . . . . . . . . . . . . . . . . . . . . . . . . . . . . . . . . . . . . . . . . . . . 3-45
Setup Example . . . . . . . . . . . . . . . . . . . . . . . . . . . . . . . . . . . . . . . . . . . . . . . . . . . . . 3-46
Agilent EasyEXPERT User’s Guide Vol. 1, Edition 1
Contents
4. Function Details
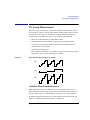
I/V Sweep Measurement. . . . . . . . . . . . . . . . . . . . . . . . . . . . . . . . . . . . . . . . . . . . . . . . 4-3
Available Measurement Resources . . . . . . . . . . . . . . . . . . . . . . . . . . . . . . . . . . . . . . 4-3
Output Range . . . . . . . . . . . . . . . . . . . . . . . . . . . . . . . . . . . . . . . . . . . . . . . . . . . . . . . 4-4
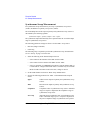
Basic Sweep Measurement . . . . . . . . . . . . . . . . . . . . . . . . . . . . . . . . . . . . . . . . . . . 4-4
Subordinate Sweep Measurement . . . . . . . . . . . . . . . . . . . . . . . . . . . . . . . . . . . . . . 4-6
Synchronous Sweep Measurement . . . . . . . . . . . . . . . . . . . . . . . . . . . . . . . . . . . . . 4-8
Pulsed Sweep Measurement . . . . . . . . . . . . . . . . . . . . . . . . . . . . . . . . . . . . . . . . . . 4-9
Multi Channel I/V Sweep Measurement . . . . . . . . . . . . . . . . . . . . . . . . . . . . . . . . . . 4-12
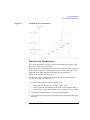
I/V-t Sampling Measurement . . . . . . . . . . . . . . . . . . . . . . . . . . . . . . . . . . . . . . . . . . . 4-13
Available Measurement Resources . . . . . . . . . . . . . . . . . . . . . . . . . . . . . . . . . . . . . 4-13
Operation Summary . . . . . . . . . . . . . . . . . . . . . . . . . . . . . . . . . . . . . . . . . . . . . . . . . 4-13
Setup Parameters . . . . . . . . . . . . . . . . . . . . . . . . . . . . . . . . . . . . . . . . . . . . . . . . . . . 4-15
Time Data and Index . . . . . . . . . . . . . . . . . . . . . . . . . . . . . . . . . . . . . . . . . . . . . . . . . 4-17
Source Output Sequence and Time Origin . . . . . . . . . . . . . . . . . . . . . . . . . . . . . . . 4-18
Sampling Completion . . . . . . . . . . . . . . . . . . . . . . . . . . . . . . . . . . . . . . . . . . . . . . . . 4-18
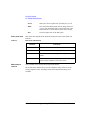
C-V Sweep Measurement. . . . . . . . . . . . . . . . . . . . . . . . . . . . . . . . . . . . . . . . . . . . . . . 4-19
Available Measurement Resources . . . . . . . . . . . . . . . . . . . . . . . . . . . . . . . . . . . . . 4-19
Setup Parameters . . . . . . . . . . . . . . . . . . . . . . . . . . . . . . . . . . . . . . . . . . . . . . . . . . . 4-19
Measurement Parameters . . . . . . . . . . . . . . . . . . . . . . . . . . . . . . . . . . . . . . . . . . . . 4-22
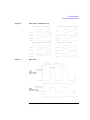
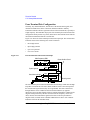
Four-Terminal Pair Configuration . . . . . . . . . . . . . . . . . . . . . . . . . . . . . . . . . . . . . . . 4-24
Error Correction . . . . . . . . . . . . . . . . . . . . . . . . . . . . . . . . . . . . . . . . . . . . . . . . . . . . . 4-25
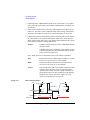
SPGU Module . . . . . . . . . . . . . . . . . . . . . . . . . . . . . . . . . . . . . . . . . . . . . . . . . . . . . . . . 4-27
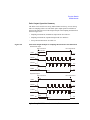
PG Operation Mode. . . . . . . . . . . . . . . . . . . . . . . . . . . . . . . . . . . . . . . . . . . . . . . . . . 4-28
ALWG Operation Mode. . . . . . . . . . . . . . . . . . . . . . . . . . . . . . . . . . . . . . . . . . . . . . . 4-35
Sweep Abort Function . . . . . . . . . . . . . . . . . . . . . . . . . . . . . . . . . . . . . . . . . . . . . . . . . 4-37
When abort occurs . . . . . . . . . . . . . . . . . . . . . . . . . . . . . . . . . . . . . . . . . . . . . . . . . . 4-37
Standby Function . . . . . . . . . . . . . . . . . . . . . . . . . . . . . . . . . . . . . . . . . . . . . . . . . . . . . 4-38
Standby Channels . . . . . . . . . . . . . . . . . . . . . . . . . . . . . . . . . . . . . . . . . . . . . . . . . . . 4-38
Agilent EasyEXPERT User’s Guide Vol. 1, Edition 1
Contents
Standby State . . . . . . . . . . . . . . . . . . . . . . . . . . . . . . . . . . . . . . . . . . . . . . . . . . . . . . 4-38
Output Sequence of Standby Channels. . . . . . . . . . . . . . . . . . . . . . . . . . . . . . . . . . 4-39
To Use Standby Function . . . . . . . . . . . . . . . . . . . . . . . . . . . . . . . . . . . . . . . . . . . . . 4-40
Bias Hold Function . . . . . . . . . . . . . . . . . . . . . . . . . . . . . . . . . . . . . . . . . . . . . . . . . . . . 4-41
Current Offset Cancel . . . . . . . . . . . . . . . . . . . . . . . . . . . . . . . . . . . . . . . . . . . . . . . . . . 4-43
SMU CMU Unify Unit . . . . . . . . . . . . . . . . . . . . . . . . . . . . . . . . . . . . . . . . . . . . . . . . . . 4-45
Atto Sense and Switch Unit. . . . . . . . . . . . . . . . . . . . . . . . . . . . . . . . . . . . . . . . . . . . . 4-47
SMU/PG Selector . . . . . . . . . . . . . . . . . . . . . . . . . . . . . . . . . . . . . . . . . . . . . . . . . . . . . 4-49
Module Selector . . . . . . . . . . . . . . . . . . . . . . . . . . . . . . . . . . . . . . . . . . . . . . . . . . . . . . 4-50
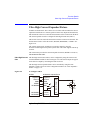
Ultra High Current Expander/Fixture. . . . . . . . . . . . . . . . . . . . . . . . . . . . . . . . . . . . . . 4-51
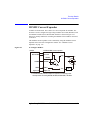
HVSMU Current Expander . . . . . . . . . . . . . . . . . . . . . . . . . . . . . . . . . . . . . . . . . . . . . . 4-53
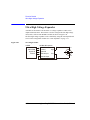
Ultra High Voltage Expander . . . . . . . . . . . . . . . . . . . . . . . . . . . . . . . . . . . . . . . . . . . . 4-54
SMU Ranging Mode . . . . . . . . . . . . . . . . . . . . . . . . . . . . . . . . . . . . . . . . . . . . . . . . . . . 4-55
To Set Ranging Mode . . . . . . . . . . . . . . . . . . . . . . . . . . . . . . . . . . . . . . . . . . . . . . . . 4-55
Auto Ranging . . . . . . . . . . . . . . . . . . . . . . . . . . . . . . . . . . . . . . . . . . . . . . . . . . . . . . 4-56
Limited Auto Ranging . . . . . . . . . . . . . . . . . . . . . . . . . . . . . . . . . . . . . . . . . . . . . . . . 4-57
Fixed Range. . . . . . . . . . . . . . . . . . . . . . . . . . . . . . . . . . . . . . . . . . . . . . . . . . . . . . . . 4-57
Compliance Range . . . . . . . . . . . . . . . . . . . . . . . . . . . . . . . . . . . . . . . . . . . . . . . . . . 4-57
Enhanced Auto Ranging for Current Measurement . . . . . . . . . . . . . . . . . . . . . . . . 4-58
SMU Compliance . . . . . . . . . . . . . . . . . . . . . . . . . . . . . . . . . . . . . . . . . . . . . . . . . . . . . 4-59
Polarity and Output Area . . . . . . . . . . . . . . . . . . . . . . . . . . . . . . . . . . . . . . . . . . . . . 4-59
Power Compliance . . . . . . . . . . . . . . . . . . . . . . . . . . . . . . . . . . . . . . . . . . . . . . . . . . 4-60
To Set Compliance . . . . . . . . . . . . . . . . . . . . . . . . . . . . . . . . . . . . . . . . . . . . . . . . . . 4-61
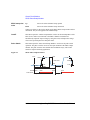
SMU Pulse . . . . . . . . . . . . . . . . . . . . . . . . . . . . . . . . . . . . . . . . . . . . . . . . . . . . . . . . . . 4-62
To Set Pulse Output . . . . . . . . . . . . . . . . . . . . . . . . . . . . . . . . . . . . . . . . . . . . . . . . . 4-62
Pulse Setup Parameters. . . . . . . . . . . . . . . . . . . . . . . . . . . . . . . . . . . . . . . . . . . . . . 4-63
SMU Measurement Time . . . . . . . . . . . . . . . . . . . . . . . . . . . . . . . . . . . . . . . . . . . . . . 4-65
Agilent EasyEXPERT User’s Guide Vol. 1, Edition 1
Contents
Integration Time . . . . . . . . . . . . . . . . . . . . . . . . . . . . . . . . . . . . . . . . . . . . . . . . . . . . 4-65
Overhead Time . . . . . . . . . . . . . . . . . . . . . . . . . . . . . . . . . . . . . . . . . . . . . . . . . . . . . 4-67
To Specify Source Output Time . . . . . . . . . . . . . . . . . . . . . . . . . . . . . . . . . . . . . . . . 4-67
Wait Time . . . . . . . . . . . . . . . . . . . . . . . . . . . . . . . . . . . . . . . . . . . . . . . . . . . . . . . . . 4-68
Multiple Measurement Channels. . . . . . . . . . . . . . . . . . . . . . . . . . . . . . . . . . . . . . . 4-69
SMU Filter . . . . . . . . . . . . . . . . . . . . . . . . . . . . . . . . . . . . . . . . . . . . . . . . . . . . . . . . . . . 4-70
SMU Series Resistor. . . . . . . . . . . . . . . . . . . . . . . . . . . . . . . . . . . . . . . . . . . . . . . . . . . 4-71
Interlock Function . . . . . . . . . . . . . . . . . . . . . . . . . . . . . . . . . . . . . . . . . . . . . . . . . . . . . 4-72
Auto Power Off Function . . . . . . . . . . . . . . . . . . . . . . . . . . . . . . . . . . . . . . . . . . . . . . . 4-73
Initial Settings . . . . . . . . . . . . . . . . . . . . . . . . . . . . . . . . . . . . . . . . . . . . . . . . . . . . . . . 4-74
5. Built-in Programming Tool
Variables and Expressions . . . . . . . . . . . . . . . . . . . . . . . . . . . . . . . . . . . . . . . . . . . . . . . 5-3
Expressions . . . . . . . . . . . . . . . . . . . . . . . . . . . . . . . . . . . . . . . . . . . . . . . . . . . . . . . . . 5-4
Built-in Functions . . . . . . . . . . . . . . . . . . . . . . . . . . . . . . . . . . . . . . . . . . . . . . . . . . . . . . 5-7
Read-out Functions. . . . . . . . . . . . . . . . . . . . . . . . . . . . . . . . . . . . . . . . . . . . . . . . . . . . 5-16
Functions for Marker . . . . . . . . . . . . . . . . . . . . . . . . . . . . . . . . . . . . . . . . . . . . . . . . 5-16
Functions for Cursor . . . . . . . . . . . . . . . . . . . . . . . . . . . . . . . . . . . . . . . . . . . . . . . . . 5-17
Functions for Line . . . . . . . . . . . . . . . . . . . . . . . . . . . . . . . . . . . . . . . . . . . . . . . . . . . 5-17
Functions for Two Line Display . . . . . . . . . . . . . . . . . . . . . . . . . . . . . . . . . . . . . . . . 5-18
Script Program Statements . . . . . . . . . . . . . . . . . . . . . . . . . . . . . . . . . . . . . . . . . . . . . 5-20
Agilent EasyEXPERT User’s Guide Vol. 1, Edition 1
1
Main GUI
Main GUI
This chapter provides the reference information of Agilent EasyEXPERT main GUI.
NOTE
•
“Start EasyEXPERT”
•
“Workspace Configurator”
•
“Main Screen”
•
“Application Test”
•
“Tracer Test”
•
“Quick Test”
•
“Repeat Measurement Setup”
•
“Organize Preset Group”
•
“Calibration”
•
“Configuration”
•
“Switching Matrix Operation Panel”
•
“Standby Channel Definition”
•
“Data Display”
•
“Preview”
•
“Text File Export settings”
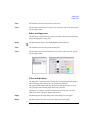
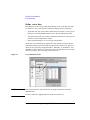
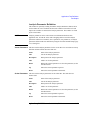
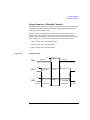
Touch Screen Operation
If you use touch screen operation than mouse, change the font size of menu. Font
size 14 is recommended for the touch screen operation.
Open the Control Panel, select Appearance and Themes, and select Display to open
the Display Properties dialog box. Select the Appearance tab, and click the
Advanced button to open the Advanced Appearance dialog box. On the dialog box,
set Item to Menu, and set the Size of Font to 14.
1- 2
Agilent EasyEXPERT User’s Guide Vol. 1, Edition 1
Main GUI
To start EasyEXPERT, see “Start EasyEXPERT” on page 1-4 and “Workspace
Configurator” on page 1-5.
To perform application test setup, see “Application Test” on page 1-29.
To perform classic test setup, see “Classic Test Definition” on page 2-1.
To perform tracer test setup, see “Tracer Test” on page 1-31.
To perform quick test setup, see “Quick Test” on page 1-48.
To perform measurement, see “Main Screen” on page 1-11.
To display measurement data and perform data analysis, see “Data Display” on page
1-84.
To perform self-test or diagnosis, see “Configuration” on page 1-64.
To perform self-calibration, see “Calibration” on page 1-58.
To control Agilent B2200A/B2201A/E5250A switching matrix connection, see
“Switching Matrix Operation Panel” on page 1-81.
To set the standby channels and the standby mode, see “Standby Channel
Definition” on page 1-83.
To define your application test, see “Application Test Definition” on page 3-1.
Agilent EasyEXPERT User’s Guide Vol. 1, Edition 1
1- 3
Main GUI
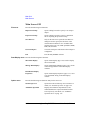
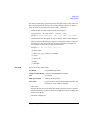
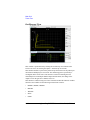
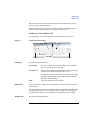
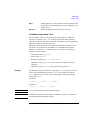
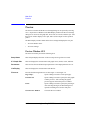
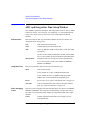
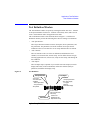
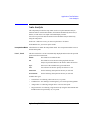
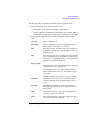
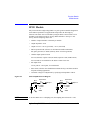
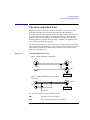
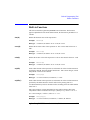
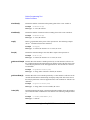
Start EasyEXPERT
Start EasyEXPERT
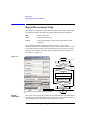
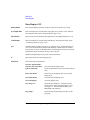
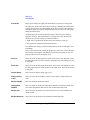
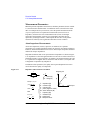
The Start EasyEXPERT window is opened after the B1500 is booted up or by using
the Start EasyEXPERT menu in the Start menu or the Start EasyEXPERT icon on
Windows desktop. This window is not opened after the boot if the automatic start
function is effective. This window provides the following graphical user interface.
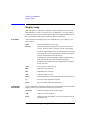
Start EasyEXPERT This button launches EasyEXPERT.
File menu
Provides the following function.
Exit
Option menu
Closes the Start EasyEXPERT window.
Provides the following functions.
Auto Start of EasyEXPERT Enables or disables the automatic start function. If
this label is checked, the function is enabled. From
the next boot or logon, the Start EasyEXPERT
window will be skipped and EasyEXPERT will be
launched. To disable this function, use the Start
EasyEXPERT window opened by the File > Exit
menu on the EasyEXPERT main screen. This
function is not effective for Desktop EasyEXPERT.
EasyEXPERT Database
•
Provides the following functions.
Backup EasyEXPERT Database
Opens the EasyEXPERT Database Backup Creation Wizard used to make
backup of the EasyEXPERT database. You can make backup easily by following
the wizard. Required time depends on the database size.
•
Restore EasyEXPERT Database
Opens the EasyEXPERT Database Restoration Wizard used to restore the
EasyEXPERT database backup. You can restore the backup easily by following
the wizard. Required time depends on the database size.
EasyEXPERT Database is the folder used to store your test setup data and such.
1- 4
Agilent EasyEXPERT User’s Guide Vol. 1, Edition 1
Main GUI
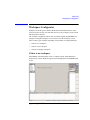
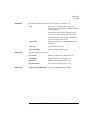
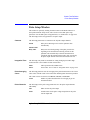
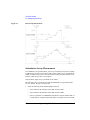
Workspace Configurator
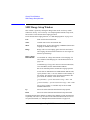
Workspace Configurator
Workspace means the space created in the B1500 internal hard disk drive, and is
used to store the test setup, test result data, and so on. The workspace can be created
and allocated for each user.
The workspace configurator will run after you launch Agilent EasyEXPERT. The
workspace configurator displays a screen used to select the workspace you use.
There are three types of display, depending on the number of existing Workspace.
•
“If there is no workspace”
•
“If there is one workspace”
•
“If there are multiple workspace”
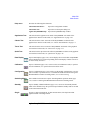
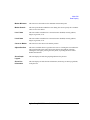
If there is no workspace
EasyEXPERT will automatically create a workspace (Name: Initial Workspace,
Scope: Private, Owner: Windows login account) and display the EasyEXPERT main
screen.
Agilent EasyEXPERT User’s Guide Vol. 1, Edition 1
1- 5
Main GUI
Workspace Configurator
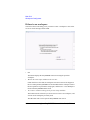
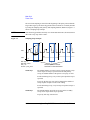
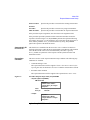
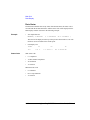
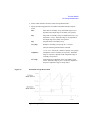
If there is one workspace
You will see the screen asking you if you want to create a workspace or not. Select
Yes or No for the message and click OK.
•
OK
This button displays the EasyEXPERT main screen using the specified
workspace.
•
Work on the same setups and data in the next time.
If this check box is checked, the workspace selection screen will be skipped at
the next startup and EasyEXPERT will be launched with the workspace used at
the last operation. To perform this setup again, click the File > Close Workspace
menu on the EasyEXPERT main screen.
•
Yes, I want to continue working on the previous setups and data.
This button must be selected if you do not want to create a new workspace, and
want to use the workspace previously used.
The OK button will work to open the EasyEXPERT main screen.
1- 6
Agilent EasyEXPERT User’s Guide Vol. 1, Edition 1
Main GUI
Workspace Configurator
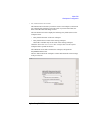
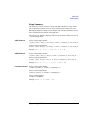
•
No, I want to start a new session.
This button must be selected if you want to create a new workspace, and want to
use it instead of the workspace previously used. If you select this button, the
label of the OK button will change to Next.
The Next button will work to display the following entry fields used to set the
workspace name.
•
Entry field for the name of the new workspace
•
Entry field for the new name of the existing workspace
This field is available only for the owner of the existing workspace.
Check the Allow other users to access this workspace box to create a public
workspace that is opened for all users.
The OK button creates and/or renames the workspace, and opens the
EasyEXPERT main screen.
The Prev button cancels the workspace creation and returns the screen message
to the previous one.
Agilent EasyEXPERT User’s Guide Vol. 1, Edition 1
1- 7
Main GUI
Workspace Configurator
•
No, I want to manage Workspaces.
This button must be selected if you want to manage workspaces. If you select
this button, the label of the OK button will change to Next.
The Next button will work to change the screen as shown in “If there are
multiple workspace”.
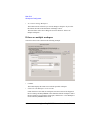
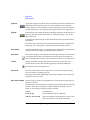
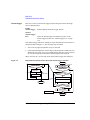
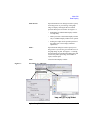
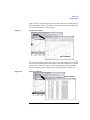
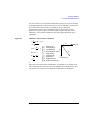
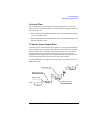
If there are multiple workspace
You will see the screen as shown in the following example.
•
Continue
This button displays the main screen with the specified workspace.
•
Choose the same Workspace in the next time.
If this check box is checked, the workspace selection screen will be skipped at
the next startup, and EasyEXPERT will be launched with the workspace used at
the last operation. To perform this setup again, click the File > Close Workspace
menu on the EasyEXPERT main screen.
1- 8
Agilent EasyEXPERT User’s Guide Vol. 1, Edition 1
Main GUI
Workspace Configurator
•
Create a new Workspace
This button must be selected if you want to create a new workspace. Enter the
name of the new workspace in the Workspace Name field.
Check the Allow other users to access this workspace box to create a public
workspace that is opened for all users.
•
Open an existing Workspace
•
Your Workspace
This button must be selected if you want to open your workspace. Select the
name to specify the workspace to open.
•
Name: Workspace name
•
Scope: Private (only for owner) or Public (for all users)
The Manage Workspaces button opens Workspace Manager which provides
the buttons used to manage workspaces. Select the workspace name and
click a button.
•
•
Delete: Deletes the selected workspace.
•
Rename: Renames the selected workspace.
•
Duplicate: Makes a copy of the selected workspace.
•
Import: Opens a dialog box used to import a workspace.
•
Export: Opens a dialog box used to export the selected workspace. The
workspace is exported as a file of the extension xws.
•
Public: Changes the scope of the selected workspace to Public.
•
Close: Closes the Workspace Manager.
Public Workspace owned by other users
This button must be selected if you want to open a public workspace created
by another user. Select the name to specify the workspace to open.
•
Name: Workspace name
•
Owner: Owner of the workspace
Agilent EasyEXPERT User’s Guide Vol. 1, Edition 1
1- 9
Main GUI
Workspace Configurator
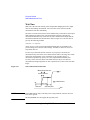
NOTE
Private workspace
Private workspace is secured by the user account of its owner. User accounts other
than the owner cannot open the Private workspace.
User account of owner: <domain name>\<user name>
Example: B1500A-12345678\Agilent B1500 User
If you do not join the domain but login the local computer, <domain name> will be
the computer name.
NOTE
If you change the user account
If you need to change the domain name, the computer name, or the user name,
change the scope of all workspace in the EasyEXPERT database to Public before
changing the user account.
The new account cannot open the Private workspace created by the previous user
account.
Also, it is recommended to make a backup of the EasyEXPERT database before
changing the user account after changing the scope to Public.
1- 10
Agilent EasyEXPERT User’s Guide Vol. 1, Edition 1
Main GUI
Main Screen
Main Screen
The EasyEXPERT main screen will be displayed after the workspace is specified or
created by the workspace configurator. The main screen provides several tools and
functions described in this section.
•
“Main Screen GUI”
•
“Run Option”
•
“Data Display Manager”
•
“Data Display Properties”
•
“Test Result Editor”
•
“Test Results Data Filter”
•
“Export in My Format”
•
“Test Results Data Folder Export”
•
“Test Results Data Auto Export”
•
“Test Results Data Properties”
Agilent EasyEXPERT User’s Guide Vol. 1, Edition 1
1- 11
Main GUI
Main Screen
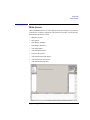
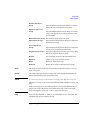
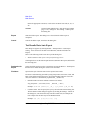
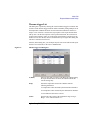
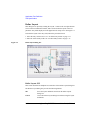
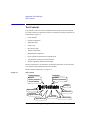
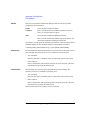
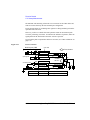
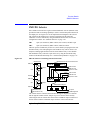
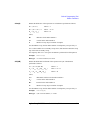
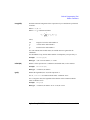
Main Screen GUI
File menu
Provides the following four functions.
Import Test Setup...
Opens a dialog box used to specify a test setup to
import.
Export Test Setup...
Opens a dialog box used to specify a destination
file for exporting the present test setup.
Save Data As...
Only for the tracer test. Opens the Save Data As...
dialog box used to specify the file name of the
measurement result data to save. Available data
formats are the Text, CSV, XML spreadsheet, BMP,
EMF, GIF, and PNG.
Close Workspace
Closes the work space and returns to the workspace
configurator.
Exit
Exits the EasyEXPERT software.
Data Display menu Provides the following three functions.
Show Data Display
Opens “Data Display (page 1-84)” used to display
the test result data.
Manage Data Display...
Opens “Data Display Manager (page 1-20)” used to
control the appearances of the Data Display
windows.
Default Data Display
Properties...
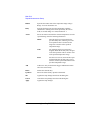
Option menu
Opens “Data Display Properties (page 1-21)” used
to set the default setting of the Data Display
window.
Provides the following two functions. Only for the tracer test.
Oscilloscope View
Opens/closes the Oscilloscope View window. For
details, see “Oscilloscope View” on page 1-42.
Arithmetic Operation
Displays the Arithmetic Operation area, and
enables/disables the expressions defined in that
area respectively. For details, see “Arithmetic
Operation Area” on page 1-47.
1- 12
Agilent EasyEXPERT User’s Guide Vol. 1, Edition 1
Main GUI
Main Screen
Help menu
Provides the following three functions.
About This Instrument...
Opens the Configuration window.
About This Test...
Opens the test description dialog box.
Agilent EasyEXPERT Help
Opens the EasyEXPERT help window.
Application Test
This tab selects the application test mode of EasyEXPERT. For details of the
graphical user interface in this mode, see “Application Test” on page 1-29.
Classic Test
This tab selects the classic test mode of the EasyEXPERT. For details of the
graphical user interface in this mode, see “Classic Test Definition” on page 2-1.
Tracer Test
This tab selects the tracer test mode of EasyEXPERT. For details of the graphical
user interface in this mode, see “Tracer Test” on page 1-31.
Quick Test
This tab selects the quick test mode of the EasyEXPERT. For details of the graphical
user interface in this mode, see “Quick Test” on page 1-48.
Data Display
Opens “Data Display (page 1-84)” used to display the test result data. EasyEXPERT
always handles the test setup corresponding to the Data Display window now active
or most recently activated.
Calibration
Opens “Calibration (page 1-58)” used to see the self-calibration results, to perform
the self-calibration, or to perform the current offset cancel.
Configuration
Opens “Configuration (page 1-64)” used to see the module configuration, to see the
self-test results, to perform self-test, to establish the GPIB connection with Agilent
B2200A/B2201A/E5250A switching matrix, or to see the event log.
Switching Matrix
Not available for the B1505A. Opens “Switching Matrix Operation Panel (page
1-81)” used to control Agilent B2200A/B2201A/E5250A switching matrix.
Standby
Opens “Standby Channel Definition (page 1-83)” used to set the standby channel
which is the channel to keep the specified output when the standby mode is ON and
in the non-measurement state.
Single
Triggers a single measurement. To abort measurement, click Stop button that
appears instead of the Single button.
Agilent EasyEXPERT User’s Guide Vol. 1, Edition 1
1- 13
Main GUI
Main Screen
Append
Triggers the append measurement. The measurement results will be appended to the
Data Display window that shows the previous measurement results. The Data
Display window can have maximum 10 layers for displaying measurement results.
To abort measurement, click Stop button that appears instead of the Single button.
Repeat
This button provides a different function depending on the status of the data record
functions (Auto Record and Auto Export). See “Run Option (page 1-19)” for the
data record status.
If Auto Record and Auto Export is OFF, this button starts the repeat measurement
immediately.
If Auto Record or Auto Export is ON, this button opens the “Repeat Measurement
Setup (page 1-50)” dialog box for setting the repeat measurement condition.
Run Option
Opens the “Run Option (page 1-19)” dialog box for setting the data record functions
(Auto Record and Auto Export) and the Multi Display function.
Save data
This button will appear to the right side of the Run Option button if a measurement
is performed when the data record functions (Auto Record and Auto Export) are
OFF. Clicking the button will save the last measurement data as a test result record.
Count
Displays the number of single measurements executed for the test setup now
opened. Effective for the measurements triggered by both Single and Repeat.
The 0 button sets the Count field to zero.
Device ID
This entry field is used to enter a string in the test record. The string can data ID,
device ID, test ID, or anything you want.
Performing measurement and changing setup do not change the value in this field.
Change the value if you want.
My Favorite Setup
The test setups you create or modify MUST be saved to My Favorite group (preset
group) to reuse them.
Click the My Favorite Setup button to display the menu that provides the following
functions. Select the preset group by using the field below the button. The test
setups can be recalled by using the area below the field.
Cancel
Closes the menu.
Preset Group
Provides the following seven functions.
Add New Preset Group
Opens the Add Preset Group dialog box. Creates a new
preset group and saves it as the specified name.
1- 14
Agilent EasyEXPERT User’s Guide Vol. 1, Edition 1
Main GUI
Main Screen
Rename This Preset
Group
Duplicate This Preset
Group
Opens the Rename Preset Group dialog box. You can
change the name of the present preset group.
Opens the Duplicate Preset Group dialog box. Creates
a copy of the present preset group and saves it as the
specified name.
Delete This Preset Group You can delete the present preset group.
Import Preset Group...
Export This Preset
Group...
Opens the Preset Group Import dialog box. Imports the
specified preset group.
Opens the Preset Group Export dialog box. Exports the
present preset group as the specified name.
Organize Preset Group... Opens the “Organize Preset Group (page 1-56)” dialog
box used to organize the preset group.
Rename
You can change the name of the selected test setup.
Duplicate
Creates a copy of the selected test setup.
Delete
Deletes the selected test setup.
Delete All
Deletes all test setups in the present preset group.
Save
The button saves the present test setup into the present preset group as a new test
setup of the group.
Recall
The button recalls the selected test setup. This means opening and displaying the
measurement definition of the selected test setup.
NOTE
If a tracer test setup is recalled on the test mode other than the tracer test
The tracer test setup is converted to and recalled as a Multi Channel I/V Sweep test
setup.
In this conversion process, the VAR1 dual polarity sweep setup (Dual Polarity) is
ignored. The setup of the positive sweep from start to stop is converted, but the
setup of the negative sweep from -start to -stop is not converted.
Flag
Shows the flag, Important (!), Valid (#), or Questionable (?) set to the record. The
top button sorts the test records by the flag.
Agilent EasyEXPERT User’s Guide Vol. 1, Edition 1
1- 15
Main GUI
Main Screen
While the “Show Deleted Data (page 1-17)” function is enabled, the list area can
show the test records in Delete-group. For the records, * is set to the column to the
left of the Flag column. The top button sorts the list by *.
Setup Name
Shows the test setup name. The top button sorts the test records by name, in
lexicographical order.
Date
Shows the date that the test result is recorded. The top button sorts the test records
by date, in chronological order.
Count
Shows the measurement count shown in the Count field. The top button sorts the
test records by count, in numerical order.
Device ID
Shows the string set to the record by using the Device ID field. The top button sorts
the test records by device ID, in lexicographical order.
Remarks
Shows the remarks set to the record. The top button sorts the test records by the
remarks in the lexicographic order.
Thermometer OFF This indicator is located at the bottom of the EasyEXPERT main screen and is lit
while the Thermometer is enabled. And one of the following informations is
displayed instead of “Thermometer OFF”. The information is toggled by clicking
the indicator. Where, XX indicates the temperature value.
•
T1: XX deg C
Temperature measured by the thermometer channel 1.
•
T2: XX deg C
Temperature measured by the thermometer channel 2.
•
dT: XX deg C
Difference between temperature values measured by the channels 1 and 2.
Multi Display ON
This indicator is located at the bottom of the EasyEXPERT main screen and is lit
while the Multi Display function is enabled.
Standby ON
This indicator is located at the bottom of the EasyEXPERT main screen and is lit
while the standby function is enabled (standby mode is ON).
SMU Zero ON
This indicator is located at the bottom of the EasyEXPERT main screen and is lit
while the SMU current offset cancel function is enabled.
1- 16
Agilent EasyEXPERT User’s Guide Vol. 1, Edition 1
Main GUI
Main Screen
Auto Export ON
This indicator is located at the bottom of the EasyEXPERT main screen and is lit
while the Auto Export (automatic data export) function is enabled.
Auto Record OFF
This indicator is located at the bottom of the EasyEXPERT main screen and is lit
while the Auto Record (automatic data record) function is disabled.
workspace name
Field below the Results button shows the present workspace name.
Results
This button provides the following functions. The list area shows the test records.
The up or down arrow button is used to expand or reduce the list area.
Cancel
Closes the menu.
Select All
Selects all records.
Unselect All
Unselects all records.
Display Data
Opens the “Data Display (page 1-84)” and displays the
test result data of the selected record. Up to 15
windows can be opened by this function.
Recall
Recalls the test setup of the selected record.
Filter
Provides the following four functions.
Show Deleted Data
Check this function to see the test records of both
Save-group and Delete-group. To set the data group,
see “Flag and Remarks” on page 1-19. See also “Test
Result Editor (page 1-23)”.
Filter...
Opens the “Test Results Data Filter (page 1-23)” dialog
box. You can filter the test records in the list area.
Expand Application Test
Results
Check this function to see all test records created by the
test setups defined in an application test.
If a test record is exported when this function is not
checked, the exported file will contain all records
created by the test setups defined in an application test.
However, if the test record is exported by the Export
As Text File function, the exported file will contain
only the test record of the application test.
Agilent EasyEXPERT User’s Guide Vol. 1, Edition 1
1- 17
Main GUI
Main Screen
Show All Append Data
Check this function to see all test records created by the
append measurement. In the test record list, S indicates
the test records obtained by a single measurement, and
A indicates the records obtained by an append
measurement.
Transport Data
Provides the following ten functions.
Import...
Opens the Test Result Import dialog box. Imports the
specified test record.
Export As Test Result...
Opens the Test Result Export dialog box. Exports the
selected test record as the specified name in the
EasyEXPERT data format.
Export As Compressed
Test Result...
Export As CSV...
Opens the Compressed Test Result Export dialog box.
Exports the selected test record as the specified name
in the compressed EasyEXPERT data format.
Opens the CSV File Export dialog box. Exports the
selected test record as the specified name in the CSV
format that can be read by a spread sheet software.
Export As XML Spread
Sheet...
Opens the XML Style Sheet Export dialog box.
Exports the selected test record as the specified name
in the XML spread sheet format that can be read by a
spread sheet software.
Export in My Format...
Opens the “Export in My Format (page 1-24)” dialog
box. Exports the selected test record as the specified
name in the style converted by using the specified
XSLT filter.
Export As Text File...
Opens the Text File Export dialog box. Exports the
selected test record as the specified name in the style
defined on the “Text File Export settings (page 1-111)”
dialog box.
Text File Export Setting... Opens the “Text File Export settings (page 1-111)”
dialog box used to define the style of the test record
exported by the Export As Text File function.
Folder Export...
1- 18
Opens the “Test Results Data Folder Export (page
1-24)” dialog box used to export the selected multiple
test records to the specified folder.
Agilent EasyEXPERT User’s Guide Vol. 1, Edition 1
Main GUI
Main Screen
Auto Export Setting...
Opens the “Test Results Data Auto Export (page 1-26)”
dialog box used to set the automatic data export
function and the automatic data save function.
Edit
Provides the following two functions.
Flag and Remarks
Opens the “Test Result Editor (page 1-23)” used to put
the selected test record in Save-group or Delete-group.
Also this dialog box can set a flag and remarks to the
selected record. The available data flags are Important
(!), Valid (#), and Questionable (?).
Delete
Puts the selected test records in Delete-group. The
records can be displayed in the list area while the
“Show Deleted Data (page 1-17)” is checked.
Properties...
Opens the “Test Results Data Properties (page 1-28)”
dialog box used to set the number of test records listed
in the list area and the number of recoverable records in
Delete-group.
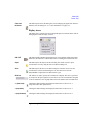
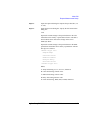
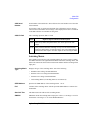
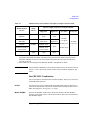
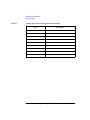
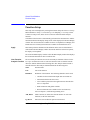
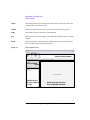
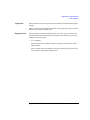
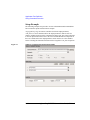
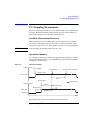
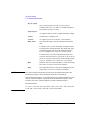
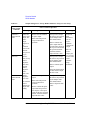
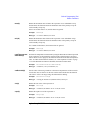
Run Option
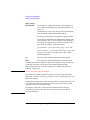
This dialog box appears by clicking the Run Option button and is used to set the data
record functions (Auto Record and Auto Export) and the Multi Display function.
This dialog box provides the following GUI.
•
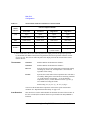
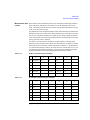
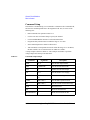
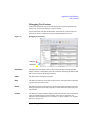
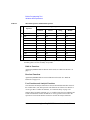
Record Test Result Data Automatically
This check box changes the status of the data record functions (Auto Record and
Auto Export). The functions provide four status shown in Table 1-1. Removing
the check sets Auto Export=Auto Record=OFF. And putting the check again
returns the status to the previous one.
In the checked status, the data record functions can be set to one of three status
except for Auto Export=Auto Record=OFF. To set the functions, use “Test
Results Data Auto Export (page 1-26)”.
In the unchecked status (Auto Export=Auto Record=OFF), the test result data
will not be recorded. If a measurement is performed in this status, the Save Data
button will appear to the right side of the Run Option button. Clicking the Save
Data button will save the last measurement data as a test result record.
Agilent EasyEXPERT User’s Guide Vol. 1, Edition 1
1- 19
Main GUI
Main Screen
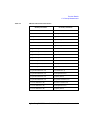
When the automatic data record function is enabled, one test execution result is
stored in one test record. For the classic test, one test result is stored in one test
record. For the application test, all test results taken by executing one
application test are stored in one test record. However, the automatic data export
function using the Text File type exports the file for each test result.
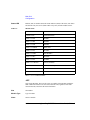
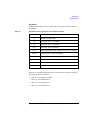
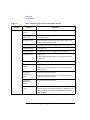
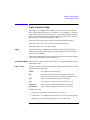
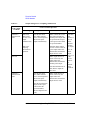
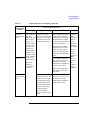
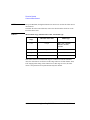
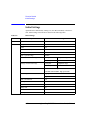
Table 1-1
Record Test Result Data Automatically Check Box and Data Record Functions
Checked status
•
Unchecked status
Auto Export
Auto Record
Auto Export
Auto Record
ON
OFF
OFF
OFF
ON
ON
OFF
ON
Allocate Data Display for each test
This check box sets the Multi Display function ON (checked) or OFF. This
function controls the operation of the Data Display window.
OFF
Test result data will be always displayed on the singular Data
Display window even if the test setup is changed.
ON
Test result data of the same test setup name will be displayed on the
exclusive Data Display window and the test result data of the
different test setup name will be displayed on the new Data Display
window.
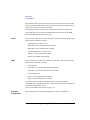
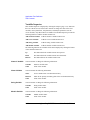
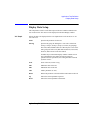
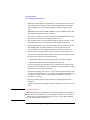
Data Display Manager
This dialog box is opened by selecting the Manage Data Display... function of the
Data Display menu, and is used to control the appearances of the Data Display
windows. This dialog box provides the following three action buttons.
OK
Applies the setup changes and closes this dialog box.
Cancel
Cancels the setup changes and closes this dialog box.
Apply
Just applies the setup changes.
1- 20
Agilent EasyEXPERT User’s Guide Vol. 1, Edition 1
Main GUI
Main Screen
Data Display
Window Order
Minimized Data
Displays
Data Display
Window
Configuration
Apply same scale
to all graph
This area lists the Setup Name of the Data Display windows opened. The list items
from top to bottom correspond to the windows from front to back in the screen
image. This area supports the following buttons. To select the item, click one in the
list.
Up
Moves the selected item upward.
Down
Moves the selected item downward.
Select All
Selects all items.
Minimize
Minimizes the windows corresponding to the selected items.
The list items move to the Minimized Data Displays area.
Close
Closes the windows corresponding to the selected items.
This area lists the Setup Name of the Data Display windows minimized. This area
supports the following buttons. To select the item, click one in the list.
Select All
Selects all items.
Restore
Restores the windows corresponding to the selected items.
Close
Closes the windows corresponding to the selected items.
This area provides the following radio buttons and a check box to change the
appearances of the Data Display windows. All functions are available for the opened
windows.
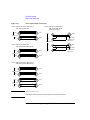
Keep Setup
Keeps the present configuration of the Data Display windows.
Tiling
Resize and collate the data display windows such that they fill
up the entire screen.
Stacking
Resize and collate the data display windows so that they
overlap slightly with an offset.
Overlaying
Resize, overlap, and make transparent the data display windows
so that multiple graphs can be viewed and superimposed on one
another.
This check box must be checked to apply the same graph scale to all graphs.
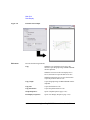
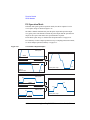
Data Display Properties
This dialog box is opened by selecting the Default Data Display Properties...
function of the Data Display menu, and is used to set the default setting of the Data
Display window. Click the OK button to apply the setup and close this dialog box.
Agilent EasyEXPERT User’s Guide Vol. 1, Edition 1
1- 21
Main GUI
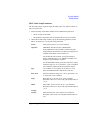
Main Screen
Effective Area
This area is used to select the area effective when the Data Display window is
opened, and provides the following check box.
X-Y Graph
Enables the X-Y Graph area.
Logo ON
Displays the Agilent logo at the upper left
of the graph area.
Grid ON
Displays the grid on the graph.
Setup Summary
ON
Graph Color
This is valid only for the I/V Sweep and
Multi Channel I/V Sweep classic tests.
Displays the channel setup summary at the
bottom of the graph area. See “Setup
Summary” on page 1-101.
List Display
Enables the List Display area.
Parameters
Enables the Parameters area.
This area is used to set the color map for the X-Y Graph Plot area. You can change
the color of the background, text, graph grid, and line/cursor. The color palette is
opened by clicking the pattern of the item.
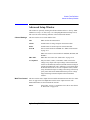
Graph Trace Color This area is used to set visibility, color, and thickness of the data traces Y1 to Y8
plotted on the graph. The color palette is opened by clicking the pattern of the item.
Log Scale
This area is used to set the maximum number of decades to show the minor ticks for
on the log axis. If the number of graph decades is less than or equal to the entered
value, the minor ticks are displayed. If it is greater than the entered value, the minor
ticks are not displayed.
Text Size
This area is used to set the font size for the graph. The available settings are Largest,
Large, Medium, Small, Smallest, and Fixed. For settings other than Fixed, the
appropriate size is automatically selected. For Fixed, a font size entry field is
provided, and the specified font size is always applied.
X/Y Axis Title
Font size for the axis title
Scale
Font size for the X and Y coordinate values
Legend
Font size for the graph legend
1- 22
Agilent EasyEXPERT User’s Guide Vol. 1, Edition 1
Main GUI
Main Screen
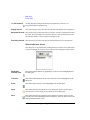
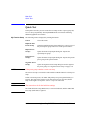
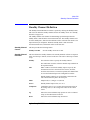
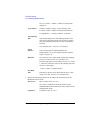
Test Result Editor
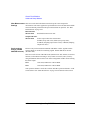
The Test Result Editor appears when measurement is completed or by clicking
Results > Edit > Flag & Remarks. This is used to set a flag and remarks to the
associated test record and provides the following GUI.
Save, Delete
Divides test records into groups, Save and Delete.
Test records in Save-group are always listed in the lower area of the EasyEXPERT
main screen.
Test records in Delete-group can be listed while Results > Filter >
Show Deleted Data is checked.
Flags
The following buttons are available. You can set one of the following flags.
•
Important ! button
Sets the important flag (!) to the test record.
•
Valid # button
Sets the valid flag (#) to the test record.
•
Questionable ? button
Sets the questionable flag (?) to the test record.
Remarks
You can enter characters into this field. The characters will be recorded as the
Remarks value of the test record.
OK
Applies the setup on the Test Result Editor, and closes this dialog box.
Test Results Data Filter
This dialog box appears by clicking Results > Filter > Filter... and is used to specify
the test records listed in the lower area of the EasyEXPERT main screen.
Data records in
Save-group
Check this box to list the test records in Save-group.
Data records in
Delete-group
Check this box to list the test records in Delete-group.
Flag
Select or enter a flag in this field to list the test records with the specified flag.
Agilent EasyEXPERT User’s Guide Vol. 1, Edition 1
1- 23
Main GUI
Main Screen
Setup Name
Select or enter a test name in this field to list the test records of the specified name.
Date
Specify the date to list the test records within the specified period.
Count
Specify the count values to list the test records within the specified range.
Device ID
Select or enter the device ID to list the test records of the specified device ID.
Remarks
Specify the remarks value to list the test records with the specified value.
OK
Performs filtering, and closes this dialog box.
Cancel
Cancels filtering, and closes this dialog box.
Export in My Format
This dialog box appears by clicking Results > Transport Data > Export in My
Format..., and is used to export the test record by performing the style conversion
using the XSLT filter.
My Format
Specify the full path name of the XSLT filter (XML style sheet) used to convert the
style of the test record. The Browse... button opens the Select XML Style Sheet File
dialog box used to select the file.
Export As...
Opens the Export As dialog box. Specify the file name and the file type, and export
the test record.
Cancel
Cancels data export, and closes this dialog box.
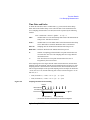
Test Results Data Folder Export
This dialog box appears by clicking Results > Transport Data > Folder Export...
after the test result records are selected (highlighted).
This function is used to export the multiple test records. The test records can be
exported by specifying the records, the destination folder name, and the naming rule
and the file type for the exported files.
Destination for
Export
Selects the folder used to save the exported test records. The Browse... button opens
the Browse For Folder dialog box used to select the folder.
File Name
Specifies the style of the file name for the exported test records.
1- 24
Agilent EasyEXPERT User’s Guide Vol. 1, Edition 1
Main GUI
Main Screen
File name is automatically generated by using Setup Name, Device ID, Count, and
Date values defined in the main screen. If an impermissible character is used in a
value, the character is automatically replaced with _ (underscore).
•
Default Format: File name without extension is as follows.
Flag SetupName [DeviceID(Count) _Remarks_; Date]
Example: # Id-Vd [cmos1(1) _ok_; 1_22_2006 3_44_55 PM]
•
Custom Format: You can specify the style by the File Name Format dialog box.
The File Name Format dialog box appears by clicking the Settings... button. In
the dialog box, enter the desired style into the Format field, for example, the
next example sets the same style as the Default Format.
Example: {4} {0} [{3}({2}) {5}; {1}]
{0}: Setup Name
{1}: Date, mm_dd_yyyy hh_mm_ss AM/PM
{2}: Count
{3}: Device ID
{4}: Flag
{5}: Remarks
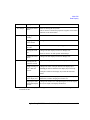
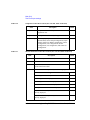
File Type
Selects the file type (data format).
Test Result
EasyEXPERT data format
Compressed Test Result Compressed EasyEXPERT data format
CSV
CSV format
XML Spread Sheet
XML spread sheet format
My Format
Custom format created by the specified XSLT filter. The
following two entry fields are available.
•
My Format
Specifies the file name of the XSLT filter (XML style sheet) used to export test
records. The Browse... button opens the Select XML Style Sheet File dialog box
used to select the file.
•
Extension of Output File
Agilent EasyEXPERT User’s Guide Vol. 1, Edition 1
1- 25
Main GUI
Main Screen
Enters the appropriate extension, or selects the extension from xml, txt, csv, or
xls.
Text File
Custom format defined in the “Text File Export settings
(page 1-111)” dialog box. The Settings... button opens
this dialog box.
Export
Starts the folder export. This dialog box is closed after the folder export is
completed.
Cancel
Cancels the folder export, and closes this dialog box.
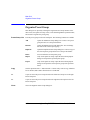
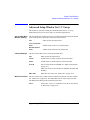
Test Results Data Auto Export
This dialog box appears by clicking Results > Transport Data > Auto Export
Setting... and is used to set the data record functions (Auto Record and Auto
Export).
There is the following check box at the top of this dialog box.
•
Enable automatic data export to the specified storage device
Checking this box sets the Auto Export function (automatic data export) and enables
the following GUI.
Destination for
Export
Selects the folder used to save the exported test records. The Browse... button opens
the Browse For Folder dialog box used to select the folder.
File Name
Specifies the style of the file name for the exported test records.
File name is automatically generated by using Setup Name, Device ID, Count, and
Date values defined in the main screen. If an impermissible character is used in a
value, the character is automatically replaced with _ (underscore).
•
Default Format: File name without extension is as follows.
Flag SetupName [DeviceID(Count) _Remarks_; Date]
Example: # Id-Vd [cmos1(1) _ok_; 1_22_2006 3_44_55 PM]
•
Custom Format: You can specify the style by the File Name Format dialog box.
The File Name Format dialog box appears by clicking the Settings... button. In
the dialog box, enter the desired style into the Format field, for example, the
next example sets the same style as the Default Format.
Example: {4} {0} [{3}({2}) {5}; {1}]
1- 26
Agilent EasyEXPERT User’s Guide Vol. 1, Edition 1
Main GUI
Main Screen
{0}: Setup Name
{1}: Date, mm_dd_yyyy hh_mm_ss AM/PM
{2}: Count
{3}: Device ID
{4}: Flag
{5}: Remarks
File Type
Selects the file type (data format).
Test Result
EasyEXPERT data format
Compressed Test Result Compressed EasyEXPERT data format
CSV
CSV format
XML Spread Sheet
XML spread sheet format
My Format
Custom format created by the specified XSLT filter. The
following two entry fields are available.
•
My Format
Specifies the file name of the XSLT filter (XML style sheet) used to export test
records. The Browse... button opens the Select XML Style Sheet File dialog box
used to select the file.
•
Extension of Output File
Enters the appropriate extension, or selects the extension from xml, txt, csv, or
xls.
Text File
Data Storage
Custom format defined in the “Text File Export settings
(page 1-111)” dialog box. The Settings... button opens
this dialog box.
Remove a check from the following check box to disable the Auto Record function
(automatic data record).
•
Enable automatic data record to the internal storage device
OK
Applies the setup, and closes this dialog box.
Cancel
Cancels the setup, and closes this dialog box.
NOTE
Automatic Data Record Output
Agilent EasyEXPERT User’s Guide Vol. 1, Edition 1
1- 27
Main GUI
Main Screen
When the automatic data record function is enabled, one test execution result is
stored in one test record. For the classic test, one test result is stored in one test
record. For the application test, all test results taken by executing one application
test are stored in one test record. However, the automatic data export function using
the Text File type exports the file for each test result.
Test Results Data Properties
This dialog box appears by clicking Results > Properties... and is used to set the
maximum number of test records listed in the main screen and saved in the
Delete-group.
Test Result List
View
Sets the maximum number of test records listed in the main screen.
Non-preserved
data
Sets the maximum number of test records saved in the Delete-group.
Close
Closes this dialog box.
1- 28
Agilent EasyEXPERT User’s Guide Vol. 1, Edition 1
Main GUI
Application Test
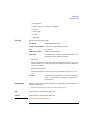
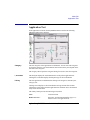
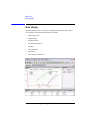
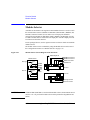
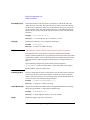
Application Test
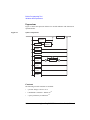
In the application test mode, the EasyEXPERT main screen has the following
additional graphical user interface.
Category
Lists the categories of the application test definitions. You can select the categories
by using the check box. The test definitions listed in the Library area depend on the
selection of the categories.
The Category button opens the Categories dialog box used to select the categories.
i, test name
This field just displays the test definition name of the present application test.
Clicking the left i button displays the help message for the test definition.
Library
Lists the application test definitions that belong to the categories selected by the
Category area.
Clicking an icon displays its brief introduction message and the Select button.
Clicking the Select button loads the application test definition. Now, the B1500 is
ready to start measurement.
The Library button provides the following six functions.
Close
Closes this menu.
Define New Test...
Opens the “Test Definition Window (page 3-3)”
used to create a new application test.
Agilent EasyEXPERT User’s Guide Vol. 1, Edition 1
1- 29
Main GUI
Application Test
Open Definition of This Test...
Opens the “Test Definition Window (page 3-3)” to
display the definition of the present (selected)
application test or to modify the definition.
Delete Definition of This Test Deletes the present (selected) application test. The
test will be deleted from the application library.
Import Test Definition...
Opens a dialog box used to specify the test
definition to import.
Export Test Definition...
Opens a dialog box used to export the present
application test definition. The test definition will
be saved to the specified file.
Search
Incremental search. Used to search the application test definitions listed in the
Library area.
Setup Name
Used to set the name of test setup. The name must be the identification for the test
setup saved to a My Favorite group (preset group). Enter a unique name that is
distinct from other setup.
The name is stored in the test result data and is used to differentiate the records in
the test record list area.
Device Parameters This area displays the device parameter entry fields if the device parameters are
defined as the variables in the application test definition.
Enter the appropriate value to the entry fields before starting measurement.
Test Parameters
This area displays the device connection diagram if it is specified in the application
test definition.
This area also displays the test parameter entry fields if the test parameters are
defined as the variables in the application test definition. Enter the appropriate value
to the entry fields before starting measurement. If the entry field needs to enter a
vector data, see “Define vector data” on page 2-18.
Extended Setup
This button opens the Extended Setup dialog box that displays the extended
parameter entry fields. See “Ext” on page 3-6 for the parameters shown in this
dialog box.
Enter the appropriate value to the entry fields and click Close button.
1- 30
Agilent EasyEXPERT User’s Guide Vol. 1, Edition 1
Main GUI
Tracer Test
Tracer Test
In the tracer test mode, you can start I/V sweep measurement easily and quickly by
setting up the I/V Trace screen only. The EasyEXPERT main screen has the
following additional graphical user interface.
Setup Name
Used to set the name of test setup. The name must be the identification for the test
setup saved to a My Favorite group (preset group). Enter a unique name that is
distinct from other setup.
The name is recorded in the test result data and is used to differentiate the data in the
test record list area.
Graph area
This area displays measurement result graph and provides “Graph Setup Tool” and
“Option Tool” for setting and changing the graph display.
Mouse drag operation zooms in the graph. To set the graph maximum or minimum
value directly, use the entry field displayed by clicking the value on the graph.
Channel area
This area defines the channel setups and the variables for the channel output data
and the measurement data.
Agilent EasyEXPERT User’s Guide Vol. 1, Edition 1
1- 31
Main GUI
Tracer Test
Add
Adds a row of the channel setup by selecting a SMU listed in
the menu displayed by clicking this button.
Delete
Deletes the selected channel setup.
Up / Down
Moves the selected channel setup upward or downward.
Unit
Measurement resource used for the source output or
measurement
V Name
Variable name of voltage output or measurement data
I Name
Variable name of current output or measurement data
Mode
Output mode. V (voltage), I (current), VPULSE (voltage pulse),
or IPULSE (current pulse).
Function
Output function, VAR1 (primary sweep), VAR2 (secondary
sweep), or CONST (constant)
To select a channel setup, use the left radio button of the channel setup. If multiple
output channels are defined, the channels start output sequentially. The order is top
to bottom of the channels defined in this screen. The output stops in the opposite
order.
Sample setups
Clicking this button displays the sample setup menu. Clicking a setup name applies
its setup to the tracer test environment.
The B1500A provides the following sample setups.
•
MOSFET: ID-VDS, ID-VGS, ID(off)-VDS, BVDSS
•
Diode: IF-VF, IR-VR
•
BJT: IC-VCE, IC-VCEO, BVCEO
The B1505A provides the following sample setups.
•
MOSFET: ID-VDS, ID-VGS, ID(off)-VDS, BVDSS
•
Diode: IF-VF, IR-VR
•
IGBT: IC-VCE, IC-VGE, IC(off)-VCE, BVCES
•
BJT: IC-VCE, IC-VCEO, BVCEO, IC-VCBO, BVCBO
•
GaN FET (N1267A): ID-VDS, ID(off)-VDS, ID-VDS Current Collapse, FET
Current Collapse Oscilloscope View
•
GaN Diode (N1267A): IF-VF, IR-VR, IF-VF Current Collapse, Diode Current
Collapse Oscilloscope View
1- 32
Agilent EasyEXPERT User’s Guide Vol. 1, Edition 1
Main GUI
Tracer Test
VAR1
This area defines the primary sweep source output. All of the following parameters
are displayed for the full mode. Only Mode, Stop, NOS, and Compliance are
displayed for the short mode. Click the VAR1 title bar to switch the mode.
Mode
Sweep mode. The single mode sweeps from start to stop, and
the double mode sweeps from start to stop to start.
LIN-SGL
Linear sweep, single mode
LOG-SGL
Logarithmic sweep, single mode
LIN-DBL
Linear sweep, double mode
LOG-DBL
Logarithmic sweep, double mode
Start
Sweep start value
Stop
Sweep stop value
Step
Incremental step value of the sweep output. The value is
automatically calculated by using the start, stop, and NOS
values.
NOS
Number of sweep steps N. 1 to 1001.
Interlacing
Number of the interlace sweep M. 1 to 100.
Sweep is repeated M times so that the final sweep step is equal
to Step/M. Total number of steps will be N+(N-1)(M-1).
Compliance
Compliance value. Enter the current limit value for the voltage
source, or the voltage limit value for the current source.
Measurement is performed within this value.
Pwr Comp.
Power compliance value (in W), or OFF
V Compliance
Only for UHCU, UHVU, or HVMCU. Limit value for the
voltage sweep output. The output voltage of the measurement
resource is automatically measured, and the measured voltage is
compared with this limit value. And then, if it exceeds the limit,
the measurement status is set to the compliance status, and the
sweep measurement stops. Voltage range and setting resolution
depend on the measurement resource.
Dual Polarity
Dual polarity sweep ON or OFF. If this parameter is ON, the
VAR1 channel performs positive sweep from start to stop and
negative sweep from -start to -stop in this order. For the pulsed
negative sweep, the pulse base value is -1(Pulse Base).
Agilent EasyEXPERT User’s Guide Vol. 1, Edition 1
1- 33
Main GUI
Tracer Test
Hold Time
Hold time (in seconds) of the primary sweep source output just
before starting a sweep. 0 to 655.35. Setting resolution: 10 ms.
In the hold time, the primary sweep source forces the sweep
start level for staircase sweep output, or the pulse base level for
pulsed sweep output.
At the first step of the primary sweep, the longer one is applied
from the VAR1 and VAR2 Hold Time settings.
The following parameters are also displayed for the full mode if the IPULSE or
VPULSE is set to the VAR1 channel.
VAR2
Pulse Base
Pulse base value
Pulse Delay
Pulse delay time. Set 0 for HR/MP/HPSMU.
Pulse Width
Pulse width. Must be the same value for all of HR/MP/HPSMU.
This area defines the secondary sweep source output. The VAR2 channel performs
the linear single sweep operation. All of the following parameters are displayed for
the full mode. Only Start, Stop, Step, and NOS are effective for the short mode.
Click the VAR2 title bar to switch the mode.
Start
Sweep start value
Stop
Sweep stop value
Step
Incremental step value of the sweep output. The value is
automatically calculated by using the start, stop, and NOS
values.
NOS
Number of sweep steps. 1 to 101.
Compliance
Compliance value. Enter the current limit value for the voltage
source, or the voltage limit value for the current source.
Measurement is performed within this value.
Pwr Comp.
Power compliance value (in W), or OFF
V Compliance
Only for UHCU, UHVU, or HVMCU. Limit value for the
voltage sweep output. The output voltage of the measurement
resource is automatically measured, and the measured voltage is
compared with this limit value. And then, if it exceeds the limit,
the measurement status is set to the compliance status, and the
sweep measurement stops. Voltage range and setting resolution
depend on the measurement resource.
1- 34
Agilent EasyEXPERT User’s Guide Vol. 1, Edition 1
Main GUI
Tracer Test
Hold Time
Hold time (in seconds) of the primary sweep source output just
before starting a sweep. 0 to 655.35. Setting resolution: 10 ms.
In the hold time, the primary sweep source forces the sweep
start level for staircase sweep output, or the pulse base level for
pulsed sweep output.
At the first step of the primary sweep, the longer one is applied
from the VAR1 and VAR2 Hold Time settings.
The following parameters are also displayed for the full mode if the IPULSE or
VPULSE is set to the VAR2 channel.
CONST
Pulse Base
Pulse base value
Pulse Delay
Pulse delay time. Set 0 for HR/MP/HPSMU.
Pulse Width
Pulse width. Must be the same value for all of HR/MP/HPSMU.
This area defines the constant output source.
Unit
Measurement resource for the constant output. If multiple
CONST channels are defined, this field is used to specify the
channel for setup.
Source
Output value.
Compliance
Compliance value. Enter the current limit value for the voltage
source, or the voltage limit value for the current source.
Measurement is performed within this value.
V Compliance
Only for UHCU, UHVU, or HVMCU. Limit value for the
voltage sweep output. The output voltage of the measurement
resource is automatically measured, and the measured voltage is
compared with this limit value. And then, if it exceeds the limit,
the measurement status is set to the compliance status, and the
sweep measurement stops. Voltage range and setting resolution
depend on the measurement resource.
The following parameters are also displayed for the full mode if the IPULSE or
VPULSE is set to the CONST channel. Click the CONST title bar to switch the
mode. The Pulse Peak entry field appears instead of the Source entry field.
Pulse Peak
Pulse peak value.
Pulse Base
Pulse base value
Pulse Delay
Pulse delay time. Set 0 for HR/MP/HPSMU.
Pulse Width
Pulse width. Must be the same value for all of HR/MP/HPSMU.
Agilent EasyEXPERT User’s Guide Vol. 1, Edition 1
1- 35
Main GUI
Tracer Test
Meas. Time
This field is used to set the measurement time for a sweep step.
Meas. Delay Time
This field is used to set the measurement delay time (from the beginning of pulse
period to the beginning of measurement) for a pulse step. This entry field appears if
a pulse output channel exists.
2 s to Pulse period - Measurement time - 2 ms, 2 s resolution
Measurement delay time = 0 (AUTO) sets the optimum value automatically so that
the measurement is completed when the transition from peak to base is started by
the pulse output channel which starts the transition at first.
Step Time
This field is used to set the output time for a sweep step. 500 s to 5 s, 100 s step.
Pulse Period
This field is used to set the pulse period. This entry field appears instead of the Step
Time entry field if a pulse output channel exists.
NOTE
About measurement time and measurement error
In the tracer test mode, measurement is always performed by using the following
settings.
•
A/D converter: HS ADC (high speed A/D converter)
•
Measurement ranging mode: compliance range, fixed
•
Effective current measurement range: all for staircase sweep output, 10 nA and
greater for bias output or pulse output
•
Measurement time: absolute value entered into the Meas. Time field
You may find difference between the results measured in the tracer test mode and in
the other test mode. This is caused by the differences of setting values for the above
items. The above settings will reduce measurement time and increase measurement
error compared with when using HR ADC (high speed A/D converter) and auto
ranging in the other test mode.
NOTE
Drag the region of VAR1, VAR2, and CONST
Mouse drag operation will scroll this region when it cannot display all setup
parameters.
1- 36
Agilent EasyEXPERT User’s Guide Vol. 1, Edition 1
Main GUI
Tracer Test
Graph Setup Tool
The graph setup tool provides the following GUI for setting the graph display.
X-axis direction
This button is used to set the X-axis direction, left to right () or right to left ().
Y-axis direction
This button is used to set the Y-axis direction, down to up ( ) or up to down ( ).
Variable
This field is used to set the X-axis/Y-axis variable name to plot.
Variable must be V Name or I Name used for sweep output or measurement.
Scale
This button is used to set the X-axis/Y-axis scale, linear (LIN) or logarithm (LOG).
Polarity
This button is used to set the X-axis/Y-axis polarity, plus (+) only, minus (-) only, or
both plus and minus (). Both plus and minus () is available only for the linear
scale.
Option Tool
The following tool is available for changing the graph display.
Line/Dot
This button is used to set the trace style, line or dot.
Cancel zoom
This button is available for the graph zoomed in, and is used to return the graph
scale to the original setting. The graph can be zoomed in by the point and drag
operation.
Set stop condition This button is used to set the abnormal region on the graph, and shows the present
area
status of the abnormal region setup by using the button’s signal color. While the
abnormal region is effective, the measurement is automatically stopped if the
measurement data is in the region.
Green
Abnormal region has not been defined. Clicking this button changes the
button’s signal color to Yellow.
Yellow
Status for defining the abnormal region. Clicking this button changes
the button’s signal color to Green.
Agilent EasyEXPERT User’s Guide Vol. 1, Edition 1
1- 37
Main GUI
Tracer Test
The abnormal region can be defined by the point and drag operation. It
will be the square specified by the red grids. After defining the region,
this button’s signal color is changed to Red.
Red
Abnormal region is effective. Clicking this button changes the button’s
signal color to Green.
Replay traces
This button opens/closes the dialog box used for managing the record and replay of
traces. For the dialog box, see “Replay traces” on page 1-39.
Capture a
reference trace
This button is used to capture the trace as the reference trace. Clicking this button
captures one reference trace. Up to 10 traces can be captured. To manage reference
traces, click the reference trace button.
Select reference
traces
This button opens/closes the dialog box used for managing reference traces
memorized by clicking the Capture button. For the dialog box, see “Select reference
traces” on page 1-40.
Select tracking
traces
This button is available for the measurement result which contains at least two
traces by the append measurement. Tracking trace means each trace of this
measurement result. This button opens/closes the dialog box used for managing
tracking traces. For the dialog box, see “Select tracking traces” on page 1-41.
Marker
This button enables/disables the marker which can be moved on the active trace by
using rotary knob or mouse. The marker position X and Y coordinate values are
displayed in the upper left of the graph.
Tangent line
This button enables the marker and enables/disables the tangent line for the marker
point. The line X-axis intercept, Y-axis intercept, and gradient values are displayed
in the upper right of the graph. The tangent line disables the regression line.
Regression line
This button enables the marker and enables/disables the line which is given by the
regression calculation. The line X-axis intercept, Y-axis intercept, and gradient
values are displayed in the upper right of the graph. The regression line disables the
tangent line. The measurement data for the regression calculation can be specified
by the point and drag operation.
Oscilloscope View This button opens/closes the Oscilloscope View window used for monitoring the
waveforms of output signals. For the window, see “Oscilloscope View” on page
1-42.
1- 38
Agilent EasyEXPERT User’s Guide Vol. 1, Edition 1
Main GUI
Tracer Test
Color and
thickness
This button opens/closes the dialog box used for changing the graph color and trace
thickness. For the dialog box, see “Color and thickness” on page 1-41.
Replay traces
This dialog box is opened/closed by clicking the Replay traces button and is used for
managing the record and replay of traces.
ON / OFF
This button enables/disables the automatic trace record function. While this button
labels ON, this function is enabled and continues recording the measurement trace.
Open
This button opens the Open Trace Record dialog box which is used to open a
recorded-trace saved by using the Save Trace Record dialog box.
Save
This button opens the Save Trace Record dialog box which is used to save the
recorded-trace selected on this dialog box. The trace data is saved in the
EasyEXPERT Compressed Trace Record format (.gtr).
Slide bar
The slide bar is used to specify the recorded-trace to display. The trace is specified
by N/M put on the space right next to the slide bar. N is the record number assigned
to the recorded-trace now on graph and M is the total number of the recorded-traces.
<< (fast back)
Clicking this button changes the displayed recorded-trace to the trace N-1.
Long-click makes this operation fast.
< (step back)
Clicking this button changes the displayed recorded-trace to the trace N-1.
> (step forward)
Clicking this button changes the displayed recorded-trace to the trace N+1.
Agilent EasyEXPERT User’s Guide Vol. 1, Edition 1
1- 39
Main GUI
Tracer Test
>> (fast forward)
Clicking this button changes the displayed recorded-trace to the trace N+1.
Long-click makes this operation fast.
Replay Interval
This field is used to set the time interval of the fast back and fast forward operation.
Maximum Records This field is used to set the maximum record count. After the record number reaches
this value, the record numbers are shifted to the newer side and the oldest record is
deleted. This number is always assigned to the last record.
Recording Interval This field is used to set the time interval of the automatic trace record operation.
Select reference traces
This dialog box is opened/closed by clicking the Select reference traces button and
is used for managing the reference traces memorized by clicking the Capture button.
Show/Hide
selected trace
This button enables/disables the graph display of the trace selected/highlighted on
this dialog box.
Inversion
This button enables/disables the inversion of the trace selected/highlighted on this
dialog box.
Erase
This button deletes the trace selected/highlighted on this dialog box.
Open
This button opens the Open Reference Trace dialog box which is used to open a
reference trace saved by using the Save Reference Trace dialog box.
Save
This button opens the Save Reference Trace dialog box which is used to save the
reference trace selected/highlighted on this dialog box. The trace data is saved in the
XML spreadsheet format (.xml).
1- 40
Agilent EasyEXPERT User’s Guide Vol. 1, Edition 1
Main GUI
Tracer Test
Time
This field shows the time stamp of the reference trace.
Trace
This field shows the title of the reference trace. The title is same as the title appears
top of the graph frame.
Select tracking traces
This dialog box is opened/closed by clicking the Select tracking traces button and is
used for managing the tracking traces.
Erase
This button deletes the trace selected/highlighted on this dialog box.
Time
This field shows the time stamp of the tracking trace.
Trace
This field shows the title of the tracking trace. The title is same as the title appears
top of the graph frame.
Color and thickness
This dialog box is opened/closed by clicking the Color and thickness button and is
used for changing color of the graph color and the trace thickness.
The graph elements supported by this dialog box are background, text, X and Y
axes, graph grid, frame around graph, marker, line, and traces.
Clicking the color pattern opens the color palette for selecting color. The color
palette provides the function to add the custom colors.
Apply
This button applies the setup change made on this dialog box to the graph.
Reset
This button applies the initial setting to this dialog box and the graph.
Agilent EasyEXPERT User’s Guide Vol. 1, Edition 1
1- 41
Main GUI
Tracer Test
Oscilloscope View
Oscilloscope View
This window is opened/closed by clicking the Oscilloscope View button on the
Tracer Test screen, or selecting the Option > Oscilloscope View menu.
This function monitors a point of the pulsed sweep measurement or the pulsed spot
measurement and displays its waveform. The monitoring point is specified by a
rectangular marker on the trace. This function is used for monitoring the time
relationship between multiple channel outputs/measurements, the change of the
output level for the gate drive channel, and so on.
This function is valid for using one or more VPULSE or IPULSE channels. And this
function is not available for the following measurement resources.
•
HRSMU, HPSMU, MPSMU
•
MFCMU
•
WGFMU
•
SPGU
•
GNDU
1- 42
Agilent EasyEXPERT User’s Guide Vol. 1, Edition 1
Main GUI
Tracer Test
Data names set in the V Name and I Name fields of the channel area are used to
specify the target monitored signals.
During executing the tracer test, the waveforms within the specified duration are
displayed in this window graphically. The display resolution is 2 s.
Oscilloscope View Window GUI
The Oscilloscope View window provides the following GUI. See Figure 1-1.
Figure 1-1
Oscilloscope View Window
Marker
Time/division
Marker position
Time origin
Data at Marker position
File menu
Duration of measurement
Vertical data/division and offset value
Provides the following function.
Save Setting
Saves the setup data for waveform monitor. The setup data is
saved as a part of the tracer test setup.
Save Data As...
Opens the Save Waveform Data dialog box used to specify the
file name of the displayed waveform data to save.
Available data formats are the Text (tab separated), CSV, XML
spreadsheet, BMP (bitmap image), EMF (enhanced metafile),
GIF image, and PNG image.
Close
Data menu
Closes the Oscilloscope View window.
Lists all the names of voltage/current output data set in the present tracer test with
serial numbers.
Checking a data name enables to monitor the signal corresponding to the data name,
and display the waveform in the Oscilloscope View window. If not checking, the
waveform for the data name is not displayed in the Oscilloscope View window.
Setup menu
Provides the following functions.
Agilent EasyEXPERT User’s Guide Vol. 1, Edition 1
1- 43
Main GUI
Tracer Test
Window menu
Monitor area
Time > Scale
Opens the Time Scale dialog box. Enter the scale value of the X
axis (time) per division in the dialog box.
Time > Origin
Opens the Time Origin dialog box. Enter the origin value of the
X axis (time) in the dialog box.
Sampling
Opens the Sampling Setup dialog box. See “Sampling Setup”
on page 1-45.
N. data name
The data names that are checked on the Data menu are listed.
Opens the Data View dialog box. See “Dialog box for changing
data display” on page 1-45. Where, N is a serial number.
Provides the following functions.
Large
Changes the window size to the prescribed large window.
Small
Changes the window size to the prescribed small window.
This area displays a waveform graph in the center. All monitored waveforms are
displayed on this graph. A vertical marker is available to read out the values on all
waveforms at a certain time.
The waveforms and the relational information are organized by color. To change the
color, select the Setup > N. data name menu to open the Data View dialog box. See
“Dialog box for changing data display” on page 1-45, for this dialog box.
The display items in the monitor area are described below.
Marker position
Marker position (X-axis (time) data). Displayed on the upper
left of the graph. To move the marker position, use rotary knob
or mouse.
Data at Marker position
Y-axis (voltage or current) values at the marker position.
Displayed with the data names on the left of the graph
respectively.
1- 44
Agilent EasyEXPERT User’s Guide Vol. 1, Edition 1
Main GUI
Tracer Test
Time/division
Time scale value per division. Displayed on the top of the
graph. To change it, click on the displayed value and open the
Time Scale dialog box. Enter the scale value of the X axis
(time) per division in the dialog box.
Time Origin
Time origin value. Displayed on the bottom of the graph. To
change it, click on the displayed value and open the Time
Origin dialog box. Enter the origin value of the X axis (time) in
the dialog box.
Duration of measurement
Duration of the measurement for the presently-monitored sweep
step. Indicated by the green horizontal lines displayed on the
top and button of the graph. Hence, you can observe the time
relationship between the measurement time and the waveform.
Vertical data/division and offset value
Y-axis scale value per division and offset value. Displayed on
the right of the graph respectively. To change them, click on the
displayed value and open the Data View dialog box. See
“Dialog box for changing data display” on page 1-45, for this
dialog box.
Dialog box for changing data display
This dialog box is opened by selecting the Setup > N. data name menu, or by
clicking on the scale or offset value shown on the right area of the graph display.
This is used for changing the Y-axis scale, offset, the color of the line and characters,
and the line thickness.
Clicking the color pattern opens the color palette for selecting color. The color
palette provides the function to add the custom colors.
Sampling Setup
This dialog box is opened by selecting the Setup > Sampling menu. This is used for
setting up the sampling conditions of the waveform monitoring.
The target observing step is decided by the following combination:
•
The ordinal number of the sweep step on the primary sweep source output
(VAR1 Step)
•
The ordinal number of the sweep step on the secondary sweep source output
(VAR2 Step)
Agilent EasyEXPERT User’s Guide Vol. 1, Edition 1
1- 45
Main GUI
Tracer Test
The waveform sampling is started from the beginning of the pulse period within the
target observing step. The observing period on the waveforms is eventually decided
by setting the sampling delay (Delay) and sampling duration (Duration). Figure 1-2
shows a sampling setup example.
NOTE
If the observing period does not fully cover the measurement time, the measurement
data at the sweep step will be "NaN".
Figure 1-2
Sampling Setup Example
3rd
2nd
1st
VAR1
Pulse
period
VAR2
3rd
2nd
1st
VAR1 Step = 2
VAR2 Step = EACH
Delay = 0 s
Duration = pulse_period
VAR1 Step:
Oscilloscope View monitors
waveforms in these timeframes.
The ordinal number (N) of the sweep step on the primary sweep
source output. N-th step is specified. For the dual polarity
sweep, the ordinal number of the positive sweep step is valid.
For the interlacing sweep, every N-th step on repeated sweeps is
specified.
To specify the last step, enter LAST. Changing the number of
sweep step has no impact on the LAST setting.
For the interlacing sweep, every last step on repeated sweeps is
specified.
VAR2 Step:
The ordinal number (M) of the sweep step on the secondary
sweep source output. M-th step is specified.
To specify each step, enter EACH.
1- 46
Agilent EasyEXPERT User’s Guide Vol. 1, Edition 1
Main GUI
Tracer Test
Delay:
Sampling delay time. This is the time from the beginning of the
pulse period to the beginning of the waveform sampling, -30 s
to pulse period.
Duration:
Duration to sample the waveforms, 22 s to 24 ms.
Arithmetic Operation Area
This area appears at the top of the graph by clicking the Option > Arithmetic
Operation > Operation N (N: 1, 2, or 3) menu, and is used to define arithmetic
expressions using the measurement result data. This function is useful to graphically
display parameters given by the expressions.
Maximum of three expressions can be defined as Operation 1, Operation 2, and
Operation 3. An expression can be defined by two operands and an operator +
(addition), - (subtraction), * (multiplication), or / (division). The following
elements can be the operand.
Example
•
Measurement data (e.g. Imeas)
•
Source data (e.g. Vset)
•
Real literal constant (e.g. 2, 0.123, or 100E-3)
•
Operation 1 result (e.g. Vdrop), for the expression of Operation 2 and/or
Operation 3
•
Operation 2 result (e.g. Vout), for the expression of Operation 3
The following example calculates the voltage drop (Vdrop) caused by a 100 k
series resistor and measurement current (Imeas), then calculates the voltage
(Vout) applied to a device under test by subtracting the voltage drop from the
setting value (Vset).
Operation 1:
[ Vdrop ] = [ 100e3 ] * [ Imeas ]
Operation 2:
[ Vout ] = [ Vset ] - [ Vdrop ]
NOTE
“NaN” is returned for the invalid calculation results.
NOTE
To disable the operation, click the Option > Arithmetic Operation > Operation N
menu and uncheck the Operation N menu.
Agilent EasyEXPERT User’s Guide Vol. 1, Edition 1
1- 47
Main GUI
Quick Test
Quick Test
In the quick test mode, you can execute the test setups saved in a preset group (My
Favorite Setup) sequentially. The EasyEXPERT main screen has the following
additional graphical user interface.
My Favorite Setup The following menu is displayed by clicking this button.
Cancel
Duplicate This
Preset Group
Import Preset
Group...
Export Preset
Group...
Organize Preset
Group
NOTE
Closes this menu.
Opens the Duplicate Preset Group dialog box. Creates a copy of
the present preset group and saves it as the specified name.
Opens the Preset Group Import dialog box. Imports the
specified preset group.
Opens the Preset Group Export dialog box. Exports the present
preset group as the specified name.
Opens the Organize Preset Group dialog box used to organize
the preset group. See “Organize Preset Group” on page 1-56.
If the preset group contains a tracer test setup
The tracer test setup is converted to and recalled as a Multi Channel I/V Sweep test
setup.
In this conversion process, the VAR1 dual polarity sweep setup (Dual Polarity) is
ignored. The setup of the positive sweep from start to stop is converted, but the
setup of the negative sweep from -start to -stop is not converted.
NOTE
The conversion rule for the hold time settings
The VAR1 hold time setup (Hold Time) is converted and used, and the VAR2 hold
time setup (Hold Time) is ignored.
1- 48
Agilent EasyEXPERT User’s Guide Vol. 1, Edition 1
Main GUI
Quick Test
Preset Group
Selects the preset group to open.
Setup Name
Lists all test setups saved in the preset group.
To select the test setup for the quick test setup operation, click the line. For multiple
selection, use ctrl-click, shift-click, or Select All.
When you are doing the quick test setup, the softkeys are available to start the
associated test. The softkey label will show the Setup Name.
Quick Test List
The following buttons are available for the quick test setup operation.
Select All
Selects all test setup in the test setup list.
Execution on/off
The
button is effective for the selected test setup and is used
to enable/disable execution of the tests. Once the quick test is
started, only the tests marked with
will be executed in order
from top to bottom of the test setup list.
Data save on/off
The
button is effective for the selected test setup and is used
to enable/disable data save of the tests. The data save will be
performed only for the tests marked with .
Up
Moves the selected test setup upward
Down
Moves the selected test setup downward.
Recall
Recalls the selected test setup. The screen is changed to
Application Test or Classic Test.
Rename
You can change the name of the selected test setup.
Duplicate
Creates a copy of the selected test setup and places it at the
bottom of the test setup list.
Delete
You can delete the selected test setup.
Agilent EasyEXPERT User’s Guide Vol. 1, Edition 1
1- 49
Main GUI
Repeat Measurement Setup
Repeat Measurement Setup
This dialog box is opened by clicking the Repeat button, and is used to set the repeat
measurement condition. This dialog box supports the following action buttons.
Run
Starts measurement.
Abort
Aborts the measurement.
Cancel
Cancels performing the repeat measurement and closes this
dialog box.
The repeat measurement is performed as shown in Figure 1-3. The repeat
measurement operation is controlled by the value of Count and status. Where, Count
is the number displayed in the Count field of the main screen, and status must be a
parameter of the response created by Start Procedure and Iteration Procedure. For
the response, see Figure 1-4.
Figure 1-3
Repeat Measurement Execution Flow
Start
Count=0
Start Procedure
status= True ?
No
Count >= limit
Yes
Yes
No
Test Execution
Count=Count+1
Iteration Procedure
Abort
No
status= True ?
Yes
Final Procedure
If Abort is clicked
limit
status
Count is set to 0 when repeat measurement is started.
Repeat
Procedures
End
This area is used to specify the procedure to be called while the repeat measurement
is performed. The procedure must be the execution file (.exe file). If no procedure is
needed, empty the field. The Browse button opens a file browser.
1- 50
Agilent EasyEXPERT User’s Guide Vol. 1, Edition 1
Main GUI
Repeat Measurement Setup
Start Procedure
Specifies the procedure executed before starting measurement.
Iteration
Procedure
Specifies the procedure executed every single measurement.
Final Procedure
Specifies the procedure executed after the repeat measurement.
If the procedure requires arguments, enter the values to the Arguments field.
If the procedure specified by Start Procedure or Iteration Procedure creates the
response as shown in Figure 1-4, EasyEXPERT performs the operation following
the response. See Figure 1-3. The parameter status value must be the string True or
False, and the parameter device_id value should be any string. EasyEXPERT
ignores the response of the different format.
Automatically fill
in Device ID
This check box is available when the Procedure return condition box has been
checked, and is used to enable the device ID automatic input function. This function
enters the Device ID of the test record automatically. The value is given by
device_id which is a parameter of the response created by Start Procedure and
Iteration Procedure.
Repeat Stop
Condition
This area is used to set the repeat measurement stop condition. The following stop
conditions are available.
•
Counter Reaching to: limit
The repeat measurement will be stopped if Count limit. Reset counter before
repeating box must be checked to set Count=0 when the measurement is started.
•
Procedure return condition
The repeat measurement will be stopped if the response shows status = True.
Figure 1-4
Procedure Response Expected by EasyEXPERT
• Response (input to EasyEXPERT):
XML format data
<Response>
<Break>status</Break>
<Target>device_id</Target>
</Response>
status:
device_id:
• Example:
True (break) or False
Device ID
<Response>
<Break>False</Break>
<Target>waf1a:3 1</Target>
</Response>
Agilent EasyEXPERT User’s Guide Vol. 1, Edition 1
1- 51
Main GUI
Repeat Measurement Setup
Thermo-trigger
This area is used to set the thermo-trigger function using the N1265A ultra high
current expander/fixture.
Enable
Thermo-trigger
N1265A
Thermo-trigger
List...
Enables/disables the thermo-trigger function.
Opens the Thermo-trigger List dialog box used to set the
thermo-trigger function. See “Thermo-trigger List” on page
1-53.
If the thermo-trigger function is enabled, the repeat measurement execution flow is
changed as shown in Figure 1-5. The following steps are added.
1. After Count is judged, temperature (Temp) is measured.
2. If the measured temperature is in the range of the temperature condition (Center
and Radius), the action (Action) is executed after the delay time (Delay) elapsed.
Or else, the temperature measurement and this judgement are repeated.
Where, the terms in ( ) are the setup items on the Thermo-trigger List dialog box.
Figure 1-5
Repeat Measurement Execution Flow with Thermo-trigger Function
Start
No
Temp Condition= True?
Yes
status= True ?
Delay time
Action: NOP
TRIG
Test Execution
Count=0
Start Procedure
No
END
(Status=True)
Count >= limit
Yes
Yes
No
Count=Count+1
End
Iteration Procedure
No
status= True ?
Yes
Final Procedure
If Abort is clicked
End
1- 52
Agilent EasyEXPERT User’s Guide Vol. 1, Edition 1
Main GUI
Repeat Measurement Setup
Thermo-trigger List
This dialog box is opened by clicking the N1265A Thermo-trigger List button, and
is used to set the Thermo-trigger function which is defined by listing multiple sets of
the temperature condition and action executed when the condition is satisfied. A
setup in a row of the list is used for one loop sequence of the repeat measurement.
The top row is for the first sequence of the repeat measurement, the second row is
for the second sequence, and so on. If the repeat measurement is repeated over the
number of rows set in the list, the list is used from the top row again. This dialog box
can have a maximum of 1001 rows.
And also, in this dialog box, you can import any list from an external file and export
the list to an external file, in the CSV or XMLSS form.
Figure 1-6
Thermo-trigger List dialog box
N (index)
Select an entry that you wish to edit during the editing. During
the repeat measurement execution, this button indicates the
current-waiting entry.
Temp
Selects the temperature used in the condition from the
following alternatives:
T1: Temperature value measured by the thermometer channel 1.
T2: Temperature value measured by the thermometer channel 2.
T1-T2: Difference between T1 and T2.
Center
Specifies the center value of the temperature range in deg C.
Range: -50 to 300. Resolution: 0.5.
Agilent EasyEXPERT User’s Guide Vol. 1, Edition 1
1- 53
Main GUI
Repeat Measurement Setup
Radius
Specifies the radius value of the temperature range in deg C.
Range: 0.5 to 50. Resolution: 0.5.
Delay
Specifies the delay time from the temperature condition
satisfaction to starting of the action specified by the Action
field, in seconds. Range: 0 to 3600, Resolution: 1.
Action
Selects an action executed if the measured temperature is in the
specified range, from the following alternatives:
TRIG:
Does the single test execution after the
specified delay time, and then goes to the
next operation. This is useful to do the
single test execution in the specified
temperature range.
NOP:
No operation (single test execution is
skipped). Waits for the delay time, and goes
to the next operation. This is useful to wait
in the specified temperature range.
END:
Sets the status to True, and exits the repeat
measurement after the delay time. This is
useful to exit the repeat measurement in the
specified temperature range.
Add
Adds a new entry for the thermo-trigger condition and action
above the selected entry.
Delete
Deletes the selected entry.
Up/Down
Moves the selected entry upward or downward.
OK
Applies the setup changes and closes this dialog box.
Cancel
Cancels the setup changes and closes this dialog box.
Apply
Applies the setup changes.
1- 54
Agilent EasyEXPERT User’s Guide Vol. 1, Edition 1
Main GUI
Repeat Measurement Setup
Import...
Opens the Open File dialog box. Imports the specified file (.cvs
or .xml).
Export...
Opens the Save File dialog box. Specify the file format in this
dialog box.
CVS:
Exports the current settings as the specified name in the CSV
format that can be read by a spread sheet software. The data is
stored with the same order as the settings on the screen.
XML Style Sheet:
Exports the current settings as the specified name in the XML
spread sheet format that can be read by a spread sheet software.
The tags are as follows:
<Thermo-trigger List>
<Temp>A</Temp>
<Center>B</Center>
<Radius>C</Radius>
<Delay>D</Delay>
<Action>E</Action>
</Thermo-trigger List>
Where,
A: Temp field setting, T1, T2, or T1-T2, characters
B: Center field setting, numeric value
C: Radius field setting, numeric value
D: Delay field setting, numeric value
E: Action field setting, TRIG, NOP, or END, characters
Agilent EasyEXPERT User’s Guide Vol. 1, Edition 1
1- 55
Main GUI
Organize Preset Group
Organize Preset Group
This dialog box is opened by selecting the Organize Preset Group function of the
main screen, the Quick Test setup screen, or the Switching Matrix Operation Panel,
and is used to organize the preset group.
Preset Group List
Lists the preset group saved in the workspace. The following buttons are available.
Add
Opens the Add Preset Group dialog box. Creates a new preset
group and saves it as the specified name.
Rename
Opens the Rename Preset Group dialog box. You can change
the name of the selected preset group.
Duplicate
Opens the Duplicate Preset Group dialog box. Creates a copy of
the selected preset group and saves it as the specified name.
Delete
You can delete the selected preset group.
Import
Only for the quick test setup. Opens the Preset Group Import
dialog box. Imports the specified preset group.
Export
Only for the quick test setup. Opens the Preset Group Export
dialog box. Exports the selected preset group as the specified
name.
Copy
Sets the operation of the >> button and the << button. They work as Copy when this
box is checked, and as Move when this box is unchecked.
>>
Copies or moves the preset setup selected in the left Preset Group box to the right
Preset Group box.
<<
Copies or moves the preset setup selected in the right Preset Group box to the left
Preset Group box.
Close
Closes the Organize Preset Group dialog box.
1- 56
Agilent EasyEXPERT User’s Guide Vol. 1, Edition 1
Main GUI
Organize Preset Group
Preset Group
Lists the preset setup saved in the preset group. The following buttons are available.
Preset Group
Selects the preset group to open.
Setup Name
Lists all preset setup saved in the preset group.
Select All
Selects all preset setup.
Unselect All
Unselects all preset setup.
Rename
You can change the name of the selected preset setup.
Duplicate
Creates a copy of the selected preset setup and places it at the
bottom of the test setup list.
Delete
You can delete the selected preset setup.
Agilent EasyEXPERT User’s Guide Vol. 1, Edition 1
1- 57
Main GUI
Calibration
Calibration
The Calibration window is opened by clicking the Calibration button, and is used to
perform the self-calibration, SMU current offset cancel, CMU data correction, and
so on.
•
“Module Self Calibration”
•
“SMU Zero Cancel”
•
“CMU Calibration”
Module Self Calibration
The Module Self Calibration tab screen is used to perform the self-calibration of
modules. Check the left check box of Name to select the module for self-calibration.
Open the measurement terminals at the cable end before performing the
self-calibration.
Module Self
Calibration
Displays the following values.
Name
Name of module.
Full Range
Full range calibration On or Off. Only for SMU+ASU.
Status
Calibration status. Pass or fail.
Notes
Error information when calibration failed.
Select All
Selects all modules for calibration. This checks the check box for all modules.
Unselect All
Unselects all modules. This unchecks the check box for all modules.
Start Calibration
Starts calibration for the selected modules.
Abort
Aborts calibration.
Full Range
Calibration
Only for the B1500A. Check this box to enable the 1 pA range calibration of
SMU+ASU.
If you do not use the 1 pA range, uncheck this box. The B1500A does not perform
the 1 pA range offset data measurement and calibration.
1- 58
Agilent EasyEXPERT User’s Guide Vol. 1, Edition 1
Main GUI
Calibration
Enable Auto
Calibration
Enables or disables the auto-calibration capability. If this box has been checked
(function ON), and the B1500 automatically starts calibration for all modules every
30 minutes if the output switches of all modules are off for 30 minutes. If
auto-calibration is enabled, do not forget to open the measurement terminals or
disconnect the device under test from the terminals after measurement.
SMU Zero Cancel
The SMU Zero Cancel tab screen is used to perform the SMU path offset current
measurement, and set the offset cancel function. Check the left check box of Name
to select the effective module. Open the measurement terminals at the cable end
before performing the offset measurement. This function is available for the
following modules. See also “Current Offset Cancel” on page 4-43.
SMU Zero Cancel
•
SMU+ASU
•
HRSMU
•
MPSMU
•
HPSMU
•
HVSMU
Displays the following values.
Name
Name of module
Full Range
SMU+ASU full range measurement On or Off.
1nA
Offset current measurement data in the 1 nA range. Available
for SMU+ASU, HRSMU, MPSMU, HPSMU, and HVSMU.
100pA
Offset current measurement data in the 100 pA range. Available
for SMU+ASU and HRSMU.
10pA
Offset current measurement data in the 10 pA range. Available
for SMU+ASU and HRSMU.
1pA
Offset current measurement data in the 1 pA range. Available
for SMU+ASU only.
Full Range
Enables (On) or disables (Off) the 1 pA range of the selected SMU+ASU.
Integration Time
Sets the integration time for the offset current measurement of the selected SMU
path. 1 PLC (power line cycle) to 100 PLC, initial setting 16 PLC.
Agilent EasyEXPERT User’s Guide Vol. 1, Edition 1
1- 59
Main GUI
Calibration
Select All
Selects all modules. This checks the check box for all modules.
Unselect All
Unselects all modules. This unchecks the check box for all modules.
Measure...
Performs the SMU path offset current measurement for the effective modules.
CMU Calibration
The CMU calibration tab screen is used to perform the measurement data correction
of the multi frequency capacitance measurement unit (MFCMU). For the easy way,
perform the phase compensation and the open correction at least.
See also “Error Correction” on page 4-25.
NOTE
For a more accurate measurement, perform correction data measurement at the
measurement frequency before starting the capacitance measurement.
If the measurement frequency is not included in the list of default frequencies below,
click the Advanced Options... button and set the measurement frequency on the
Frequency area of the Advanced Options for CMU Calibration window.
Default frequencies:
1 k, 2 k, 5 k, 10 k, 20 k, 50 k, 100 k, 200 k, 500 k, 1 M, 1.2 M, 1.5 M, 2 M, 2.5 M,
2.7 M, 3 M, 3.2 M, 3.5 M, 3.7 M, 4 M, 4.2 M, 4.5 M, 5 MHz
Measure...
Opens a dialog box used to perform correction/compensation data measurement. To
perform the measurement, follow the dialog box.
The correction/compensation measurement data is saved and managed by the
workspace. And the last measured correction/compensation data will be loaded
when the workspace will be opened next time.
Advanced
Options...
Opens the “Advanced Options for CMU Calibration (page 1-62)” dialog box used to
set the frequencies for the correction data measurement and the reference values of
the working standard.
Phase
Compensation
This check box is effective after the phase compensation data is measured, and is
used to enable or disable the phase compensation. Uncheck this box to disable the
phase compensation.
To measure the compensation data, open the measurement terminals at the end of
the device side and click the Measure... button.
1- 60
Agilent EasyEXPERT User’s Guide Vol. 1, Edition 1
Main GUI
Calibration
If you extend the measurement cables to the device end by using the four terminal
pairs method, do not forget to connect following terminals together at the device
end.
Open Correction
•
the high potential (Hp) terminal and the high current (Hc) terminal
•
the low potential (Lp) terminal and the low current (Lc) terminal
This check box is effective after the open correction data is measured, and is used to
enable or disable the open correction. Uncheck this box to disable the correction.
To measure the correction data, connect the open standard that has the calibration
value or reference value, or open the measurement terminals at the end of the device
side. Then, click the Measure... button.
If you extend the measurement cables to the device end by using the four terminal
pairs method, do not forget to connect following terminals together at the device
end.
•
the high potential (Hp) terminal and the high current (Hc) terminal
•
the low potential (Lp) terminal and the low current (Lc) terminal
If the standard is used, click the Advanced Options... button and enter the reference
value to the OPEN Reference entry fields. If you do not use the standard, enter 0 to
the fields.
Short Correction
This check box is effective after the short correction data is measured, and is used to
enable or disable the short correction. Uncheck this box to disable the correction.
To measure the correction data, connect the short standard that has the calibration
value or reference value, or directly connect the measurement terminals at the end of
the device side. Then, click the Measure... button.
If the standard is used, click the Advanced Options... button and enter the reference
value to the SHORT Reference entry fields. If you do not use the standard, enter 0 to
the fields.
Load Correction
This check box is effective after the load correction data is measured, and is used to
enable or disable the load correction. Uncheck this box to disable the correction.
To measure the correction data, connect the load standard that has the calibration
value or reference value. Then, click the Measure... button.
Before performing the load correction data measurement, click the Advanced
Options... button and enter the reference value to the LOAD Reference entry fields.
Agilent EasyEXPERT User’s Guide Vol. 1, Edition 1
1- 61
Main GUI
Calibration
Advanced Options for CMU Calibration
This dialog box is opened by clicking the Advanced Options... button, and is used to
set the information required to measure the open/short/load correction data and the
phase compensation data. This dialog box provides the following action button.
Frequency
OK
Applies the setup changes and closes this dialog box.
Cancel
Cancel the setup changes and closes this dialog box.
You can select one of the following radio buttons to select the measurement
frequency setup mode.
•
Use factory specified frequencies (Default)
Usually, select this mode. 23 points are automatically set. They are 1 k, 2 k, 5 k,
10 k, 20 k, 50 k, 100 k, 200 k, 500 k, 1 M, 1.2 M, 1.5 M, 2 M, 2.5 M, 2.7 M, 3 M,
3.2 M, 3.5 M, 3.7 M, 4 M, 4.2 M, 4.5 M, and 5 MHz.
•
Specify list of calibration frequencies
Select this mode when you want to set the frequencies independently. The
frequency must be 1 kHz to 5 MHz. The number of frequencies must be 1 to
101.
Click Add to open a dialog box, and enter the value.
For the unnecessary value, select the value and click Delete.
•
Specify frequencies by range
Select this mode when you want to set the frequencies sequentially and
automatically.
Specify the start frequency, the stop frequency, the number of steps, and the
scale LINEAR/LOG. The start frequency must be less than the Stop value and at
least 1 kHz. The stop frequency must be more than the Start value and no more
than 5 MHz. The number of steps must be 2 to 1001.
NOTE
If the device measurement frequency is not equal to the correction data
measurement frequency, calculation will be performed automatically to get the
correction data for the device measurement frequency, and the calculated correction
data will be used for the data correction of the measurement data.
1- 62
Agilent EasyEXPERT User’s Guide Vol. 1, Edition 1
Main GUI
Calibration
Integration Time
Reference
Standard Values
This area defines the integration time used for measuring phase compensation data
or open/short/load correction data. The number of averaging samples
(Mode=AUTO) or the averaging time (Mode=PLC) is set.
Mode
A/D converter operation mode, AUTO or PLC
Factor
Factor for the initial value. See “Mode, Factor” on page 4-20.
The following entry fields are available to set the calibration values or the reference
values of the open/short/load standard. If you use the standard, enter the values to
the following entry fields.
•
OPEN Reference: Capacitance and Conductance
If you do not use the reference, enter 0 in the both fields.
•
SHORT Reference: Inductance and Resistance
If you do not use the reference, enter 0 in the both fields.
•
LOAD Reference: Inductance and Resistance
Agilent EasyEXPERT User’s Guide Vol. 1, Edition 1
1- 63
Main GUI
Configuration
Configuration
The Configuration window is opened by clicking the Configuration button, and is
used to display the system information and event log, as well as to perform
diagnosis and self-test.
•
“Main Frame”
•
“Modules”
•
“ASU”
•
“Switching Matrix”
•
“SMU/PG Selector”
•
“Module Selector”
•
“Dual HCSMU Combination”
•
“UHC Expander / Fixture”
•
“HVSMU Current Expander”
•
“UHV Expander”
•
“SMU Output Setting Limits”
•
“Event Log”
•
“Extended Configuration”
Main Frame
The Main Frame tab screen is used to display the system information and perform
diagnosis.
Model
Identification
Displays the instrument ID. B1500A or B1505A.
Line Frequency
Sets the power line frequency, 50 Hz or 60 Hz.
EasyEXPERT Rev. Displays the revision number of the EasyEXPERT.
Firmware Rev.
Displays the revision number of the B1500 firmware.
HOST ID
Displays the host id of the B1500 internal computer.
1- 64
Agilent EasyEXPERT User’s Guide Vol. 1, Edition 1
Main GUI
Configuration
Main Frame
Diagnosis
This area lists Item and Status.
Item
Name of diagnosis item. To select, check the left check box.
Status
Diagnosis status. Pass or fail.
Select All
Selects all items for diagnosis. This checks the box for all items.
Unselect All
Unselects all items. This unchecks the box for all items.
Start Diagnosis
Starts diagnosis for the selected items. To perform diagnosis, specify the items to
perform and click this button. A dialog box appears. Follow the dialog box to
perform the diagnosis. Some items need your judgement, pass or fail. Also you will
need to connect an adapter, press keys, check LEDs, and so on.
Modules
The Modules tab screen is used to perform self-test of modules.
Slot Configuration This area lists Slot, Module Type, Name, and Status.
Slot
Slot number where the module is installed. To select, check the
left check box.
Module Type
Module model number
Name
Module name. See Table 1-2.
Status
Self-test status, Passed, Failed, Recovered, or ---- (self-test
has not been performed)
SCUU
Specifies if the module is connected to the SCUU.
Notes
Error information when the module self-test failed.
Select All
Selects all modules for self-test. This checks the check box for all modules.
Unselect All
Unselects all modules. This unchecks the box for all modules.
Start Self Test
Starts self-test for the selected modules.
Recover Module
This button is for service use only. Makes the failed modules respond again. This
button does not solve the problem that causes the Failed status.
Abort
Aborts self-test.
Agilent EasyEXPERT User’s Guide Vol. 1, Edition 1
1- 65
Main GUI
Configuration
Status LED
Enables (ON) or disables (OFF) the status indicator (LED) of the ASU (Atto Sense
and Switch Unit), the SCUU (SMU CMU Unify Unit), and the module selector.
Table 1-2
Module Name
Module name
Measurement resource
GNDU+ADC
B1500 mainframe
SMU<N>:HP
HPSMU
SMU<N>:MP
MPSMU
SMU<N>:HR
HRSMU
SMU<N>:HR/AS
SMU+ASU
SMU<N>:HC
HCSMU
SMU<N>:DHC
Dual HCSMU
SMU<N>:MC
MCSMU
SMU<N>:HV
HVSMU
SMU<N>:UHC500
UHCU (standard)
SMU<N>:UHC1500
UHCU (with the option N1265A-015)
SMU<N>:HVMC
HVMCU
SMU<N>:UHV
UHVU
Where, <N> is a channel number.
ASU
Only for the B1500A. The ASU tab screen is available if the B1500A installs the
SMU calibrated with the ASU (Atto Sense/Switch Unit) regardless of the ASU
connection status, and shows the ASU information.
Slot
Slot number
Module Type
Type of module
Name
Name of module
1- 66
Agilent EasyEXPERT User’s Guide Vol. 1, Edition 1
Main GUI
Configuration
ASU Serial
Number
Serial number of the usable ASU. This cell shows the serial number even if the ASU
is disconnected.
If an incorrect ASU is connected to the SMU, this cell displays an error message
instead of the serial number. Error message is also displayed if an ASU is connected
to the SMU which is not available for using ASU.
ASU I/O Path
ASU switching operation, SMU or AUX
Value
Input-to-output connection and description
SMU
ASU always makes the path from the ASU Force input to the ASU
output.
AUX
ASU performs automatic switching in every test. The ASU normally
makes the path from the AUX In input to the ASU output and makes the
path from the SMU input to the ASU output for the test using the SMU.
Switching Matrix
Not available for the B1505A. The Switching Matrix tab screen is used to confirm
the GPIB connection with Agilent B2200A/B2201A/E5250A switching matrix, and
defines the connections between the measurement modules and the switching matrix
input ports.
Switching Matrix
Type
Displays the type of the switching matrix. One of the following.
•
B2200A Femto Leakage Switch Mainframe
•
B2201A 14ch Low Leakage Switch Mainframe
•
E5250A Low Leakage Switch Mainframe
•
No Switching Matrix (if switching matrix is not connected)
GPIB Address
Specifies the GPIB address of the switching matrix. 1 to 30.
Poll
Confirms if the switching matrix with the specified GPIB Address is connected to
the B1500A.
Start Self Test
This button starts the selftest of the switching matrix.
SWM IN
SWM INn means the switching matrix input port n. where, n is an integer 1 to 10 for
the E5250A or an integer 1 to 14 for the B2200A/B2201A.
Agilent EasyEXPERT User’s Guide Vol. 1, Edition 1
1- 67
Main GUI
Configuration
Enter the label used to specify the input port to the right entry field. The port name
and the connected module name can be the label. Or select one from the pull-down
menu. There must be no colon (:) in the label.
If the Kelvin check box is checked, the coupled even number port is grayed out.
If the CMU check box is checked, the SWM IN10 for the E5250A or the SWM
IN14 for the B2200A/B2201A is grayed out.
Kelvin
Check this box if this port is used for the Kelvin connection. Connect the switching
matrix inputs to the SMU as follows.
•
for the E5250A (m: integer 1 to 3)
SMU INPUT 2m-1 to the SMU Force terminal
SMU INPUT 2m to the SMU Sense terminal
•
for B2200A/B2201A (m: integer 1 to 6)
Input 2m-1 to the SMU Force terminal
Input 2m to the SMU Sense terminal
CMU
Check this check box if this port is connected to the CMU. Connect the switching
matrix inputs to the CMU as follows.
•
for the E5250A
AUX INPUT CV1 to the CMU Hpot/Hcur terminals
AUX INPUT CV2 to the CMU Lpot/Lcur terminals
•
for B2200A/B2201A
Input 13 to the CMU Hpot/Hcur terminals
Input 14 to the CMU Lpot/Lcur terminals
To obtain accurate capacitance measurement result, perform capacitance
compensation. See Agilent B1500A User’s Guide for the capacitance compensation
when the switching matrix is used.
Also see “Extended Configuration” on page 1-79.
Extended
Configuration
This button opens the “Extended Configuration” on page 1-79 dialog box.
1- 68
Agilent EasyEXPERT User’s Guide Vol. 1, Edition 1
Main GUI
Configuration
SMU/PG Selector
Not available for the B1505A. The SMU/PG Selector tab screen is used to specify
the input connection and the channel connection status of the Agilent 16440A
SMU/PGU selector (B1500A-A04). The selector can be controlled by the B1500A
via the Digital I/O connector and the Agilent 16445A selector adapter.
Two selectors can be used. The first selector must be connected to the Digital I/O
connector via the 16445A. And if the second selector is used, it must be connected
to the first selector’s Control Output connector. See “SMU/PG Selector” on page
4-49.
Enable SMU/PG
Selector
To use the selector, connect the selector to the B1500A, and check this check box.
Selector CH1/CH2
CH1 and CH2 indicates the channels 1 and 2 of the first selector respectively.
Selector CH3/CH4
CH3 and CH4 indicates the channels 1 and 2 of the second selector respectively.
SMU Assignment
Specifies the SMU connected to the SMU input of the selector channel CH1, CH2,
CH3, or CH4.
Input/Output Path
Switching operation of the selector channel CH1, CH2, CH3, or CH4
Value
Always SMU
Normally PGU
(AUX)
Input-to-output connection and description
Selector always makes the path from Input SMU to Output.
Selector performs automatic switching in every test. The
selector normally makes the path from Input PGU to Output
and makes the path from Input SMU to Output only for the test
which uses the SMU connected to the Input SMU port.
The CH1 and CH3 also provides the PGU Open status which is set by using the
Advanced window of the Measurement Setup.
Module Selector
Only for the B1505A. This tab screen is used to specify the input connection and the
default input-to-output path of the module selector. The selector can be controlled
by the B1505A via the Digital I/O connector.
Agilent EasyEXPERT User’s Guide Vol. 1, Edition 1
1- 69
Main GUI
Configuration
Enable Module
Selector
This check box is used to enable/disable the module selector. If this box is checked,
the module selector can be used.
Input
Specifies the modules connected to the module selector’s HVSMU, HCSMU, and
HPSMU input ports respectively. For the port which no module is connected, blank
the entry field.
Enable Series Resistor (100 kohm) for HVSMU
This check box is used to connect/disconnect the built-in series resistor (100 k) on
the HVSMU connection path. If this box is checked, the series resistor is connected.
Output
Specifies the module selector connection status in the normal state. The module
selector makes the path to the output port from the input port specified by the
Default field.
When a measurement is performed, the module selector performs automatic
switching in every test. The selector makes the path to the output port from the
module used for the test. The connection status is indicated by the Status indicator
mounted on the module selector. See Table 1-3 on page 1-71.
Status
Shows one of the following status.
Not Detected
Module selector has not been detected yet.
Communication Established
Normal status. Module selector can be used.
Communication Lost
Once the module selector was detected. However
the communication has been broken now.
Auto Detection
This check box is used to enable/disable the module selector automatic detection. If
this box is checked, the automatic detection of the module selector is performed
when EasyEXPERT is launched.
Diagnosis
The Start Diagnosis button is used to start the module selector diagnosis. And the
Status shows the diagnosis result.
Apply
This button applies the setting.
1- 70
Agilent EasyEXPERT User’s Guide Vol. 1, Edition 1
Main GUI
Configuration
Table 1-3
Module Selector Status Indicator and Input-to-Output Connection Path
Module used for
the test
Status
indicator
HPSMU or
MPSMU
Input-to-output connectiona of output terminals
High Sense
High Force
HPSMU
HP/MPSMU
Sense
HP/MPSMU
Force
HCSMU or
DHCSMU
HCSMU
HCSMU
High Sense
HCSMU
High Force
HVSMU
HVSMU
HVSMU and built-in
series resistor
b
HVSMU Force
HVSMU Force
+ series resistor
Open
Open
Open
Low Sense
Low Force
HCSMU
Low Sense
+
GNDU Force
+
GNDU Sense
HCSMU
Low Force
Open
a. In the normal state, the module selector makes the path to the output port from the input port
specified by the Default field. When a measurement is performed, the module selector performs
automatic switching in every test. The selector makes the path to the output port from the module used for the test.
b. This condition is when all Input fields HVSMU, HCSMU, and HPSMU are blank.
CAUTION
If dual HCSMU (DHCSMU) is used with the module selector, the maximum current
must be ± 30 A to prevent the module selector from performance degradation and
failure.
Dual HCSMU Combination
Only for the B1505A installed with two HCSMU modules. This screen is used to set
the dual HCSMU operation.
Enable
This check box is used to enable/disable the dual HCSMU operation. If this box is
checked, the dual HCSMU operation is enabled and two HCSMU modules can be a
SMU which supports ± 40 A (pulse), ± 2 A (DC).
Master HCSMU
Specifies the HCSMU module used as the master channel of the dual HCSMU
operation. The module must be connected to the Master port of the 16493S-020/021
dual HCSMU adapter.
Agilent EasyEXPERT User’s Guide Vol. 1, Edition 1
1- 71
Main GUI
Configuration
Slave HCSMU
Specifies the HCSMU module used as the slave channel of the dual HCSMU
operation. The module must be connected to the Slave port of the 16493S-020/021
dual HCSMU adapter.
Apply
This button applies the dual HCSMU operating condition. To apply the setup
changes successfully, the B1505A must be in the idle state and the Standby output
must be OFF.
UHC Expander / Fixture
Only for the B1505A. This tab screen is used to set the N1265A ultra high current
expander/fixture. The N1265A can be controlled by the B1505A via the Digital I/O
connector.
Enable Ultra High
Current Unit
This check box is used to enable/disable the ultra high current unit (UHCU). If this
box is checked, UHCU can be used.
Control
Specifies the modules used for controlling the UHCU. For the port which no module
is connected, blank the entry field.
Voltage Control
SMU
Current Control
SMU
Self Test
Specifies the module (MCSMU or HCSMU) connected to the V
Control port of the N1265A. The SMU channel set to this field
is assigned to the UHCU and is used to indicate the UHCU.
Specifies the module (MCSMU or HCSMU) connected to the I
Control port of the N1265A.
Effective only when the Enable Ultra High Current Unit check box is checked.
The Start button starts the self-test for the N1265A. Measurement terminals must be
opened during the self-test. The Status shows the execution result.
Self Calibration
Effective only when the Enable Ultra High Current Unit check box is checked.
The Start button starts the self-calibration for the N1265A. Measurement terminals
must be opened during the self-test. The Status shows the execution result.
Enable Selector
This check box is used to enable/disable the selector of the N1265A. If this box is
checked, the selector can be used.
Input
UHCU
1- 72
Displays the SMU channel assigned to the UHCU.
Agilent EasyEXPERT User’s Guide Vol. 1, Edition 1
Main GUI
Configuration
HVSMU
Specifies the HVSMU connected to the HVSMU port of the
N1265A directly or via the N1266A current expander.
SMU
Specifies the module (MPSMU or HPSMU) connected to the
SMU port of the N1265A.
For the port which no module is connected, blank the entry field.
Output
Enable Series Resistor (100 kohm) for HVSMU
This check box is used to connect/disconnect the built-in series resistor (100 k) on
the HVSMU direct path. If this box is checked, the series resistor is connected.
Default
Specifies the selector input-to-output connection status (UHCU,
HVSMU, SMU, GNDU, or blank) in the normal state. The
selector makes the path to the output port from the input port
specified by the Default field. If this field is blank, the output
port is open.
When a measurement is performed, the selector performs
automatic switching in every test. The selector makes the path
to the output port from the measurement resource used for the
test. The connection status is indicated by the Status indicator
mounted on the N1265A. See Table 1-4.
Enable Gate
Control
This check box is used to enable/disable the Gate path of the N1265A. If this box is
checked, the Gate path can be used.
Gate Control
SMU
Specifies the module (MCSMU or HCSMU) connected to the
Gate port of the N1265A. For the port which no module is
connected, blank the entry field. Built-in series resistor can be
connected to the Gate path. To connect the series resistor, set
the Resistor field.
Resistor
Specifies the resistance of the built-in series resistors for the
Gate path. If the series resistor is not used, select 0 ohm.
Agilent EasyEXPERT User’s Guide Vol. 1, Edition 1
1- 73
Main GUI
Configuration
Table 1-4
N1265A Status Indicator and Selector Connection Path
Selector Output terminalsa
Status
indicator
Low Sense
Low Force
High Sense
High Force
Open
Open
Open
Open
GNDU Sense
GNDU Force
Open
Open
SMU
GNDU Sense
GNDU Force
SMU Sense
SMU Force
UHC
UHCU Low Sense
UHCU Low Force
UHCU High Sense
UHCU High Force
GNDU Sense
GNDU Force
HVSMU Force
Open
GNDU Sense
GNDU Force
HVSMU Force
+ Series resistor
Open
(off)
HVSMU
a. In the normal state, the selector makes the path to the output port from the input port specified
by the Default field. When a measurement is performed, the selector performs automatic switching in every test. The selector makes the path to the output port from the measurement resource
used for the test.
Thermometer
Channel 1
Enables/disables the thermometer channel 1.
Channel 2
Enables/disables the thermometer channel 2.
Interval
Specifies the interval of the temperature measurement. During
executing any classic test, the temperature is not measured
regardless of this setting.
Format
Specifies the record format of the temperature data. The data is
recorded by adding to the end of the Device ID string. Variables
{0} for the channel 1 temperature, {1} for the channel 2
temperature, and {2} for the difference between {0} and {1}
are available for setting the format.
Initial setting: T1={0}, T2={1}, T1-T2={2} deg C
You can use the measurement temperature values as the repeat measurement
condition. See “Repeat Measurement Setup” on page 1-50.
Auto Detection
This check box is used to enable/disable the automatic detection of the N1265A. If
this box is checked, the automatic detection is performed when EasyEXPERT is
launched.
1- 74
Agilent EasyEXPERT User’s Guide Vol. 1, Edition 1
Main GUI
Configuration
Status
Diagnosis
Shows one of the following status.
Not Detected
N1265A has not been detected yet.
Communication Established
Normal status. N1265A can be used.
Communication Lost
Once the N1265A was detected. However the
communication has been broken now.
Effective when the Enable Ultra High Current Unit check box, the Enable Selector
check box, or/and the Enable Gate Control check box is checked.
The Start button starts the diagnosis for the N1265A. Dialog box will be opened to
navigate you the cable connection during the diagnosis. The Status shows the
execution result.
Apply button
This button applies the setting.
NOTE
Before starting diagnosis
If the N1266A expander is connected between the HVSMU and the N1265A,
disconnect the N1266A. And connect the cable from the HVSMU Force terminal to
the N1265A Selector Input HVSMU terminal.
HVSMU Current Expander
Only for the B1505A. This tab screen is used to set the N1266A HVSMU current
expander. The N1266A can be controlled by the B1505A via the Digital I/O
connector.
Enable High
Voltage Medium
Current Unit
This check box is used to enable/disable the high voltage medium current unit
(HVMCU). If this box is checked, HVMCU can be used.
Input/Control
Specifies the HVSMU and the modules used for controlling the HVMCU. For the
port which no module is connected, blank the entry field.
HVSMU
Voltage Control
SMU
Specifies the HVSMU connected to the HVSMU input port of
the N1266A.
Specifies the module (MCSMU or HCSMU) connected to the V
Control port of the N1266A. The SMU channel set to this field
is assigned to the HVMCU and is used to indicate the HVMCU.
Agilent EasyEXPERT User’s Guide Vol. 1, Edition 1
1- 75
Main GUI
Configuration
Current Control
SMU
Self Test
Specifies the module (MCSMU or HCSMU) connected to the I
Control port of the N1266A.
Effective only when the Enable High Voltage Medium Current Unit check box is
checked.
The Start button starts the self-test for the N1266A. Measurement terminals must be
opened during the self-test. The Status shows the execution result.
Output
Enable Series Resistor (100 kohm) for HVSMU
This check box is used to connect/disconnect the built-in series resistor (100 k) on
the HVSMU direct path. If this box is checked, the series resistor is connected.
Default
Specifies the input-to-output connection status (HVSMU,
HVMCU, or blank) in the normal state. The N1266A makes the
path to the output port from the input port specified by the
Default field. If this field is a blank, the High output port is
open.
When a measurement is performed, the N1266A performs
automatic switching in every test. The N1266A makes the path
to the output port from the measurement resource used for the
test.
The connection status is indicated by the Status indicator
mounted on the N1266A. See Table 1-5.
Auto Detection
This check box is used to enable/disable the N1266A automatic detection. If this
box is checked, the automatic detection is performed when EasyEXPERT is
launched.
Status
Shows one of the following status.
Apply button
Not Detected
N1266A has not been detected yet.
Communication Established
Normal status. N1266A can be used.
Communication Lost
Once the N1266A was detected. However the
communication has been broken now.
This button applies the setting.
1- 76
Agilent EasyEXPERT User’s Guide Vol. 1, Edition 1
Main GUI
Configuration
Table 1-5
N1266A Status Indicator and Input-to-Output Connection Path
Input-to-output connectiona of output terminals
Status indicator
(off)
Low
High
GNDU Force and Sense
Open
HVMCU
HVMCU High
HVSMU
HVSMU Force
HVSMU Force + Series resistor
a. In the normal state, the N1266A makes the path to the output port from
the input port specified by the Default field. When a measurement is
performed, the N1266A performs automatic switching in every test. The
N1266A makes the path to the output port from the measurement
resource used for the test.
UHV Expander
Only for the B1505A. This tab screen is used to set the N1268A ultra high voltage
expander. The N1268A can be controlled by the B1505A via the Digital I/O
connector.
Enable Ultra High
Voltage Unit
This check box is used to enable/disable the ultra high voltage unit (UHVU). If this
box is checked, UHVU can be used.
Control
Specifies the modules used for controlling the UHVU. For the port which no module
is connected, blank the entry field.
Voltage Control
SMU
Current Control
SMU
Auto Detection
Specifies the module (MCSMU or HCSMU) connected to the V
Control port of the N1268A. The SMU channel set to this field
is assigned to the UHVU and is used to indicate the UHVU.
Specifies the module (MCSMU) connected to the I Control port
of the N1268A.
This check box is used to enable/disable the N1268A automatic detection. If this
box is checked, the automatic detection is performed when EasyEXPERT is
launched.
Agilent EasyEXPERT User’s Guide Vol. 1, Edition 1
1- 77
Main GUI
Configuration
Status
Diagnosis
Shows one of the following status.
Not Detected
N1268A has not been detected yet.
Communication Established
Normal status. N1268A can be used.
Communication Lost
Once the N1268A was detected. However the
communication has been broken now.
Effective when the Enable Ultra High Voltage Unit check box is checked.
The Start button starts the diagnosis for the N1268A. Dialog box will be opened to
navigate you the cable connection during the diagnosis. The Status shows the
execution result.
Apply button
This button applies the setting.
SMU Output Setting Limits
Only for the B1505A. This screen is used to set the upper limit of the SMU output
value and compliance value.
Voltage Setting
Limit
Sets the upper limit of the voltage output value and compliance value.
Effective value: 200 V to 10 kV, in 100 V step.
Current Setting
Limit
Sets the upper limit of the current output value and compliance value.
Effective value: 1 A to 1500 A, in 1 A step.
Apply
This button applies the setting.
Event Log
The event log tab screen displays the event log.
Date/Time
Displays date and time of the event.
Message
Event message
ID
Process ID of the event
Process
Process name
User
User name. Windows login name.
1- 78
Agilent EasyEXPERT User’s Guide Vol. 1, Edition 1
Main GUI
Configuration
Host
Host name of the B1500
Refresh
Refreshes the event log.
Extended Configuration
Not available for the B1505A. This dialog box opens by clicking the Extended
Configuration button in the Configuration window’s Switching Matrix screen and
closes by clicking the Close button.
Save as Hardware
Profile
Switching matrix hardware configuration can be saved as the hardware profile.
Save
Saves the present hardware profile.
The hardware profile can be made for each workspace individually.
CMU
Compensation
Selects the compensation mode of the capacitance measurement using the switching
matrix. Click one of the radio buttons, No Compensation, Select, and User
Compensation Data File. See Agilent B1500A User’s Guide for the capacitance
compensation when the switching matrix is used.
•
No Compensation
Select this radio button if you do not need the capacitance compensation. The
raw data without compensation is displayed and saved.
•
B2200A/B2201A (standard)
The following setup is available for the B2200A/B2201A hardware profile.
•
Select
Select this radio button to perform the capacitance compensation for the path
from the B2200A/B2201A input ports to Agilent 16495F/G connector plate
or Agilent B2220A probe card interface. The data after compensation is
displayed and saved.
DUT I/F
Specifies the model number of the path you use. The
selections are the 16495F/G and B2220A.
Cable
Specifies the model number of the cable from the
B2200A/ B2201A output to the DUT I/F. The selections
are the 16494A/B/C-001 (1.5 m) / 002 (3 m) / 005 (4 m).
This mode cannot perform the capacitance compensation for the cables to
positioner/manipulator or the probe card.
•
User Compensation Data File
Agilent EasyEXPERT User’s Guide Vol. 1, Edition 1
1- 79
Main GUI
Configuration
Select this radio button and specify the compensation data file to perform the
capacitance compensation for the path from the B2200A/B2201A input
ports to the end of positioner/manipulator/probe card. See Agilent B1500A
User’s Guide for creating the compensation data file. The data after
compensation is displayed and saved.
•
E5250A (option)
The following setup is available for the E5250A hardware profile.
•
User Compensation Data File
Select this radio button and specify the compensation data file to perform the
capacitance compensation for the path from the E5250A input ports to the
end of positioner/manipulator/probe card. See Agilent B1500A User’s Guide
for creating the compensation data file. The data after compensation is
displayed and saved.
1- 80
Clear
Clears the User Compensation Data File field.
Triaxial Cable
Enter the length of the 16494A triaxial cable
connected between the E5250A outputs to the
connector plate.
User Triaxial Cable
Enter the length of the triaxial cable between
the connector plate and the DUT. Enter 0 if
the triaxial cable is not used.
User Coaxial Cable
Enter the length of the coaxial cable between
the connector plate and the DUT. Enter 0 if
the coaxial cable is not used.
Agilent EasyEXPERT User’s Guide Vol. 1, Edition 1
Main GUI
Switching Matrix Operation Panel
Switching Matrix Operation Panel
Not available for the B1505A. The Switching Matrix Operation Panel is opened by
clicking the Switching Matrix button, and is used to create the switch setup for
Agilent B2200A/B2201A/E5250A switching matrix, send the setup to the switching
matrix, and so on. The switch setup can be saved to the switch setup preset group.
This group is different from the preset group for test setups.
Switch Setup
This area is used to create the switching matrix switch setup. You can create the
setup by clicking the Input-Output cross point. The switch setup can be sent to the
switching matrix by clicking the Apply Switch Setup button.
Color of cross point
Switch setup
green
close
gray
open
Setup Name
Name of switch setup
Clear All
Sets all cross point open.
Input
Shows the switching matrix input port and the measurement
resource connected to it. This information is set in the
“Configuration”.
Label
Shows the label set to the measurement resource. The label is
set in the application test definition or the classic test setup.
ALL
Checking this box sets all of this line to close.
Unchecking this box sets all of this line to open.
This box is gray and have a check when a cross point in this line
is set to close.
Output
Output channels 1 to 12, 24, 36, or 48. Available numbers
depend on the number of the matrix cards installed in the
switching matrix. The field below the channel number is used to
enter the label for the output channel.
Export to Current This button converts the switch setup to the switching matrix setup data format of
My Favorite Group the classic test, and saves it to the present My Favorite Setup group.
Agilent EasyEXPERT User’s Guide Vol. 1, Edition 1
1- 81
Main GUI
Switching Matrix Operation Panel
Apply Switch
Setup
This button sends the switch setup to the switching matrix.
Read Switch Setup This button reads the switch setup from the switching matrix.
Open All
This button opens all relays on the switching matrix.
Preset List
The switch setups you create MUST be saved to the preset group to reuse them.
Click the Preset List button to display the menu that provides the following
functions. Select the preset group by using the field below the button. The switch
setups can be recalled by using the area below the field.
Cancel
Closes the menu.
Preset Group
Provides the following three functions.
Add New Preset Group
Opens the Add Preset Group dialog box. Creates a new
preset group and saves it as the specified name.
Rename This Preset
Group
Duplicate This Preset
Group
Opens the Rename Preset Group dialog box. You can
change the name of the selected preset group.
Opens the Duplicate Preset Group dialog box. Creates
a copy of the present preset group and saves it as the
specified name.
Delete This Preset Group You can delete the selected preset group.
Organize Preset Group... Opens the Organize Preset Group dialog box used to
organize the preset group. See “Organize Preset
Group” on page 1-56.
Rename
You can change the name of the selected switch setup.
Duplicate
Creates a copy of the selected switch setup.
Delete
Deletes the selected switch setup.
Delete All
Deletes all switch setups in the present preset group.
Save
The button saves the present switch setup into the present preset group as a new
setup of the group.
Recall
The button recalls the selected switch setup. This means opening and displaying the
definition of the selected switch setup.
1- 82
Agilent EasyEXPERT User’s Guide Vol. 1, Edition 1
Main GUI
Standby Channel Definition
Standby Channel Definition
The Standby Channel Definition window is opened by clicking the Standby button,
and is used to define the standby channels and set the standby mode. See “Standby
Function” on page 4-38.
The standby channel is the channel for maintaining specified output when the
standby mode is ON and in the non-measurement state. The standby channels will
be in the standby state, while the other channels will be in the idle state which is 0 V
output and 100 A compliance. When the standby mode is OFF and in the
non-measurement state, all channels will be in the idle state.
Standby Channel
Control
This area provides the following button.
Standby Channel
Definition
This area defines the standby channels. The standby channels will start to output in
order, from the top to bottom, as listed in this area. The order of bias stop is bottom
to top.
Standby ON/OFF
Standby
Sets the standby mode ON or OFF.
Check the check box to specify the standby channel.
The radio button is used to select the channel setup available for
the Up/Down button.
Unit
SMU or UHVU used for the standby output. To specify the
measurement resource connected to the selector (N1258A,
N1259A-300, N1265A) or N1266A expander, the channel must
be set to the Default output in the Configuration window.
Standby channel cannot be set for the SMU connected to the
ASU which makes the path to the AUX port.
Mode
Output mode, V (voltage) or I (current)
Source
Standby channel output value, in V or A
Compliance
Compliance value, in A or V. Enter the current limit value for
the voltage source, or the voltage limit value for the current
source.
Up
Moves the selected channel setup upward. To select a channel
setup, use the radio button on the left.
Down
Moves the selected channel setup downward.
Agilent EasyEXPERT User’s Guide Vol. 1, Edition 1
1- 83
Main GUI
Data Display
Data Display
The Data Display window is opened by clicking the Data Display button, and is
used to display measurement data and analyze the data.
•
“Data Display GUI”
•
“Display Setup”
•
“Graph Properties”
•
“List Display Properties”
•
“Tool Bar”
•
“Setup Summary”
•
“Data Status”
•
“Miscellaneous Operations”
1- 84
Agilent EasyEXPERT User’s Guide Vol. 1, Edition 1
Main GUI
Data Display
NOTE
About Display Mode
The Data Display window provides two display mode Overwrite and Append.
In Overwrite mode, the “Display Data (page 1-17)” function opens a new Data
Display window and displays data.
In Append mode, the “Display Data (page 1-17)” function creates a new display
layer on the present Data Display window and displays data.
NOTE
Updating Data Calculation
When the classic test result is displayed, you can update the calculation results of the
user function, analysis function, and auto analysis function. So use the Apply
button. See “Function Setup (page 2-42)”.
NOTE
Append Measurement
After the Append measurement, you will see tabs between the tool bar and the graph
plot area. The tabs are used to select the display layer for data display and analysis
operation. The Data Display window can have maximum 10 display layers.
NOTE
Multi Display Function
In the Multi Display OFF status, the test result data will be always displayed on the
singular Data Display window even if the test setup is changed.
In the Multi Display ON status, the test result data of the same test setup name will
be displayed on the exclusive Data Display window and the test result data of the
different test setup name will be displayed on the new Data Display window.
NOTE
The settings on the Display Setup are applied to the X-Y Graph on the Data Display
window. The X-Y Graph can handle one X data on the X axis and up to eight Y data
on the Y axis.
Define the X axis carefully when plotting Multi Channel I/V Sweep measurement
results that may contain data measured by multiple VAR1 channels, as the result
may contain multiple X data that can be selected for the X axis.
The Display Setup must be set properly to match the X axis data and the X data of
the plot to be displayed.
Agilent EasyEXPERT User’s Guide Vol. 1, Edition 1
1- 85
Main GUI
Data Display
Data Display GUI
Setup Name
This field just displays the name of the test setup used to get this test record.
X-Y Graph Plot
This area displays the measurement result graph, traces, marker, cursor, and lines.
The Properties button opens “Graph Properties (page 1-96)”.
Parameters
This area lists the user-defined output parameters if the output parameters are set.
List Display
This area displays the measurement result data list. The Properties button opens
“List Display Properties (page 1-97)”.
pin
The Data Display window can keep up to 10 display layers. And the earliest layer
over 10 will be automatically deleted. This button is available when the window
keeps at least two layers. If this button shows the standing pin, the layer will be kept.
If this button shows the laid pin, the layer can be deleted.
Double clicking the tab gives the same result as this button.
X
This button closes the selected display layer.
File menu
Provides the following functions.
Switch to Append Mode /
Switch to Overwrite Mode
Used to switch the display mode.
Update Test Result
Stores the information of the scale and the analysis
tools.
Delete Test Result
Deletes the present display data or the selected
display layer.
Close This Display
Closes the selected display layer.
Close All Displays
Closes all display layers.
Save Image As...
Opens the Save Image As... dialog box used to
specify the file name of the graph image to save.
See Figure 1-7. Available data formats are the
BMP, EMF, GIF, and PNG.
Page Setup...
Opens the Page Setup dialog box used to set the
print page.
1- 86
Agilent EasyEXPERT User’s Guide Vol. 1, Edition 1
Main GUI
Data Display
Print Preview
Figure 1-7
Opens the Print Preview dialog box used to specify
Print Range/Data to print/Scaling of the graph
image to display. Clicking the Preview button
opens the Print preview window. See Figure 1-8.
•
Print Range sets Whole Data Display window
or Graph Only.
•
Data to print sets Current Data Display window
only or All Data Display windows now opened.
•
Scaling sets Adjust To the specified percent of
the normal size or Fit To Page (automatic
adjustment).
Print...
Opens the Print dialog box used to specify Print
Range/Data to print/Scaling (see Print Preview) of
the graph image to print. See Figure 1-7. Clicking
the Next button opens another Print dialog box used
to select the printer, print range, and number of
copies, and start print.
Close
Closes the Data Display window.
Save Image As... and Print...
EPSHPIJLIRUSQJIRUPDW
Agilent EasyEXPERT User’s Guide Vol. 1, Edition 1
1- 87
Main GUI
Data Display
Figure 1-8
Print Preview Example
Edit menu
Provides the following functions.
Copy
When the X-Y Graph Plot area is active, this
function copies the graph image as BMP and EMF
into the clipboard.
When the line cursor in the List Display area is
active, this function copies the data list as CSV.
When the Parameters area is active, this function
copies the parameter data as CSV.
Copy Graph
Copies the graph image as BMP and EMF into the
clipboard.
Copy List
Copies the list data as CSV.
Copy Parameters
Copies the parameter data as CSV.
Graph Properties...
Opens “Graph Properties (page 1-96)”.
List Display Properties...
Opens “List Display Properties (page 1-97)”.
1- 88
Agilent EasyEXPERT User’s Guide Vol. 1, Edition 1
Main GUI
Data Display
Figure 1-9 shows the graph copy and paste example. Click the X-Y Graph Plot area
on the Data Display window, select Edit > Copy menu, and paste it to WordPad. You
will see the result as shown in this example.
Figure 1-9
Graph Copy and Paste
&RS\WR&OLSERDUG
3DVWHWR:RUG3DG
Figure 1-10 shows the list copy and paste example. Click a line of the List Display
area on the Data Display window, select Edit > Copy menu, and paste it to Notepad.
You will see the result as shown in this example. The data in Notepad is a CSV data
(separated by a comma). Save it as a text file and open it by using a spreadsheet
software. Each data (comma separated value) will be entered to a separate cell.
Figure 1-10
List Copy and Paste
3DVWHWR1RWHSDG
&RS\WR&OLSERDUG
Agilent EasyEXPERT User’s Guide Vol. 1, Edition 1
1- 89
Main GUI
Data Display
View menu
Provides the following functions.
X-Y Graph
Displays or hides the X-Y Graph Plot area.
List Displays
Displays or hides the List Display area.
Parameters
Displays or hides the Parameters area.
Graph Legend ON/OFF
Displays or hides the graph legend below the plot
area.
Line Information ON/OFF
Displays or hides the line information (X-intercept,
Y-intercept, gradient) in the plot area.
Open Preview Window
Opens “Preview (page 1-108)” and “Preview
Settings (page 1-110)”.
Auto Scale
Changes graph scale to fit the trace in the graph
automatically.
Run Time Auto Scale
Enables or disables the run time auto scaling. This
function is set to independently for the X and Y
axes.
If this function is enabled, the graph scale will be
changed automatically to fit the trace in the graph
during the measurement.
Zoom In
Zooms the data graph in the cursor. If the cursor is
not displayed, zooms the data graph in the last
cursor position or the graph center. This enlarges
the trace in the graph.
Zoom Out
Zooms the data graph out the cursor. If the cursor is
not displayed, zooms the data graph out the last
cursor position or the graph center. This reduces the
trace in the graph.
Cancel Scaling
Returns to the initial graph scale. This Display
works only for the selected layer. All Displays
works for the all display layers.
Choose Active Y Axis
Selects the Y-axis that is effective for the marker
control and the auto scale.
Display Setup...
Opens “Display Setup (page 1-95)”.
If multiple layers are opened on the Data Display window, the scale change is
applied to all layers. This means that the X-Y graph scale will be shared by all
display layers. The auto scaling is performed as follows.
1- 90
Agilent EasyEXPERT User’s Guide Vol. 1, Edition 1
Main GUI
Data Display
1. Graph scale is optimized for the data on the selected layer (top layer).
2. The graph scale is applied to the graph in all layers.
Note that auto scaling is performed independently for the left and right Y axes.
Marker menu
Cursor menu
Line menu
Marker can move on the measurement data curve. The Marker menu provides the
following six functions.
Marker ON/OFF
Enables or disables the marker.
Interpolation ON/OFF
Enables or disables the interpolation function of
measurement data. You can read the interpolation
data between two actual measurement points.
Skip
Moves the marker to the next measurement curve
that is added by the VAR2 variable.
Go To Maximum
Moves the marker to the maximum value point.
Go To Minimum
Moves the marker to the minimum value point.
Go To...
Opens the Direct Marker/Cursor dialog box used to
specify the coordinate values to move the marker.
Cursor can move anywhere on the graph. The Cursor menu provides the following
three functions.
Cursor ON/OFF
Enables or disables the cursor.
Go to Marker
Moves the cursor to the marker position.
Go to...
Opens the Direct Marker/Cursor dialog box used to
specify the coordinate values to move the cursor.
Provides the following five functions. When a line is enabled, gradient, X-intercept,
and Y-intercept are displayed in the graph. See Figure 1-11.
Line 1 ON/OFF
Enables or disables line 1.
Line 2 ON/OFF
Enables or disables line 2.
Line Mode
Selects the line mode: normal, gradient, tangent,
regression, or fix.
Adjust Gradient
Available when a gradient line is active. Checking
this function enables the rotary knob and the mouse
wheel to increase/decrease the gradient of the line.
Unchecking this function, clicking the rotary knob,
or clicking the mouse wheel disables this function.
Agilent EasyEXPERT User’s Guide Vol. 1, Edition 1
1- 91
Main GUI
Data Display
Gradient...
Opens the Gradient Value dialog box used to
specify the gradient value of the gradient line.
You can draw a line as shown below:
1. Set Line 1 or Line 2 on.
2. Select a Line Mode.
Figure 1-11
Normal
A line and two cursors appear. Move cursors to the points
where the line passes through.
Gradient
A line and a cursor appear. Move cursor to the point where
the line passes through. Enable Adjust Gradient function,
then increase/decrease the gradient of the line by using the
rotary knob or the mouse wheel.
Tangent
A line appears. Set the marker on. The tangent line appears
on the marker point.
Regression
A line and two cursors appear. Move cursors for specifying
the measurement data used for the regression calculation.
The calculation is executed by using the data included in the
square drawn by the extended cross cursor lines. For the
subordinate sweep measurement data, specify the data curve
by using the marker.
Fix
Fixes the line on the graph.
Line Mode
1RUPDOOLQH
*UDGLHQWOLQH
7DQJHQWOLQH
5HJUHVVLRQOLQH
FXUVRUV
FXUVRU
JUDGLHQW
PDUNHU
GDWDFXUYH
FXUVRUV
PHDVXUHGGDWD
1- 92
Agilent EasyEXPERT User’s Guide Vol. 1, Edition 1
Main GUI
Data Display
Text menu
Up to 20 texts can be added to a graph. The following functions are provided.
New
Opens the text editor for adding a new text.
Hide All/ Show All
Hides or shows all texts.
Delete All
Deletes all texts.
Clicking on a text will select the text. To select multiple texts, click the texts while
holding down the Shift key on the keyboard.
The following functions are available for the selected text(s) via the Text menu, the
Text icons, or the right-click menu.
Edit Mode
Edits the selected text.
Size
Sets the font size of the selected text(s). The
available setting values are Largest, Large,
Medium, Small, Smallest, and Fixed Point (6, 7, 8,
9, 10, 11, 12, 14, 16, 18, or 20). For settings other
than Fixed Point, an appropriate size will
automatically be applied. For Fixed Point, the
specified font size will always be applied.
Font
Sets the font of the selected text(s).
Text Color
Sets the text color of the selected text(s). Click
Customize to open the color palette.
Background Color
Sets the background color of the selected text(s).
Click Customize to open the color palette.
Hide Frame/Show Frame
Hides or shows the frame for the selected text(s).
Delete
Deletes the selected text(s).
Agilent EasyEXPERT User’s Guide Vol. 1, Edition 1
1- 93
Main GUI
Data Display
Pointer menu
Up to 30 pointers can be added to a graph. The following functions are provided.
New
This function is enabled when the marker is ON.
Adds a new pointer at the position of the active
marker.
Hide All/ Show All
Hides or shows all pointers.
Show All Descriptions
Shows all descriptions (pointer ID and X-Y
coordinate values) of the pointers.
Hide All Descriptions
Hides all descriptions of the pointers.
Delete All
Deletes all pointers.
Clicking on a pointer will select the pointer. To select multiple pointers, click the
pointers while holding down the Shift key on the keyboard.
The following functions are available for the selected pointer(s) via the Pointer
menu, the Pointer icons, or the right-click menu.
Shape
Sets the shape of the selected pointer(s).
Hide Description/Show
Description
Delete
Window menu
Help menu
Hides or shows the description of the selected
pointer(s).
Deletes the selected pointer(s).
Provides the three functions below. The functions work for opened windows.
Tiling
Tiles all Data Display windows on the screen.
Stacking
Stacks all Data Display windows on the screen.
Overlaying
Overlays all Data Display windows on the screen.
Then the position, window size, and visibility of the
most front window are applied to all windows on
the screen. The background of the X-Y Graph area
is cleared except for the most back window.
Agilent EasyEXPERT Help
Opens the EasyEXPERT help window.
1- 94
Agilent EasyEXPERT User’s Guide Vol. 1, Edition 1
Main GUI
Data Display
Display Setup
This setup screen is displayed by selecting View > Display Setup..., and is used to
select the data displayed in the Data Display window.
X-Y Graph
Selects the data to be displayed in the X-Y Graph Plot area. The X and Y1 to Y8
axes can be set.
Name
Specifies the parameter for the axis.
Sharing
Specifies the group for sharing the Y axis scale. Select from
Group 1, Group 2, Group 3, Group 4, or None (no grouping).
The Scale, Min, and Max values are shared by the Y axes in the
same group. The scale set by Run Time Auto Scale, Auto Scale,
Zoom in, and/or Zoom out are also shared.
If another layer on the Data Display window contains an X-Y
trace which has the same name for both its grouped Y
parameter and its X parameter, the scaling will also be shared
by this X-Y trace.
List Display,
Parameters
Scale
Scale of the axis, Linear or Log
Min
Minimum value of the axis
Max
Maximum value of the axis
Add
Adds a parameter (or axis).
Delete
Deletes the parameter selected with the radio button on the left.
Up
Moves the selected parameter upward.
Down
Moves the selected parameter downward.
Selects the data displayed in the List Display area or the Parameters area. Up to 20
parameters can be set for each area.
parameter
Specifies the parameter for the data output.
Add
Adds a row for the parameter.
Delete
Deletes the parameter selected by the left radio button.
Up
Moves the selected parameter upward.
Down
Moves the selected parameter downward.
Agilent EasyEXPERT User’s Guide Vol. 1, Edition 1
1- 95
Main GUI
Data Display
Graph Properties
This dialog box is opened by clicking the Properties... button in the X-Y Graph Plot
area or by selecting Edit > Graph Properties..., and is used to set the graph plot area.
Click the OK button to apply the setup and close this dialog box.
Effective Area
This area provides the following check box.
Logo ON
Displays the Agilent logo at the upper left of the graph area.
Grid ON
Displays the grid on the graph.
Setup Summary
ON
Graph Color
This is valid only for the I/V Sweep and Multi Channel I/V
Sweep classic tests. Displays the channel setup summary at the
bottom of the graph area. See “Setup Summary” on page 1-101.
This area is used to set the color map for the graph plot area. You can change the
color of the background, text, graph grid, and line/cursor. The color palette is
opened by clicking the pattern of the item.
Graph Trace Color This area is used to set visibility, color, and thickness of the data traces Y1 to Y8
plotted on the graph. The color palette is opened by clicking the pattern of the item.
Log Scale
This area is used to set the maximum number of decades to show the minor ticks on
the log axis. If the number of graph decades is less than or equal to the entered
value, the minor ticks are displayed. If it is greater than the entered value, the minor
ticks are not displayed.
Text Size
This area is used to set the font size for the graph. The available settings are Largest,
Large, Medium, Small, Smallest, and Fixed. For settings other than Fixed, the
appropriate size is automatically selected. For Fixed, a font size entry field is
provided, and the specified font size is always applied.
X/Y Axis Title
Font size for the axis title
Scale
Font size for the X and Y coordinate values
Legend
Font size for the graph legend
1- 96
Agilent EasyEXPERT User’s Guide Vol. 1, Edition 1
Main GUI
Data Display
List Display Properties
This dialog box is opened by clicking the Properties... button in the List Display
area or by selecting Edit > List Display Properties..., and is used to set the data
display format in the List Display area. Click the OK button to apply the setup and
close this dialog box.
Display
Number Format
Check the following check box to add the data status or the physical unit to data.
Unchecking the box removes it.
Data Status
Adds or removes the status code before data.
Physical Unit
Adds or removes the physical unit after data.
Selects the data display format from the following formats.
•
Engineering Format (Example: -1.2345 mA)
Data display with arithmetic point, SI prefix, and unit.
•
Scientific Notation (Example: -1.23456789012345E-003 A)
Data display with arithmetic point, exponential part (E, +/- sign, and three-digit
number), and unit.
Tool Bar
The Data Display window provides the 22 icons on the tool bar. You will see the
following icons from left to right in the Data Display window.
Switch Display
Mode
This icon switches the display mode.
In Overwrite mode, the “Display Data (page 1-17)” function opens a new Data
Display window and displays data.
In Append mode, the “Display Data (page 1-17)” function creates a new display
layer on the present Data Display window and displays data.
Close All Displays This icon closes all display layers.
Show X-Y Graph
This icon displays or hides the X-Y Graph Plot area.
Show List Display
This icon displays or hides the List Display area.
Show Parameters
This icon displays or hides the Parameters area.
Agilent EasyEXPERT User’s Guide Vol. 1, Edition 1
1- 97
Main GUI
Data Display
Auto Scale
This icon will change the graph scale automatically to fit the trace in the graph.
The right arrow button opens the menu for enabling or disabling the run time auto
scaling. This function is set independently for the X and Y axes. If this function is
enabled, the graph scale will be changed automatically to fit the trace in the graph
during the measurement.
If multiple layers are opened on the Data Display window, the scale change is
applied to all layers. This means that the X-Y graph scale will be shared by all
display layers. The auto scaling is performed as follows.
1. Graph scale is optimized for the data on the selected layer (top layer).
2. The graph scale is applied to the graph in all layers.
Note that the auto scaling is performed independently for the left and right Y axes
individually.
There is also a function for resetting the graph scale. Click View > Cancel Scaling >
This Display or All Displays. This Display will reset the selected layer only. All
Displays will reset for the all display layers.
Zoom In
This icon zooms the data graph in the cursor. If the cursor is not displayed, zooms
the data graph in the last cursor position or the graph center. This enlarges the trace
in the graph.
Zoom Out
This icon zooms the data graph out the cursor. If the cursor is not displayed, zooms
the data graph out the last cursor position or the graph center. This reduces the trace
in the graph.
Display Setup...
This icon opens “Display Setup (page 1-95)”.
Choose Active
Y-axis
This icon selects the Y-axis that is effective for the marker control and the auto
scale.
Marker ON/OFF
This icon enables or disables the marker.
Interpolation
ON/OFF
This icon enables or disables the interpolation function of measurement data. You
can read the interpolation data between two actual measurement points.
Marker Skip
This icon moves the marker to the next measurement curve that is added by the
VAR2 variable.
Marker Maximum
This icon moves the marker to the maximum measurement point.
1- 98
Agilent EasyEXPERT User’s Guide Vol. 1, Edition 1
Main GUI
Data Display
Marker Minimum
This icon moves the marker to the minimum measurement point.
Marker Search...
This icon opens the Direct Marker/Cursor dialog box used to specify the coordinate
values to move the marker.
Line 1 State
This icon enables or disables line 1 and its function: disabled, normal, gradient,
tangent, regression, or fix.
Line 2 State
This icon enables or disables line 2 and its function: disabled, normal, gradient,
tangent, regression, or fix.
Cursor to Marker
This icon moves the cursor to the marker position.
Adjust Gradient
This icon is available when a regression line is active. Clicking this icon enables the
rotary knob and the mouse wheel to increase/decrease the gradient of the line.
Clicking this icon again, pressing the rotary knob, or pressing the mouse wheel
disables this function.
Show Graph
Legend
This icon displays or hides the graph legend below the plot area.
Show Line
Information
This icon displays or hides the line information (X-intercept, Y-intercept, gradient)
in the plot area.
Agilent EasyEXPERT User’s Guide Vol. 1, Edition 1
1- 99
Main GUI
Data Display
Data Status
If measurement module detects any status while measurement, the status code is
recorded with the measurement data. And the status code will be displayed in the
Data Display window as shown in the following example.
Example
•
X-Y Graph Plot area
MARKER( 5.9000000
C 1.82520000
XV 3.33249E-3 )
This line will be displayed at the top of the plot area when marker is ON. The
marker is used to read data of the marker point.
•
List Display area
Index
123
Status Code
V1
V2
I2
5.9 V
C 1.8252 V
XV 3.33249 mA
SMU status code:
•
C: Compliance
•
T: Other channel compliance
•
X: Oscillation
•
V: Overflow
MFCMU status code:
•
U: Unbalance
•
D: I/V amp saturation
•
V: Overflow
1- 100
Agilent EasyEXPERT User’s Guide Vol. 1, Edition 1
Main GUI
Data Display
Setup Summary
This function is effective for the I/V Sweep and Multi Channel I/V Sweep classic
tests. If the Setup Summary ON is set on the Graph Properties dialog box or the
Data Display Properties dialog box, the channel setup summary information shown
below is displayed at the bottom of the graph area.
The setup for one channel is displayed with one line as follows. Where, the items in
{} are the setting values.
VAR1 Channel
For the voltage output channel:
{V Name}: [{Start}, {Stop}] V / {No of Step}; {I Name}: {Compliance} A; {Pwr Comp} W
For the current output channel:
{I Name}: [{Start}, {Stop}] A / {No of Step}; {V Name}: {Compliance} V; {Pwr Comp} W
Example: VDS: [0, 10] V / 101; ID: 1 A; 1 W
VAR2 Channel
For the voltage output channel:
{V Name}: [{Start}, {Stop}] V / {Step} V; {I Name}: {Compliance} A; {Pwr Comp} W
For the current output channel:
{I Name}: [{Start}, {Stop}] A / {Step} A; {V Name}: {Compliance} V; {Pwr Comp} W
Example: VGS: [0, 5] V / 1 V; ID: 1 mA; 1 mW
Constant Channel
For the voltage output channel:
{V Name}: {Source} V; {I Name}: {Compliance} A
For the current output channel:
{I Name}: {Source} A; {V Name}: {Compliance} V
For the common channel:
{V Name}: COMMON
Example: VSUB: -1 V; ISUB: 1 mA
Agilent EasyEXPERT User’s Guide Vol. 1, Edition 1
1- 101
Main GUI
Data Display
Miscellaneous Operations
The following user interfaces provide several miscellaneous functions when you
operate the Data Display window.
•
“Mouse/Touch Panel”
•
“Rotary Knob”
•
“Softkeys”
•
“Keyboard”
Mouse/Touch Panel
While the Data Display window is focused, the mouse/touch panel operations
shown in Table 1-11 (p. 1-106) are available.
Rotary Knob
The following miscellaneous functions are available by using the rotary knob.
•
Marker movement in the VAR1 direction
While the Data Display window is focused and the marker is displayed on the
graph, the rotary knob can be used to move the marker. Rotating the knob fast
increases the marker speed.
•
Marker movement in the VAR2 direction
Clicking the knob moves the marker in the VAR2 direction.
•
Slope adjustment of the gradient line
In the slope adjustment mode (Line > Adjust Gradient) for the gradient line, the
rotary knob can be used to adjust the slope. Clicking the knob quits this mode.
•
Pointer movement in the VAR1 direction
The rotary knob can be used to move the selected pointer. The pointer can not be
moved in the VAR2 direction.
Softkeys
The softkeys can be used for setting the following fields on the Display Setup (p.
1-95) window.
•
Name (parameter name)
•
Scale (Linear or Log)
1- 102
Agilent EasyEXPERT User’s Guide Vol. 1, Edition 1
Main GUI
Data Display
Keyboard
While the Data Display window is focused, the key operations shown in Table 1-6
are available.
Table 1-6
Miscellaneous Key Operations on Data Display Window
Key
Description
F1
Displays the online help
F2
Shortcut to View > X-Y Graph
F3
Shortcut to View > List Display
F4
Shortcut to View > Parameters
F12
Changes the display mode, Append Overwrite Append
Ctrl+W
Shortcut to File > Close This Display
Ctrl+Shift+W
Shortcut to File > Close All Displays
Ctrl+S
Shortcut to File > Save Image As...
Ctrl+P
Shortcut to File > Print...
Ctrl+C
Shortcut to Edit > Copy
While the X-Y Graph (graph display area) is focused, the key operations shown in
the following tables are available.
•
Table 1-7, “Controlling X-Y Graph.”
•
Table 1-8, “Controlling Marker.”
•
Table 1-9, “Controlling Cursor.”
•
Table 1-10, “Controlling Line.”
Agilent EasyEXPERT User’s Guide Vol. 1, Edition 1
1- 103
Main GUI
Data Display
Table 1-7
Controlling X-Y Graph
Key
Table 1-8
Description
S
Shortcut to View > Auto Scale
Z
Shortcut to View > Zoom In
Shift+Z
Shortcut to View > Zoom Out
Ctrl+Z
Shortcut to View > Cancel Scaling
Y
Changes the active data, Y1 Y2 ... Y8 Y1
R
Activates the right Y axis and changes the data set to the axis,
Y2 Y3 ... Y8 Y2
W
Shortcut to View > Graph Legend ON/OFF
K
Shortcut to View > Line Information ON/OFF
Controlling Marker
Key
Description
M
Shortcut to Marker > Marker ON/OFF
I
Shortcut to Marker > Interpolation ON/OFF
F
Moves the marker +1 a in the VAR1 direction
Shift+F
Moves the marker +10 a in the VAR1 direction
B
Moves the marker -1 a in the VAR1 direction
Shift+B
Moves the marker -10 a in the VAR1 direction
P
Moves the marker +1 a in the VAR2 direction
Shift+P
Moves the marker -1 a in the VAR2 direction
J
Shortcut to Marker > Go To...
X
Shortcut to Marker > Go To Maximum
N
Shortcut to Marker > Go To Minimum
a. Multiply 1/10 if the interpolation is ON.
1- 104
Agilent EasyEXPERT User’s Guide Vol. 1, Edition 1
Main GUI
Data Display
Table 1-9
Controlling Cursor
Key
Table 1-10
Description
C
Shortcut to Cursor > Cursor ON/OFF
T
Shortcut to Cursor > Go To Marker
Moves the cursor +1/1000 in the Y axis direction
Shift+
Moves the cursor +1/100 in the Y axis direction
Moves the cursor +1/1000 in the X axis direction
Shift+
Moves the cursor +1/100 in the X axis direction
Moves the cursor -1/1000 in the Y axis direction
Shift+
Moves the cursor -1/100 in the Y axis direction
Moves the cursor -1/1000 in the X axis direction
Shift+
Moves the cursor -1/100 in the X axis direction
Controlling Line
Key
Description
1a
Shortcut to Line > Line 1 ON/OFF
2a
Shortcut to Line > Line 2 ON/OFF
V
Changes the active line, Line 1 Line 2 Line 1
(available if both line 1 and line 2 are ON)
L
Changes the line mode of the active line,
Normal Gradient Tangent Regression Normal
G
Shortcut to Line > Adjust Gradient
a. 1 and 2 on the numeric pad cannot be used.
Agilent EasyEXPERT User’s Guide Vol. 1, Edition 1
1- 105
Main GUI
Data Display
Table 1-11
Mouse/Touch Panel Operations on Data Display Window
Location
Operation
Description
X-Y Graph
clicking on the left
Y axis
Activates the Y1 data.
clicking on the
right Y axis
Activates the data of the right Y axis, or changes the active data
if it is already active.
clicking on a plot
Moves the marker to the position of the mouse pointer if the
marker is displayed on the graph.
clicking on a cursor
Specifies the active cursor if multiple cursors are displayed.
dragging a cursor
Moves the cursor.
clicking on a line
Specifies the active line if multiple lines are displayed.
clicking on a text
Selects the text.
Clicking with pressing the Shift key on the keyboard selects
multiple texts.
dragging a text
Moves the text.
clicking on a
pointer
Selects the pointer.
clicking on a
description of
pointer
Selects the description of pointer.
dragging a
description of
pointer
Moves the description of pointer.
rotating the mouse
wheel
Moves the marker if the marker is displayed on the graph,
moves the pointer if the pointer is selected, or adjusts the slope
of the gradient line if it is in the slope adjustment mode (Line >
Adjust Gradient).
1- 106
Clicking with pressing the Shift key on the keyboard selects
multiple pointers.
Clicking with pressing the Shift key on the key board selects
multiple descriptions of pointers.
Agilent EasyEXPERT User’s Guide Vol. 1, Edition 1
Main GUI
Data Display
Location
Operation
X-Y Graph
clicking the mouse
wheel
Same as clicking the rotary knob.
dragging a column
heading
Moves the column.
dragging boundary
of the column
Changes the width of the column.
clicking on a row in
the table
Moves the marker to the corresponding position.
moving the scroll
bar
Changes the data displayed in the List Display area.
rotating the mouse
wheel
Changes the data displayed in the List Display area.
clicking on a taba
under the tool bar
Specifies the display layer for the data display and analysis.
double clicking on
a taba under the
tool bar
Changes the status of the pin marked to the display layer.
List Display
Others
Description
This is effective if the mouse properties assign the center button
functions to the wheel button.
Scroll is effective for both portrait and landscape.
Standing pin must be marked to the display layer to be kept.
Laid pin is marked to the display layer under the automatic
delete.
dragging boundary
of the display area
Adjusts the size of the display area (X-Y Graph, List Display,
Parameters) without changing the window size.
dragging the frame
of the Data Display
window
Changes the window size with adjusting the size of the display
area (X-Y Graph, List Display, Parameters).
a. Tab is displayed if the display mode is Append and the test result record contains the append
measurement data.
Agilent EasyEXPERT User’s Guide Vol. 1, Edition 1
1- 107
Main GUI
Preview
Preview
The Preview window and the Preview Settings dialog box are opened by selecting
View > Open Preview Window in the Data Display window. The Preview Settings
dialog box is used to set the graph title, X axis title, Y axis title, and line style. And
the Preview window displays a new plot, and is used to output it to the specified
printer.
The Data Display window cannot do the above settings and display the new plot.
•
“Preview Window GUI”
•
“Preview Settings”
Preview Window GUI
The Preview window provides the following GUI.
Setup Name
This field just displays the name of the test setup used to get this test record.
X-Y Graph Plot
This area displays the measurement result graph, traces, marker, cursor, and lines.
Parameters
This area lists the user-defined output parameters if the output parameters are set.
List Display
This area displays the measurement result data list.
File menu
Provides the following functions. See also Figure 1-7 and Figure 1-8.
Page Setup...
Opens a dialog box used to set the print page.
Print Preview
Opens a dialog box used to specify the data graphs
to make previews. After selecting the graphs,
previews appear on the Print preview window.
Print...
Opens a dialog box used to specify the print target.
After selecting the target, the Print dialog box is
opened. The dialog box is used to start print.
Close Preview Window
Closes the Preview window.
1- 108
Agilent EasyEXPERT User’s Guide Vol. 1, Edition 1
Main GUI
Preview
Edit menu
Provides the following functions. See also Figure 1-9 and Figure 1-10.
Copy
While the X-Y Graph Plot area is active, this
function copies the graph image as BMP and EMF
into the clipboard.
While the line cursor in the List Display area is
active, this function copies the data list as CSV.
While the Parameters area is active, this function
copies the parameter data as CSV.
View menu
Help menu
Copy Graph
Copies the graph image as BMP and EMF into the
clipboard.
Copy List
Copies the list data as CSV.
Copy Parameters
Copies the parameter data as CSV.
Provides the following functions.
X-Y Graph
Displays or hides the X-Y Graph Plot area.
List Displays
Displays or hides the List Display area.
Parameters
Displays or hides the Parameters area.
Preview Settings...
Opens “Preview Settings (page 1-110)”.
Agilent EasyEXPERT Help
Opens the EasyEXPERT help window.
Agilent EasyEXPERT User’s Guide Vol. 1, Edition 1
1- 109
Main GUI
Preview
Preview Settings
The Preview Settings dialog box provides the following GUI.
General
Defines the graph title in the Graph Title field. The title will appear at the bottom of
the plot area.
X/Y Axis Title
Defines the X axis title in the X field and the Y axis title in the Y field, Y1 to Y8.
The title will appear near the axis.
Line Style
Selects the line style for the line 1, line 2, and trace Y1 to Y8.
Color and
Thickness...
Opens the Color and Thickness dialog box that provides the same GUI as “Graph
Properties (page 1-96)”.
OK
Applies the setup to the Preview window, and closes this dialog box.
Cancel
Cancels the setup, and closes this dialog box.
Apply
Applies the setup to the Preview window.
Reset
Clears the setup and returns to the default setting.
1- 110
Agilent EasyEXPERT User’s Guide Vol. 1, Edition 1
Main GUI
Text File Export settings
Text File Export settings
This dialog box is opened by clicking Results > Transport Data > Text File Export
Settings... or the Settings button on the Test Results Data Folder Export dialog box
or the Test Results Data Auto Export dialog box. This dialog box is used to define
the style of the test record exported by the Export As Text File function.
Reset
Applies the default value to the all setup items.
OK
Defines and memorizes the present setting, and closes this dialog box.
Cancel
Cancels and clears the setting changes, and closes this dialog box.
Miscellaneous,
Save As
Specifies the delimiter (data separator) and file extension. CSV (comma separated,
.csv, default), Text (tab separated, .txt), or Formatted Text (space separated, .prn).
Miscellaneous,
Quotation
Specifies the quotation for the string values. Single (single quotes), Double (double
quotes), or None (no quote, default). Even if None is specified, the string which
contains delimiter and/or new line character will be double quoted.
Identification
section
Record items which are used to identify and characterize the test record. They are a
sub set of the meta data, test type, and test name. See Table 1-13 for the definition of
the record items. Check the box for the items you want to record, and uncheck the
box for the items you do not want to record. In the default, all items are checked.
The pull-down menu specifies the action for recording the items in the Identification
section. See Table 1-12 to specify the action.
Table 1-12
Actions for Identification and Setup Data Items
Action
Description
Save with measurement data
The checked items are recorded in the test record
with the measurement data. Default.
Do not save
No item is recorded even if any box is checked.
Save as separate file
The checked items are recorded in a separate file.
The name will be the test record’s file name plus
-s before the extension.
Agilent EasyEXPERT User’s Guide Vol. 1, Edition 1
1- 111
Main GUI
Text File Export settings
Table 1-13
Identification Section Record Items
Item
Description
Setup title
Test setup name
Classic test
name
Classic test name. I/V Sweep, Multi Channel I/V Sweep, I/V-t
Sampling, C-V Sweep, SPGU Control, Switching Matrix Control,
or Direct Control. This record item is exclusive against the
“Application test name” record item.
Application
test name
Application test name. This record item is exclusive against the
“Classic test name” record item.
Test date
Test execution date corresponding to the date part of the
RecordTime meta data.
Test time
Test execution time corresponding to the time part of the
RecordTime meta data.
Device ID
Device ID corresponding to the TestTarget meta data.
Count
Test count corresponding to the IterationIndex meta data.
Flags
Flags set to the test result data, corresponding to the Flag meta
data.
Remarks
Remarks set to the test result data, corresponding to the Remarks
meta data.
Setup data section Record items which describes the test conditions. They are the test parameters, DUT
parameters, and analysis setup. See Table 1-16 for the definition of the record items.
Check the box for the items you want to record, and uncheck the box for the items
you do not want to record.
Tag information for the setup data is string value; TestParameter, DutParameter, or
AnalysisSetup, which means the type of data put in the same row in the exported
test record. If Tag information box is unchecked (default), the tag information is not
recorded. Then, the setup parameter names, such as Channel.Unit, are recorded in
the first column in the test record and the parameter values are recorded in the
following columns. If the Tag information box is checked, the tag information is
recorded in the first column and the parameter names and values are shifted to the
next columns.
The pull-down menu specifies the action for recording the items in the Setup data
section. See Table 1-12 to specify the action.
1- 112
Agilent EasyEXPERT User’s Guide Vol. 1, Edition 1
Main GUI
Text File Export settings
Measurement data Record items of the measurement data. It may contain the measurement parameter
section
names, data units, and data size. See Table 1-17 for the definition of the record
items. Check the box for the items you want to record, and uncheck the box for the
items you do not want to record.
Tag information for the measurement data is string value; Dimension1, Dimension2,
Data Name, Data Unit, or Data Value, which means the type of data put in the same
row (in case of By Row orientation) or column (in case of By Column orientation)
in the exported test record. The tag information will be recorded in the test record if
the Tag information box is checked.
See Table 1-14 for the By Row orientation. All data relative to a measurement
parameter will be put in the same column. The first column (ex. column A) contains
the tag information. For the By Column orientation, see Table 1-15. All data relative
to a measurement parameter will be put in the same row. And the first row (ex. row
1) contains the tag information. If the Tag information box is unchecked (default),
the tag information is not recorded and the measurement data is shifted.
Table 1-14
By Row Orientation Export Example
A
Table 1-15
B
C
D
1
Dimension1
101
101
101
1
2
Dimension2
1
1
1
1
3
Data Name
Vg
Id
Gm
Vth
4
Data Unit
V
A
S
V
5
Data Value
0
4.55E-09
1.24E-10
1.23
6
Data Value
0.02
8.59E-09
5.25E-10
E
F
E
F
By Column Orientation Export Example
A
B
C
D
1
Dimension1
Dimension2
Data Name
Data Unit
Data Value
Data Value
2
101
1
Vg
V
0
0.02
3
101
1
Id
A
4.55E-09
8.59E-09
4
101
1
Gm
S
1.24E-10
5.25E-10
5
1
1
Vth
V
1.23
6
Agilent EasyEXPERT User’s Guide Vol. 1, Edition 1
1- 113
Main GUI
Text File Export settings
Table 1-16
Setup Data Section Record Items (ON: checked, OFF: unchecked)
Item
Table 1-17
Description
Default
Test parameters
Test parameters defined by the classic test or the
application test.
ON
DUT parameters
DUT parameters defined by the application test.
ON
Analysis setup
Data Display setup status at and after the
measurement, such as Graph configuration, Graph
format, Graph text, Marker configuration, Cursor
configuration, Line configurations, Pointer
configuration, List configuration, and Scalar list
configuration.
OFF
Measurement Data Section Record Items (ON: checked, OFF: unchecked)
Item
Description
Default
Data names
Measurement parameter name.
ON
Data units
Unit of measurement data.
OFF
Size
Dimension1 (VAR1 size) and Dimension2 (VAR2 size)
of the measurement data.
OFF
Data values
Record items can be specified by the following segments.
Segment
1- 114
Default
Data assigned to X-Y Graph
ON
Data assigned to List Display
ON
Data assigned to Parameter Display
ON
User function defined but not displayed
OFF
Analysis function defined but not displayed
OFF
Any data referred to by the user function but not
directly displayed
OFF
Any data referred to by the analysis function but not
directly displayed
OFF
Agilent EasyEXPERT User’s Guide Vol. 1, Edition 1
2
Classic Test Definition
Classic Test Definition
This chapter provides the reference information of the classic test setup GUI of
Agilent EasyEXPERT software.
•
“I/V Sweep”
•
“Multi Channel I/V Sweep”
•
“I/V List Sweep”
•
“I/V-t Sampling”
•
“C-V Sweep”
•
“Direct Control”
•
“Function Setup”
•
“Auto Analysis Setup”
•
“Display Setup”
•
“SMU Range Setup Window”
•
“ADC and Integration Time Setup Window”
•
“Pulse Setup Window”
•
“Advanced Setup Window”
•
“Range Setup Window”
•
“Advanced Setup Window for C-V Sweep”
•
“Switching Matrix Control”
•
“SPGU Control”
•
“SPGU Pulse Setup Window”
•
“Load Z Setup Window”
•
“Pulse Switch Setup Window”
•
“SPGU ALWG Setup Window”
•
“Define ALWG Waveform Window”
2- 2
Agilent EasyEXPERT User’s Guide Vol. 1, Edition 1
Classic Test Definition
To perform measurement, see “Main Screen” on page 1-11.
To display measurement data and perform data analysis, see “Data Display” on page
1-84.
To perform self-test or diagnosis, see “Configuration” on page 1-64.
To perform self-calibration, see “Calibration” on page 1-58.
NOTE
If You Use GNDU (Ground Unit)
Keep to the following rule to use the ground unit.
1. Set Mode to COMMON.
2. Set Function to CONST.
3. Do not use the I Name assigned to the ground unit.
Missing any one will cause an execution error.
Agilent EasyEXPERT User’s Guide Vol. 1, Edition 1
2- 3
Classic Test Definition
I/V Sweep
I/V Sweep
On the EasyEXPERT main screen, click the Classic Test tab and select the I/V
Sweep icon. The main screen displays the I/V sweep test setup screen. For the
measurement mode, see “I/V Sweep Measurement” on page 4-3.
Setup Name
Used to set the name of test setup. The name must be the identification for the test
setup saved to a My Favorite group (preset group). Enter a unique name that is
distinct from other setup.
The name is recorded in the test result data and is used to differentiate the data in the
test record list area.
Channel Setup
This tab displays the Channel Setup screen. See “Channel Setup” on page 2-5.
Measurement
Setup
This tab displays the Measurement Setup screen. See “Measurement Setup” on page
2-6.
Function Setup
This tab displays the Function Setup screen. See “Function Setup” on page 2-42.
Auto Analysis
Setup
This tab displays the Auto Analysis Setup screen. See “Auto Analysis Setup” on
page 2-43.
Display Setup
This tab displays the Display Setup screen. See “Display Setup” on page 2-46.
2- 4
Agilent EasyEXPERT User’s Guide Vol. 1, Edition 1
Classic Test Definition
I/V Sweep
Channel Setup
This setup screen is used to define the channel setups and the variables for the
channel output data, measurement data, time stamp data, and index data.
Channel Definition This area defines the channel setups and the variables for the channel output data
and the measurement data.
Unit
Measurement resource used for the source output or
measurement
V Name
Variable name of voltage output or measurement data
I Name
Variable name of current output or measurement data
Mode
Output mode. For SMU, V (voltage), I (current), VPULSE
(voltage pulse), IPULSE (current pulse), or COMMON
(ground). For SPGU, VPULSE (voltage pulse) or ALWG
(arbitrary linear waveform voltage).
Function
Output function, VAR1 (primary sweep), VAR2 (secondary
sweep), VAR1’ (synchronous sweep), or CONST (constant)
Add SMU
Adds a row for the SMU channel setup.
Add SPGU
Adds a row for the SPGU channel setup.
Delete
Deletes the channel setup. To select the channel setup, use the
left radio button.
Up
Moves the selected channel setup upward.
Down
Moves the selected channel setup downward.
If multiple output channels are defined, the channels start output sequentially. The
order is top to bottom of the channels defined in this screen. The output stops in the
opposite order.
Miscellaneous
Variables
This area defines the variables for the time stamp data and the index data.
Time Stamp Name
Variable name of the time stamp. Time stamp data gives the
time when step measurement is started.
Index Name
Variable name of the data index. Integer above 0 is returned.
Agilent EasyEXPERT User’s Guide Vol. 1, Edition 1
2- 5
Classic Test Definition
I/V Sweep
Measurement Setup
This setup screen is used to set the source channel outputs, the measurement ranging
mode, the sweep abort condition, the measurement channel A/D converter, the
series resistor, the filter, and the source output/measurement wait time.
VAR1
This area defines the primary sweep source output.
Unit
SMU used for the VAR1 output
Name
Variable name for the VAR1 output data
Direction
Sweep direction, single (start to stop) or double (start to stop to
start)
Linear/Log
Sweep output, LINEAR, LOG10, LOG25, or LOG50. where
the number following LOG means the number of sweep points
in one decade.
Start
Sweep start value
Stop
Sweep stop value
Step
Incremental step value of the sweep output
No of Step
Number of steps. The value is automatically calculated by using
the start, stop, and step values.
Compliance
Compliance value. Enter the current limit value for the voltage
source, or the voltage limit value for the current source.
Pwr Comp
Power compliance value (in W), or OFF
2- 6
Agilent EasyEXPERT User’s Guide Vol. 1, Edition 1
Classic Test Definition
I/V Sweep
VAR2
VAR1’
This area defines the secondary sweep source output.
Unit
SMU used for the VAR2 output
Name
Variable name for the VAR2 output data
Start
Sweep start value
Stop
Sweep stop value. The value is automatically calculated by
using the start, step, and number of step values.
Step
Incremental step value of the sweep output
No of Step
Number of sweep steps
Compliance
Compliance value. Enter the current limit value for the voltage
source, or the voltage limit value for the current source.
Pwr Comp
Power compliance value (in W), or OFF
This area defines the synchronous sweep source output. The VAR1’ output is given
by the following formula.
VAR1’ output = Offset + Ratio VAR1 output
Timing
Unit
SMU used for the VAR1’ output
Name
Variable name for the VAR1’ output data
Offset
Offset value
Ratio
Ratio value
Compliance
Compliance value. Enter the current limit value for the voltage
source, or the voltage limit value for the current source.
Pwr Comp
Power compliance value (in W), or OFF
This area defines the hold time and the delay time. See “To Specify Source Output
Time” on page 4-67.
Hold
Hold time. This is the time from beginning of channel output to
beginning of delay time. 0 to 655.35 s, 10 ms resolution.
Delay
Delay time. This is the time from end of hold time to beginning
of measurement. The measurement channels start measurement
as soon as the wait time elapses. 0 to 65.535 s, 0.1 ms
resolution.
Agilent EasyEXPERT User’s Guide Vol. 1, Edition 1
2- 7
Classic Test Definition
I/V Sweep
Constant
SMU Pulse
This area defines the constant output source.
Unit
SMU used for the constant source
V Name
Variable name for the constant voltage output or measurement
data
I Name
Variable name for the constant current output or measurement
data
Mode
Output mode, V (voltage), I (current), VPULSE (voltage pulse),
or IPULSE (current pulse)
Source
Output value
Compliance
Compliance value. Enter the current limit value for the voltage
source, or the voltage limit value for the current source.
This area defines the SMU pulse setup parameters. See “SMU Pulse” on page 4-62.
Unit
SMU used for the pulse output
Period
Pulse period. Entering AUTO sets the optimum value
automatically.
Width
Pulse width
Base
Pulse base value
Sweep status
This field specifies the sweep abort condition. See “Sweep Abort Function” on page
4-37.
Range
This button opens a window used to set the measurement ranging operation. See
“SMU Range Setup Window” on page 2-48.
ADC/Integ
This button opens a window used to set the A/D converter of the measurement
channels. See “ADC and Integration Time Setup Window” on page 2-50.
Advanced
This button opens a window used to set the other functions of the measurement
channel. See “Advanced Setup Window” on page 2-53.
SPGU Pulse /
ALWG Setup
This button opens a window used to set the SPGU output. See “SPGU Pulse Setup
Window” on page 2-63 or “SPGU ALWG Setup Window” on page 2-67.
2- 8
Agilent EasyEXPERT User’s Guide Vol. 1, Edition 1
Classic Test Definition
Multi Channel I/V Sweep
Multi Channel I/V Sweep
On the EasyEXPERT main screen, click the Classic Test tab and select the Multi
Channel I/V Sweep icon. The main screen displays the Multi Channel I/V Sweep
test setup screen. For the measurement mode, see “Multi Channel I/V Sweep
Measurement” on page 4-12.
Setup Name
Sets the name of the test setup. The name is used to identify the test setup saved to a
My Favorite group (preset group). Enter a unique name that is distinct from other
setup.
The name is recorded in the test result data and is used to differentiate the data in the
test record list area.
Channel Setup
This tab displays the Channel Setup screen. See “Channel Setup” on page 2-10.
Measurement
Setup
This tab displays the Measurement Setup screen. See “Measurement Setup” on page
2-11.
Function Setup
This tab displays the Function Setup screen. See “Function Setup” on page 2-42.
Auto Analysis
Setup
This tab displays the Auto Analysis Setup screen. See “Auto Analysis Setup” on
page 2-43.
Display Setup
This tab displays the Display Setup screen. See “Display Setup” on page 2-46.
NOTE
Setting of the Display Setup is applied to the X-Y Graph on the Data Display
window. And the X-Y Graph can handle one X data for the X axis and the maximum
eight Y data for the Y axis.
Define the X axis carefully to plot the Multi Channel I/V Sweep measurement result
which may have the data measured by the multiple VAR1 channels. Because the
result may also contain the multiple X data which can be the selections of the X
axis.
The Display Setup must be set properly to match the X axis data and the X data of
the plot you look at.
Agilent EasyEXPERT User’s Guide Vol. 1, Edition 1
2- 9
Classic Test Definition
Multi Channel I/V Sweep
Channel Setup
This setup screen is used to define the channel setups and the variables for the
channel output data, measurement data, time stamp data, and index data.
Channel Definition This area defines the channel setups and the variables for the channel output data
and the measurement data.
Unit
Measurement resource used for the source output or
measurement
V Name
Variable name of voltage output or measurement data
I Name
Variable name of current output or measurement data
Mode
Output mode. For SMU, V (voltage), I (current), VPULSE
(voltage pulse), IPULSE (current pulse), or COMMON
(ground). For SPGU, VPULSE (voltage pulse) or ALWG
(arbitrary linear waveform voltage).
Function
Output function, VAR1 (primary sweep), VAR2 (secondary
sweep), or CONST (constant)
Add SMU
Adds a row for the SMU channel setup.
Add SPGU
Adds a row for the SPGU channel setup.
Delete
Deletes selected channel setup. To select a channel, use the
radio button on the left.
Up
Moves the selected channel setup upward.
Down
Moves the selected channel setup downward.
If multiple output channels are defined, the channels start output sequentially. The
order is top to bottom of the channels defined in this screen. The output stops in the
opposite order.
Miscellaneous
Variables
This area defines the variables for the time stamp data and the index data.
Time Stamp Name
Variable name of the time stamp. Time stamp data indicates
the time at which step measurement was started.
Index Name
Variable name of the data index. Integer above 0 is returned.
2- 10
Agilent EasyEXPERT User’s Guide Vol. 1, Edition 1
Classic Test Definition
Multi Channel I/V Sweep
Measurement Setup
This setup screen is used to set the source channel outputs, the measurement ranging
mode, the sweep abort condition, the measurement channel A/D converter, the
series resistor, the filter, and the source output/measurement wait time.
VAR1
Constants
VAR2
This area defines the primary sweep source output.
Direction
Sweep direction, single (start to stop) or double (start to stop to
start)
Linear/Log
Sweep output, LINEAR, LOG10, LOG25, or LOG50 where the
number following LOG indicates the number of sweep points in
one decade.
No of Step
Number of sweep steps
Unit
SMU used for the VAR1 output
Name
Variable name for the VAR1 output data
Start
Sweep start value
Stop
Sweep stop value
Compliance
Compliance value. Enter the current limit value for the voltage
source, or the voltage limit value for the current source.
Pwr Comp
Power compliance value (in W), or OFF
This area defines the constant output source.
Unit
SMU used for the constant source
V Name
Variable name for the constant voltage output or measurement
data
I Name
Variable name for the constant current output or measurement
data
Mode
Output mode, V (voltage) or I (current)
Source
Output value
Compliance
Compliance value. Enter the current limit value for the voltage
source, or the voltage limit value for the current source.
This area defines the secondary sweep source output.
Unit
SMU used for the VAR2 output
Agilent EasyEXPERT User’s Guide Vol. 1, Edition 1
2- 11
Classic Test Definition
Multi Channel I/V Sweep
Timing
Name
Variable name for the VAR2 output data
Start
Sweep start value
Stop
Sweep stop value. The value is automatically calculated from
the start, step, and number of step values.
Step
Incremental step value for the sweep output
No of Step
Number of sweep steps
Compliance
Compliance value. Enter the current limit value for the voltage
source, or the voltage limit value for the current source.
Pwr Comp
Power compliance value (in W), or OFF
This area defines the hold time and the delay time. See “To Specify Source Output
Time” on page 4-67.
Hold
Hold time. This is the time between the beginning of channel
output and the beginning of delay time. 0 to 655.35 s, 10 ms
resolution.
Delay
Delay time. This is the time between the end of the hold time
and the beginning of measurement. The measurement channels
start measurement as soon as the wait time elapses. 0 to 65.535
s, 0.1 ms resolution.
Sweep status
This field specifies the sweep abort condition. See “Sweep Abort Function” on page
4-37.
Range
This button opens a window for setting measurement ranging operation. See “SMU
Range Setup Window” on page 2-48.
ADC/Integ
This button opens a window for setting the A/D converter of the measurement
channels. See “ADC and Integration Time Setup Window” on page 2-50.
Pulse
This button opens a window for setting the SMU pulse output. See “Pulse Setup
Window” on page 2-51.
Advanced
This button opens a window for setting other functions of the measurement channel.
See “Advanced Setup Window” on page 2-53.
SPGU Pulse /
ALWG Setup
This button opens a window used to set the SPGU output. See “SPGU Pulse Setup
Window” on page 2-63 or “SPGU ALWG Setup Window” on page 2-67.
2- 12
Agilent EasyEXPERT User’s Guide Vol. 1, Edition 1
Classic Test Definition
I/V List Sweep
I/V List Sweep
On the EasyEXPERT main screen, click the Classic Test tab and select the I/V
Sweep icon. The main screen displays the I/V List sweep test setup screen.
I/V List Sweep measurement is similar to I/V Sweep measurement described in “I/V
Sweep Measurement” on page 4-3.
Changes from the I/V Sweep are listed below.
Setup Name
•
VAR1/VAR2 step output values are set by using a vector data. Vector data from
a spreadsheet software, either tab separated or comma separated can be copied to
the Define vector data dialog box via the Windows clipboard. See “Define
vector data” on page 2-18.
•
All SMU installed in the B1500 can be set to VAR1.
•
VAR1’ is not supported.
Sets the name of the test setup. The name is used to identify the test setup saved to a
My Favorite group (preset group). Enter a unique name that is distinct from other
setup.
The name is recorded in the test result data and is used to differentiate the data in the
test record list area.
Channel Setup
This tab displays the Channel Setup screen. See “Channel Setup” on page 2-5.
Measurement
Setup
This tab displays the Measurement Setup screen. See “Measurement Setup” on page
2-6.
Function Setup
This tab displays the Function Setup screen. See “Function Setup” on page 2-42.
Auto Analysis
Setup
This tab displays the Auto Analysis Setup screen. See “Auto Analysis Setup” on
page 2-43.
Display Setup
This tab displays the Display Setup screen. See “Display Setup” on page 2-46.
Agilent EasyEXPERT User’s Guide Vol. 1, Edition 1
2- 13
Classic Test Definition
I/V List Sweep
Channel Setup
This setup screen is used to define the channel setups and the variables for the
channel output data, the measurement data, the time stamp data, and the index data.
Channel Definition This area defines the channel setups and the variables for the channel output data
and the measurement data.
Unit
Measurement resource used for the source output or
measurement
V Name
Variable name of voltage output or measurement data
I Name
Variable name of current output or measurement data
Mode
Output mode. For SMU, V (voltage), I (current), VPULSE
(voltage pulse), IPULSE (current pulse), or COMMON
(ground). For SPGU, VPULSE (voltage pulse) or ALWG
(arbitrary linear waveform voltage).
Function
Output function, VAR1 (primary sweep), VAR2 (secondary
sweep), or CONST (constant).
If a SMU is set to Mode=VPULSE or IPULSE:
•
Number of VAR1 channels must be one or two.
•
If a VAR1 channel is set to Mode=VPULSE, the other
VAR1 channel must be Mode=V.
•
If a VAR1 channel is set to Mode=IPULSE, the other VAR1
channel must be Mode=I.
Add SMU
Adds a row for the SMU channel setup.
Add SPGU
Adds a row for the SPGU channel setup.
Delete
Deletes the selected channel setup. To select a channel setup,
use the radio button on the left.
Up
Moves the selected channel setup upward.
Down
Moves the selected channel setup downward.
If multiple output channels are defined, the channels start output sequentially. The
order is top to bottom of the channels defined in this screen. The output stops in the
opposite order.
2- 14
Agilent EasyEXPERT User’s Guide Vol. 1, Edition 1
Classic Test Definition
I/V List Sweep
Miscellaneous
Variables
This area defines the variables for the time stamp data and the index data.
Time Stamp Name
Variable name of the time stamp. Time stamp data indicates
the time at which step measurement was started.
Index Name
Variable name of the data index. Integer above 0 is returned.
Measurement Setup
This setup screen is used to set the source channel outputs, the measurement ranging
mode, the sweep abort condition, the measurement channel A/D converter, the
series resistor, the filter, and the source output/measurement wait time.
VAR1
NOTE
This area defines the primary sweep source output.
Unit
SMU used for the VAR1 output
Source
Click the grid button to open the Define vector data dialog box.
See “Define vector data” on page 2-18.
Compliance
Compliance value. Enter the current limit value for the voltage
source, or the voltage limit value for the current source.
Pwr Comp
Power compliance value (in W), or OFF
To define VAR1/VAR2 step outputs
To define these parameters, create a vector data by using the Define vector data
dialog box which is opened by clicking the grid button in the vector data entry field.
See Figure 2-1.
Available array size for the vector data is as follows (column row).
•
VAR1 step output value: N1 = 1 1001 maximum (initial setting: 1 1)
•
VAR2 step output value: N2 = 1 1001 maximum (initial setting: 1 1)
•
Delay time: N3 = 1 1001 maximum (initial setting: 1 1)
Then, the following formula must be satisfied.
1 N1 N2 128128
Agilent EasyEXPERT User’s Guide Vol. 1, Edition 1
2- 15
Classic Test Definition
I/V List Sweep
VAR2
Timing
SMU Pulse
This area defines the secondary sweep source output.
Unit
SMU used for the VAR2 output
Name
Variable name for the VAR2 output data
Source
Click the grid button to open the Define vector data dialog box.
See “Define vector data” on page 2-18.
Compliance
Compliance value. Enter the current limit value for the voltage
source, or the voltage limit value for the current source.
Pwr Comp
Power compliance value (in W), or OFF
This area defines the hold time and the delay time. See “To Specify Source Output
Time” on page 4-67.
Hold
Hold time. This is the time from the beginning of channel
output to the beginning of delay time. 0 to 655.35 s, 10 ms
resolution.
Delay
Delay time. This is the time between end of step changing and
the beginning of measurement. For the first step, this is the time
between the end of hold time and the beginning of
measurement. The measurement channels start measurement as
soon as the wait time elapses. 0 to 65.535 s, 0.1 ms
resolution.Click the grid button to open the Define vector data
dialog box. See “Define vector data” on page 2-18.
This area defines the SMU pulse setup parameters. See “SMU Pulse” on page 4-62.
Unit
SMU used for the pulse output
Period
Pulse period. Cannot set this value. SMU applies the pulse after
the delay time immediately.
Width
Pulse width
Base
Pulse base value
2- 16
Agilent EasyEXPERT User’s Guide Vol. 1, Edition 1
Classic Test Definition
I/V List Sweep
Constant
This area defines the constant output source.
Unit
SMU used for the constant source
V Name
Variable name for the constant voltage output or measurement
data
I Name
Variable name for the constant current output or measurement
data
Mode
Output mode, V (voltage), I (current), VPULSE (voltage pulse),
or IPULSE (current pulse)
Source
Output value
Compliance
Compliance value. Enter the current limit value for the voltage
source, or the voltage limit value for the current source.
Sweep status
This field specifies the sweep abort condition. See “Sweep Abort Function” on page
4-37.
Range
This button opens a window for setting the measurement ranging operation. See
“SMU Range Setup Window” on page 2-48.
ADC/Integ
This button opens a window for setting the A/D converter of the measurement
channels. See “ADC and Integration Time Setup Window” on page 2-50.
Advanced
This button opens a window for setting other functions of the measurement channel.
See “Advanced Setup Window” on page 2-53.
SPGU Pulse /
ALWG Setup
This button opens a window used to set the SPGU output. See “SPGU Pulse Setup
Window” on page 2-63 or “SPGU ALWG Setup Window” on page 2-67.
Agilent EasyEXPERT User’s Guide Vol. 1, Edition 1
2- 17
Classic Test Definition
I/V List Sweep
Define vector data
This dialog box is opened by clicking the grid button in the vector data entry field.
See Figure 2-1. The vector data entry field can be displayed on the followings.
•
Application test setup screen which contains the entry field for a vector type test
parameter, on the EasyEXPERT main screen or the Test Definition window
•
Test Specification setup screen which contains the definition of a vector type test
parameter, on the Test Definition window
•
Define symbols dialog box for a vector type test parameter
The Define vector data dialog box displays the array defined by using the Define
dimensions dialog box opened from the Test Specification setup screen. Figure 2-1
shows the array created by setting Dim1Min=1, Dim1Max=11, Dim2Min=1, and
Dim2Max=3, where Dim1 is the vertical direction (row) and Dim2 is the horizontal
direction (columns). The array index always starts from 1.
Figure 2-1
Vector Data Entry Field
Grid button
Vector data entry field
Define vector data
NOTE
Rotary knob and mouse wheel can be used to change the numeric value in the
highlighted cell.
To delete column/row, highlight the line and press the Delete key.
2- 18
Agilent EasyEXPERT User’s Guide Vol. 1, Edition 1
Classic Test Definition
I/V List Sweep
The Define vector data dialog box provides the following GUI.
OK button
Saves the vector data displayed on the dialog box and closes the dialog box.
Cancel button
Displays a confirmation message and closes the dialog box. Vector data is not saved.
File menu
Provides the following function.
Exit
Edit menu
Mouse menu 1
Mouse menu 2
Displays a confirmation message and closes the dialog box.
Vector data is not saved.
Provides the following four functions.
Copy
Copies the highlighted item to the clipboard.
Paste
Pastes the data in the clipboard to the specified location.
Delete
Deletes the highlighted item.
Select All
Selects and highlights all cells in the array.
The following menus are displayed when the right mouse button is clicked on a cell.
Cut
Moves the highlighted characters to the clipboard.
Copy
Copies the highlighted characters to the clipboard.
Paste
Pastes the data in the clipboard to the specified location.
The following menus are displayed when the right mouse button is clicked on the
array display area.
Copy
Copies the highlighted item to the clipboard.
Paste
Pastes the data in the clipboard to the specified location.
Insert
Inserts a row before the selected row. Available when the row
header provides the * button and a row header is selected.
Delete
Deletes the highlighted item.
Select All
Selects and highlights all cells in the array.
Agilent EasyEXPERT User’s Guide Vol. 1, Edition 1
2- 19
Classic Test Definition
I/V List Sweep
To import vector
data
The Define vector data dialog box can import comma separated data (each data must
be separated by a comma, and have a CR/LF or LF at the end of each line) and tab
separated data (each data must be separated by a tab, and have a CR/LF or LF at the
end of each line). The procedure for importing vector data is as follows.
1. Open a vector data with Notepad.
2. Copy the data in Notepad.
3. On the Define vector data dialog box, click a cell to be used as the top left corner
of the imported vector data.
4. Right click on the corner box between the column header and the row header,
and select Paste.
Thus, the Define vector data dialog box can read vector data created on a
spreadsheet software.
To export vector
data
The Define vector data dialog box can export vector data in tab separated format.
The procedure for exporting vector data is as follows.
1. Highlight a vector data on the Define vector data dialog box.
2. Select Copy from the Edit menu or the mouse menu 2.
3. Create a new file in Notepad, and paste the vector data.
4. Save the data as a file.
The data can then be read by opening the file with a spreadsheet software.
2- 20
Agilent EasyEXPERT User’s Guide Vol. 1, Edition 1
Classic Test Definition
I/V-t Sampling
I/V-t Sampling
On the EasyEXPERT main screen, click the Classic Test tab and select the I/V-t
Sampling icon. The main screen displays the I/V-t sampling test setup screen. For
details of the measurement mode, see “I/V-t Sampling Measurement” on page 4-13.
Setup Name
Used to set the name of test setup. The name must be the identification for the test
setup saved to a My Favorite group (preset group). Enter a unique name that is
distinct from other setup.
The name is recorded in the test result data and is used to differentiate the data in the
test record list area.
Channel Setup
This tab displays the Channel Setup screen. See “Channel Setup” on page 2-22.
Measurement
Setup
This tab displays the Measurement Setup screen. See “Measurement Setup” on page
2-23.
Function Setup
This tab displays the Function Setup screen. See “Function Setup” on page 2-42.
Auto Analysis
Setup
This tab displays the Auto Analysis Setup screen. See “Auto Analysis Setup” on
page 2-43.
Display Setup
This tab displays the Display Setup screen. See “Display Setup” on page 2-46.
NOTE
If you set Interval < 0.002 s
Sampling mode must be linear. This setting is not permitted for the log sampling.
Also SPGU is not available.
The following conditions are automatically set to the all measurement channels.
And the all channels start measurement simultaneously. After the measurement,
they are returned to the previous conditions automatically.
•
High speed A/D converter (ADC)
•
Minimum measurement range that covers compliance value, fixed ranging
If the measurement time is expected to be longer than interval, the measurement
channels automatically adjust the number of averaging samples (ADC settings) to
keep the sampling interval. After the measurement, it is returned to the previous
setting automatically.
Agilent EasyEXPERT User’s Guide Vol. 1, Edition 1
2- 21
Classic Test Definition
I/V-t Sampling
Channel Setup
This setup screen is used to define the channel setups and the variables for the
channel output data, measurement data, time stamp data, and index data.
Channel Definition This area defines the channel setups and the variables for the channel output data
and the measurement data.
NOTE
UHCU and HVMCU cannot be used.
Unit
Measurement resource used for the source output or
measurement
V Name
Variable name of voltage output or measurement data
I Name
Variable name of current output or measurement data
Mode
Output mode. For SMU, V (voltage), I (current), or COMMON
(ground). For SPGU, VPULSE (voltage pulse) or ALWG
(arbitrary linear waveform voltage).
Add SMU
Adds a row for the SMU channel setup.
Add SPGU
Adds a row for the SPGU channel setup.
Delete
Deletes the channel setup. To select the channel setup, use the
left radio button.
Up
Moves the selected channel setup upward.
Down
Moves the selected channel setup downward.
If multiple output channels are defined, the channels start output sequentially. The
order is top to bottom of the channels defined in this screen. The output stops in the
opposite order. However, if the Output Sequence is SIMULTANEOUS, the channels
start and stop output simultaneously.
Miscellaneous
Variables
This area defines the variables for the time stamp data and the index data.
Time Stamp Name
Variable name of the time stamp. Time stamp data gives the
time when step measurement is started.
Index Name
Variable name of the data index. Integer above 0 is returned.
2- 22
Agilent EasyEXPERT User’s Guide Vol. 1, Edition 1
Classic Test Definition
I/V-t Sampling
Measurement Setup
This setup screen is used to set the sampling timing parameters, constant
voltage/current outputs, and so on.
Sampling
Parameter
This area defines the sampling timing parameters.
Linear/Log
Sampling mode. LINEAR for linear sampling. LOG10,
LOG25, LOG50, LOG100, LOG250, or LOG500 for
logarithmic sampling.
For the logarithmic sampling, the number after LOG indicates
the number of measurement data in a decade. For example,
LOG10 mode is used to get 10 data/decade.
Interval
Interval of the sampling, in seconds. 0.002 to 65.535 s, 0.001 s
resolution.
Interval < 0.002 s in 0.00001 s resolution is also available for
the linear sampling. It must satisfy the following formula. See
NOTE on page 2-21.
Interval 0.0001 + 0.00002 (number of measurement
channels-1)
No of Samples
Number of samples. Integer. 1 to the following value.
For linear: 100001 / (number of measurement channels)
For logarithmic: 1 + (number of data for 11 decades)
Total Sampling
Time
This field just displays the total sampling time that is the time
from the measurement start time for the first point to the end of
sampling measurement. It does not include the hold time.
Total Sampling Time = Interval No of Samples
Output Sequence Source output sequence. SIMULTANEOUS or SEQUENTIAL.
See “Source Output Sequence and Time Origin” on page 4-18.
Hold Time
Time since the Source value output until the first sampling
point, in seconds. 0 to 655.35 s, resolution 0.01 s.
The following values are also available for Interval < 0.002 s.
|Hold Time| will be the time since the sampling start until the
Source value output.
-0.09 to -0.0001 s, resolution 0.0001 s.
Agilent EasyEXPERT User’s Guide Vol. 1, Edition 1
2- 23
Classic Test Definition
I/V-t Sampling
Base Hold Time
Stop Condition
Hold time of the Base value output until the Source value
output, in seconds. 0 to 655.35 s, resolution 0.01 s.
This area defines the sampling measurement stop condition. See “Stop Condition”
on page 4-18 for this function.
Enable/Disable
Enables or disables the stop condition.
Enable Delay
Delay time. in second. This is the time from starting sampling
measurement to enabling this function.
Name
Name of measurement data or user function to monitor for stop
condition. Val of Event.
Cannot use the user function that uses the following built-in
functions.
at, avg, cond, dim1Size, dim2Size, integ, mavg, max, min,
storeAt
Threshold
Threshold value at which to stop sampling measurement.
Th of Event.
Event
Event for stop condition.
No. of Events
Constants
Val > Th
True if Name parameter value is greater
than Threshold value.
Val < Th
True if Name parameter value is less than
Threshold value.
|Val| > |Th|
True if absolute Name parameter value is
greater than absolute Threshold value.
|Val| < |Th|
True if absolute Name parameter value is
less than absolute Threshold value.
Target value of the count the event occurs (true). When the
count of true is this value, sampling is immediately stopped.
This area defines the constant voltage/current source.
Unit
SMU used for the constant source
V Name
Variable name for the constant voltage output or measurement
data
I Name
Variable name for the constant current output or measurement
data
2- 24
Agilent EasyEXPERT User’s Guide Vol. 1, Edition 1
Classic Test Definition
I/V-t Sampling
Mode
Output mode, V (voltage), or I (current)
Base, Source
Base or Source value, in V or A.
Base value is available for all output channels for the
SIMULTANEOUS mode and the last source channel for the
SEQUENTIAL mode.
Compliance
Compliance value, in A or V.
Range
This button opens a window used to set the measurement ranging operation. See
“SMU Range Setup Window” on page 2-48.
ADC/Integ
This button opens a window used to set the A/D converter of the measurement
channels. See “ADC and Integration Time Setup Window” on page 2-50.
Advanced
This button opens a window used to set the other functions of the measurement
channel. See “Advanced Setup Window” on page 2-53.
SPGU Pulse /
ALWG Setup
This button opens a window used to set the SPGU output. See “SPGU Pulse Setup
Window” on page 2-63 or “SPGU ALWG Setup Window” on page 2-67.
SPGU cannot be used for the sampling measurement of Interval < 0.002 s.
Agilent EasyEXPERT User’s Guide Vol. 1, Edition 1
2- 25
Classic Test Definition
C-V Sweep
C-V Sweep
On the EasyEXPERT main screen, click the Classic Test tab and select the C-V
Sweep icon. The main screen displays the C-V sweep test setup screen.
For details of the measurement mode, see “C-V Sweep Measurement” on page 4-19.
Setup Name
Used to set the name of test setup. The name must be the identification for the test
setup saved to a My Favorite group (preset group). Enter a unique name that is
distinct from other setup.
The name is recorded in the test result data and is used to differentiate the data in the
test record list area.
Channel Setup
This tab displays the Channel Setup screen. See “Channel Setup” on page 2-27.
Measurement
Setup
This tab displays the Measurement Setup screen. See “Measurement Setup” on page
2-28.
Function Setup
This tab displays the Function Setup screen. See “Function Setup” on page 2-42.
Auto Analysis
Setup
This tab displays the Auto Analysis Setup screen. See “Auto Analysis Setup” on
page 2-43.
Display Setup
This tab displays the Display Setup screen. See “Display Setup” on page 2-46.
NOTE
Error Correction
Error correction must be performed before starting measurements. See “CMU
Calibration” on page 1-60 that explains the error correction GUI. There are four
techniques. For the easy way, perform the phase compensation and the open
correction.
2- 26
Agilent EasyEXPERT User’s Guide Vol. 1, Edition 1
Classic Test Definition
C-V Sweep
Channel Setup
This setup screen is used to define the channel setups and the variables for the
channel output data, time stamp data, and index data.
Channel Definition This area defines the channel setups and the variables for the channel output data.
NOTE
UHCU and HVMCU cannot be used.
Unit
Measurement resource used for the source output or
measurement
V Name
Variable name of voltage output or measurement data
I Name
Variable name of current output or measurement data
Mode
SMU output mode, V (voltage), I (current), or COMMON
(ground)
Function
Output function, VAR1 (primary sweep) or CONST (constant)
Add
Adds a row for the channel setup.
Delete
Deletes the channel setup. To select the channel setup, use the
left radio button.
Up
Moves the selected channel setup upward.
Down
Moves the selected channel setup downward.
If multiple output channels are defined, the channels start output sequentially. The
order is top to bottom of the channels defined in this screen. However the last output
channel is always the MFCMU. The output stops in the opposite order.
Miscellaneous
Variables
This area defines the variables for the time stamp data and the index data.
Time Stamp Name
Variable name of the time stamp. Time stamp data gives the
time when step measurement is started.
Index Name
Variable name of the data index. Integer above 0 is returned.
Agilent EasyEXPERT User’s Guide Vol. 1, Edition 1
2- 27
Classic Test Definition
C-V Sweep
Measurement Setup
This setup screen is used to set the MFCMU measurement mode, source channel
outputs, the sweep abort condition, and the measurement time.
C-V (VAR1)
Signal Source
This area defines the MFCMU measurement mode and DC bias output.
V Name
Variable name of the DC bias output data
Model
MFCMU measurement mode. Primary and secondary
measurement parameters. See Table 4-2 on page 4-21. Select
one from the pull-down menu.
para1 Name
Variable name of the primary measurement parameter
para2 Name
Variable name of the secondary measurement parameter
Direction
Sweep direction, single (start to stop) or double (start to stop to
start)
Linear/Log
Sweep output, LINEAR, LOG10, LOG25, or LOG50. where
the number following LOG means the number of sweep points
in one decade.
Start
Sweep start value
Stop
Sweep stop value
Step
Incremental step value of the sweep output
Compliance
Only for SMU. Compliance value. Enter the current limit value
for the voltage source, or the voltage limit value for the current
source.
No of Step
Number of steps. The value is automatically calculated by using
the start, stop, and step values.
This area defines the measurement signal.
Frequency List
Frequency of the measurement signal
F Name
Variable name of the frequency data
AC Level
Oscillator level of the measurement signal, 10 mV to 250 mV, 1
mV resolution
Add
Adds a measurement frequency.
Delete
Deletes the selected frequency. To select the frequency, use the
left radio button.
2- 28
Agilent EasyEXPERT User’s Guide Vol. 1, Edition 1
Classic Test Definition
C-V Sweep
Integration Time
Timing
Constant
Up
Moves the selected frequency upward.
Down
Moves the selected frequency downward.
This area sets the A/D converter of MFCMU.
Mode
A/D converter operation mode, AUTO or PLC
Factor
Factor for the initial value. See “Mode, Factor” on page 4-20.
This area defines the hold time and the delay time. See “To Specify Source Output
Time” on page 4-67.
Hold
Hold time. This is the time from beginning of channel output to
beginning of delay time. 0 to 655.35 s, 10 ms resolution.
Delay
Hold time. This is the time from end of hold time to beginning
of measurement. The MFCMU starts measurement as soon as
the wait time elapses. 0 to 655.35 s, 0.1 ms resolution.
This area defines the constant voltage/current source.
Unit
SMU used for the constant source
V Name
Variable name for constant voltage output or measurement data
I Name
Variable name for constant current output or measurement data
Mode
Output mode, V (voltage), I (current), or COMMON (ground).
Source
Output value
Compliance
Compliance value. Enter the current limit value for the voltage
source, or the voltage limit value for the current source.
Sweep status
This field specifies the sweep abort condition. See “Sweep Abort Function” on page
4-37.
Range
This button opens a window used to set the measurement ranging operation. See
“Range Setup Window” on page 2-55.
ADC/Integ
This button opens a window used to set the A/D converter of the SMU measurement
channels. See “ADC and Integration Time Setup Window” on page 2-50.
Advanced
This button opens a window used to set the other functions of the measurement
channel. See “Advanced Setup Window for C-V Sweep” on page 2-57.
Agilent EasyEXPERT User’s Guide Vol. 1, Edition 1
2- 29
Classic Test Definition
Direct Control
Direct Control
On the EasyEXPERT main screen, click the Classic Test tab and select the Direct
Control icon. The main screen displays the Direct Control test setup screen.
Direct Control test mode performs measurement by controlling measurement
resources, SMU, CMU, and SPGU directly. The instrument can be controlled by
using GPIB commands. For the GPIB commands, see Agilent B1500 Programming
Guide.
Available GPIB commands are listed in the Command pull-down menu on the
Measurement Setup screen. Other commands are not supported by the Direct
Control test.
Setup Name
Sets the name of the test setup. The name is used to identify the test setup saved to a
My Favorite group (preset group). Enter a unique name that is distinct from other
setup.
The name is recorded in the test result data and is used to differentiate the data in the
test record list area.
Channel Setup
This tab displays the Channel Setup screen. See “Channel Setup” on page 2-31.
Measurement
Setup
This tab displays the Measurement Setup screen. See “Measurement Setup” on page
2-33.
Function Setup
This tab displays the Function Setup screen. See “Function Setup” on page 2-42.
If Agilent B2200A/B2201A/E5250A switching matrix is used, the CMU
measurement data should be compensated. To perform the compensation, define a
user function by using the “compenReZ” and “compenImZ” functions or the
“compenReY” and “compenImY” functions.
Auto Analysis
Setup
This tab displays the Auto Analysis Setup screen. See “Auto Analysis Setup” on
page 2-43.
Display Setup
This tab displays the Display Setup screen. See “Display Setup” on page 2-46.
2- 30
Agilent EasyEXPERT User’s Guide Vol. 1, Edition 1
Classic Test Definition
Direct Control
Channel Setup
This setup screen is used to define the channel setups and the variables for the
channel output data, measurement data, time stamp data, and index data.
Channel Definition This area defines the channel setups and the variables for the channel output data
and the measurement data.
Additional Data
Variables
Miscellaneous
Variables
Unit
Measurement resource used for the source output or
measurement
V Name
Variable name of DC voltage output or measurement data
I Name
Variable name of DC current output or measurement data
Add SMU
Adds a row for the SMU channel setup.
Add CMU
Adds a row for the CMU channel setup.
Add SPGU
Adds a row for the SPGU channel setup.
Delete
Deletes the selected channel setup. To select a channel setup,
use the radio button on the left.
Up
Moves the selected channel setup upward.
Down
Moves the selected channel setup downward.
This area defines the variables for the measurement data other than DC voltage and
DC current which can be defined in Channel Definition.
Unit
Unit (SMU or CMU) used for the measurement
Type
Type of measurement data. See Table 2-1.
Name
Variable name of the measurement data
Add
Adds a row for the measurement variable.
Delete
Deletes the selected measurement variable. To select a variable,
use the radio button on the left.
This area defines the variables for the time stamp data and the index data.
Time Stamp Name
Variable name of the time stamp. Time stamp data indicates
the time at which step measurement was started.
Index Name
Variable name of the data index. Integer above 0 is returned.
Agilent EasyEXPERT User’s Guide Vol. 1, Edition 1
2- 31
Classic Test Definition
Direct Control
Table 2-1
Available Type Values for Measurement Data Variables
Type
Description
SMU Quasi-Static C
SMU capacitance measurement data (F)
CMU Re(Z)
CMU resistance measurement data ()
CMU Im(Z)
CMU reactance measurement data ()
CMU Re(Y)
CMU conductance measurement data (S)
CMU IM(Y)
CMU susceptance measurement data (S)
CMU Frequency
CMU output signal frequency data (Hz)
CMU AC Level Output Data
CMU oscillator level output data (Vac)
CMU DC Bias Monitor Data
CMU DC bias monitor data (Vdc)
CMU AC Level Monitor Data
CMU oscillator level monitor data (Vac)
2- 32
Agilent EasyEXPERT User’s Guide Vol. 1, Edition 1
Classic Test Definition
Direct Control
Measurement Setup
This setup screen is used to define GPIB commands for controlling the SMU and
CMU directly, and is used to set the SMU series resistor, the SMU filter, and the bias
hold function.
Advanced
This button opens a window for setting the SMU series resistor, the SMU filter, and
the bias hold function. See “Advanced Setup” on page 2-34.
Command Setup
This area defines GPIB commands for controlling the SMU and CMU directly.
Command
Select the command or function from the pull-down menu. See
“Command Setup” on page 2-36.
Arguments
Enter the command parameter. To enter multiple parameters,
insert a comma (,) between parameters. Multiple spaces can be
inserted before and after the comma.
All parameters should be entered. If an optional parameter is
abbreviated, the initial value may be set, the last used value may
be reused, or no value may be set. The result is unique and
depends on the command. For a description of each command,
see Agilent B1500 Programming Guide.
The parameter can be a numeric variable or a numeric
expression with fundamental arithmetic operations.
In an application test definition, the parameter can be a numeric
type test parameters, device parameters, or Symbol.
If the internal variable is used, it must be used as a string
variable. For example, the variables must be entered as follows.
“%I1”, “%R1”, “%R2”
Ignore
Check this box to comment out this command line.
Add
Adds a row for the command setup.
Delete
Deletes the selected command setup. To select a command
setup, use the radio button on the left.
Up
Moves the selected command setup upward.
Down
Moves the selected command setup downward.
Agilent EasyEXPERT User’s Guide Vol. 1, Edition 1
2- 33
Classic Test Definition
Direct Control
Advanced Setup
This window is opened by clicking the Advanced button on the Direct Control
Measurement Setup screen, and is used to set the SMU series resistor, the SMU
filter, and the bias hold function.
Options
The following setup is available.
Primary Setup
Primary setup ON or OFF.
If Primary Setup=ON, the primary setup is applied to the instrument when the
Direct Control test is started. For the setup condition, see “Primary Setup” on page
2-35.
If Primary Setup=OFF, the primary setup is not applied. Set the Primary Setup to
OFF if a setup exists and is proven to problem-free for running a test with. The test
execution time can be reduced by this setting.
Channel Settings
This area sets the series resistor and the filter.
Unit
SMU used for the measurement
VName
Variable name of voltage output or measurement data
IName
Variable name of current output or measurement data
Series R
Series resistor NONE or 1MOHM. See “SMU Series Resistor”
on page 4-71.
SMU Filter
SMU filter ON or OFF. See “SMU Filter” on page 4-70.
After Measurement This area sets the bias hold function for maintaining the source output after
Setting
measurement. The source applies the specified bias between two consecutive
measurements of a repeated measurement or quick test. See “Bias Hold Function”
on page 4-41.
Bias Hold after Measurement
Semiconductor
Relays (16440A
SMU/PG Selector)
Bias hold function ON or OFF
Effective only for the instrument installed with SPGU or PGU. Agilent 16445A
selector adapter is needed for connecting Agilent 16440A SMU/PGU selector
(B1500A-A04).
This area sets the selector CH1/CH3 status (DEFAULT or PGU OPEN). To use this
function, set the DEFAULT setting to Always SMU or Normally PGU (AUX) by
using the SMU/PG Selector tab screen on the Configuration window before starting
the SPGU output.
CH1
2- 34
CH1 status, DEFAULT or PGU OPEN.
Agilent EasyEXPERT User’s Guide Vol. 1, Edition 1
Classic Test Definition
Direct Control
CH3
CH3 status, DEFAULT or PGU OPEN.
CH1 represents channel 1 on the first selector and CH3 represents channel 1 on the
second selector. See “SMU/PG Selector” on page 4-49 for details on the selector.
Primary Setup
Primary setup is the initial setting set for when the Direct Control test is started. This
setting is different from the initial setting set by the device clear or the *RST
command. The differences are listed below.
•
Data output format
FMT 13, 0 is set.
•
Program memory
Setup is not changed. The last used setting is retained.
•
Internal variables
Setup is not changed. The last used setting is retained.
•
Measurement condition setup commands
Setup is not changed for the following commands. The last used setting is
retained.
MM
WV, WI, WSV, WSI, WNX
PV, PI, PWV, PWI
BDV
QSV, QSO
LGI, LGV, LSI, LSV, LSSI, LSSV
BGI, BGV, BSI, BSV, BSSI, BSSV
FC, WDCV
PDCV, PWDCV
WFC
WACV
MDCV
Agilent EasyEXPERT User’s Guide Vol. 1, Edition 1
2- 35
Classic Test Definition
Direct Control
Command Setup
To define the Command Setup, set a command or a function to the Command field,
and enter the command parameters to the Argument field. Also, be aware of the
following note.
•
FMT command’s first parameter must be 13.
•
Use the Unit value of Channel Setup to specify the channel.
•
Use the ReadDataBuffer function to read measurement data.
•
Program memory number must be within the range of 1 to 1000.
•
SCR command parameter cannot be abbreviated.
•
VAR command’s second parameter must be within the range of 1 to 40. Hence,
internal variables %I1 to %I40 and %R1 to %R40 are available.
A setup example is shown in Table 2-2. This example uses SMU1 to performs
voltage output and current spot measurement.
Table 2-2
Command Setup Example
Command
Arguments
Description
FMT
13, 0
Sets the data output format.
MM
1, SMU1:HP
Sets the measurement mode.
TSC
1
Enables the time data output.
AV
10, 1
Sets the number of averaging.
DV
SMU1:HP, 0, 1.5,
0.1
Forces the DC voltage.
CMM
SMU1:HP, 0
Sets the SMU operation mode.
RI
SMU1:HP, 0
Sets the current measurement range.
TSR
Resets the timer.
XE
Starts the measurement.
ReadDataBuffer
2- 36
1
Reads the measurement data.
Agilent EasyEXPERT User’s Guide Vol. 1, Edition 1
Classic Test Definition
Direct Control
ReadDataBuffer
This function reads the measurement data. The number of data blocks to be read is
specified by the count parameter. If count is abbreviated, this function reads one
data block.
Syntax
ReadDataBuffer [count]
Parameters
count
Number of data blocks or the number of terminators to be read.
A data block is a group of data that ends with a terminator. For
the data output format, see Agilent B1500 Programming Guide.
Example
The following example performs three high speed spot measurements and then
reads three measurement data blocks.
Command
Arguments
Description
TI
1, 0
Measurement channel 1 performs the high
speed spot measurement.
TI
2, 0
Measurement channel 2 performs the high
speed spot measurement.
TI
3, 0
Measurement channel 3 performs the high
speed spot measurement.
ReadDataBuffer
3
Reads three measurement data blocks.
NOTE
The data output buffer is cleared when the Direct Control test is started.
NOTE
If a SMU performs the force side measurement operation and the source data output
is enabled (by the FMT command), the SMU’s source data is deleted and the SMU’s
measurement data is stored instead of the source data. The force side measurement
operation is the SMU operation which performs the voltage force and voltage
measurement or the current force and current measurement.
Agilent EasyEXPERT User’s Guide Vol. 1, Edition 1
2- 37
Classic Test Definition
Direct Control
compenReZ
This built-in function performs compensation on the specified impedance data and
returns the real data for the compensation results.
This function is effective for the CMU measurement data compensation while the
switching matrix is used with the CMU to extend the measurement terminals.
Define the compenReZ and compenImZ functions as the user functions on the
Function Setup screen, so that the compensation is performed while the Direct
Control test is being executed. Also enter the formula to calculate the measurement
parameters. An example definition is shown in Figure 2-2. For the equations, see
“About Impedance Measurements” on page 4-22.
Syntax
compenReZ(frequency,Real,Imaginary)
Parameters
frequency
Measurement frequency. Hz. Numeric scalar or vector data.
For the C-f measurement data, frequency should be a vector
variable that stores multiple frequency values.
Real
CMU Re(Z) measurement result data. . Numeric vector data.
Real should be a vector variable that stores the impedance real
data before compensation.
Imaginary
CMU Im(Z) measurement result data. . Numeric vector data.
Imaginary should be a vector variable that stores the impedance
imaginary data before compensation.
Example
Name
Rcompen
Definition
compenReZ(Freq,ReZ,ImZ)
Rcompen returns the impedance real data for the compensation results.
2- 38
Agilent EasyEXPERT User’s Guide Vol. 1, Edition 1
Classic Test Definition
Direct Control
compenImZ
This built-in function performs compensation on the specified impedance data and
returns the imaginary data for the compensation results.
This function is effective for the CMU measurement data compensation while the
switching matrix is used with the CMU to extend the measurement terminals.
Define the compenReZ and compenImZ functions as the user functions on the
Function Setup screen, so that the compensation is performed while the Direct
Control test is being executed. Also enter the formula to calculate the measurement
parameters. An example definition is shown in Figure 2-2. For the equations, see
“About Impedance Measurements” on page 4-22.
Syntax
compenImZ(frequency,Real,Imaginary)
Parameters
frequency
Measurement frequency. Hz. Numeric scalar or vector data.
For the C-f measurement data, frequency should be a vector
variable that stores multiple frequency values.
Real
CMU Re(Z) measurement result data. . Numeric vector data.
Real should be a vector variable that stores the impedance real
data before compensation.
Imaginary
CMU Im(Z) measurement result data. . Numeric vector data.
Imaginary should be a vector variable that stores the impedance
imaginary data before compensation.
Example
Name
Xcompen
Definition
compenImZ(Freq,ReZ,ImZ)
Xcompen returns the impedance imaginary data for the compensation results.
Agilent EasyEXPERT User’s Guide Vol. 1, Edition 1
2- 39
Classic Test Definition
Direct Control
compenReY
This built-in function performs compensation on the specified admittance data and
returns the real data for the compensation results.
This function is effective for the CMU measurement data compensation while the
switching matrix is used with the CMU to extend the measurement terminals.
Define the compenReY and compenImY functions as the user functions on the
Function Setup screen as shown in Figure 2-2, so that the compensation is
performed while the Direct Control test is being executed. Also enter the formula to
calculate the measurement parameters. For the equations, see “About Impedance
Measurements” on page 4-22. Figure 2-2 defines the following formula to calculate
capacitance.
C=ImY/(2PIFreq)
Syntax
compenReY(frequency,Real,Imaginary)
Parameters
frequency
Measurement frequency. Hz. Numeric scalar or vector data.
For the C-f measurement data, frequency should be a vector
variable that stores multiple frequency values.
Real
CMU Re(Y) measurement result data. S. Numeric vector data.
Real should be a vector variable that stores the admittance real
data before compensation.
Imaginary
CMU Im(Y) measurement result data. S. Numeric vector data.
Imaginary should be a vector variable that stores the admittance
imaginary data before compensation.
Example
Name
Gcompen
Definition
compenReY(Freq,ReY,ImY)
Gcompen returns the admittance real data for the compensation results.
Figure 2-2
Function Setup Example
2- 40
Agilent EasyEXPERT User’s Guide Vol. 1, Edition 1
Classic Test Definition
Direct Control
compenImY
This built-in function performs compensation on the specified admittance data and
returns the imaginary data for the compensation results.
This function is effective for the CMU measurement data compensation while the
switching matrix is used with the CMU to extend the measurement terminals.
Define the compenReY and compenImY functions as the user functions on the
Function Setup screen as shown in Figure 2-2, so that the compensation is
performed while the Direct Control test is being executed. Also enter the formula to
calculate the measurement parameters. For the equations, see “About Impedance
Measurements” on page 4-22. Figure 2-2 defines the following formula to calculate
capacitance.
C=ImY/(2PIFreq)
Syntax
compenImY(frequency,Real,Imaginary)
Parameters
frequency
Measurement frequency. Hz. Numeric scalar or vector data.
For the C-f measurement data, frequency should be a vector
variable that stores multiple frequency values.
Real
CMU Re(Y) measurement result data. S. Numeric vector data.
Real should be a vector variable that stores the admittance real
data before compensation.
Imaginary
CMU Im(Y) measurement result data. S. Numeric vector data.
Imaginary should be a vector variable that stores the admittance
imaginary data before compensation.
Example
Name
Bcompen
Definition
compenImY(Freq,ReY,ImY)
Bcompen returns the admittance imaginary data for the compensation results.
Agilent EasyEXPERT User’s Guide Vol. 1, Edition 1
2- 41
Classic Test Definition
Function Setup
Function Setup
This setup screen is displayed by clicking the Function Setup tab of the I/V Sweep /
Multi Channel I/V Sweep / I/V List Sweep / I/V-t Sampling / C-V Sweep / Direct
Control test setup screen, and is used to set the user function and the analysis
function.
Calculation of the function is automatically performed after measurement. And the
functions defined in the Display Setup screen will be displayed on the Data Display
window. The user functions are available for the X-Y Graph Plot, List Display, and
Parameters area. The analysis functions are available for the Parameters area.
Apply
This button performs calculation of the definition in this screen. If this button is
clicked when the Data Display window associated with this test has been opened,
the display is also updated.
The associated Data Display window will be the Data Display window that displays
the last measurement data or that is recalled at last.
User Function,
Analysis Function
The User/Analysis Function area sets the user/analysis functions effective for the
test. Up to 20 functions can be set. The user function result is referable from the
other user function defined in the following lines. The analysis function result is
referable from the other analysis function defined in the following lines.
Name
Function name
Unit
Unit of the function
Definition
Definition of the function. The following identifiers can be used.
•
Variables for the measurement/output data used in this test
•
Functions defined in the above lines
•
Local variables passed from the application test that calls this
test as a component
•
Built-in functions and global variables
•
Read-out functions (not available for the user functions)
Also see Chapter 5, “Built-in Programming Tool.”
Add, Delete
Adds a function, or deletes the selected function. To select the
function, use the left radio button.
Up, Down
Moves the selected function upward or downward.
2- 42
Agilent EasyEXPERT User’s Guide Vol. 1, Edition 1
Classic Test Definition
Auto Analysis Setup
Auto Analysis Setup
This setup screen is displayed by clicking the Auto Analysis Setup tab of the I/V
Sweep / Multi Channel I/V Sweep / I/V List Sweep / I/V-t Sampling / C-V Sweep /
Direct Control test setup screen, and is used to set the automatic analysis function.
When a measurement finishes, the function automatically draws lines, a marker, or
both on the X-Y Graph of the Data Display window.
You can set up two lines and one marker for the automatic analysis function.
In the Line 1 and Line 2 areas, you can set up the lines to be drawn.
In the Marker area, you can set up the marker.
Apply
This button performs calculation of the definition in this screen. If this button is
clicked when the Data Display window associated with this test has been opened,
the display is also updated.
The associated Data Display window will be the Data Display window that displays
the last measurement data or that is recalled at last.
Interpolation Mode Check this box to enable the interpolation mode. You can position marker between
measurement points.
Line 1, Line 2
This area sets the line 1 or line 2 automatically displayed and moved to the specified
position after the measurement.
Enable
Check this box to enable the line.
Fix
Check this box to fix the line on the graph after the auto
analysis is performed. Remove the check to make the line free.
Type
Select one of the available line types listed below.
Axis
Axis effective for the line. Specify one from Y1 to Y8.
First Point
See the following description for the line you selected.
Second Point
See the following description for the line you selected.
Available line types:
•
“Normal line”: For drawing a line between any two points.
•
“Gradient line”: For drawing a line through any point with a specified gradient.
•
“Tangent line”: For drawing a tangent line to a measurement point.
Agilent EasyEXPERT User’s Guide Vol. 1, Edition 1
2- 43
Classic Test Definition
Auto Analysis Setup
•
Marker
“Regression line”: For drawing a regression line by using the measurement data
included in the area specified by any two points.
This area sets the marker automatically displayed and moved to the specified
position after the measurement.
Enable
Check this box to enable the marker.
Condition
Enter a variable name and a condition expression to specify
where you want the marker to appear.
After
Check this box to enable the additional condition.
Enter a second variable and condition expression. This sets up a
search start condition for finding specified point.
For example, you can specify the following expressions to search for a measurement
point that satisfies the first condition after the second condition is satisfied.
Condition:[DGM]=[MAX(DGM)*0.01] [x] After [DGM]=[MAX(DGM)]
Normal line
The First Point area and the Second Point area are used to specify the points the line
passes through. The following two ways are available to specify the point.
•
X-Y Coordinate
Enter the desired X-Y coordinate values or expressions in the X and Y fields.
•
Data Condition
Enter a variable name and condition expression to specify the point. This is the
same method as specifying the Marker point.
Gradient line
The First Point area is used to specify the point the line passes through. The
following two ways are available to specify the point.
•
X-Y Coordinate
Enter the desired X-Y coordinate values or expressions in the X and Y fields.
•
Data Condition
Enter a variable name and condition expression to specify the point. This is the
same method as specifying the Marker point.
In the Gradient field, enter a gradient value or expression.
2- 44
Agilent EasyEXPERT User’s Guide Vol. 1, Edition 1
Classic Test Definition
Auto Analysis Setup
Tangent line
The First Point area is used to specify the measurement point the tangent line passes
through.
Enter a variable name and condition expression to specify the point. This is the same
method as specifying the Marker point.
Regression line
The First Point area and the Second Point area are used to specify the range of the
measurement data used for the regression calculation. The following two ways are
available to specify the point.
•
X-Y Coordinate
Enter the desired X-Y coordinate values or expressions in the X and Y fields.
•
Data Condition
Enter a variable name and condition expression to specify the point. This is the
same method as specifying the Marker point.
Agilent EasyEXPERT User’s Guide Vol. 1, Edition 1
2- 45
Classic Test Definition
Display Setup
Display Setup
This setup screen is displayed by clicking the Display Setup tab of the I/V Sweep /
Multi Channel I/V Sweep / I/V List Sweep / I/V-t Sampling / C-V Sweep / Direct
Control test setup screen or by checking the Define own Output Parameters box on
the Test Definition window, and is used to set the test result output.
X-Y Graph
Selects the data to be displayed in the X-Y Graph Plot area. The X and Y1 to Y8
axes can be set.
Name
Specifies the parameter for the axis.
Sharing
Specifies the group for sharing the Y axis scale. Select from
Group 1, Group 2, Group 3, Group 4, or None (no grouping).
The Scale, Min, and Max values are shared by the Y axes in the
same group. The scale set by Run Time Auto Scale, Auto Scale,
Zoom in, and/or Zoom out are also shared.
If another layer on the Data Display window contains an X-Y
trace which has the same name for both its grouped Y
parameter and its X parameter, the scaling will also be shared
by this X-Y trace.
List Display,
Parameters
Scale
Scale of the axis, Linear or Log
Min
Minimum value of the axis
Max
Maximum value of the axis
Add
Adds a parameter (or axis).
Delete
Deletes the parameter selected with the radio button on the left.
Up
Moves the selected parameter upward.
Down
Moves the selected parameter downward.
Selects the data displayed in the List Display area or the Parameters area of the Data
Display window. Up to 20 parameters can be set for each area.
parameter
Specifies the parameter for the data output.
Add
Adds a row for the parameter.
Delete
Deletes the selected parameter. To select the parameter, use the
left radio button.
2- 46
Agilent EasyEXPERT User’s Guide Vol. 1, Edition 1
Classic Test Definition
Display Setup
Up
Moves the selected parameter upward.
Down
Moves the selected parameter downward.
Agilent EasyEXPERT User’s Guide Vol. 1, Edition 1
2- 47
Classic Test Definition
SMU Range Setup Window
SMU Range Setup Window
This window is opened by clicking the Range button on the I/V Sweep / Multi
Channel I/V Sweep / I/V List Sweep / I/V-t Sampling Measurement Setup screen,
and is used to set the measurement ranging operation.
For the measurement ranging function, see “SMU Ranging Mode” on page 4-55.
Unit
SMU used for the measurement
Name
Variable name for the measurement data
Mode
Ranging mode, AUTO (auto ranging), LIMITED (limited auto
ranging), or FIXED (fixed range)
Range
Range value. For auto ranging, ignore this field. For limited
auto ranging, the measurement channel never uses ranges less
than the specified range.
Range Change
Rule and Rate
Not available for voltage measurement or fixed ranging. See
also “Enhanced Auto Ranging for Current Measurement” on
page 4-58.
Available Range Change Rule values are BY FULL RANGE,
GO UP AHEAD, and UP AND DOWN AHEAD.
BY FULL RANGE performs normal auto ranging operation.
For the GO UP AHEAD and UP AND DOWN AHEAD rules,
specify the Rate value, 11 to 100, which fixes the boundary of
the ranging. The ranging occurs when the measurement data
goes across the boundary values shown below.
go up boundary = present measurement range Rate / 100
go down boundary = present measurement range Rate / 1000
The go down boundary is available only for the UP AND
DOWN AHEAD rule.
Up
Moves the selected measurement channel setup upward.
Down
Moves the selected measurement channel setup downward.
If multiple measurement channels are defined, the channels perform measurement
sequentially. The order is top to bottom of the channels defined in this screen. For
exceptions and details, see “Multiple Measurement Channels” on page 4-69.
2- 48
Agilent EasyEXPERT User’s Guide Vol. 1, Edition 1
Classic Test Definition
SMU Range Setup Window
NOTE
To use 1 pA range, only for B1500A
The measurement channel connected to the ASU (Atto Sense and Switch Unit)
supports the 1 pA range. To use the 1 pA range, set the 1 pA fixed range or the 1 pA
limited auto ranging.
The B1500A automatically performs the compensation of the data measured by the
1 pA range and returns the compensated data. You can use either the pre-stored
offset data or the pre-measured offset data.
To measure the offset data, perform the self-calibration before starting the
measurement for a DUT. This offset data is temporarily memorized until the
B1500A is turned off.
Agilent EasyEXPERT User’s Guide Vol. 1, Edition 1
2- 49
Classic Test Definition
ADC and Integration Time Setup Window
ADC and Integration Time Setup Window
This window is opened by clicking the ADC/Integ button on the I/V Sweep / Multi
Channel I/V Sweep / I/V List Sweep / I/V-t Sampling / C-V Sweep Measurement
Setup screen, and is used to set the A/D converter of the SMU measurement
channels.
A/D Converter
This area selects the ADC type and enables/disables the auto zero function. See
“Integration Time” on page 4-65.
Unit
SMU used for the measurement
Name
Variable name for the measurement data
ADC
ADC type, HR ADC (high resolution ADC) or HS ADC (high
speed ADC)
HR ADC is not available for MCSMU, HCSMU, and HVSMU.
Also it is not available for the measurements using SMU pulse.
Measurement
Compliance Side only, or both Force and Compliance Sides
Force and Compliance Sides is not available for HRSMU,
MPSMU, and HPSMU.
Integration Time
This area sets the ADC mode and its factor for each ADC type.
Mode
ADC operation mode
AUTO, MANUAL, or PLC for High Resolution ADC
AUTO, MANUAL, PLC, or TIME for High Speed ADC
TIME or PLC for the measurements using SMU pulse.
Pulse Averaging
Count
Factor
Factor value. Factor value of “Integration Time” on page 4-65.
Auto Zero
Auto zero function ON or OFF. Only for the high resolution
ADC. See “ADC Zero Function” on page 4-66.
This area sets the averaging of the pulsed measurement. Not effective for HRSMU,
MPSMU, and HPSMU. The Count value is automatically set to the same value as
the Count value on the Pulse Setup window for using multiple SMU pulse output
channels.
Count
2- 50
Number of pulsed measurements for averaging to get one
measurement data.
Agilent EasyEXPERT User’s Guide Vol. 1, Edition 1
Classic Test Definition
Pulse Setup Window
Pulse Setup Window
This window is opened by clicking the Pulse button on the Multi Channel I/V
Sweep Measurement Setup screen, and is used to set the SMU pulse setup
parameters. For the SMU pulse setup parameters, see “SMU Pulse” on page 4-62.
The followings are the setup parameters for pulse output.
Common
The following parameters are common to the all pulse output channels.
Period
Measurement
Delay Time
Integration Time
Pulse Averaging
Count
Pulse period. Entering AUTO sets the optimum value
automatically.
Delay time from the beginning of the pulse period to the
beginning of the measurement. Entering AUTO sets the
optimum value automatically so that the measurement is
completed when the transition from peak to base is started by
the pulse output channel which starts the transition at first.
The following entry fields are available for setting the high speed ADC. High
resolution ADC is not available for this measurement.
Mode
ADC operation mode, TIME or PLC
Factor
Factor value. Factor value of “Integration Time” on page 4-65.
The following parameter sets the averaging of the pulsed measurement. The Count
value works with the Count value on the ADC and Integration Time Setup window.
The Count value is not effective for HRSMU, MPSMU, and HPSMU.
Count
Pulse Channels
Number of pulsed measurements for averaging to get one
measurement data.
The followings are the pulse setup parameters set to the pulse output channels
individually.
Unit
SMU used for the pulse output
Name
Variable name for the pulse voltage output data or the pulse
current output data
Agilent EasyEXPERT User’s Guide Vol. 1, Edition 1
2- 51
Classic Test Definition
Pulse Setup Window
Pulse Delay Time Delay time from the beginning of the pulse period to the
beginning of the transition from base to peak. This value must
be 0 for HRSMU, MPSMU, and HPSMU.
Width
Pulse width. This value must be the same for HRSMU,
MPSMU, and HPSMU.
Base
Pulse base value
2- 52
Agilent EasyEXPERT User’s Guide Vol. 1, Edition 1
Classic Test Definition
Advanced Setup Window
Advanced Setup Window
This window is opened by clicking the Advanced button on the I/V Sweep / Multi
Channel I/V Sweep / I/V List Sweep / I/V-t Sampling Measurement Setup screen,
and is used to set the following functions of the measurement channel.
Channel Settings
This area sets the series resistor and the filter.
Unit
SMU used for the measurement
VName
Variable name of voltage output or measurement data
IName
Variable name of current output or measurement data
Series R
Series resistor NONE or 1MOHM. See “SMU Series Resistor”
on page 4-71.
SMU series resistor is not available for MCSMU, HCSMU, and
HVSMU.
Wait Time Control
SMU Filter
SMU filter ON or OFF. See “SMU Filter” on page 4-70.
V Compliance
Only for UHCU, UHVU, or HVMCU. Limit value for the
voltage sweep output. The output voltage of the measurement
resource is automatically measured, and the measured voltage is
compared with this limit value. And then, if it exceeds the limit,
the measurement status is set to the compliance status, and the
sweep measurement stops according to the setting in the Sweep
[xxxx] status field on the Measurement Setup screen. Voltage
range and setting resolution depend on the measurement
resource.
This area sets the source output wait time and the measurement wait time. See “Wait
Time” on page 4-68. The Output Wait sets the source output wait time. The
Measurement Wait sets the measurement wait time.
Factor
Factor value. 0 to 10, 0.1 resolution. This is the N value shown
in “Wait Time” on page 4-68.
Agilent EasyEXPERT User’s Guide Vol. 1, Edition 1
2- 53
Classic Test Definition
Advanced Setup Window
After Measurement This area sets the bias hold function used to keep the source output after
Settings
measurement. The source applies the specified bias between a measurement and the
next measurement performed in the repeat measurement or quick test. See “Bias
Hold Function” on page 4-41.
Bias Hold after
Measurement
Bias hold function ON or OFF
Output Value after
Measurement
Source output value after measurement
START (sweep start value), STOP (sweep stop value),
SOURCE (sampling output source value), or BASE (sampling
output base value)
Semiconductor
Relays (16440A
SMU/PG Selector)
Effective only for the instrument installed with SPGU or PGU. Agilent 16445A
selector adapter is needed for connecting Agilent 16440A SMU/PGU selector
(B1500A-A04).
This area sets the selector CH1/CH3 status (DEFAULT or PGU OPEN). To use this
function, set the DEFAULT setting to Always SMU or Normally PGU (AUX) by
using the SMU/PG Selector tab screen on the Configuration window before starting
the SPGU output.
CH1
CH1 status, DEFAULT or PGU OPEN.
CH3
CH3 status, DEFAULT or PGU OPEN.
CH1 represents channel 1 on the first selector and CH3 represents channel 1 on the
second selector. See “SMU/PG Selector” on page 4-49 for details on the selector.
2- 54
Agilent EasyEXPERT User’s Guide Vol. 1, Edition 1
Classic Test Definition
Range Setup Window
Range Setup Window
This window is opened by clicking the Range button on the C-V Sweep
Measurement Setup screen, and is used to set the measurement ranging operation.
CMU Measurement This area sets the CMU measurement ranging operation.
Range
Unit
CMU used for the measurement
Table 2-3
Mode
Ranging mode, AUTO (auto ranging) or FIXED (fixed range).
If Mode=AUTO, the MFCMU automatically searches for and
measures at the range that provides the best resolution.
If Mode=FIXED, the MFCMU measures at the range specified
by the Range field.
Range
Measurement range. This field is effective when Mode=FIXED.
Available measurement ranges depend on the measurement
frequency setting. See Table 2-3.
Available Measurement Ranges
Frequency
Available measurement ranges
200 kHz
50 , 100 , 300 , 1 k, 3 k, 10 k, 30 k, 100 k, 300 k
2 MHz
50 , 100 , 300 , 1 k, 3 k, 10 k, 30 k
5 MHz
50 , 100 , 300 , 1 k, 3 k
SMU Measurement This area sets the SMU measurement ranging operation.
Range
For the measurement ranging function, see “SMU Ranging Mode” on page 4-55.
Unit
SMU used for the measurement
Name
Variable name for the measurement data
Mode
Ranging mode, AUTO (auto ranging), LIMITED (limited auto
ranging), or FIXED (fixed range)
Range
Range value. For auto ranging, ignore this field. For limited
auto ranging, the measurement channel never uses ranges less
than the specified range.
Agilent EasyEXPERT User’s Guide Vol. 1, Edition 1
2- 55
Classic Test Definition
Range Setup Window
Range Change
Rule and Rate
Not available for voltage measurement or fixed ranging. See
also “Enhanced Auto Ranging for Current Measurement” on
page 4-58.
Available Range Change Rule values are BY FULL RANGE,
GO UP AHEAD, and UP AND DOWN AHEAD.
BY FULL RANGE performs normal auto ranging operation.
For the GO UP AHEAD and UP AND DOWN AHEAD rules,
specify the Rate value, 11 to 100, which fixes the boundary of
the ranging. The ranging occurs when the measurement data
goes across the boundary values shown below.
go up boundary = present measurement range Rate / 100
go down boundary = present measurement range Rate / 1000
The go down boundary is available only for the UP AND
DOWN AHEAD rule.
Up
Moves the selected measurement channel setup upward.
Down
Moves the selected measurement channel setup downward.
If multiple measurement channels are defined, the channels perform measurement
sequentially. The order is top to bottom of the channels defined in SMU
Measurement Range. For exceptions and details, see “Multiple Measurement
Channels” on page 4-69.
NOTE
To use 1 pA range, only for B1500A
The measurement channel connected to the ASU (Atto Sense and Switch Unit)
supports the 1 pA range. To use the 1 pA range, set the 1 pA fixed range or the 1 pA
limited auto ranging.
The B1500A automatically performs the compensation of the data measured by the
1 pA range and returns the compensated data. You can use either the pre-stored
offset data or the pre-measured offset data.
To measure the offset data, perform the self-calibration before starting the
measurement for a DUT. This offset data is temporarily memorized until the
B1500A is turned off.
2- 56
Agilent EasyEXPERT User’s Guide Vol. 1, Edition 1
Classic Test Definition
Advanced Setup Window for C-V Sweep
Advanced Setup Window for C-V Sweep
This window is opened by clicking the Advanced button on the C-V Sweep
Measurement Setup screen, and is used to set the following functions.
AC Level/DC Bias
Monitor Settings
Channel Settings
This area defines the variables for the AC level data and the DC bias data monitored
by the CMU while the capacitance measurement is performed.
Unit
CMU used for the measurement
AC Level Monitor
Name
Variable name of the AC level monitor data
DC Bias Monitor
Name
Variable name of the DC bias monitor data
This area sets the SMU series resistor and the SMU filter.
Unit
SMU used for the measurement
VName
Variable name of voltage output or measurement data
IName
Variable name of current output or measurement data
Series R
Series resistor NONE or 1MOHM. See “SMU Series Resistor”
on page 4-71.
SMU series resistor is not available for MCSMU, HCSMU, and
HVSMU.
SMU Filter
Wait Time Control
SMU filter ON or OFF. See “SMU Filter” on page 4-70.
This area sets the source output wait time and the measurement wait time of SMU.
See “Wait Time” on page 4-68. The Output Wait sets the source output wait time.
The Measurement Wait sets the measurement wait time.
Factor
Factor value. 0 to 10, 0.1 resolution. This is the N value shown
in “Wait Time” on page 4-68.
Agilent EasyEXPERT User’s Guide Vol. 1, Edition 1
2- 57
Classic Test Definition
Advanced Setup Window for C-V Sweep
After Measurement This area sets the bias hold function used to keep the source output after
Settings
measurement. The source applies the specified bias between a measurement and the
next measurement performed in the repeat measurement or quick test. See “Bias
Hold Function” on page 4-41.
Bias Hold after
Measurement
Bias hold function ON or OFF
Output Value after
Measurement
Source output value after measurement
START (sweep start value) or STOP (sweep stop value)
Semiconductor
Relays (16440A
SMU/PG Selector)
Effective only for the instrument installed with SPGU or PGU. Agilent 16445A
selector adapter is needed for connecting Agilent 16440A SMU/PGU selector
(B1500A-A04).
This area sets the selector CH1/CH3 status (DEFAULT or PGU OPEN). To use this
function, set the DEFAULT setting to Always SMU or Normally PGU (AUX) by
using the SMU/PG Selector tab screen on the Configuration window before starting
the SPGU output.
CH1
CH1 status, DEFAULT or PGU OPEN.
CH3
CH3 status, DEFAULT or PGU OPEN.
CH1 represents channel 1 on the first selector and CH3 represents channel 1 on the
second selector. See “SMU/PG Selector” on page 4-49 for details on the selector.
2- 58
Agilent EasyEXPERT User’s Guide Vol. 1, Edition 1
Classic Test Definition
Switching Matrix Control
Switching Matrix Control
On the EasyEXPERT main screen, click the Classic Test tab and select the
Switching Matrix Control icon. The main screen displays the Switching Matrix
Control setup screen. This setup screen is used to create the relay control setup for
Agilent B2200A/B2201A/E5250A Switching Matrix.
To apply the relay control setup, click the Single button. Before doing this, you have
to establish the GPIB connection to the switching matrix by using the Switching
Matrix tab screen of the Configuration window. See “Switching Matrix” on page
1-67.
Setup Name
Used to set the name of the relay control setup. The name must be the identification
for the setup saved to a My Favorite group (preset group). Enter a unique name that
is distinct from other setup.
The name is recorded in the test result data and is used to differentiate the data in the
test record list area.
Connection
This area is used to create the relay control setup for the switching matrix.
Add
Adds a row for the relay connection setup.
Delete
Deletes the setup row. To select the setup row, use the left radio
button.
Up
Moves the selected setup row upward.
Down
Moves the selected setup row downward.
The setup row provides the following entry fields.
Operation
Relay control operation
Open All, Switch Setup, Close Range, Open Output,
Open Range, or Open Input. See Table 2-4.
Input
Switching matrix input port number or label
Available for the Switch Setup, Close Range, and Open Input
operations.
Agilent EasyEXPERT User’s Guide Vol. 1, Edition 1
2- 59
Classic Test Definition
Switching Matrix Control
Outputs
Switching matrix output channel number or label
Four entry fields are available for the Switch Setup and
Open Output operations to specify the output channels.
Two entry fields are available for the Close Range and
Open Range operations to specify the range of output channels.
Rule
Relay connection rule
BBM: Breaks the previous connection and then makes the new
connection for the specified outputs.
MBBR: Makes the new connection and then breaks the
previous connection for the specified outputs.
Table 2-4
Relay Control Operations
Operation
Open All
Description
Opens all relays.
Switch Setup
Makes the connection from the specified input port to the
specified output channels. Up to four output channels can be
specified at once.
Close Range
Makes the connection from the specified input port to the
specified output channels. They are between two channels given
by the Outputs fields.
Open Output
Opens the relays connected to the specified output channels. Up
to four output channels can be specified at once.
Open Range
Opens the relays connected to the specified output channels.
They are between two channels given by the Outputs fields.
Open Input
Opens the relays connected to the specified input port.
2- 60
Agilent EasyEXPERT User’s Guide Vol. 1, Edition 1
Classic Test Definition
SPGU Control
SPGU Control
On the EasyEXPERT main screen, click the Classic Test tab and select the SPGU
Control icon. The main screen displays the SPGU control screen. See “SPGU
Module” on page 4-27 for the function of the SPGU.
Setup Name
Used to set the name of the SPGU control setup. The name must be able to identify
a setup saved in a My Favorite group (preset group). Enter a unique name that is
distinct from other setup.
The name is recorded in the execution result data and is used to differentiate the data
in the test record list area.
Channel Definition Defines the SPGU channel setups.
Unit
Semiconductor pulse generator unit (SPGU) used for the
voltage pulse output or the arbitrary linear waveform voltage
output
VName
Name of voltage output data
Mode
Output mode VPULSE (voltage pulse output) or ALWG
(arbitrary linear waveform voltage output).
All SPGU channels must have the same output mode.
SPGU Setup
Add
Adds a row for the channel setup.
Delete
Deletes the channel setup. To select the channel setup, use the
left radio button.
Up
Moves the selected channel setup upward.
Down
Moves the selected channel setup downward.
Provides the following buttons used to open the following setup window.
Pulse/ALWG
Opens “SPGU Pulse Setup Window” if Mode=VPULSE.
Opens “SPGU ALWG Setup Window” if Mode=ALWG.
Advanced
Opens “Advanced Setup Window for SPGU Control”.
Agilent EasyEXPERT User’s Guide Vol. 1, Edition 1
2- 61
Classic Test Definition
SPGU Control
Progress Monitor
Provides the following check boxes used to set the Data Display window displayed
while the SPGU channel output is applied.
Graph: % of
Progress
Check this box to display the Percent of Progress vs. Time plot.
List: Time Data
Check this box to display the Time data list.
No data may be displayed on the Data Display window if the SPGU output time is
too short. The progress monitor will be used for long duration outputs, for example
when the duration is longer than 30 seconds.
Advanced Setup Window for SPGU Control
This window is opened by clicking the Advanced button on the SPGU Control
screen, and is used to set the following functions of the SPGU channel.
After Measurement Sets the bias hold function used to decide the channel output after the SPGU output
Setting
operation.
Bias Hold after
Measurement
Bias hold function ON or OFF
If the bias hold function is OFF, the channel stops the output immediately after the
SPGU output operation.
If the function is ON, the channel maintains the base voltage output (in the VPULSE
mode) or the initial voltage output (in the ALWG mode) between a SPGU output
operation and the next operation performed in the repeat execution or quick test.
Channel initialization occurs at the beginning of the next operation.
Semiconductor
Relays (16440A
SMU/PG Selector)
Sets the CH1/CH3 status (DEFAULT or PGU OPEN) of Agilent 16440A SMU/PGU
selector (B1500A-A04). To use this function, set the DEFAULT setting to Always
SMU or Normally PGU (AUX) by using the SMU/PG Selector tab screen on the
Configuration window before starting the SPGU output.
CH1
CH1 status, DEFAULT or PGU OPEN.
CH3
CH3 status, DEFAULT or PGU OPEN.
CH1 represents channel 1 on the first selector and CH3 represents channel 1 on the
second selector. See “SMU/PG Selector” on page 4-49 for details on the selector.
Agilent 16445A selector adapter is needed for connecting the SMU/PGU selector.
2- 62
Agilent EasyEXPERT User’s Guide Vol. 1, Edition 1
Classic Test Definition
SPGU Pulse Setup Window
SPGU Pulse Setup Window
This window is opened by clicking the Pulse/ALWG button on the SPGU Control
screen when Mode=VPULSE, or by clicking the SPGU Pulse Setup button on the
I/V Sweep / Multi Channel I/V Sweep / I/V List Sweep / I/V-t Sampling
Measurement Setup screen. It is used to set the SPGU pulse output. See Figure 2-3
for the pulse setup parameters.
Global Settings
Provides the following entry field. The setting is effective for all channels.
Period
Operation
Pulse period. 20 ns to 10 s, 10 ns resolution.
Provides the following radio buttons used to set the SPGU channel output operation
mode, free run, pulse count, or duration. Select one of the following buttons to set
the operation mode. The setting is effective for all channels.
FREE RUN
In this mode, the SPGU continues the pulse output until the
measurement is completed or stopped.
This mode is not available for the SPGU Control classic test.
Pulse Settings
PULSE COUNT
In this mode, the SPGU outputs the specified number of pulses.
Specify a number within the range of 1 to 1000000.
DURATION
In this mode, the SPGU continues the output until the specified
time elapses. Specify a time within the range of 1 s to
31556926 s (1 year).
Unit
Semiconductor pulse generator unit (SPGU) used for the
voltage pulse output
VName
Name of voltage output data
Type
2-Level Pulse or 3-Level Pulse. If you choose 3-Level Pulse,
the Additional Pulse fields become effective.
Base, Peak
Pulse base and peak voltage. 0 to 40 V, 1 mV resolution.
Delay
Delay time. 0 s to Period-20 ns, resolution 2.5 ns or 10 ns
(pulse transition time > 8 s).
Width
Pulse width. 10 ns to Period-10 ns, resolution 2.5 ns or 10 ns
(pulse transition time > 8 s).
Leading, Trailing Pulse transition time. 8 ns to 400 ms, resolution 2 ns or 8 ns
(pulse transition time > 8 s).
Agilent EasyEXPERT User’s Guide Vol. 1, Edition 1
2- 63
Classic Test Definition
SPGU Pulse Setup Window
SPGU setup view
order
Up
Moves the selected channel setup upward.
Down
Moves the selected channel setup downward.
Changes are effective only for the display on the SPGU Pulse Setup window and not
memorized. They are not applied to the Channel Setup.
Load Z
This button opens the “Load Z Setup Window” used to set the load impedance of the
DUT (device under test) connected to the SPGU channel. The SPGU will
automatically adjust the output voltage by using this value, and output the voltage
close to the specified pulse base and peak values.
Pulse Switch
This button opens the “Pulse Switch Setup Window” used to set the pulse switch
operation. The pulse switch is used to set the open condition of the SPGU output
channel. The pulse switch is more durable than mechanical relays, and is better
suited for frequent switching applications.
Figure 2-3
SPGU Pulse Setup Parameters
Start
Leading
V/10
Peak
V/10
V: Pulse level
V/10
Width
Delay
Trailing
Base
V/10
Delay
Period
Normally open
Close
Pulse switch
Width-sw
Delay-sw
2- 64
Close
Open
Delay-sw
Agilent EasyEXPERT User’s Guide Vol. 1, Edition 1
Classic Test Definition
Load Z Setup Window
Load Z Setup Window
This window is opened by clicking the Load Z button on the SPGU Pulse Setup
window or the SPGU ALWG Setup window, and is used to set the load impedance
of the DUT (device under test) connected to the specified SPGU channel.
Set the correct impedance value. The SPGU will automatically adjust the output
voltage by using this value, and output the voltage close to the specified pulse base
and peak values.
Load Z
Unit
Semiconductor pulse generator unit (SPGU) used for the
voltage pulse output or the arbitrary linear waveform voltage
output
VName
Name of voltage output data
Load Z
Load impedance of the DUT (device under test) connected to
this channel in .
Agilent EasyEXPERT User’s Guide Vol. 1, Edition 1
2- 65
Classic Test Definition
Pulse Switch Setup Window
Pulse Switch Setup Window
This window is opened by clicking the Pulse Switch button on the SPGU Pulse
Setup window, and is used to set the pulse switch operation. The pulse switch is
used to set the open condition of the SPGU output channel. The pulse switch is more
durable than mechanical relays, and is better suited for frequent switching
applications.
Pulse Switch
Unit
Semiconductor pulse generator unit (SPGU) used for the
voltage pulse output
VName
Name of voltage output data
SW Sync
ENABLE (enables the pulse switch) or DISABLE (disables the
pulse switch).
Switching of the pulse switch status (open and close) will be
controlled automatically and synchronized with the output
pulse, as shown in Figure 2-3.
Delay
Delay time from start of pulse output to changeover of pulse
switch. 0 s to Period-100 ns, 10 ns resolution.
Width
Duration to hold the switched state of the pulse switch. 100 ns
to Period-Delay ns, 10 ns resolution.
Normal
CLOSE (normally closes the pulse switch) or OPEN (normally
opens the pulse switch). The pulse switch will change the status
after the Delay-sw time and keep the status until the Width-sw
time elapses as shown in Figure 2-3. This operation is repeated
every pulse period.
2- 66
Agilent EasyEXPERT User’s Guide Vol. 1, Edition 1
Classic Test Definition
SPGU ALWG Setup Window
SPGU ALWG Setup Window
This window is opened by clicking the Pulse/ALWG button on the SPGU Control
screen when Mode=ALWG, or by clicking the SPGU ALWG Setup button on the
I/V Sweep / Multi Channel I/V Sweep / I/V List Sweep / I/V-t Sampling
Measurement Setup screen. It is used to set the arbitrary linear waveform output.
Operation
Provides the following radio buttons used to set the SPGU channel output operation
mode, free run, sequence count, or duration. Select one of the following buttons to
set the operation mode. The setting is effective for all channels.
FREE RUN
In this mode, the SPGU continues the ALWG sequence output
until the measurement is completed or stopped.
This mode is not available for the SPGU Control classic test.
SEQUENCE
COUNT
DURATION
ALWG Setting
In this mode, the SPGU outputs the specified number of
sequences. Specify a number within the range of 1 to 1000000.
In this mode, the SPGU continues the output until the specified
time elapses. Specify a time within the range of 1 s to
31556926 s (1 year).
Provides the following field.
ALWG Source
Click the start button in this field to open the Define ALWG
Waveform window which is used to define the arbitrary linear
waveform and its output sequence. See “Define ALWG
Waveform Window” on page 2-68.
Load Z
This button opens the “Load Z Setup Window” used to set the load impedance of the
DUT (device under test) connected to the SPGU channel. The SPGU will
automatically adjust the output voltage by using this value, and output the voltage
close to the specified pulse base and peak values.
Figure 2-4
SPGU ALWG Setup Window
start button
Agilent EasyEXPERT User’s Guide Vol. 1, Edition 1
2- 67
Classic Test Definition
Define ALWG Waveform Window
Define ALWG Waveform Window
This window is opened by clicking the start button in the waveform data entry field
or the ALWG Source field on the SPGU ALWG Setup window, and is used to create
the arbitrary linear waveform data which is defined by the pattern data and the
sequence data.
File menu
Provides the following five functions.
Export ALWaveform...
Exports the waveform data.
Import ALWaveform... Imports the specified waveform data.
Pattern menu
Column menu
Export Pattern...
Exports the pattern highlighted in the Patterns display
area.
Import Patterns...
Imports the specified pattern data.
Close
Closes the Define ALWG Waveform window.
Provides the following six functions.
New
This is for creating a new pattern. Opens the New Pattern
dialog box. Entering a new name opens Waveform
Pattern Editor (p. 2-71).
Edit
Opens the Waveform Pattern Editor with the pattern
highlighted in the Pattern display area.
Cut
Cuts the pattern highlighted in the Pattern display area
and stores it on the Clipboard.
Copy
Copies the pattern highlighted in the Pattern display area
to the Clipboard.
Paste
Pastes the pattern stored on the Clipboard.
Rename
Renames the pattern highlighted in the Pattern display
area.
Provides the following five functions.
Edit
Opens the Waveform Pattern Editor with the column data
highlighted in the Sequence Editor area.
Insert
Adds a column.
2- 68
Agilent EasyEXPERT User’s Guide Vol. 1, Edition 1
Classic Test Definition
Define ALWG Waveform Window
Sequence Editor
Delete
Deletes the column data highlighted in the Sequence
Editor area.
Move
Moves the highlighted column to the left or the right.
Repeat Count
Opens the Repeat Count dialog box used to set the repeat
count.
Specifies the output channel, the output pattern, the repeat count of the pattern, and
the output sequence of patterns. These setup information create the arbitrary linear
waveform data.
Column No.
Number for specifying the output sequence. The pattern will be
output in the order of this number.
Repeat Count
Output repeat count for the pattern specified by the channel
field (e.g right field of the label “SPGU1:HV”). The repeat
count must be entered in this field.
channel
(e.g SPGU1:HV) Output channel and its output pattern. The channel is specified
by the header (e.g SPGU1:HV) of this row. The pattern data
must be specified by this entry field. A pre-defined pattern can
be selected from the drop down menu in this field. The right
button opens the Waveform Pattern Editor.
This area provides the following buttons.
Insert Column
Adds a column.
Delete Column
Deletes the highlighted column.
To Left
Move the highlighted column to the left.
To Right
Move the highlighted column to the right.
This area also provides the following functions in the menu displayed by
right-clicking this area.
Cancel
Closes the menu.
Insert Column
Adds a column.
Delete Column
Deletes the highlighted column.
Move Column
Moves the highlighted column to the left or the right.
Repeat Count
Opens the Repeat Count dialog box used to set the repeat count.
Edit
Opens the Waveform Pattern Editor with the specified pattern
data (Pattern) or the specified column data (Column).
Agilent EasyEXPERT User’s Guide Vol. 1, Edition 1
2- 69
Classic Test Definition
Define ALWG Waveform Window
The Repeat Count field provides the following functions in the menu displayed by
right-clicking the field.
Cut
Cuts the highlighted value and stores it on the Clipboard.
Copy
Copies the highlighted value to the Clipboard.
Paste
Pastes the value stored on the Clipboard.
When a column is highlighted (light blue), the highlighted area provides the
following functions in the menu displayed by right-clicking the field.
Cancel
Closes the menu.
Edit Column
Opens the Waveform Pattern Editor with the specified column
data.
When a channel field is highlighted (light blue), the highlighted field provides the
following functions in the menu displayed by right-clicking the field.
Patterns
Cancel
Closes the menu.
Edit Pattern
Opens the Waveform Pattern Editor with the specified pattern
data.
Displays icons for all pre-defined waveform patterns and provides the following
functions in the menu displayed by right-clicking this area.
Cancel
Closes the menu.
New Pattern
This is for creating a new pattern. Opens the New Pattern dialog
box. Entering a new name opens Waveform Pattern Editor (p.
2-71).
Edit
Opens the Waveform Pattern Editor with the highlighted
pattern.
Cut
Cuts the highlighted pattern and stores it on the Clipboard.
Copy
Copies the highlighted pattern to the Clipboard.
Paste
Pastes the pattern stored on the Clipboard.
Rename
Renames the highlighted pattern.
Export Pattern... Exports the highlighted pattern data.
Import Pattern... Imports the specified pattern data.
Double-clicking a pattern icon will open the Waveform Pattern Editor with the
clicked pattern.
2- 70
Agilent EasyEXPERT User’s Guide Vol. 1, Edition 1
Classic Test Definition
Define ALWG Waveform Window
Waveform Pattern Editor
This window is opened by several actions, for example by selecting New from the
Pattern menu, and is used to create or edit the pattern data.
File menu
Edit menu
Provides the following three functions.
Save
Saves the pattern data.
Save As...
Opens a dialog box used to specify a pattern name
and save the pattern data.
Close
Closes the Waveform Pattern Editor without saving
the data.
Provides the following seven functions.
Undo
Undoes the last action.
Redo
Cancels the Undo operation.
Add a New Point
Adds a point.
Delete a Point
Deletes the highlighted point.
Same Level As Left Point
Sets the highlighted point to the same level as the
left point.
Copy Pattern to Clipboard
Copies the highlighted pattern data to the Clipboard
in the tab-separated spreadsheet format.
Paste Pattern from Clipboard Pastes the tab-separated spreadsheet format data
stored on the Clipboard.
Display menu
Provides the following function.
Channel
Opens the Display Channels dialog box used to
select the SPGU channels displayed on the
Waveform Pattern Editor. This function is available
if the Waveform Pattern Editor was opened with the
column data.
Agilent EasyEXPERT User’s Guide Vol. 1, Edition 1
2- 71
Classic Test Definition
Define ALWG Waveform Window
Pattern Editor
Defines the pattern data. The Pattern Editor provides two methods, graphic mode
and tabular mode, for defining the pattern data.
In the graphic mode, you can define the pattern data by using the mouse pointer and
GUIs on the graph (on the left side of the Pattern Editor).
In the tabular mode, you can define the pattern data by entering Time in seconds,
Level in V, and Switch 0 (pulse switch open) or 1 (pulse switch close) into the table
(on the right side of the Pattern Editor).
The Delta Time check box and the Delta Level check box are used to switch the data
expression in the table. If the box is not checked, the value will be an absolute value;
if the box is checked, the value will be the difference from the previous point.
The Pattern Editor provides the following buttons.
Undo
Undoes the last action.
Redo
Cancels the Undo operation.
Add a New Point Adds a point.
Delete a Point
Deletes the highlighted point.
The Pattern Editor also provides the following functions in the menu displayed by
right-clicking the area.
Cancel
Closes the menu.
Save
Saves the pattern data.
Edit
Displays the Edit menu.
Display
Displays the Display menu.
If the Pattern Editor is opened with the column data, the following GUI will be
available.
Ref Ch.
Specifies the channel or the pattern which contains the
reference point.
Ref Pt.
Specifies the reference point by the index number (No. column
of table).
Delta T
Displays the difference from the reference point. For time data.
Delta V
Displays the difference from the reference point. For level data.
2- 72
Agilent EasyEXPERT User’s Guide Vol. 1, Edition 1
3
Application Test Definition
Application Test Definition
This chapter provides the reference information of the application test definition
setup GUI of Agilent EasyEXPERT software.
•
“Test Definition Window”
•
“Test Specification”
•
“Test Output”
•
“Test Contents”
•
“Local Variable Definition”
•
“Program Component”
•
“Auto Analysis”
•
“Data Display Control”
•
“Display Data Setup”
•
“GPIB I/O”
•
“Message”
•
“Data Store Control”
•
“Command Execution”
•
“Using Command Execution”
3- 2
Agilent EasyEXPERT User’s Guide Vol. 1, Edition 1
Application Test Definition
Test Definition Window
Test Definition Window
The Test Definition window is opened by selecting the Define New Test... function
or the Open Definition of This Test... function of the Library menu, and is used to
create a test definition used in the application test mode.
The test definition consists of the elements shown in Figure 3-1. And the Test
Definition window provides the following three tabs for creating a test definition.
•
“Test Specification”
The test specification contains test name, description, device parameters, and
test parameters. The parameters will be the variables used to pass the test
conditions to the test execution flow or test setup defined in the test contents.
•
“Test Contents”
The test contents are the core of the test definition, and defines the local
variables, test execution flow, and test setup. You can define the test setup by
selecting application tests, classic tests, or My Favorite setup, and entering the
test conditions.
•
“Test Output”
The test output setup is optional. If you need the test result output (test result
display and record) of the test definition, declare the variables (analysis
parameters) and define the display setup.
Figure 3-1
Test Definition
7HVW6SHFLILFDWLRQ
7HVW2XWSXW
9DULDEOHV
$QDO\VLVSDUDPHWHUV
7HVWUHVXOWGLVSOD\
;<JUDSK
'DWDOLVW
3DUDPHWHUGLVSOD\
7HVWQDPH
7HVWGHVFULSWLRQ
9DULDEOHV
'HYLFHSDUDPHWHUV
7HVWSDUDPHWHUV
(QWU\ILHOGV
7HVW&RQWHQWV
/RFDOYDULDEOHV
7HVWH[HFXWLRQIORZ
7HVWVHWXS
&ODVVLFWHVW
$SSOLFDWLRQWHVW
0\)DYRULWHVHWXS
Agilent EasyEXPERT User’s Guide Vol. 1, Edition 1
3- 3
Application Test Definition
Test Definition Window
The Test Definition window provides the following menus.
File menu
Help menu
Provides the following two functions.
Save
Saves the test definition. The sample application
tests furnished with the EasyEXPERT and the
application tests created by other users cannot be
saved without changing the Test Name value. The
Test Name must be your original.
Close
Opens a dialog box that asks if you want to save
before closing the window. Selecting Yes saves the
test definition and closes the Test Definition
window. Selecting No closes the Test Definition
window without saving the test definition.
Agilent EasyEXPERT Help
Opens the EasyEXPERT help window.
3- 4
Agilent EasyEXPERT User’s Guide Vol. 1, Edition 1
Application Test Definition
Test Specification
Test Specification
This setup screen is used to define the test definition information and the input
parameters for the test definition.
Test Information
The test information is defined in this area.
Category
Displays the category of the test definition.
The button opens a dialog box used to set the category. It must
be 1 to 30 characters. Multiple categories can be set to a test
definition.
Test Name
Specifies the test definition name. It must be 1 to 30 characters.
Icon
Specifies a bitmap file used for the test definition icon listed in
the Library area of the main screen.
Browse...: Opens a dialog box used to select a bitmap file.
Cancel: Returns to the default setting.
Description
Enters the description of the test definition.
Device Parameters The device parameters are defined in this area. Type of the device parameter is
Definition
Numeric.
Name
Device parameter name
Default
Default value of the parameter
Description
Description of the parameter
Add
Adds a row for the device parameter.
Delete
Deletes the selected device parameter. To select the parameter,
use the left radio button.
Up
Moves the selected device parameter upward.
Down
Moves the selected device parameter downward.
Agilent EasyEXPERT User’s Guide Vol. 1, Edition 1
3- 5
Application Test Definition
Test Specification
Test Parameters
Definition
The test parameters are defined in this area.
Background
Specifies a bitmap file used for the background in the Test
Parameters area of the main screen.
Browse...: Opens a dialog box used to select a bitmap file.
Cancel: Returns to the default setting.
Name
Test parameter name
Type
Type of the test parameter, Numeric, Module, String, Vector, or
ALWaveform (SPGU ALWG output data)
Default
Default value of the parameter
For the Numeric, Vector, or ALWaveform type parameter, this
field provides the button to open Numeric KeyPad at the right
side.
For the Vector type parameter, this field provides the button to
open the “Define vector data (page 2-18)” dialog box at the left
side.
For the ALWaveform type parameter, this field provides the
button to open the “Define ALWG Waveform Window (page
2-68)” at the left side.
Description
Description of the parameter
Align
Specifies the X origin of the entry field in the main screen Test
Parameters area. Check this box to set it to the left edge of the
entry field. Uncheck this box to set it to the left edge of the
parameter name placed to the left of the entry field.
X, Y
Specifies the entry field position. (X, Y)=(0, 0) specifies the
upper left corner of the main screen Test Parameters area.
Downward and rightward are positive. See “Layout...”.
Width
Specifies the width of the entry field.
Ext
Do not check usually. The entry field for the parameter is put on
the main screen.
If the parameter is minor and do not need changes frequently,
check the Ext check box. The entry field will be put on the
dialog box displayed by clicking the “Extended Setup (page
1-30)” button.
Layout...
3- 6
Opens the “Define Layout (page 3-10)” dialog box.
Agilent EasyEXPERT User’s Guide Vol. 1, Edition 1
Application Test Definition
Test Specification
Properties
Add
Adds a row for the test parameter.
Delete
Deletes the selected test parameter. To select the parameter, use
the left radio button.
Up
Moves the selected test parameter upward.
Down
Moves the selected test parameter downward.
Copy
Copies the selected test parameter to the Clipboard.
Paste
Pastes the test parameter stored on the Clipboard.
The Properties area is used to define the following values for the specified device
parameter or test parameter. See “Device Parameters Definition” on page 3-5 and
“Test Parameters Definition” on page 3-6.
To specify the parameter, select the radio button to the left of the parameter name.
Min
For Numeric or Vector parameters. Allowable minimum value.
Max
For Numeric or Vector parameters. Allowable maximum value.
Digits
For Numeric or Vector parameters. Number of effective digits.
Resolution
For Numeric or Vector parameters. Allowable setup resolution.
Unit
For Numeric or Vector parameters. Unit of the parameter.
Typical Values...
For Numeric or String parameters.
Opens the Define typical values dialog box used to define the
selections (typical values) for the specified parameter.
The values defined here are the selections for the parameter
entry field displayed on the main screen in the application test
mode. The selections for the active entry field are displayed on
the softkey. And one of the selections can be set by using the
softkey. Also, it can be set by using the Select sub menu
displayed by right-clicking the entry field.
The selections are effective for the specified parameter only.
Resource Type
For Module parameters.
Opens the Define Resource Types dialog box used to specify
the type of measurement resource. Multiple resources can be
set.
Agilent EasyEXPERT User’s Guide Vol. 1, Edition 1
3- 7
Application Test Definition
Test Specification
SMU, HPSMU, HCSMU, DHCSMU (dual HCSMU),
HVSMU, HRSMU, MPSMU, MCSMU, HRSMU/ASU,
GNDU, SPGU, HVSPGU, WGFMU, RSWGFMU, MFCMU,
MFCMU/SCUU, SWM IN, SWM AUX IN, SWM SMU IN,
UHCU500, UHCU1500, UHVU, or HVMCU
Dimension...
For Vector parameters.
Opens the Define dimensions dialog box for defining the
dimension of vector data.
Use Dim1Min and Dim1Max to specify the primary dimension
of vector data. This direction can be for the primary sweep data.
Use Dim2Min and Dim2Max to specify the secondary
dimension of vector data. This direction can be for the
secondary sweep data.
The following conditions must be satisfied.
Assign Output
Channels...
•
1 Dim1Min Dim1Max (ex. Dim1Min=1,
Dim1Max=11)
•
1 Dim2Min Dim2Max (ex. Dim2Min=1,
Dim2Max=3)
For ALWaveform parameters.
This button opens the Assign ALWaveform Output Channels
dialog box which specifies the variables if they are used to
identify the SPGU channels. The variables must be the Module
type test parameter.
For example, when the parameters are defined as shown below,
PG1 should be set to the Assign ALWaveform Output Channels
dialog box for the WAVE1 parameter.
PG1: Module parameter to identify the SPGU channel
WAVE1: ALWaveform parameter for the PG1 setup data
Use “Define ALWG Waveform Window (page 2-68)” to create
the SPGU ALWG setup data. For the above example, the PG1 is
the SPGU channel identifier when creating the WAVE1 data.
3- 8
Agilent EasyEXPERT User’s Guide Vol. 1, Edition 1
Application Test Definition
Test Specification
Symbols...
For Numeric or Vector parameters.
Opens the Define dimensions dialog box for assigning a symbol
(string value) to a numeric value for the specified numeric
parameter.
By defining the numeric-symbol assignment, the symbol value,
instead of the numeric value, is set to the parameter entry field
displayed on the main screen in the application test mode.
In the test definition, the parameter works as a numeric value.
However, the numeric-to-string translation result will not be the
string value simply translated from the numeric value but the
symbol assigned to the numeric value.
For example, if Symbol=ON is assigned to Value=1 of the
Param1 parameter, the string ON will be set to the Param1 entry
field when numeric value 1 is entered into the Param1 field.
Also, while the Param1 field shows ON, the Param1 value will
be 1 in the test definition. And when the numeric value of
Param1 is 1, the numeric-to-string translation result will not be
the string 1 but the string ON.
The numeric-symbol assignment is effective for the specified
parameter only.
Value and symbol must be in a one-to-one relationship.
The value must satisfy the Min, Max, Digits, and Resolution
settings. The symbol must be between 1 and 30 characters.
NOTE
Symbols... numeric-symbol assignment
For parameters defined with a numeric-string assignment, the numeric-to-string
translation result will be the symbol assigned to the numeric value. Be careful when
using the string built-in function that is used to translate a numeric expression to a
string value.
For the following example setup of a numeric-symbol assignment,
string(Mode) execution result at Mode=0 is the string OFF, not the string 0.
Name=Mode, Value=0, Symbol=OFF
Agilent EasyEXPERT User’s Guide Vol. 1, Edition 1
3- 9
Application Test Definition
Test Specification
Define Layout
This dialog box is opened by clicking the Layout... button on the Test Specification
screen of the Test Definition window, and is used to define the layout of the test
parameter entry fields displayed on the application test setup screen. See Figure 3-2.
To define the layout of the entry field, follow the procedures below.
1. Select the entry fields to move. See “To Select Entry Fields” on page 3-13.
2. Move the selected entry fields. See “To Move Entry Fields” on page 3-13.
Figure 3-2
Define Layout dialog box
3ULPDU\(QWU\)LHOG
Define Layout GUI
This section describes the Graphical User Interface of the Define Layout dialog box.
The Define Layout dialog box provides the following buttons.
OK
Saves the layout definitions and closes the Define Layout
dialog box.
Cancel
Closes the Define Layout dialog box without saving the layout
definitions.
3- 10
Agilent EasyEXPERT User’s Guide Vol. 1, Edition 1
Application Test Definition
Test Specification
The Define Layout dialog box provides the following menus.
File menu
Exit
Closes the Define Layout dialog box without saving the layout
definitions.
Edit menu
Undo
Cancels an operation. Up to ten operations can be cancelled.
Redo
Performs the canceled operation again.
Select All
Selects all entry fields.
View menu
Property...
Opens the “Properties (page 3-12)” window.
Align menu
Left
Aligns the left ends of other selected entry fields to the left end
of the primary entry field.
Center
Aligns the horizontal centers of other selected entry fields to the
horizontal center of the primary entry field.
Right
Aligns the right ends of other selected entry fields to the right
end of the primary entry field.
Top
Aligns the upper ends of other entry fields to the upper end of
the primary entry field.
Middle
Aligns the vertical centers of other selected entry fields to the
vertical center of the primary entry field.
Bottom
Aligns the lower ends of other selected entry fields to the lower
end of the primary entry field.
To Grid
Aligns the upper left corner of the entry field to the nearest grid.
Horizontally
Distributes the selected entry fields (3 or more) with even
horizontal intervals. The leftmost entry field is used as the base
point.
Vertically
Distributes the selected entry fields (3 or more) with even
vertical intervals. The leftmost entry field is used as the base
point.
Horizontally
Moves the horizontal center of all selected entry fields to the
horizontal center of the entry field area.
Vertically
Moves the vertical center of all selected entry fields to the
vertical center of the entry field area.
Distribute menu
Centralize menu
Agilent EasyEXPERT User’s Guide Vol. 1, Edition 1
3- 11
Application Test Definition
Test Specification
Tab Order menu
Top to Bottom
Sets the TabIndex in ascending order of the X of the entry
fields, starting at the upper left entry field. If the X of the entry
fields are equal, the TabIndex is set in ascending order of the Y
of the entry fields. For more information on X/Y, see
“Properties” on page 3-12.
Left to Right
Sets the TabIndex in ascending order of the Y of the entry
fields, starting at the upper left entry field. If the Y of the entry
fields are equal, the TabIndex is set in ascending order of the X
of entry fields.For more information on X/Y, see “Properties”
on page 3-12.
Properties
This window is opened by clicking the Property... button in the View menu of the
Define Layout dialog box, and specifies characteristics of the entry field area or the
entry fields.
When the entry field area is selected, the following characteristics can be specified.
Design
Layout
DrawGrid
Sets whether to display the grid.
GridSize
Sets the width and the height of the grid.
SnapToGrid
Sets whether to snap to the grid.
Size
Sets the width and the height of the entry field area.
When entry fields are selected, following characteristics can be specified.
Behavior
TabIndex
Sets the tab traversing order for the test parameter entry fields
of the application test.
Layout
Align
Specifies the X origin of the entry field.
True: Left edge of the entry field
False: Left edge of the parameter name placed to the left of the
entry field
Width
Specifies the width of the entry field.
X, Y
Specifies the entry field position. The Y origin is the upper edge
of the entry field.(X, Y)=(0, 0) specifies the upper left corner of
the entry field area. Values increase downward and rightward.
3- 12
Agilent EasyEXPERT User’s Guide Vol. 1, Edition 1
Application Test Definition
Test Specification
To Select Entry Fields
The following methods are available for selecting the entry fields.
•
Click on the entry field. Multiple entry fields can be selected by clicking on the
entry field while holding down the Ctrl key on the keyboard.
•
Drag the mouse to draw a rectangle around multiple entry fields.
•
Select Select All from the EDIT menu to select all entry fields.
The selected entry fields are outlined by the blue rectangles. The primary entry field,
which is the base for layout operations, is surrounded by a highlighted blue
rectangle, as shown in Figure 5-5. Only one primary entry field can be selected. To
change the primary entry field, click on a selected entry field. The selected entry
field that was most recently clicked will be the primary entry field.
The following methods are available for releasing (unselecting) the selected entry
fields.
•
Click the selected entry field while holding down the Shift key on the keyboard.
•
Click outside of the selected entry fields to release all selected entry fields.
To Move Entry Fields
The following methods are available for defining the layout of the selected entry
fields.
•
Drag & drop with the mouse to move the selected entry field(s).
•
Change the X/Y values in the property window to move the selected entry
field(s).
•
Press the arrow keys on the keyboard to move the selected entry field(s).
•
Using the functions in the Align menu, the selected single or multiple entry
fields can be aligned to the primary entry field.
•
Use the functions in the Distribute menu to evenly distribute the selected entry
horizontally or vertically.
•
Use the functions in the Centralize menu to move the horizontal or vertical
center of all selected entry fields to the horizontal or vertical center of the entry
field area.
Agilent EasyEXPERT User’s Guide Vol. 1, Edition 1
3- 13
Application Test Definition
Test Output
Test Output
This setup screen is used to set the test result output (test result display and record)
that is the output of the test definition.
The test output setup is optional. If you have the following requirements, define the
analysis parameters and set the display parameters.
•
To send the test result data to the subsequent tests in an application test
•
To make the program branching depends on the test result
•
To make the calculation using the test data in the Test Contents
•
To display/record the test result of this application test
To read the analysis parameters defined in the application test used in a test
definition, use the “External Variable Setup (page 3-23)” dialog box.
Define Own Output Check this check box to set the test result outputs of the test definition. While this
Parameters
box is checked, the X-Y Graph, List Display, and Parameters areas are available.
The test result output will be obtained every execution of the test definition.
Allocate Data
Display for each
test
This field sets the Multi Display function to Enable, Disable, or Comply with above
level.
If Enable is selected, the test result data of the same test setup name will be
displayed on the exclusive Data Display window and the test result data of the
different test setup name will be displayed on the new Data Display window.
If Disable is selected, the test result data will be always displayed on the singular
Data Display window even if it is the test result data of the different test setup name.
Select Comply with above level for complying with the Multi Display ON/OFF
status or the setting of the application test which uses this application test internally.
Define Analysis
Parameters...
This button opens the window. This “Analysis Parameter Definition (page 3-15)”
window is used to define the vector data and the scalar data used in the test result
output. The defined variable is called as the analysis parameter.
X-Y Graph,
List Display,
Parameters
The areas are used to set the test result output (test result display and record) that is
the output of the test definition. See “Display Setup” on page 2-46.
3- 14
Agilent EasyEXPERT User’s Guide Vol. 1, Edition 1
Application Test Definition
Test Output
Analysis Parameter Definition
This window is opened by clicking the Define Analysis Parameters button, and is
used to define the vector variables and the scalar variables used in the test result
output. The variables are called as the analysis parameters. This window is closed
by the Close button.
NOTE
Analysis parameters can be referred from a test definition which uses this
application test. To read the value, make a mapping table between the analysis
parameters and the local variables, device parameters, test parameters, or analysis
parameters defined in the test definition by using the “External Variable Setup (page
3-23)” dialog box.
Vector Parameters This area sets the analysis parameters for the vector data. The vector data is an array
data that contains numeric data more than one.
Name
Name of the analysis parameter
Unit
Unit of the analysis parameter
Description
Description of the analysis parameter
Add
Adds a row for the parameter.
Delete
Deletes the selected parameter. To select the parameter, use the
left radio button.
Up
Moves the selected parameter upward.
Down
Moves the selected parameter downward.
Scalar Parameters This area sets the analysis parameters for the scalar data. The scalar data is a
numeric data.
Name
Name of the analysis parameter
Unit
Unit of the analysis parameter
Description
Description of the analysis parameter
Add
Adds a row for the parameter.
Delete
Deletes the selected parameter. To select the parameter, use the
left radio button.
Up
Moves the selected parameter upward.
Down
Moves the selected parameter downward.
Agilent EasyEXPERT User’s Guide Vol. 1, Edition 1
3- 15
Application Test Definition
Test Contents
Test Contents
Test contents are the core of the test definition, and consists of the local variables,
test setups, and test execution flow. In the test contents, the following elements can
be defined. See Figure 3-3.
•
Local variables
•
Program components
•
Application tests
•
Classic tests
•
My Favorite setup
•
Analysis components
•
Miscellaneous components
•
Device parameters defined in Test Specification
•
Test parameters defined in Test Specification
•
Analysis parameters defined in Test Output
The device parameters, test parameters, and analysis parameters can be used in the
Test Contents without defining as the local variables.
For the available components, see Figure 3-4.
Figure 3-3
Test Contents
7HVW6SHFLILFDWLRQ
7HVW2XWSXW
9DULDEOHV
'HYLFHSDUDPHWHUV
7HVWSDUDPHWHUV
9DULDEOHV
$QDO\VLVSDUDPHWHUV
$QDO\VLV
/RFDOYDULDEOHV
0LVFHOODQHRXV
3URJUDP&RPSRQHQW
$SSOLFDWLRQ7HVW
3- 16
&ODVVLF7HVW
0\)DYRULWHVHWXS
Agilent EasyEXPERT User’s Guide Vol. 1, Edition 1
Application Test Definition
Test Contents
Defining/Editing Test Contents
The Test Contents setup screen is used to define the test execution flow that is the
core of the test definition. To define the test execution flow, use the test flow list
area at the lower left of the window, and do following. Also see Figure 3-5.
1. Define local variables by using the Local Variables Definition statement.
2. Select a component from the component selection area. See Figure 3-4 for the
available components.
3. Insert it between the BLOCK and END BLOCK statements.
4. Repeat this until your test execution flow is completed.
Figure 3-4
Available Components
Program Component
Application Test
Analysis
Classic Test
Miscellaneous
My Favorite
Agilent EasyEXPERT User’s Guide Vol. 1, Edition 1
3- 17
Application Test Definition
Test Contents
Program
Component
This component selection menu lists the program components available for the test
flow. See “Program Component” on page 3-26.
Application Test
This menu lists the application test setups available for the user. Inserting an
application test setup to the test flow displays the test setup screen almost same as
the “Application Test” on page 1-29. You set the test condition on this screen.
Variables can be used for setting the test condition. To use a Numeric or Module
variable, enter the variable name to the entry field. To use a String variable, type an
equal sign (=) and enter the variable name (for example, =VAR).
Clicking the Assign to external variables... button opens the External Variable Setup
dialog box. See “External Variable Setup” on page 3-23.
Analysis
Classic Test
This component selection menu lists the analysis functions available for the test
flow, and provides the following components.
•
“Auto Analysis” on page 3-27
•
“Display Data Setup” on page 3-31
•
“Data Display Control” on page 3-30
This component selection menu lists the classic test objects, I/V Sweep, Multi
Channel I/V Sweep, I/V List Sweep, I/V-t Sampling, C-V Sweep, SPGU Control
Switching Matrix Control, and Direct Control.
Inserting a classic test component to the test flow displays the test setup screen
almost same as the “I/V Sweep” on page 2-4, “Multi Channel I/V Sweep” on page
2-9, “I/V List Sweep” on page 2-13, “I/V-t Sampling” on page 2-21, “C-V Sweep”
on page 2-26, “SPGU Control” on page 2-61, “Switching Matrix Control” on page
2-59, or “Direct Control” on page 2-30. You set the test condition on the screen.
Clicking the Assign to external variables... button opens the External Variable Setup
dialog box. See “External Variable Setup” on page 3-23.
My Favorite Setup
This component selection menu is used to select the My Favorite setup inserted to
the test flow. Specify the preset group, then select the setup.
If a tracer test setup is selected, it is converted to and inserted as a Multi Channel I/V
Sweep test setup. In this conversion process, the VAR1 dual polarity sweep setup
(Dual Polarity) is ignored. The setup of the positive sweep from start to stop is
converted, but the setup of the negative sweep from -start to -stop is not converted.
3- 18
Agilent EasyEXPERT User’s Guide Vol. 1, Edition 1
Application Test Definition
Test Contents
Miscellaneous
This component selection menu lists the miscellaneous functions available for the
test flow, and provides the following components.
•
“GPIB I/O” on page 3-33
•
“Message” on page 3-38
•
“Command Execution” on page 3-40
•
“Data Store Control” on page 3-39
To add a component to the test flow, select the destination line for the component
and drag the component from the component selection area to the test flow list area.
Instead, you can select a line and a component, then click the Insert button. The
component will be put on the line after the selected line, and the following lines will
shift downward.
After adding a component to the test flow, selecting the new line might display an
editor at the center to lower right of the window. The editor is used to define the
setup. Some components provide the editor, and some components do not. For
example, the Local Variables Definition provides the editor used to define the local
variables. See “Local Variable Definition” on page 3-24.
You can edit the test flow by using the Block Selection/Line Selection, Insert,
Delete, Copy, Cut, and Paste buttons. Also you can debug the test flow by using the
Run/Pause, Abort, Step, Break, and Inspect buttons. See “Debugging Test Contents”
on page 3-21.
Edit / Debug
The Edit tab displays the buttons Block Selection/Line Selection, Insert, Delete,
Copy, Cut, and Paste.
The Debug tab displays the buttons Run, Abort, Step, Break, and Inspect.
Only the buttons effective for the selected line in the list area are active.
Block Selection /
Line Selection
The Line Selection button changes the list area selection mode to the line selection
mode. The Block Selection button changes the selection mode to the block
selection.
In the line selection mode, the line cursor selects every line.
In the block selection mode, the line cursor selects every block. For example, the
lines from the IF statement to END IF statement can be a block.
Agilent EasyEXPERT User’s Guide Vol. 1, Edition 1
3- 19
Application Test Definition
Test Contents
Insert
This button puts the selected component on the next line of the selected line. The
following lines will shift downward.
Delete
This button deletes the selected line. The following lines will shift upward.
Copy
This button copies the selected line to the clipboard.
Cut
This button moves the selected line to the clipboard. The following lines will shift
upward.
Paste
This button puts the components in the clipboard on the next line of the selected
line. The following lines will shift downward.
Figure 3-5
Test Contents Screen
Select available element
Click available
button
Specify the line
to insert element
or edit
3- 20
Define the setup necessary
for the highlighted element
Agilent EasyEXPERT User’s Guide Vol. 1, Edition 1
Application Test Definition
Test Contents
Debugging Test Contents
On the Test Contents tab screen, click the Debug tab. The following buttons will
appear. They are useful for debug of your test contents.
Set the break point, and click the Run button. And check the operation of the test
contents, the value of variables by using the Variable Inspector, and so on.
Figure 3-6
Debugging Test Contents
%UHDNSRLQW
3DXVHGSRLQW
Run/Pause
This button starts the debug (executes the test flow). During execution, the label
changes to Pause. Clicking Pause pauses the execution, and changes the label to Run
that is used to continue the debug (execution).
Abort
This button aborts the debug (execution).
Step
This button executes the selected line of the test flow. Clicking the button repeatedly
continues the execution by a line.
Break
This button sets/releases the break point. For the break point, this button releases the
break point from the selected line. Program execution will break at the break point
automatically.
Inspect
This button is available when the debug (execution) is paused or broken. This button
opens the Variable Inspector used to monitor value of device parameters, test
parameters, analysis parameters, local variables, or system variables. See “Variable
Inspector” on page 3-22.
Agilent EasyEXPERT User’s Guide Vol. 1, Edition 1
3- 21
Application Test Definition
Test Contents
Variable Inspector
This Variable Inspector is displayed by clicking the “Inspect (page 3-21)” button on
the Test Contents screen, and is used to monitor or change the value of the local
variables, device parameters, test parameters, and analysis parameters. For the
vector variables, only data monitor is available. The Variable Inspector provides the
following buttons to add the variable monitor area.
Add Numeric Variable
Adds the numeric variable monitor area.
Add Vector Variable
Adds the vector variable monitor area.
Add String Variable
Adds the string variable monitor area.
Add Module Variable
Adds the module variable monitor area.
The following functions are available for the menu displayed by clicking the banner
of the variable monitor area.
Numeric Variable
Vector Variable
String Variable
Module Variable
Up
This button shifts the variable monitor area upward.
Down
This button shifts the variable monitor area downward.
Remove
This button deletes the variable monitor area.
You can monitor or change the following information.
Variable
Numeric variable name
Value
Value of the variable
You can monitor the following information.
Name
Vector variable name. Two dimensional array.
Index1/2
Index for the primary/secondary plane of the two-dimensional array
Value
Value of the variable
You can monitor or change the following information.
Variable
String variable name
Value
Value of the variable
You can monitor or change the following information.
Variable
Module variable name
Value
Value of the variable
3- 22
Agilent EasyEXPERT User’s Guide Vol. 1, Edition 1
Application Test Definition
Test Contents
External Variable Setup
This dialog box is displayed by clicking the Assign to external variable... button on
an Application Test setup screen or a Classic Test setup screen, and is used to make
a mapping table between the test setup internal variables and the local variables,
device parameters, test parameters, or analysis parameters defined in the test
definition which uses this test setup. After making the mapping table, you can read
the value by using the external variables.
This dialog box provides the following buttons.
Add
Adds the variable entry fields.
Delete
Deletes the variable entry fields selected by the radio button.
Up
Shifts the selected variable entry fields upward.
Down
Shifts the selected variable entry fields downward.
This dialog box provides the following entry fields.
External variable
Name of local variable, device parameter, test parameter, or analysis parameter
connected with the variable set to the Measurement data field
Measurement data Name of internal variable used in a test setup and to be read. For the Application
Test, only the analysis parameters are available.
Example
The following example connects the internal vector variable Vdata with the local
variable VDATA.
1. Define VDATA as a local variable by using the Local Variables Definition
statement.
2. Click the Assign to external variable... button on a test setup screen.
3. Click the Add button on the External Variable Setup dialog box.
4. Set VDATA to the External variable field.
5. Set Vdata to the Measurement data field.
6. Click the Close button.
Agilent EasyEXPERT User’s Guide Vol. 1, Edition 1
3- 23
Application Test Definition
Local Variable Definition
Local Variable Definition
This setup editor is displayed while the Local Variable Definition is selected in the
test execution flow list area, and is used to define the variables used in the test
definition. The setup editor provides the following buttons to add the variables.
Add Numeric Variable
Adds the numeric variable.
Add Vector Variable
Adds the vector variable.
Add String Variable
Adds the string variable.
Add Module Variable
Adds the module variable.
The following functions are available for the menu appeared by clicking the banner
of the variable area.
Numeric Variable
Up
This button shifts the variable area upward.
Down
This button shifts the variable area downward.
Remove
This button deletes the variable.
This area provides the following entry fields.
Name
Numeric variable name
Value
Initial value of the variable
Description Additional information for the variable
3- 24
Agilent EasyEXPERT User’s Guide Vol. 1, Edition 1
Application Test Definition
Local Variable Definition
Vector Variable
This area provides the following entry fields.
Name
Vector variable name. Two dimensional array.
Count
Number of elements, or array size
Description Additional information for the variable
This area also provides the following radio button used to specify how to set the
initial value of the array data automatically.
•
Assign Linear Values FROM [value of first element] TO [value of last element]
If Count > 1, this sets first value + (N-1) (last value-first value)/(Count-1) to
the N-th element. If Count = 1, this sets first value (=last value) to the element.
•
Assign Linear Values FROM [value of first element] STEP [step value]
This sets first value + (N-1) step to the N-th element.
String Variable
This area provides the following entry fields.
Name
String variable name
Value
Initial value of the variable
Description Additional information for the variable
Module Variable
This area provides the following entry fields.
Name
Module variable name
Description Additional information for the variable
Agilent EasyEXPERT User’s Guide Vol. 1, Edition 1
3- 25
Application Test Definition
Program Component
Program Component
The Program Component selection menu provides the components described in
“Script Program Statements” on page 5-20. Especially, the following components
provide the setup editor.
ASSIGN
•
“ASSIGN”
•
“COMMENT”
•
“IF”
•
“ELSE IF”
•
“FOR”
This component provides the setup editor that contains the following entry fields
used to define the value of the variable.
Variable
Variable name
Expression
Definition of the variable
COMMENT
This component provides the setup editor used to enter the comment for the line.
IF
This component provides the setup editor used to enter the condition for the IF
statement.
ELSE IF
This component provides the setup editor used to enter the condition for the
ELSE IF statement.
FOR
This component provides the setup editor that contains the following entry fields
used to define the FOR NEXT loop condition.
Variable
Variable name
Initial Value
Count to start the FOR NEXT loop
Terminate Value
Count to terminate the FOR NEXT loop
Step Value
Loop count incremental step value
3- 26
Agilent EasyEXPERT User’s Guide Vol. 1, Edition 1
Application Test Definition
Auto Analysis
Auto Analysis
This component provides the setup editor used to set up the automatic analysis
function. When a measurement finishes, the function automatically draws lines, a
marker, or both on the X-Y Graph of the Data Display window.
You can set up two lines and one marker for the automatic analysis function by
using the setup editor.
In the Line 1 and Line 2 areas, you can set up the lines to be drawn.
In the Marker area, you can set up the marker.
Interpolation Mode Check this box to enable the interpolation mode. You can position marker between
measurement points.
Line 1, Line 2
This area sets the line 1 or line 2 automatically displayed and moved to the specified
position after the measurement.
Enable
Check this box to enable the line.
Fix
Check this box to fix the line on the graph after the auto
analysis is performed. Remove the check to make the line free.
Type
Select one of the available line types listed below.
Axis
Axis effective for the line. Specify one from Y1 to Y8.
First Point
See the following description for the line you selected.
Second Point
See the following description for the line you selected.
Available line types:
•
“Normal line”: For drawing a line between any two points.
•
“Gradient line”: For drawing a line through any point with a specified gradient.
•
“Tangent line”: For drawing a tangent line to a measurement point.
•
“Regression line”: For drawing a regression line by using the measurement data
included in the area specified by any two points.
Agilent EasyEXPERT User’s Guide Vol. 1, Edition 1
3- 27
Application Test Definition
Auto Analysis
Marker
This area sets the marker automatically displayed and moved to the specified
position after the measurement.
Enable
Check this box to enable the marker.
Condition
Enter a variable name and a condition expression to specify
where you want the marker to appear.
After
Check this box to enable the additional condition.
Enter a second variable and condition expression. This sets up a
search start condition for finding specified point.
For example, you can specify the following expressions to search for a measurement
point that satisfies the first condition after the second condition is satisfied.
Condition:[DGM]=[MAX(DGM)*0.01] [x] After [DGM]=[MAX(DGM)]
Normal line
The First Point area and the Second Point area are used to specify the points the line
passes through. The following two ways are available to specify the point.
•
X-Y Coordinate
Enter the desired X-Y coordinate values or expressions in the X and Y fields.
•
Data Condition
Enter a variable name and condition expression to specify the point. This is the
same method as specifying the Marker point.
Gradient line
The First Point area is used to specify the point the line passes through. The
following two ways are available to specify the point.
•
X-Y Coordinate
Enter the desired X-Y coordinate values or expressions in the X and Y fields.
•
Data Condition
Enter a variable name and condition expression to specify the point. This is the
same method as specifying the Marker point.
In the Gradient field, enter a gradient value or expression.
3- 28
Agilent EasyEXPERT User’s Guide Vol. 1, Edition 1
Application Test Definition
Auto Analysis
Tangent line
The First Point area is used to specify the measurement point the tangent line passes
through.
Enter a variable name and condition expression to specify the point. This is the same
method as specifying the Marker point.
Regression line
The First Point area and the Second Point area are used to specify the range of the
measurement data used for the regression calculation. The following two ways are
available to specify the point.
•
X-Y Coordinate
Enter the desired X-Y coordinate values or expressions in the X and Y fields.
•
Data Condition
Enter a variable name and condition expression to specify the point. This is the
same method as specifying the Marker point.
Agilent EasyEXPERT User’s Guide Vol. 1, Edition 1
3- 29
Application Test Definition
Data Display Control
Data Display Control
This component enables or disables the test result display of the application test or
the classic test used in the test definition.
Enable Data Display
Checking this box enables the test result display.
If you do not use this component, the test result display is enabled.
This component cannot control the test result display of the test definition. The test
result display is always enabled for the test definition. For the test result output of
the test definition, see “Test Output” on page 3-14.
3- 30
Agilent EasyEXPERT User’s Guide Vol. 1, Edition 1
Application Test Definition
Display Data Setup
Display Data Setup
This component is used to set the data output of the local variables defined in the
test execution flow. The values can be displayed on the Data Display window.
X-Y Graph
Selects the data to be displayed in the X-Y Graph Plot area. The X and Y1 to Y8
axes can be set.
Name
Specifies the parameter for the axis.
Sharing
Specifies the group for sharing the Y axis scale. Select from
Group 1, Group 2, Group 3, Group 4, or None (no grouping).
The Scale, Min, and Max values are shared by the Y axes in the
same group. The scale set by Run Time Auto Scale, Auto Scale,
Zoom in, and/or Zoom out are also shared.
If another layer on the Data Display window contains an X-Y
trace which has the same name for both its grouped Y
parameter and its X parameter, the scaling will also be shared
by this X-Y trace.
Scale
Scale of the axis, Linear or Log
Min
Minimum value of the axis
Max
Maximum value of the axis
Add
Adds a parameter (or axis).
Delete
Deletes the parameter selected with the radio button on the left.
Up
Moves the selected parameter upward.
Down
Moves the selected parameter downward.
Agilent EasyEXPERT User’s Guide Vol. 1, Edition 1
3- 31
Application Test Definition
Display Data Setup
List Display,
Parameters
The List Display area sets the output for the List Display area of the Data Display
window. The Parameters area sets the output for the Parameters area of the Data
Display window. Up to 20 parameters can be set for each area.
parameter
Specifies the parameter for the data output.
Add
Adds a row for the parameter.
Delete
Deletes the selected parameter. To select the parameter, use the
left radio button.
Up
Moves the selected parameter upward.
Down
Moves the selected parameter downward.
3- 32
Agilent EasyEXPERT User’s Guide Vol. 1, Edition 1
Application Test Definition
GPIB I/O
GPIB I/O
This component provides the setup editor that contains the following entry fields.
This component is used to control the GPIB interface. For the fields to enter a
variable name, only the variable name defined in the test definition can be entered.
CAUTION
Do not set the GPIB address of the B1500 to the Address parameter of this
component even if this is on the Desktop EasyEXPERT software. Operation of the
B1500 is not guaranteed.
Write String
Sends the specified string data to the specified GPIB device.
Write Value
Address
GPIB address of the target device
String
String value to send
Terminator
Terminator, DEFAULT, EOI, CR/LF+EOI, LF+EOI, CR/LF,
LF, or NONE (not specified)
Translates the specified numeric data to the string data, and sends it to the specified
GPIB device.
Address
GPIB address of the target device
Format
Format of Write Value. Follow Agilent T&M Programmers
Toolkit.
Value0
Numeric value or string value to send
Value1
Numeric value or string value to send
Value2
Numeric value or string value to send
Value3
Numeric value or string value to send
Terminator
Terminator, DEFAULT, EOI, CR/LF+EOI, LF+EOI, CR/LF,
LF, or NONE (not specified).
Agilent EasyEXPERT User’s Guide Vol. 1, Edition 1
3- 33
Application Test Definition
GPIB I/O
Read String
Reads a string value from the specified GPIB device.
Address
GPIB address of the target device
String
String variable name. Used to store the returned value.
Length To Read
Byte length of the string value to read
Length Actually
Read
Read Value
Numeric variable name. Used to store the byte length of the
returned value. If the Length To Read is large enough and the
terminator is sent with the returned string value, the value of
this numeric variable is smaller than the specified Length To
Read.
Terminator
Terminator, DEFAULT, EOI, CR/LF+EOI, LF+EOI, CR/LF,
LF, or NONE (not specified)
Terminated
Numeric variable name. Used to store the execution result. If
reading is completed by the terminator, 1 is entered. Otherwise,
0 is entered.
Timeout
Timeout. The value must be less than 231 s, 1 ms resolution.
0 does not set timeout.
Reads a numeric value from the specified GPIB device.
Address
GPIB address of the target device
Value
Numeric variable name. Used to store the returned value.
Preamble
String variable name. Used to store preamble of the returned
value. The preamble is a part considered as non-numeric value.
If this field is not set, the preamble is deleted.
Postamble
String variable name. Used to store postamble of the returned
value. The postamble is a part considered as non-numeric value.
If this field is not set, the postamble is deleted.
Success
Numeric variable name. Used to store the execution result. For
the successful result, 1 is entered. Otherwise, 0 is entered.
Terminator
Terminator, DEFAULT, EOI, CR/LF+EOI, LF+EOI, CR/LF,
LF, or NONE (not specified)
Timeout
Timeout. The value must be less than 231 s, 1 ms resolution.
0 does not set timeout.
3- 34
Agilent EasyEXPERT User’s Guide Vol. 1, Edition 1
Application Test Definition
GPIB I/O
Read List
Reads a vector data from the specified GPIB device.
Address
GPIB address of the target device
Values
Vector variable name. Used to store the returned value.
Delimiter
Delimiter. 1 character. 0 to 9, E, e, +, -, and . (comma) cannot
be specified.
Length Actually
Read
Read STB
GP-IB Control
Numeric variable name. Used to store the number of data stored
in the vector variable.
Terminator
Terminator, DEFAULT, EOI, CR/LF+EOI, LF+EOI, CR/LF,
LF, or NONE (not specified)
Timeout
Timeout. The value must be less than 231 s, 1 ms resolution.
0 does not set timeout.
Reads the status byte of the specified GPIB device.
Address
GPIB address of the target device
Status Byte
Numeric variable name. Used to store the status byte to read.
Timeout
Timeout. The value must be less than 231 s, 1 ms resolution.
0 does not set timeout.
This area selects one from the following GPIB statements to execute.
•
Group Execution Trigger
Sends a trigger to the specified GPIB device.
•
Address
GPIB address of the target device
Timeout
Timeout. The value must be less than 231 s, 1 ms resolution.
0 does not set timeout.
Device Clear
Sends a device clear to the specified GPIB device.
Address
GPIB address of the target device
Timeout
Timeout. The value must be less than 231 s, 1 ms resolution.
0 does not set timeout.
Agilent EasyEXPERT User’s Guide Vol. 1, Edition 1
3- 35
Application Test Definition
GPIB I/O
•
Go To Local
Returns the specified GPIB device to the local state.
•
Address
GPIB address of the target device
Timeout
Timeout. The value must be less than 231 s, 1 ms resolution.
0 does not set timeout.
Local LockOut
Locks the specified GPIB device.
Example 1
Address
GPIB address of the target device
Timeout
Timeout. The value must be less than 231 s, 1 ms resolution.
0 does not set timeout.
To send the following command to Agilent B2200A switching matrix (GPIB
address 22), use Write Value function and enter the parameters as shown below.
:ROUT:SYMB:CHAN 0, 1, “Gate”
This command assigns the string Gate to the output 1 of the B2200A in the auto
configuration mode.
•
Write Value:
Address
22
Format
:ROUT:SYMB:CHAN {0}, {1}, “{2}”
Value0
0
Value1
1
Value2
Gate
Value3
(blank)
Terminator
LF+EOI
where, {0}, {1}, {2}, and {3} are the variables that can be used in the Format field,
and corresponds to the Value0, Value1, Value2, and Value3 respectively.
3- 36
Agilent EasyEXPERT User’s Guide Vol. 1, Edition 1
Application Test Definition
GPIB I/O
Example 2
After performing Example 1, enter the following query command and read the
response by using Write String and Read String functions as shown below. Use
Write String to send the command, after that use Read String to read the response.
:ROUT:SYMB:CHAN? 0, 1
This command returns the string assigned to the output 1 of the B2200A in the auto
configuration mode.
•
•
Write String:
Address
22
String
:ROUT:SYMB:CHAN? 0, 1
Terminator
LF+EOI
Read String:
Address
22
String
ReturnedValue
Length To Read
10
Length Actually Read
Length1
Terminator
LF+EOI
Terminated
Term
Timeout
1.00 s
where, ReturnedValue is a string variable to store the response of the
:ROUT:SYMB:CHAN? 0, 1 command, Length1 is a numeric variable to store the
byte length of the ReturnedValue value, and Term is a numeric variable to store the
execution result. They must be defined in the Local Variables Definition statement.
Agilent EasyEXPERT User’s Guide Vol. 1, Edition 1
3- 37
Application Test Definition
Message
Message
This component provides the setup editor that contains the following entry fields.
These are used to set up the message box that pauses program execution, appears on
the screen, and waits for the response of the user.
Message
Enter the message displayed on the message box.
User Response
This area provides the Button 1, Button 2, Button 3, and Button 4 areas.
Button 1
This area provides the following entry fields.
Button 2
Button 3
Button 4
Label
Label or name of the button placed at the left side
Selected
Variable name used in the test definition. The variable is used to store
the response of the user. The returned value is 1 if the message box is
closed by clicking this button. Otherwise, the returned value is 0.
This area provides the following entry fields.
Label
Label or name of the button placed at the second from the left
Selected
Variable name used in the test definition. The variable is used to store
the response of the user. The returned value is 1 if the message box is
closed by clicking this button. Otherwise, the returned value is 0.
This area provides the following entry fields.
Label
Label or name of the button placed at the second from the right
Selected
Variable name used in the test definition. The variable is used to store
the response of the user. The returned value is 1 if the message box is
closed by clicking this button. Otherwise, the returned value is 0.
This area provides the following entry fields.
Label
Label or name of the button placed at the right side
Selected
Variable name used in the test definition. The variable is used to store
the response of the user. The returned value is 1 if the message box is
closed by clicking this button. Otherwise, the returned value is 0.
3- 38
Agilent EasyEXPERT User’s Guide Vol. 1, Edition 1
Application Test Definition
Data Store Control
Data Store Control
This component enables or disables the test record of the application test or the
classic test used in the test definition.
Enable Creating Test Result Record
Checking this box enables the test record.
If you do not use this component, the test record is enabled.
This component cannot control the test record of the test definition. The test record
is always enabled for the test definition. For the test result output of the test
definition, see “Test Output” on page 3-14.
Agilent EasyEXPERT User’s Guide Vol. 1, Edition 1
3- 39
Application Test Definition
Command Execution
Command Execution
This component provides the setup editor that contains the following entry fields.
This component is used to execute the specified execution file (EXE file) and obtain
the execution results. For the fields to enter a variable name, only the variable name
defined in the test definition can be entered. See “Using Command Execution” on
page 3-42.
Command
Filename
File name of the Windows execution file (EXE file) to execute.
Argument
Argument or parameter to pass to the EXE file.
Write Type
Type of data to write. String (string data) or List (vector data).
•
String
Displays the Write String area used to specify the string data to write. Up to 20
string data can be defined.
•
List
Displays the Write List area that provides the following entry fields.
Values
Variable name of the List data to be passed to the EXE file.
Format
If you do not specify Format, this function passes the List data to
the EXE file. To pass a data in the List data, enter the keyword to
specify the element. See “Defining Format Field” on page 3-45.
3- 40
Agilent EasyEXPERT User’s Guide Vol. 1, Edition 1
Application Test Definition
Command Execution
Read Type
Type of data to read. String (string data), Value (numeric data), List (vector data), or
None (no response).
•
String
Displays the Read String area that provides the following entry fields.
Result
Numeric variable name. Used to store the execution result.
String
String variable name. Used to store the returned value.
Length
Actually Read
•
Numeric variable name. Used to store the byte length of the
returned value.
Value
Displays the Read Value area that provides the following entry fields.
•
Result
Numeric variable name. Used to store the execution result.
Value
Numeric variable name. Used to store the returned value.
List
Displays the Read List area that provides the following entry fields.
•
Result
Numeric variable name. Used to store the execution result.
Values
Vector variable name. Used to store the returned value.
None
This type is for the EXE file without response or data to read.
Agilent EasyEXPERT User’s Guide Vol. 1, Edition 1
3- 41
Application Test Definition
Using Command Execution
Using Command Execution
Windows execution file (.exe file) can be executed by using the Command
Execution component. Most execution files will need parameters to be sent or
returned. The parameters will be variables that can be defined on the Test
Specification tab screen or the Local Variable Definition component on the Test
Contents tab screen.
This section describes how to enter the windows execution file.
•
“Command Parameters”
•
“Defining Numeric/Vector Input Parameter”
•
“Defining String/Numeric Input Parameters”
•
“Defining Numeric Output Parameter”
•
“Defining Vector Output Parameter”
•
“Defining String Output Parameter”
•
“Defining Format Field”
Command Parameters
The Windows Command Execution component supports one input variable and one
output variable. To use multiple string input parameters or multiple numeric input
parameters, set the variable as shown below. Multiple vector input parameters and
multiple output parameters are not supported.
NOTE
•
If the command requires multiple string input parameters, use string variables.
In the Windows Command Execution component, set the Write Type to String.
Up to 20 string data can be defined.
•
If the command requires multiple numeric input parameters, use numeric
variables and set the Write Type to String. To enter the numeric variable name,
use the string built-in function. For example, enter string(Rz) to set the Rz
numeric variable.
•
If the command requires both numeric and string input parameters, use numeric
and string variables respectively, and set the Write Type to String.
Before calling the command, enter the value to the input variable by using the
ASSIGN statement.
3- 42
Agilent EasyEXPERT User’s Guide Vol. 1, Edition 1
Application Test Definition
Using Command Execution
NOTE
string built-in function
The string built-in function is used to translate a numeric expression to a string
value. Be careful about the argument for this function. If it is a numeric variable
defined with the numeric-symbol assignment, the string function execution result
will be the symbol assigned to the numeric value, not the string value just translated
from the numeric value. The numeric-symbol assignment is defined in the “Test
Specification” on page 3-5.
For the following example setup of the numeric-symbol assignment,
string(Mode) execution result at Mode=0 is the string OFF, not the string 0.
Parameter Mode, Value=0, Symbol=OFF
Defining Numeric/Vector Input Parameter
1. Define a vector variable in the Test Specification tab screen or the Local
Variable Definition component of the Test Contents tab screen.
2. Set the Write Type to List in the Windows Command Execution component.
3. Enter the variable name in the Values field of the Write List area.
For the numeric parameter, a data element of vector variable is used to store the
data for the parameter. Specify the data by using the Format field. For example,
enter {0} to specify the data in the first element of the vector variable. For the
Format field, see “Defining Format Field” on page 3-45.
For the vector parameter, ignore the Format field.
Defining String/Numeric Input Parameters
1. Define string or numeric variables in the Test Specification tab screen or the
Local Variable Definition component in the Test Contents tab screen.
2. Set the Write Type to String in the Windows Command Execution component.
3. Add a line in the Write String area.
4. Enter the variable name for the first input parameter in the first line.
If the command needs multiple input parameters, add a line and enter the
variable name for the variable in the added line. Then observe the order of
parameters.
To enter a numeric variable name, use the string built-in function. For example,
enter string(Rz) to set the Rz numeric variable.
Agilent EasyEXPERT User’s Guide Vol. 1, Edition 1
3- 43
Application Test Definition
Using Command Execution
Defining Numeric Output Parameter
1. Define a numeric variable in the Test Specification tab screen or the Local
Variable Definition component of the Test Contents tab screen.
2. Set the Read Type to Value in the Windows Command Execution component.
3. Enter the variable name in the Value field of the Read Value area.
The Result field can be blank or the name of another numeric variable defined in the
Test Specification or Local Variable Definition. The variable will be used to receive
the command execution result.
Defining Vector Output Parameter
1. Define a vector variable in the Test Specification tab screen or the Local
Variable Definition component of the Test Contents tab screen.
2. Set the Read Type to List in the Windows Command Execution component.
3. Enter the variable name in the Values field of the Read List area.
The Result field can be blank or the name of a numeric variable defined in the Test
Specification or Local Variable Definition. The variable will be used to receive the
command execution result.
Defining String Output Parameter
1. Define a string variable in the Test Specification tab screen or the Local Variable
Definition component of the Test Contents tab screen.
2. Set the Read Type to String in the Windows Command Execution component.
3. Enter the variable name in the String field of the Read String area.
The Result field and the Length Actually Read field can be blank or the name of a
numeric variable defined in the Test Specification or Local Variable Definition. The
variable will be used to receive the command execution result or the length of the
returned string data.
3- 44
Agilent EasyEXPERT User’s Guide Vol. 1, Edition 1
Application Test Definition
Using Command Execution
Defining Format Field
The Format field requires a keyword to specify a data in vector variable. The
keyword must have the style such as {I,A:F}. where,
I
Index used to specify the element. Integer, 0 or positive number.
Mandatory. 0 specifies the first element.
A
Character length of the specified data element. Positive integer for
right-aligned, or negative integer for left-aligned. If this value is not set,
the length is not specified (no limit).
F
Style of the data. See Table 3-1. If this value is not set, G is selected..
Followings are the example formats.
Table 3-1
•
{0,5:E} First element, five characters, exponential notation
•
{1,10} Second element, 10 characters, general
•
{2:x} Third element, no limit for length, hexadecimal numeric
•
{3} Fourth element, no limit for length, general
Available F values
F
Meaning
F
Meaning
C or c
Circulation
N or n
Numeric
D or d
Decimal numeric
P or p
Percent
E or e
Exponential notation
R or r
Round trip
F or f
Fixed point
X or x
Hexadecimal numeric
G or g
General
Agilent EasyEXPERT User’s Guide Vol. 1, Edition 1
3- 45
Application Test Definition
Using Command Execution
Setup Example
The following example setup is used to execute a PlsdivMeasureId command that
has two numeric inputs and four numeric outputs.
ranging and id_range are numeric variables used for the input parameters,
read_data is a vector variable used for the output parameters, and PassFail is a
numeric variable used to store the command execution result. They must be defined
in the Test Specification tab screen or the Local Variable Definition component on
the Test Contents tab screen. Input parameter values must be set to the variables
before executing the command. Four data will be assigned to read_data in sequence.
Figure 3-7
Windows Command Execution Setup Example
3- 46
Agilent EasyEXPERT User’s Guide Vol. 1, Edition 1
4
Function Details
Function Details
This chapter explains the following measurement functions of Agilent B1500 and
EasyEXPERT.
•
“I/V Sweep Measurement”
•
“Multi Channel I/V Sweep Measurement”
•
“I/V-t Sampling Measurement”
•
“C-V Sweep Measurement”
•
“SPGU Module”
•
“Sweep Abort Function”
•
“Standby Function”
•
“Bias Hold Function”
•
“Current Offset Cancel”
•
“SMU CMU Unify Unit”
•
“Atto Sense and Switch Unit”
•
“SMU/PG Selector”
•
“Module Selector”
•
“Ultra High Current Expander/Fixture”
•
“HVSMU Current Expander”
•
“Ultra High Voltage Expander”
•
“SMU Ranging Mode”
•
“SMU Compliance”
•
“SMU Pulse”
•
“SMU Measurement Time”
•
“SMU Filter”
•
“SMU Series Resistor”
•
“Interlock Function”
•
“Auto Power Off Function”
•
“Initial Settings”
4- 2
Agilent EasyEXPERT User’s Guide Vol. 1, Edition 1
Function Details
I/V Sweep Measurement
I/V Sweep Measurement
For the I/V sweep measurements, sweep source channels (SMU) perform staircase
sweep output of voltage or current, while monitor channels (SMU) measure voltage
or current for each sweep step. According to the output function, the following
measurements are available. See Figure 4-1 for the SMU output function.
•
“Basic Sweep Measurement” by using VAR1 function
•
“Subordinate Sweep Measurement” by using VAR1 and VAR2 functions
•
“Synchronous Sweep Measurement” by using VAR1 and VAR1’ functions,
VAR2 function is also available
•
“Pulsed Sweep Measurement”
This is the basic, subordinate, or synchronous sweep measurement using a pulse
output SMU. Only one pulse output SMU is available.
Figure 4-1
SMU Output Function and Sweep Output
9$5
9$5
9$5·
Available Measurement Resources
SMUs and SPGUs can be used. SMU can be constant voltage/current source or
pulse voltage/current source and perform voltage/current measurement. SPGU can
be pulse voltage source. See “SPGU Module” on page 4-27 for using the SPGU.
If multiple measurement channels are used, the channels perform measurement in
order. See “Multiple Measurement Channels” on page 4-69.
Agilent EasyEXPERT User’s Guide Vol. 1, Edition 1
4- 3
Function Details
I/V Sweep Measurement
Output Range
Output range of the sweep source channel is automatically set to the following
range.
•
minimum range covers all sweep output values in Linear sweep.
•
minimum range covers all sweep output values in Log voltage sweep.
•
optimum range for output value every sweep step in Log current sweep.
Basic Sweep Measurement
Basic sweep measurement uses the primary sweep source (VAR1). You can select
any combination of Direction and Linear/Log as shown in Figure 4-2.
•
•
Figure 4-2
Direction
•
Single source channel sweeps the output from user specified start value to
stop value.
•
Double source channel sweeps the output from user specified start value to
stop value, then from stop value to start value.
Linear/Log
•
Linear staircase
•
Logarithmic staircase
Staircase Sweep Outputs
See “I/V Sweep” on page 2-4 for the GUI.
4- 4
Agilent EasyEXPERT User’s Guide Vol. 1, Edition 1
Function Details
I/V Sweep Measurement
The following setup is required to perform the basic sweep measurements.
1. Select the following on the Channel Setup tab screen.
•
Select VAR1 for the Function of the SMU used for VAR1.
•
Select V, VPULSE, or COMMON for the Mode of current monitor SMU, or
I or IPULSE for voltage monitor SMU. Pulse is available only for one SMU.
2. Specify the following parameters for VAR1 on the Measurement Setup tab
screen.
Direction
Single or double sweep.
Linear/Log
Linear or logarithmic sweep. For logarithmic sweep, the
number steps in one decade is 10, 25, or 50.
Start
Start value of sweep. Allowable range of start depends on
output range of sweep source. For logarithmic sweep, start
must not be zero.
Stop
Stop value of single sweep or turning back value of double
sweep. Allowable range of stop depends on output range of
sweep source. For logarithmic sweep, stop must have same
polarity as start, and must not be zero.
Step, No of Step
For linear sweep, step is step increment of sweep. No of Step
is calculated from start, stop, and step.
For logarithmic sweep, step is invalid. Number of sweep
steps is calculated from start, stop, and number of steps in
one decade.
Calculated number of steps must be in range: 1 to 10001.
Compliance
Compliance value of sweep source. Allowable range of
compliance depends on the compliance range of sweep
source.
Pwr Comp
(Optional) Power compliance value of sweep source.
Allowable range depends on power compliance range of
sweep source.
Hold
Time required for DUT to settle after forcing start value.
0 to 655.35 s with 10 ms resolution.
Delay
Time required for DUT to settle after stepping the output.
0 to 65.535 s with 100 s resolution.
Agilent EasyEXPERT User’s Guide Vol. 1, Edition 1
4- 5
Function Details
I/V Sweep Measurement
Figure 4-3
Basic Sweep Measurement
Subordinate Sweep Measurement
For subordinate sweep measurement, you set up a secondary sweep source (VAR2)
in addition to a primary sweep source (VAR1). After VAR1 sweep is completed, the
output of VAR2 sweep source is increased or decreased by the specified step value,
then the VAR1 sweep source is swept again.
Only the linear single sweep is available for the VAR2.
The following setup is required to perform the subordinate sweep measurements.
See “I/V Sweep” on page 2-4 for the GUI.
1. Select the following on the Channel Setup tab screen.
•
Select VAR1 for the Function of the SMU used for VAR1.
•
Select VAR2 for the Function of the SMU used for VAR2.
•
Select V, VPULSE, or COMMON for the Mode of current monitor SMU, or
I or IPULSE for voltage monitor SMU. Pulse is available only for one SMU.
4- 6
Agilent EasyEXPERT User’s Guide Vol. 1, Edition 1
Function Details
I/V Sweep Measurement
2. Set the VAR1 channel as shown in “Basic Sweep Measurement”.
3. Specify the following parameters for VAR2 on the Measurement Setup tab
screen.
Start
Start value of secondary sweep. Allowable range of start
depends on the output range of secondary sweep source.
Stop
Stop value of secondary sweep is calculated from start, step,
and number of steps. Allowable range of stop depends on
the output range of secondary sweep source.
Step
Step increment of secondary sweep.
No of Step
Number of secondary sweep steps (N2). 1 to 1001.
Then, the following formula must be satisfied.
1 N1 N2 128128 (N1: number of primary sweep steps)
Figure 4-4
Compliance
Compliance value of secondary sweep source. Allowable
range of compliance depends on the compliance range of
secondary sweep source.
Pwr Comp
(Optional) Power compliance value of secondary sweep
source. Allowable range of power compliance depends on
the power compliance range of sweep source.
Subordinate Sweep Measurement
Agilent EasyEXPERT User’s Guide Vol. 1, Edition 1
4- 7
Function Details
I/V Sweep Measurement
Synchronous Sweep Measurement
For synchronous sweep measurement, you set up a synchronous sweep source
(VAR1’) in addition to a primary sweep source (VAR1).
The relationship between the output of primary and synchronous sweep sources is
determined by the following equation:
synchronous output = primary output ratio + offset
The synchronous output determined by above equation must not exceed the output
range of synchronous sweep source.
The following parameter settings are effective for the VAR1’ sweep source.
•
Direction (Single or Double)
•
Linear/Log
The following setup is required to perform the synchronous sweep measurements.
See “I/V Sweep” on page 2-4 for the GUI.
1. Select the following on the Channel Setup tab screen.
•
Select VAR1 for the Function of the SMU used for VAR1.
•
Select VAR1’ for the Function of the SMU used for VAR1’.
•
Select V, VPULSE, or COMMON for the Mode of current monitor SMU, or
I or IPULSE for voltage monitor SMU. Pulse is available only for one SMU.
Mode of VAR1 and VAR1’ must be the same, voltage or current.
2. Set the VAR1 channel as shown in “Basic Sweep Measurement”.
3. Specify the following parameters for VAR1’ on the Measurement Setup tab
screen.
Offset
Offset between outputs of primary and synchronous sweep
sources.
Ratio
Ratio between outputs of primary and synchronous sweep
sources.
Compliance
Compliance value of synchronous sweep source. Allowable
range of compliance depends on the compliance range of
synchronous sweep source.
Pwr Comp
(Optional) Power compliance value of synchronous sweep
source. Allowable range of power compliance depends on
the power compliance range of synchronous sweep source.
4- 8
Agilent EasyEXPERT User’s Guide Vol. 1, Edition 1
Function Details
I/V Sweep Measurement
Figure 4-5
Synchronous Sweep Measurement
Pulsed Sweep Measurement
For a sweep measurement, a sweep or constant source SMU can be a pulse source.
But only one SMU can be a pulse source.
Figure 4-6 shows the relationship between pulse source and other sources. Each step
of the primary sweep source is synchronized with output of the SMU pulse source.
Measurements are made during the pulse output. For the pulsed sweep
measurement, the delay time cannot be set.
The following setup is required to perform the pulsed sweep measurements. See
“I/V Sweep” on page 2-4 for the GUI.
1. Select the following on the Channel Setup tab screen.
•
Select VAR1 for the Function of the SMU used for VAR1.
•
Select V, VPULSE, or COMMON for the Mode of current monitor SMU, or
I or IPULSE for voltage monitor SMU. Pulse is available only for one SMU.
2. Set the VAR1 channel as shown in “Basic Sweep Measurement”.
3. Specify the following parameters for the SMU Pulse on the Measurement Setup
tab screen.
Agilent EasyEXPERT User’s Guide Vol. 1, Edition 1
4- 9
Function Details
I/V Sweep Measurement
Period
SMU forces the next pulse after specified pulse period.
Width
Time from when SMU output starts to change from base
value to time when SMU starts to return from peak value.
Measurements are made while the peak value is output.
Base
The base output value of the SMU pulse.
Pulse peak value
Pulse peak value depends on the Function setting of the pulse source SMU. See
Table 4-1.
Table 4-1
Pulse Peak and Function
Function
CONST
Measurement
channel
Pulse peak
Source value in the Constants area
VAR1
Calculated from the Start, Stop, Step values of the VAR1.
VAR2
Calculated from the Start, Stop, No of Step values of the
VAR2.
VAR1’
Calculated from the Start, Stop, Step values of the VAR1
and the Offset and Ratio values of the VAR1’.
Only one SMU can be used for the measurement channel.
The measurement channel always uses the compliance range which covers the
setting compliance value. The Range button in the Measurement Setup is not
available.
4- 10
Agilent EasyEXPERT User’s Guide Vol. 1, Edition 1
Function Details
I/V Sweep Measurement
Figure 4-6
Pulse Source and Other Sources
Figure 4-7
SMU Pulse
Agilent EasyEXPERT User’s Guide Vol. 1, Edition 1
4- 11
Function Details
Multi Channel I/V Sweep Measurement
Multi Channel I/V Sweep Measurement
Multi Channel I/V Sweep measurement is similar to I/V Sweep measurement.
Changes from I/V Sweep are listed below.
•
All SMU can be set to the VAR1 sweep source (up to 10 channels)
•
All SMU can be set to the pulse source (up to 10 channels)
•
There is no restriction for the VAR1 output mode, voltage or current
•
VAR1’ sweep mode is not available
The timing of the sweep output and measurements are shown in Figure 4-8. The DC
output channels start to output in the order in which they are listed on the Channel
Setup screen. If multiple measurement channels are used, the channels perform the
measurements in order. See “Multiple Measurement Channels” on page 4-69.
If multiple pulse output channels are used, the DC output channels start to output in
the order in which they are listed on the Channel Setup screen, and then the pulse
output channels start to output simultaneously. And the all measurement channels
perform measurements simultaneously.
Figure 4-8
Multi Channel I/V Sweep Measurements using High-Resolution A/D Converter
Voltage or current
Stop value
: Measurement
Start measurement
0
Start value
Voltage or current
Stop value
0
Start value
Delay time
Primary sweep source
Hold time
Delay time
Second sweep source
Voltage or current
Stop value
0
Start value
4- 12
Tenth sweep source
Time
Agilent EasyEXPERT User’s Guide Vol. 1, Edition 1
Function Details
I/V-t Sampling Measurement
I/V-t Sampling Measurement
For the I/V-t sampling measurements, source channels (SMU) force constant current
or voltage, and monitor channels (SMU) measure current or voltage changes at a
device under test (DUT) with a specified sampling interval.
Available Measurement Resources
SMUs and SPGUs can be used. SMU can be constant voltage source or constant
current source and perform voltage measurement or current measurement. SPGU
can be pulse voltage source. See “SPGU Module” on page 4-27 for using the SPGU.
To use the SPGU, the sampling interval must be 2 ms.
NOTE
Operation Summary
I/V-t sampling measurement is executed as explained below. See Figure 4-9. In this
example, the Output Sequence is set to SEQUENTIAL. And the bias hold function
sets the bias to the Base value.
Figure 4-9
Operation Summary
9ROWDJHRUFXUUHQW
6WDUWVVDPSOLQJ
&KDQQHORXWSXW
7LPH +ROGWLPHD
D
7LPH +ROGWLPH,QWHUYDOE
E
6RXUFHYDOXH
,QWHUYDO
7LPH RULJLQ
0HDVXUHPHQW
9ROWDJHRUFXUUHQW
6RXUFHYDOXH
%DVHYDOXH
+ROGWLPH
0HDVXUHPHQWWLPH
%DVHKROGWLPH
&KDQQHORXWSXW
7LPH
In this figure, a and b in the formula of Time indicate the time from the start of one
point measurement to the start of integration by the A/D converter.
Agilent EasyEXPERT User’s Guide Vol. 1, Edition 1
4- 13
Function Details
I/V-t Sampling Measurement
1. When the Output Sequence is SEQUENTIAL, source channels start the Source
value output in order, and the last source channel starts the Base value output
(Starts sampling). See “Source Output Sequence and Time Origin” on page
4-18.
When the Output Sequence is SIMULTANEOUS, source channels start the Base
value output simultaneously (Starts sampling).
Base value is available for all output channels for the SIMULTANEOUS mode
and the last source channel for the SEQUENTIAL mode.
2. Base Hold Time later, the source channels change the output to the Source value.
The channels keep the value until the end of the sampling measurement.
3. Another Hold Time later, the measurement channel starts measurement for the
first sampling point. If multiple channels are used, the channels perform
measurement in order. See “Multiple Measurement Channels” on page 4-69.
4. After that, the following operation is repeated with the specified time Interval.
This operation is repeated until the number of measurement result data reaches
the specified No of Samples of measurement data.
•
Measurement channels start measurement if they are ready to measure.
•
Measurement channels keep the condition if they are busy.
For the log sampling, the B1500 holds only the data that can be plotted on the
log scale in the same distance as close as possible. Only the held data is counted
in the number of measurement result data.
For the linear sampling with Interval < 2 ms, if the total measurement time runs
over the specified time Interval No of Samples, the sampling measurement will
be stopped even if the number of measurement result data is less than the
specified No of Samples.
5. The source channels stop the output, and the I/V-t sampling measurement is
completed.
If the bias hold function is enabled, the source channels force the Base or Source
value.
NOTE
Time data and index
For the log sampling, the recorded data will be only the data that can be plotted on
the log scale in the same distance as close as possible. The index of the first data is
1. And the index of the following data will increase by 1. For the linear sampling,
see “Time Data and Index” on page 4-17.
4- 14
Agilent EasyEXPERT User’s Guide Vol. 1, Edition 1
Function Details
I/V-t Sampling Measurement
Setup Parameters
The following setup is required to perform the I/V-t sampling measurements. See
“I/V-t Sampling” on page 2-21 for the GUI.
NOTE
If you set Interval < 0.002 s
Sampling mode must be linear. This setting is not permitted for the log sampling.
Also SPGU is not available.
All measurement channels must use the high speed A/D converter (ADC). This
setting is not permitted if a measurement channel uses the high resolution ADC.
If the multiple measurement channels are used, all channels perform measurement
in parallel.
If the measurement ranging mode is not the fixed mode, the measurement channels
automatically select the minimum range that covers compliance value set to the
channel.
If the measurement time is expected to be longer than Interval, the measurement
channels automatically adjust the number of averaging samples (ADC settings) to
keep the sampling interval.
1. Select the following on the Channel Setup screen.
•
Select SMUs used for constant voltage sources or constant current sources.
•
Select V or COMMON for Mode of current monitor SMU, or I for voltage
monitor SMU.
2. Specify the following parameters for the SMU in the Sampling Parameter area
on the Measurement Setup screen.
Linear/Log
Sampling mode. LINEAR for linear sampling. LOG10,
LOG25, LOG50, LOG100, LOG250, or LOG500 for
logarithmic sampling.
For the logarithmic sampling, the number after LOG
indicates the number of measurement data in a decade. For
example, LOG10 mode is used to get 10 data/decade.
Interval
Interval of the sampling, in seconds. 0.002 to 65.535 s,
0.001 s resolution.
Interval < 0.002 s in 0.00001 s resolution is also available
for the linear sampling. It must satisfy the following
formula. See NOTE above.
Agilent EasyEXPERT User’s Guide Vol. 1, Edition 1
4- 15
Function Details
I/V-t Sampling Measurement
Interval 0.0001 + 0.00002 (number of measurement
channels-1)
No of Samples
Number of samples. Integer. 1 to the following value.
For linear: 100001 / (number of measurement channels)
For logarithmic: 1 + (number of data for 11 decades)
Total Sampling
Time
This field just displays the total sampling time that is the
time from the measurement start time for the first point to
the end of sampling measurement. It does not include the
hold time.
Total Sampling Time = Interval No of Samples
Output
Sequence
Hold Time
Source output sequence. SIMULTANEOUS or
SEQUENTIAL. See “Source Output Sequence and Time
Origin” on page 4-18.
Time since the Source value output until the first sampling
point, in seconds. 0 to 655.35 s, resolution 0.01 s.
The following values are also available for Interval < 0.002
s. |Hold Time| will be the time since the sampling start until
the Source value output.
-0.09 to -0.0001 s, resolution 0.0001 s.
Base Hold
Time
Hold time of the Base value output until the Source value
output, in seconds. 0 to 655.35 s, resolution 0.01 s.
3. Specify the following parameters for the SMU in the Constants area on the
Measurement Setup screen.
Base, Source
Base or Source value, in V or A.
Base value is available for all output channels for the
SIMULTANEOUS mode and the last source channel for the
SEQUENTIAL mode.
Compliance
4- 16
Compliance value, in A or V.
Agilent EasyEXPERT User’s Guide Vol. 1, Edition 1
Function Details
I/V-t Sampling Measurement
Time Data and Index
To obtain the time data, enter a variable name (e.g. Time) into the Time Stamp
Name field of the Channel Setup screen. The time data can be obtained after the
linear sampling measurement is executed, and can be expressed by the following
formula.
Time = Hold Time + Interval [(Index 1) + N] +
Time :
Variable name set to the Time Stamp Name field of the Measurement
Setup screen. Time data is returned.
Index :
Variable name set to the Index Name field of the Measurement Setup
screen. Data index is returned. Maximum value is 2147483647.
Interval :
Sampling interval. Defined in the Measurement Setup screen.
Hold Time : Hold time. Defined in the Measurement Setup screen.
N:
Number of samplings performed while one point measurement was
executed. This value is 0 if the sampling interval is longer than the
measurement time.
:
Time from the start of one point measurement to the start of
integration by the A/D converter.
If the sampling interval is longer than the actual measurement time, measurement
channels repeat measurement with the specified sampling interval. However, if the
sampling interval is shorter than the measurement time, the measurement interval
will be integral multiples of the specified sampling interval. Example for Hold Time
=10 ms, Interval=5 ms, and the following Time values is shown in Figure 4-10. In
this case, N=3.
Figure 4-10
•
Time (for Index=1) = 10 ms = 10 + 5 [(1 1) + 0] ms
•
Time (for Index=2) = 30 ms = 10 + 5 [(2 1) + 3] ms
Sampling and Measurement Timing
,QWHUYDO
%DVHKROGWLPH
DQG+ROGWLPH 0HDVXUHPHQWWLPH
7LPH
D
E
7LPHDW,QGH[ 7LPHDW,QGH[ DE7LPHIURPWKHVWDUWRIPHDVXUHPHQWWRWKHVWDUWRILQWHJUDWLRQ
Agilent EasyEXPERT User’s Guide Vol. 1, Edition 1
4- 17
Function Details
I/V-t Sampling Measurement
Source Output Sequence and Time Origin
When the Output Sequence is SEQUENTIAL, source channels start output in order.
The order is top to bottom of the channels defined in the Channel Setup screen. The
order of bias stop is bottom to top.
When the Output Sequence is SIMULTANEOUS, source channels start output
simultaneously. And the source channels stop output at the same time.
The time origin is when the source output value is changed from Base to Source.
Sampling Completion
The sampling measurement completes when one of the following conditions is
satisfied:
•
The event of the stop condition occurs. See “Stop Condition” on page 4-18.
•
The measurement channels obtain the specified number (No of Samples) of
measurement data.
•
The total measurement time runs over the time Interval No of Samples for the
linear sampling with Interval < 2 ms.
•
The Stop button is clicked.
•
An emergency condition occurs on the B1500.
•
Interlock terminal is opened when a channel is in the high voltage output status.
Stop Condition
The stop condition is defined by using the Stop Condition fields on the
Measurement Setup screen. This function stops the measurement as shown below.
1. Compares the value of parameter set to the Name field and the value defined in
the Threshold field.
2. Counts how many times the selected Event occurs.
3. When the count reaches the value defined in the No. of Events field, sampling is
stopped immediately.
For the setup parameters of the stop condition, see “I/V-t Sampling” on page 2-21.
4- 18
Agilent EasyEXPERT User’s Guide Vol. 1, Edition 1
Function Details
C-V Sweep Measurement
C-V Sweep Measurement
For the C-V sweep measurements, the multi frequency capacitance measurement
unit (MFCMU) forces AC signal, performs staircase sweep output of DC bias
voltage, and measures impedance for each sweep step.
Available Measurement Resources
MFCMU can be used for the C-V sweep measurements. For the DC bias output over
25 V, use the SMU CMU Unify Unit (SCUU) and SMUs. This expands the
voltage range up to 100 V. Or use the high voltage bias-T and HVSMU to expand
the voltage range up to 3000 V.
Setup Parameters
The following setup is required to perform the C-V sweep measurements.See “C-V
Sweep” on page 2-26 for the GUI.
1. Set the following on the Channel Setup tab screen.
•
Set V Name of the CMU.
•
If you use a constant current or voltage source, set Mode (I, V, or
COMMON) and V Name or I Name of the SMU.
2. Specify the following parameters for the CMU on the Measurement Setup tab
screen.
Model, x Name
Measurement parameters. See Table 4-2.
Direction
Single or double sweep.
Linear/Log
Linear or logarithmic sweep. For logarithmic sweep, the
number steps in one decade is 10, 25, or 50.
Start, Stop
Start is the DC bias sweep start value. Stop is the stop value
of single sweep or turning back value of double sweep. The
CMU can force up to 25 V.
If the SCUU (SMU CMU Unify Unit) is used, up to 100
V output is available.
If the high voltage bias-T and HVSMU are used, up to
3000 V output is available.
Agilent EasyEXPERT User’s Guide Vol. 1, Edition 1
4- 19
Function Details
C-V Sweep Measurement
Step, No of Step
Step is step increment of sweep. No of Step value is
calculated from start, stop, and step. Calculated number of
steps must be in range: 2 to 1001.
Frequency List
AC signal frequency. 1 kHz to 5 MHz. Resolution: 6 digits.
F Name
Variable name of frequency list.
AC Level
AC signal level. 10 mV to 250 mV, 1 mV resolution.
Mode, Factor
One of the following is used for setting the measurement
time.
For Mode=AUTO, you set the number of samples used for
averaging of the measurement data. The initial value is the
predefined constant, and you set the multiple number to
Factor. Available Factor values are 1 to 1023, integer.
For Mode=PLC, you set the integration time of the A/D
converter. The initial value is 1 power line cycle (20 ms for
50 Hz, 16.7 ms for 60 Hz), and you set the multiple number
to Factor. Available Factor values are 1 to 100, integer.
NOTE
Hold
Hold time. The time required for DUT to settle after forcing
start value. 0 to 655.35 s with 10 ms resolution.
Delay
Time required for DUT to settle after stepping the DC bias
output value. 0 to 65.535 s with 100 s resolution.
For a more accurate measurement, perform correction data measurement at the
measurement frequency before starting the capacitance measurement.
If the measurement frequency is not included in the list of default frequencies below,
click the Advanced Options... button and set the measurement frequency on the
Frequency area of the Advanced Options for CMU Calibration window.
Default frequencies:
1 k, 2 k, 5 k, 10 k, 20 k, 50 k, 100 k, 200 k, 500 k, 1 M, 1.2 M, 1.5 M, 2 M, 2.5 M,
2.7 M, 3 M, 3.2 M, 3.5 M, 3.7 M, 4 M, 4.2 M, 4.5 M, 5 MHz
4- 20
Agilent EasyEXPERT User’s Guide Vol. 1, Edition 1
Function Details
C-V Sweep Measurement
Table 4-2
MFCMU Measurement Parameters
Primary Parameter
Secondary Parameter
R (resistance, )
X (reactance, )
G (conductance, S)
B (susceptance, S)
Z (impedance, )
(phase, radian)
Z (impedance, )
(phase, degree)
Y (admittance, S)
(phase, radian)
Y (admittance, S)
(phase, degree)
Cp (parallel capacitance, F)
G (conductance, S)
Cp (parallel capacitance, F)
D (dissipation factor)
Cp (parallel capacitance, F)
Q (quality factor)
Cp (parallel capacitance, F)
Rp (parallel resistance, )
Cs (series capacitance, F)
Rs (series resistance, )
Cs (series capacitance, F)
D (dissipation factor)
Cs (series capacitance, F)
Q (quality factor)
Lp (parallel inductance, H)
G (conductance, S)
Lp (parallel inductance, H)
D (dissipation factor)
Lp (parallel inductance, H)
Q (quality factor)
Lp (parallel inductance, H)
Rp (parallel resistance, )
Ls (series inductance, H)
Rs (series resistance, )
Ls (series inductance, H)
D (dissipation factor)
Ls (series inductance, H)
Q (quality factor)
Agilent EasyEXPERT User’s Guide Vol. 1, Edition 1
4- 21
Function Details
C-V Sweep Measurement
Measurement Parameters
MFCMU performs impedance measurement, calculates parameters shown in Table
4-2, and returns the calculated data. A combination can be selected for the return
data. For example and for your reference, select the parallel measurement mode
(Cp-G or Cp-D) for the low capacitance measurements (100 or more of
impedance), and select the series measurement mode (Cs-Rs) for the high
capacitance measurements (100 or less of impedance). Because the low
capacitance yields high reactance, which implies that the effect of the parallel
resistance has relatively more significance than that of series resistance.
About Impedance Measurements
All circuit components, resistors, capacitors, or inductors, have parasitic
components, for example unwanted resistance in capacitors, unwanted resistance in
inductors, and unwanted inductance in resistors. Thus simple components should be
modeled as complex impedances.
Impedance definitions and vector representation of impedance are shown in Figure
4-11. Impedance Z is the total opposition that a circuit or device offers to the flow of
alternating current at a given frequency. Z contains a real and an imaginary part, and
it is expressed in rectangular form as resistance R and reactance X, or in polar form
as magnitude of impedance |Z| and phase .
In addition to these parameters, the quality factor Q and dissipation factor D are
used to describe the quality of components.
Figure 4-11
Impedance and Parameter Calculation
,
=
9
=
9
,
,FXUUHQW$
9YROWDJH9
,PDJLQDU\SDUW
_=_
M;
= 5M; _=_aP
_=_ 5;
_;_
P WDQ
5
5 5V
; J\I/
_;_
4 5
'
4- 22
=LPSHGDQFH
5UHVLVWDQFH
;UHDFWDQFH
PSKDVHGHJUHHRUUDGLDQ
5VVHULHVUHVLVWDQFH
IIUHTXHQF\+]
/LQGXFWDQFH+
4TXDOLW\IDFWRU
'GLVVLSDWLRQIDFWRU
P
5
5HDOSDUW
Agilent EasyEXPERT User’s Guide Vol. 1, Edition 1
Function Details
C-V Sweep Measurement
For your reference, select the parallel measurement mode (Lp-G, Lp-D, or anything)
for the high inductance measurements (100 or more of impedance), and select the
series measurement mode (Ls-Rs, or anything) for the low inductance
measurements (100 or less of impedance). Because the reactance of high
inductance at a given frequency is relatively high (compared with that of a low
inductance), so the parallel resistance becomes more significant than the series
component.
Figure 4-12
Admittance and Parameter Calculation
<
=
*M% _<_a7
_<_ *%
_%_
7 WDQ
P
*
% J\I&
_%_
4 *
'
*
5S
*
7
5HDOSDUW
<DGPLWDQFH6
*FRQGXFWDQFH6
M%
%VXVFHSWDQFH6
_<_
7SKDVHGHJUHHRUUDGLDQ
IIUHTXHQF\+]
&FDSDFLWDQFH)
4TXDOLW\IDFWRU
,PDJLQDU\SDUW
'GLVVLSDWLRQIDFWRU
5SSDUDOOHOUHVLVWDQFH
In some case, the reciprocal of impedance (admittance) Y is used. Figure 4-12
shows the vector representation of admittance. As impedance Z, Y contains a real
and an imaginary part, and is expressed in rectangular form as conductance G and
susceptance B, or in polar form as magnitude of admittance |Y| and phase .
Agilent EasyEXPERT User’s Guide Vol. 1, Edition 1
4- 23
Function Details
C-V Sweep Measurement
Four-Terminal Pair Configuration
Generally, any mutual inductance, interference of the measurement signals, and
unwanted residual factors in the connection method incidental to ordinary
termination methods will have significant effects on the measurements, especially at
a high frequency. The MFCMU employs the four-terminal pair (4TP) measurement
configuration which permits easy, stable, and accurate measurements and avoids the
measurement limitations inherent to such factors.
Figure 4-13 shows the four-terminal pair measurement principle. The measurement
terminals consist of the following four coaxial connectors.
Figure 4-13
•
Hcur: High current
•
Hpot: High potential
•
Lpot: Low potential
•
Lcur: Low current
Four-Terminal Pair Measurement Principle
0XOWLIUHTXHQF\&08
2XWHUVKLHOGRU*XDUG
+FXU
,[
,[
+SRW
9[ 9
6\VWHPJURXQG
9[
'87
$XWREDODQFHEULGJH
/SRW
$
/FXU
,[
9LUWXDOJURXQG
,[
The four-terminal pair measurement method has the advantage in both low and high
impedance measurements. The outer shield conductors work as the return path for
the measurement signal current (they are not grounded). The same current flows
through both the center conductors and outer shield conductors (in opposite
directions), but no external magnetic fields are generated around the conductors (the
magnetic fields produced by the inner and outer current completely cancel each
other). Because the measurement signal current does not develop an inductive
magnetic field, test leads do not contribute additional errors due to self or mutual
inductance between the individual leads.
4- 24
Agilent EasyEXPERT User’s Guide Vol. 1, Edition 1
Function Details
C-V Sweep Measurement
To realize accurate measurements using the four-terminal pair measurement
method, the following connection tips are important. See Figure 4-13 and Figure
4-14.
•
The signal path from MFCMU to DUT must be as short as possible.
•
The four-terminal pair configuration must be extended as close as possible to the
DUT.
•
The outer shield conductors must be connected together at the extended cable
ends. Then take care of contacts. They must be electrically isolated.
This is the same as connecting the CMU return terminals of the atto sense/switch
unit (ASU) or the guard switch unit (GSWU).
•
The signal path from the shield ends to the DUT must be as short as possible.
•
If it is possible, make protective guard (plate, shield, or anything) around the
DUT, and connect it to the outer shield conductor of the four-terminal pair
configuration. This minimizes the effects of stray capacitance and electrical
noise. Then take care of contacts. The guard must be electrically isolated.
•
The Low (Lcur, Lpot) terminal must be prevented from stray capacitance and
guard capacitance. If the measurement terminal has to be connected to the wafer
chuck, use the High (Hcur, Hpot) terminal to connect to the wafer chuck.
Error Correction
The MFCMU is equipped with the error correction function used to realize accurate
impedance measurements. The correction function minimizes the effects of the error
elements in the extension cables and the DUT interface such as manipulator and
probe card.
•
Phase compensation
Corrects phase error caused by extending measurement cables.
•
Open correction
Corrects for stray admittance. Effective for high impedance measurements.
•
Short correction
Corrects for residual impedance. Effective for low impedance measurements.
•
Load correction
Corrects any error by using the working standard.
Agilent EasyEXPERT User’s Guide Vol. 1, Edition 1
4- 25
Function Details
C-V Sweep Measurement
The MFCMU will internally perform the error correction for the CMU cables and
CMU accessories that keep the four-terminal pair configuration.
For the measurements for evaluating DUT against a working standard, perform the
open/short/load correction.
However, you have to consider that some parasitic remain in measurement path
even after performing corrections. To minimize the influence of parasitic, make the
signal path from the shield ends to the DUT as short as possible.
To perform the phase compensation and error correction, see “CMU Calibration” on
page 1-60.
Figure 4-14
Error Correction
0XOWLIUHTXHQF\&08
2XWHUVKLHOG
(UURUHOHPHQWV
+FXU
+SRW
6\VWHPJURXQG
$XWREDODQFHEULGJH
9[
9
&08UHWXUQ
'87
ORZ
9LUWXDOJURXQG
/FXU
&RQQHFWLRQ
(UURUFRUUHFWLRQ
4- 26
KLJK
/SRW
$
9[
WHUPLQDOSDLUV
LQWHUQDO
WHUPLQDO
H[WHUQDO2SHQ6KRUW/RDG
Agilent EasyEXPERT User’s Guide Vol. 1, Edition 1
Function Details
SPGU Module
SPGU Module
Only for the B1500A. High voltage SPGU is a pulse generator module designed for
semiconductor parametric test applications and provides the following key
functions. The SPGU can be controlled by using the SPGU Control classic test or
the SPGU setup function in the I/V Sweep, Multi Channel I/V Sweep, I/V List
Sweep, and I/V-t Sampling classic tests.
•
Number of output channels: 2 channels per module
•
Output impedance: 50
•
Output level: 0 to ± 40 V (open load), ± 20 V (50 load)
•
SPGU operation mode (effective for all channels installed in B1500A):
PG (pulse generator) or ALWG (arbitrary linear waveform generator)
•
Channel output operation mode:
Free run, duration, or pulse count (PG mode)/sequence count (ALWG mode)
Free run mode is not available for the SPGU Control classic test.
•
PG output mode:
2-level pulse or 3-level pulse, for each channel
Figure 4-15
•
Pulse switch, which is more durable than mechanical relays, and better suited for
frequent switching applications.
•
Automatic voltage level adjustment by specifying load impedance of DUT
SPGU Simplified Circuit Diagram
50 7
Pulse switch
Pulse switch
50 7
Output 1
PG 2-level
or 3-level
or
ALWG
NOTE
Output 2
PG 2-level
or 3-level
or
ALWG
To use the SPGU for I/V-t Sampling tests, the sampling interval must be 2 ms.
Agilent EasyEXPERT User’s Guide Vol. 1, Edition 1
4- 27
Function Details
SPGU Module
PG Operation Mode
In the PG mode (pulse generator operation mode), the SPGU outputs 2-level or
3-level pulse voltage as shown in Figure 4-16.
The SPGU channels simultaneously start the pulse output and repeat the output
every pulse period. The channels continue the pulse output until the specified time
elapses or the repeat count reaches the specified number of pulses.
For the SPGU pulse setup, see “SPGU Pulse Setup Parameters” on page 4-29.
For a summary of source output operation in sweep or sampling measurement mode,
see “Pulse Output Operation Summary” on page 4-31.
Figure 4-16
3-Level Pulse Output Examples
Output of
Primary Pulse
1V
Pulse period
1V
0V
Width1
Delay1
Pulse period
0V
Delay2
Width2
0V
-1 V
3-Level pulse output
Output of
Additional Pulse
-1 V
Output of
Primary Pulse
3V
Pulse period
2V
4V
Width1
Delay1
Pulse period
3V
Output of
Additional Pulse
1V
2V
3-Level pulse output
0V
Delay2
Width2
4- 28
Agilent EasyEXPERT User’s Guide Vol. 1, Edition 1
Function Details
SPGU Module
SPGU Pulse Setup Parameters
The following setup is required to apply the SPGU pulse. See “SPGU Control” on
page 2-61 for the GUI.
1. Set the following for the SPGU channel on the Channel Setup tab screen.
•
Set the V Name of the SPGU.
•
Set the Mode to VPULSE. This sets the PG mode. Do not set to ALWG.
2. On the SPGU Pulse Setup window, specify the following parameters for the
SPGU. See Figure 4-17 for the pulse setup parameters.
Period
Pulse period. 20 ns to 10 s, 10 ns resolution.
Operation
FREE RUN, PULSE COUNT, or DURATION.
In the FREE RUN mode, the SPGU continues the pulse
output until the measurement is completed or stopped. Not
available for the SPGU Control classic test.
For the PULSE COUNT mode, specify the number of
pulses, within the range of 1 to 1000000. The SPGU will
output the specified number of pulses.
For the DURATION mode, specify the total time to output,
within the range of 1 s to 31556926 s (1 year). The SPGU
will continue to output until the specified time elapses.
Type
2-Level Pulse or 3-Level Pulse. If you choose 3-Level
Pulse, the Additional Pulse fields become effective.
Base, Peak
Pulse base and peak voltage. 0 to ± 40 V (open load), ± 20
V (50 load), 1 mV resolution.
Delay
Delay time. 0 s to Period-20 ns, 2.5 ns resolution.
Resolution will be set at 10 ns if the pulse transition time is
> 8 s.
Width
Pulse width. 10 ns to Period-10 ns, 2.5 ns resolution.
Resolution will be set at 10 ns if the pulse transition time is
> 8 s.
Leading,
Trailing
Pulse transition time. 8 ns to 400 ms, 2 ns resolution.
Resolution will be set at 8 ns if the pulse transition time is >
8 s.
Agilent EasyEXPERT User’s Guide Vol. 1, Edition 1
4- 29
Function Details
SPGU Module
3. (Optional) Set the Additional Pulse fields for the 3-Level Pulse. 3-level pulses
can be achieved by the Primary Pulse and the Additional Pulse. See Figure 4-16
for examples.
4. On the Load Z Setup window, specify the load impedance of the DUT (device
under test). The value is used to adjust the SPGU output voltage automatically.
The SPGU will output the voltage close to the specified Base or Peak value.
5. (Optional) On the Pulse Switch Setup window, enable the pulse switch, which is
the semiconductor relay mounted in the SPGU output and is used to open the
SPGU channel output. This relay is more durable than mechanical relays, and is
better suited for frequent switching applications.
SW Sync
ENABLE (enables the pulse switch) or DISABLE (disables
the pulse switch).
Switching of the pulse switch status (open and close) will be
controlled automatically and synchronized with the output
pulse, as shown in Figure 4-17.
Delay, Width, and Normal fields will be active when SW Sync=ENABLE.
Figure 4-17
Delay
Delay time from start of pulse output to changeover of pulse
switch. 0 s to Period-100 ns, 10 ns resolution.
Width
Duration to hold the switched state of the pulse switch.
100 ns to Period-Delay ns, 10 ns resolution.
Normal
Switch status in the pulse switch normal condition. CLOSE
(normally closes the pulse switch) or OPEN (normally
opens the pulse switch). The pulse switch will change the
status after the Delay-sw time and keep the status until the
Width-sw time elapses, as shown in Figure 4-17. This
operation is repeated every pulse period.
Pulse Setup Parameters
Start
Leading
V/10
Peak
V/10
V: Pulse level
V/10
Width
Delay
Trailing
Base
V/10
Delay
Period
Normally open
Close
Pulse switch
Width-sw
Delay-sw
4- 30
Close
Open
Delay-sw
Agilent EasyEXPERT User’s Guide Vol. 1, Edition 1
Function Details
SPGU Module
Pulse Output Operation Summary
The SPGU can be used for I/V Sweep, Multi Channel I/V Sweep, I/V List Sweep,
and I/V-t Sampling classic tests. The SPGU pulse output operation will differ as
shown in the following cases. Pulse output example of the sampling measurement is
shown in Figure 4-18.
Figure 4-18
•
Sampling measurement, simultaneous output mode. See Table 4-3.
•
Sampling measurement, sequential output mode. See Table 4-4
•
Sweep measurement mode. See Table 4-5.
SPGU Pulse Output Example for Sampling Measurement in Free Run Mode
Simultaneous output:
Start measurement
1: SMU1
2: SPGU1
base hold time
0V
End of measurement
source
4
0V
3
0V
2
0V
1
0V
base
0V
base
3: SPGU2
0V
base
4: SMU2
0V
base
source
Sequencial output:
Start measurement
1: SMU1
2: SPGU1
End of measurement
source
0V
4
0V
0V
3
0V
2
0V
1
0V
base
3: SPGU2
0V
base
4: SMU2
0V
base
base hold time
source
Agilent EasyEXPERT User’s Guide Vol. 1, Edition 1
4- 31
Function Details
SPGU Module
Table 4-3
Pulse output
conditions
Duration >
Measurement
time
Output Timing for I/V-t Sampling, Simultaneous
Source Channel Operation
Starting
During measurement
After measurement
Ending
SMUs and
SPGUs start
the base value
output
simultaneously
.
After the base hold
time, SMUs start the
source value output and
SPGUs start pulse
output simultaneously.
SMUs continue the source
value output and SPGUs
continue pulse output until
the specified time elapses
or the repeat count reaches
the specified number.
If the bias
hold
function is
ON, all
source
channels
continue
the output.
SMUs start
sampling
measurement
operation.
After that, SMUs output
the base or source value set
by the Output Value after
Measurement, and SPGUs
output the base value.
Free run
SMUs output the base or
source value set by the
Output Value after
Measurement, and SPGUs
continue pulse output.
If the bias hold function is
OFF, SPGUs output the
base value.
Duration <
Measurement
time
After the base hold
time, SMUs start the
source value output and
SPGUs start pulse
output simultaneously.
Else, all
source
output
goes to 0 V
in the
reverse
order of
the
Channel
Setup
definition.
SMUs output the base or
source value set by the
Output Value after
Measurement, and SPGUs
output the base value.
After the specified time
elapses or the repeat
count reaches the
specified number,
SPGUs output the base
value.
4- 32
Agilent EasyEXPERT User’s Guide Vol. 1, Edition 1
Function Details
SPGU Module
Table 4-4
Pulse output
conditions
Duration >
Measurement
time
Free run
Output Timing for I/V-t Sampling, Sequential
Source Channel Operation
Starting
During measurement
After measurement
Ending
Except for the
last SMU,
SMUs start the
source value
output. And
SPGUs and the
last SMU start
the base value
output. The
source output
sequence is the
definition order
on the Channel
Setup screen
(top to bottom).
After the base hold
time, the last SMU start
the source value output
and SPGUs start pulse
output simultaneously.
SMUs continue the source
value output and SPGUs
continue pulse output until
the specified time elapses
or the repeat count reaches
the specified number.
If the bias
hold
function is
ON, all
source
channels
continue
the output.
After that, the last SMU
outputs the base or source
value set by the Output
Value after Measurement,
and SPGUs output the base
value.
The last SMU outputs the
base or source value set by
the Output Value after
Measurement, and SPGUs
continue pulse output.
SMUs start
sampling
measurement
operation.
Duration <
Measurement
time
If the bias hold function is
OFF, SPGUs output the
base value.
After the base hold
time, the last SMU start
the source value output
and SPGUs start pulse
output simultaneously.
Else, all
source
output
goes to 0 V
in the
reverse
order of
the
Channel
Setup
definition.
The last SMU outputs the
base or source value set by
the Output Value after
Measurement, and SPGUs
output the base value.
After the specified time
elapses or the repeat
count reaches the
specified number,
SPGUs output the base
value.
Agilent EasyEXPERT User’s Guide Vol. 1, Edition 1
4- 33
Function Details
SPGU Module
Table 4-5
Pulse output
conditions
Duration >
Measurement
time
Free run
Duration <
Measurement
time
Output Timing for I/V Sweep, Multi Channel I/V Sweep, I/V List Sweep
Source Channel Operation
Starting
SMUs and
SPGUs start
output. The
source
output
sequence is
the
definition
order on the
Channel
Setup screen
(top to
bottom).
Then, sweep
sources
output the
start value,
constant
sources
output the
source
value, and
SPGUs
output the
base value.
The constant
sources
continue the
output until
Ending.
4- 34
During measurement
SPGUs start and continue
the pulse output.
SMUs start and perform
sweep measurement
operation.
After measurement
Ending
Sweep sources output
the start or stop value set
by the Output Value
after Measurement.
If the bias
hold
function is
ON, all
source
channels
continue the
output.
SPGUs continue the
pulse output until the
specified time elapses or
the repeat count reaches
the specified number.
After that, SPGUs
output the base value.
Sweep sources output
the start or stop value set
by the Output Value
after Measurement.
SPGUs continue pulse
output.
Else, all
source
output goes
to 0 V in the
reverse order
of the
Channel
Setup
definition.
If the bias hold function
is OFF, SPGUs output
the base value.
SPGUs start the pulse
output.
SMUs start and perform
sweep measurement
operation.
SPGUs continue the pulse
output until the specified
time elapses or the repeat
count reaches the specified
number. After that, SPGUs
output the base value.
Sweep sources output
the start or stop value set
by the Output Value
after Measurement.
SPGUs output the base
value.
Agilent EasyEXPERT User’s Guide Vol. 1, Edition 1
Function Details
SPGU Module
ALWG Operation Mode
In the ALWG mode (arbitrary linear waveform generator operation mode), SPGU
can output an arbitrary linear waveform voltage as shown in Figure 4-19. The
waveform is the voltage pattern sequence specified by the pattern data and the
sequence data, which can be created by using the Define ALWG Waveform Window
(p. 2-68).
For a summary of source output operation in sweep or sampling measurement mode,
see “Pulse Output Operation Summary” on page 4-31. One sequence output will be
handled as same as one pulse output.
Pattern data
Sequence data
Figure 4-19
Specifies all of the voltage patterns set to a channel. A pattern consists of some
vector data. A vector data is defined by the output level and the time data.
•
Number of patterns: maximum 512 for a channel
•
Number of vector data: maximum 1024-N (N: number of patterns) for defining
all patterns to a channel
•
Output level: 0 to ± 40 V (open load, 1 mV resolution)
•
Time data (incremental time): 10 ns to 671.088630 ms (10 ns resolution)
Specifies the output channel, the output pattern, the repeat count of the pattern, and
the output sequence of patterns applied in a single sequence.
•
Repeat count of a pattern: 1,048,576
•
Number of patterns in a sequence: maximum 512
ALWG Output Example
Start
1 sequence
setup change (50 ns)
SPGU1
SPGU2
initial value
initial value
Pattern2 Pattern2
Pattern1 Pattern1 Pattern1
Pattern2 Pattern2
Pattern1 Pattern1 Pattern1
SPGU2 pulse switch
(normally open) 0 11 11 11 0 11 11 11 0
initial value
initial value
011 11 11 11011 11 11 110 11 11 11 110
Agilent EasyEXPERT User’s Guide Vol. 1, Edition 1
0: Open
1: Close
4- 35
Function Details
SPGU Module
In the example in Figure 4-19, SPGU1 and SPGU2 are used. The channels output
Pattern2 twice and Pattern1 three times in one sequence, although the two patterns
for SPGU1 are the same.
The SPGU channels simultaneously start the sequence output. The sequence will be
repeated in the same way as for the pulse period. The channels continue the
sequence output until the specified time elapses or the repeat count reaches the
specified number of sequences.
NOTE
Setup delay time between the different patterns
When the pattern is changed to a pattern of a differing index, a 50 ns setup delay will
always be inserted.
There is no delay between patterns of the same index.
4- 36
Agilent EasyEXPERT User’s Guide Vol. 1, Edition 1
Function Details
Sweep Abort Function
Sweep Abort Function
This function is used to stop sweep measurement automatically when one of the
following conditions is detected. This function is useful to reduce sweep time and to
prevent damage to the device during measurement.
•
•
Effective measurement modes:
•
I/V Sweep measurement
•
Multi Channel I/V Sweep measurement
•
I/V List Sweep measurement
•
C-V Sweep measurement
Stop conditions:
•
The output reaches voltage compliance or current compliance
•
A measurement value exceeds the specified measurement range
•
An SMU oscillates
•
An error is caused in the MFCMU
This automatic sweep abort function is enabled by using the Sweep [xxxx] status
field on the Measurement Setup screen of the Classic Test definition.
•
Sweep [CONTINUE AT ANY] status: Sets the abort function OFF. Not
available if the power compliance has been set.
•
Sweep [STOP AT ANY ABNORMAL] status: Sets the abort function ON.
•
Sweep [SKIP AT ANY ABNORMAL] status: Sets the abort function ON.
However if a stop condition is detected during a subordinate sweep
measurement, this function stops the VAR1 sweep once, changes the VAR2 step
value, and continues the sweep measurement. This mode is not available for
Desktop EasyEXPERT and for I/V List Sweep and C-V Sweep measurements.
When abort occurs
After measurement is aborted, the source forces the following value.
•
Sweep source: Start value
•
Pulsed source or Pulsed sweep source: Pulse base value
Agilent EasyEXPERT User’s Guide Vol. 1, Edition 1
4- 37
Function Details
Standby Function
Standby Function
This function forces the specified DC bias outputs (standby outputs) before starting
or after stopping a measurement.
Standby Channels
Standby channels are SMU or UHVU that force the standby output. Standby
channels maintain the specified DC bias output when the standby mode is ON and in
the non-measurement state.
Standby channel cannot be set for CMU, GNDU, and SMU connected to the atto
sense and switch unit (ASU) which makes the path to the AUX port.
To specify the measurement resource connected to the selector (N1258A,
N1259A-300, N1265A) or N1266A expander, the channel must be set to the Default
output in the Configuration window.
See “Standby Channel Definition” on page 1-83 to define the standby channels and
set the standby mode.
Standby State
Standby state is the state before starting or after stopping a measurement, in which
only the standby channels perform DC bias outputs. The other channels will be in
the idle state, which is 0 V output, 100 A compliance, SMU filter OFF, and series
resistor OFF. When the standby mode is OFF and in the non-measurement state, all
channels will be in the idle state.
When the B1500 is in the standby state, the measurement trigger stops the standby
state, so the standby channels stop the standby output and the measurement channels
perform a measurement (measurement state). After the measurement, the standby
channels start the standby output (standby state). During this series of operations,
the state is never changed to the idle state. See Figure 4-20 for an example
operation.
If the bias hold function is enabled for the standby channel, after the measurement,
the channel forces the bias output set by the bias hold function. After the bias hold
period, the channel starts the standby output. During this series of operations, the
state is never changed to the idle state.
4- 38
Agilent EasyEXPERT User’s Guide Vol. 1, Edition 1
Function Details
Standby Function
Output Sequence of Standby Channels
The standby channels will start to output in order, from the top to bottom, as listed in
the Standby Channel Definition on the Standby Channel Definition window. The
order of bias stop is bottom to top.
Figure 4-20 shows the standby and measurement operations for the following
example setup. This example assumes that the channel setup is defined in the
Standby Channel Definition as follows in the order show, and that the output value
in the standby state is the same as the output value in the measurement state.
Figure 4-20
•
SMU1: Voltage source, non-standby channel
•
SMU2: Voltage source, standby channel
•
SMU3: Voltage source, standby channel
Standby Function
V1
Idle state
SMU1
V2
SMU2
Standby ON
force V
Idle state
force V
V3
force V
SMU3
Idle state
Standby state
Standby OFF
Standby state
Idle state
Measurement state
Agilent EasyEXPERT User’s Guide Vol. 1, Edition 1
4- 39
Function Details
Standby Function
To Use Standby Function
To start the standby output, click the Standby ON button on the Standby Channel
Definition window. However, if no channel has been defined as the standby channel,
the standby mode cannot be turned ON. In the standby state, the Standby ON
indicator appears at the bottom of the EasyEXPERT main screen. The Standby
Channel Definition window is opened by clicking the Standby button on the main
screen.
To stop the standby output, click the Standby OFF button on the Standby Channel
Definition window.
In the standby state, you can change the setting parameters for non-standby channels
without changing the operation state. However, if you modify the settings for the
standby channels, the operation state is changed from the standby state to the idle
state.
In the standby state, the following functions are set to OFF.
•
SMU filter
•
Series resistor
In the standby state, the following functions cannot be performed.
•
Diagnosis
•
Self-test
•
Self-calibration (SMU calibration and CMU calibration)
•
SMU zero offset measurement
•
ASU connection path change
In the standby state, self-calibration is not performed even if auto calibration is set to
ON. Also the state cannot be changed to the standby state while self-calibration is
being performed.
When the workspace is opened, it will be in the idle state.
If the workspace or EasyEXPERT is closed while the standby mode is ON, the mode
is automatically changed to OFF in the closing process.
If Windows session is stopped while the standby mode is ON, the mode is not
changed to OFF in the closing process.
4- 40
Agilent EasyEXPERT User’s Guide Vol. 1, Edition 1
Function Details
Bias Hold Function
Bias Hold Function
This function is used to keep source output after measurement. Source modules
apply the specified bias between measurements in a quick test or application test
that defines some classic test setups, or a repeat measurement. And the source
modules change the output value and the unused modules are disconnected when the
next measurement is started.
Output channels
and output value
If the bias hold function is OFF, the channel stops the output immediately after
measurement.
If the function is ON, the channel continues the output as shown below.
I/V Sweep measurement:.
•
VAR1 and VAR1’ output channels: Sweep start or stop value
•
VAR2 output channel: Sweep stop value
•
CONST output channels: Output value
•
SMU pulse output channels: Base value
C-V Sweep measurement:
•
Bias sweep output channel: Sweep start or stop value
•
CONST output channels: Output value
I/V-t Sampling measurement:
•
Constant source output channels: Base or source value
SPGU output:
•
Period of bias hold •
•
Reset of source
output
SPGU keeps the output as shown in Table 4-6.
From the end of a measurement to the end of a single measurement
From the end of a measurement to the start of the next measurement during a
quick test, application test, or repeat measurement
The source output is reset after a quick test, application test, repeat measurement, or
single measurement. The SMU is set to 0 V output and 0.1 mA compliance. The
MFCMU is set to 0 V DC bias and 0 V oscillator level.
Agilent EasyEXPERT User’s Guide Vol. 1, Edition 1
4- 41
Function Details
Bias Hold Function
Setup method
This function can be set by using the Advanced Setup window.
•
Bias hold after measurement
Set the function ON (enable) or OFF (disable, default setting).
•
Output value after measurement
Select the bias output value START (default) or STOP for the I/V or C-V sweep
measurement, or BASE or SOURCE (default) for the sampling measurement.
This is invalid for the VAR2, CONST, and constant source for C-V Sweep.
Table 4-6
SPGU Channel Output after Execution when Bias Hold is ON
SPGU output
operation mode
FREE RUN
SPGU output
Continues the pulse output in the VPULSE mode or the
sequence output in the ALWG mode.
SPGU trigger reset is performed at the beginning of the
simultaneous sampling measurement.
COUNT
DURATION
Continues the base voltage output in the VPULSE mode
or the initial voltage output in the ALWG mode.
SPGU channel initialization is performed at the beginning
of the next measurement.
4- 42
Agilent EasyEXPERT User’s Guide Vol. 1, Edition 1
Function Details
Current Offset Cancel
Current Offset Cancel
This function subtracts the offset current from the current measurement raw data,
and returns the result as the measurement data. This function is used to compensate
the error factor (offset current) caused by the measurement path such as the
measurement cables, manipulators, or probe card.
The offset cancel is not available for measurement over 100 nA range. For 10 nA
range measurement, the offset cancel is performed by using the 1 nA range offset
value. For measurement by a range less than 10 nA, the offset value measured by
each range is used. See Table 4-7 for the effective measurement range, the allowable
offset value, and the module type of the measurement channel.
Enabling offset
cancel function
You can perform the offset current measurement and enable the offset cancel
function as shown below.
1. Click the Calibration button on the main screen to open the Calibration window.
See “Calibration” on page 1-58.
2. Specify the channels to perform the offset current measurement on the SMU
Zero Cancel tab screen of the Calibration window. To specify the channel, check
the check box to the left of the Name field.
3. To enable the 1 pA range offset current measurement of SMU+ASU, check the
Full Range check box. Can be set for each channel.
4. Set the integration time for the offset measurement to the Integration Time field.
Available value: 1 PLC (power line cycle) to 100 PLC, initial setting 16 PLC.
Can be set for each channel.
Set the value longer than the integration time for the measurement of the device
under test. Otherwise, the offset cancel will not be performed.
5. Click the Measure... button. A dialog box is opened.
Follow the instruction of the dialog box, and perform the offset measurement.
After the measurement, the offset cancel function is automatically enabled.
Open the measurement terminals at the cable end of the device side during the
offset current measurement.
Agilent EasyEXPERT User’s Guide Vol. 1, Edition 1
4- 43
Function Details
Current Offset Cancel
NOTE
Except for HVSMU, the high resolution A/D converter is used for the offset current
measurement.
To disable the offset cancel function, remove the check from the check box to the
left of the Name field.
Table 4-7
Measurement range, allowable offset value, and module type
Measurement
range
Allowable offset value
1 nA
±10 pA
SMU+ASU, HRSMU,
MPSMU, HPSMU,
HVSMU
100 pA
±1 pA
SMU+ASU, HRSMU
10 pA
±400 fA
SMU+ASU, HRSMU
1 pA
±100 fA
SMU+ASU
Module type
If the offset value for a measurement range of a channel exceeds the allowable
value, the offset data is not effective in this range and lower for this channel. Then,
if the ranging mode setting of this channel covers this range or lower, the offset
cancel is not performed for any data measured by this channel.
4- 44
Agilent EasyEXPERT User’s Guide Vol. 1, Edition 1
Function Details
SMU CMU Unify Unit
SMU CMU Unify Unit
Only for the B1500A. The SMU CMU Unify Unit (SCUU) is available for the
B1500A installed with the multi frequency capacitance measurement unit
(MFCMU). The MFCMU must be installed in the slot N (integer, 3 to 10) and the
SMUs must be installed in the slot N-1 and N-2. See Agilent B1500A User’s Guide
to install the SCUU properly. The SCUU cannot be connected to the high power
SMU (HPSMU).
The Guard Switch Unit (GSWU) controls the connection of the CMU High and Low
guard lines (CMU return). The connection will be broken when using the SMU and
made when using the MFCMU.
The SCUU can switch the measurement resources, MFCMU or SMU, and can
configure four setups shown in Figure 4-21. When the B1500A is turned on, no
measurement resource is connected to the output. The SCUU has input connectors,
four coaxial and four triaxial, connected to the MFCMU and SMU directly or by
using the dedicated SCUU cable.
The SCUU front panel LEDs indicate the following conditions of the SCUU.
SMU
SMU in the slot N-1/N-2 can be used.
CMU Internal Bias
MFCMU can be used. CMU internal DC bias source is used.
CMU SMU Bias
MFCMU can be used. SMU is used as DC bias source.
The SCUU has output connectors, four triaxial, that must be connected to the DUT
interface such as manipulators and probe card. When the measurement resource is
the SMU, they are the Force1/Sense1 and Force2/Sense2 connectors for the Kelvin
connection. And when the resource is the MFCMU, the CMU High/Low are
connected to the Force1/Force2 respectively, and the Sense1/Sense2 are not used.
To realize accurate impedance measurements, connect the CMU return terminals
together. The CMU return terminal means the shield end of the outer shield
conductor extended to the DUT interface. The shield end must be opened as close as
possible to the DUT. See Figure 4-14 on page 4-26.
The GSWU has one connector and two terminals. The connector must be connected
to the SCUU by using the SCUU cable. And the terminals must be connected to the
CMU High/Low guard lines at the shield ends of the DUT interface by using a wire.
Agilent EasyEXPERT User’s Guide Vol. 1, Edition 1
4- 45
Function Details
SMU CMU Unify Unit
Figure 4-21
SCUU Input/Output Connections
6HWXS&0+)RUFH6HQVH608VORW1
&0/)RUFH6HQVH2SHQ
)RUFH
6HWXS&0+)RUFH&08+VORW1
&0/)RUFH&08/VORW1
6HQVH6HQVH2SHQ
)RUFH
+FXU
&08+
608LQVORW1
6HQVH
&085HWXUQ
6HQVH
+SRW
WR*6:8WKURXJK
'87LQWHUIDFH
0)&08LQVORW1
6HWXS&0+)RUFH6HQVH2SHQ
&0/)RUFH6HQVH608VORW1
/FXU
&08/
&085HWXUQ
/SRW
)RUFH
)RUFH
WR*6:8WKURXJK
'87LQWHUIDFH
608LQVORW1
6HQVH
6HQVH
6HWXS&0+)RUFH6HQVH608VORW1
&0/)RUFH6HQVH608VORW1
)RUFH
)RUFH
608LQVORW1
6HQVH
6HQVH
)RUFH
)RUFH
608LQVORW1
6HQVH
NOTE
6HQVH
Before using SCUU
Instrument connection must be done before the B1500A is turned on.
4- 46
Agilent EasyEXPERT User’s Guide Vol. 1, Edition 1
Function Details
Atto Sense and Switch Unit
Atto Sense and Switch Unit
Only for the B1500A. To use the Atto Sense and Switch Unit (ASU), it must be
connected to the SMU which is connected together when the calibration is
performed. Using the ASU permits use of the 1 pA range. Also the ASU can switch
the measurement resources, SMU or an instrument connected to the AUX input
connectors. The ASU can configure two setups shown in Figure 4-22. When the
B1500A is turned on, the ASU will be the Setup 1 condition. See Agilent B1500A
User’s Guide to install the ASU properly.
The ASU has input connectors, one triaxial and two coaxial. The triaxial connector
must be connected to the SMU Force, and the coaxial connectors must be connected
to an instrument. Also the ASU has the control connector to be connected to the
SMU by using the ASU cable.
Figure 4-22
ASU Input/Output Connections
6HWXS$8;2II608LQSXWWR$68RXWSXW
)RUFH
)RUFH
)URP608
6HQVH
'VXE
&LUFXLWFRPPRQ
6HWXS$8;2Q&08$8;LQSXWWR$68RXWSXW
&08FXU$8;,Q
&08$8;
&08SRW
&LUFXLWFRPPRQ
&085HWXUQ
The ASU has the following status indicators (LED).
SMU
The SMU can be used (Setup 1).
AUX
The AUX instrument can be used (Setup 2).
Agilent EasyEXPERT User’s Guide Vol. 1, Edition 1
4- 47
Function Details
Atto Sense and Switch Unit
The ASU has output connectors, two triaxial, that must be connected to the DUT
interface such as manipulators and probe card. When the measurement resource is
the SMU, they are the Force/Sense connectors for the Kelvin connection. And when
the resource is not SMU, the CMU/AUX is connected to the Force, and the Sense is
not used.
If you connect the MFCMU or the LCR meter with the four-terminal pair
configuration, two ASUs are required. Then the CMU-pot/CMU-cur connectors of a
ASU must be connected to the Hpot/Hcur of the instrument. And the other one must
be connected to the Lpot/Lcur in like manner.
To realize accurate impedance measurements using the four-terminal pair
measurement method, connect the CMU Return terminals of ASUs together. See
“Four-Terminal Pair Configuration” on page 4-24 and Figure 4-14 on page 4-26.
NOTE
To use 1 pA range
The measurement channel connected to the ASU (Atto Sense and Switch Unit)
supports the 1 pA range. To use the 1 pA range, set the 1 pA fixed range or the 1 pA
limited auto ranging.
The B1500A automatically performs the compensation of the data measured by the
1 pA range and returns the compensated data. You can use either the pre-stored
offset data or the pre-measured offset data.
To measure the offset data, perform the self-calibration before starting the
measurement for a DUT. This offset data is temporarily memorized until the
B1500A is turned off.
NOTE
Before using ASU
ASU connection must be done before the B1500A is turned on.
The combination of ASU and SMU is important. The B1500A can work with wrong
combination, but it cannot satisfy its specifications. The specifications are
guaranteed for the correct combination which the performance verification was
performed. See “ASU” on page 1-66 and check if the combination is correct.
The CMU-pot connector is for the MFCMU or the LCR meter that uses the
four-terminal pair. For the other instrument, connect a BNC open connector or
nothing to there. The line will be internally connected to the CMU-cur/AUX-in line.
It is unavailable to use the series resistor in the SMU connected to the ASU.
4- 48
Agilent EasyEXPERT User’s Guide Vol. 1, Edition 1
Function Details
SMU/PG Selector
SMU/PG Selector
Not available for the B1505A. Agilent 16440A SMU/PGU selector (B1500A-A04)
provides the built-in switching capability to select a measurement path connected to
the Output port. See Figure 4-23 for the simplified circuit diagram of the selector.
The selector has the channels CH 1 and CH 2 which provide the following
conditions. It can be controlled by using the SMU/PG Selector tab screen of the
Configuration window. See “SMU/PG Selector” on page 1-69.
CH 1
Open (no connection), SMU connect, PGU connect, and PGU open
CH 2
Open (no connection), SMU connect, and PGU connect
The PGU open is available only for the CH 1, and is made by keeping the PGU side
mechanical relay close and opening the semiconductor relay. This is effective for
frequent switching applications because the semiconductor relay is more durable
than mechanical relays. The PGU open can be set by using the Advanced Setup
window of the Measurement Setup. See “Advanced Setup Window” on page 2-53.
Figure 4-23
SMU/PG Selector Circuit Diagram and Connections
16440A Selector #2 for DUT terminals 3 and 4
16440A Selector
CONTROL
Input
Output
SMU Input
CH 2
CH 1
1
Output
Input
Output
CH 1
Input
1
Output
PGU Input
Input
Input
2
DUT terminal 1
SMU #1 Force
PGU #1 or others
DUT terminal 2
SMU #2 Force
PGU #2 or others
CONTROL
Input
SMU Input
CH 1
1
Output
CH 2
1
PGU Input
Output
CH 2
16440A Selector #1
16445A Selector Adapter
CONTROL
Input
Output
1 Mechanical relay
2 Semiconductor relay
AC power
B1500A Digital I/O
The selector must be connected to the B1500A through the Digital I/O connector
and the Agilent 16445A Selector Adapter. Up to two selectors can be used by
connecting the selector control cable between the CONTROL Output connector of
the first selector and the CONTROL Input connector of the second selector.
Agilent EasyEXPERT User’s Guide Vol. 1, Edition 1
4- 49
Function Details
Module Selector
Module Selector
Available for the B1505A. The Agilent N1258A Module Selector is used to switch
the measurement resources (HCSMU or DHCSMU (dual HCSMU), HPSMU, and
HVSMU) connected to DUT (device under test). The Input ports should be
connected to the HCSMU or DHCSMU, GNDU, HPSMU, and HVSMU. At least,
two SMU modules must be connected to the Input ports. And the Output port must
be connected to the DUT interface.
For the packaged devices, use the Agilent N1259A test fixture which can install the
module selector.
The module selector can be controlled by using the Module Selector tab screen of
the Configuration window. See “Module Selector” on page 1-69.
Figure 4-24
Module Selector Circuit Diagram and Connections
B1505A Digital I/O
Module Selector
DUT high
Open
100 kW
DUT low
Open
HPSMU
HVSMU
HCSMU
High
Low
HCSMU Force+Sense
HPSMU Force+Sense
GNDU Force+Sense
HVSMU Force
Rear view
AC power
GNDU
Front view
DUT high terminal
DUT low terminal
CAUTION
If dual HCSMU (DHCSMU) is used with the module selector, the maximum current
must be ± 30 A to prevent the module selector from performance degradation and
failure.
4- 50
Agilent EasyEXPERT User’s Guide Vol. 1, Edition 1
Function Details
Ultra High Current Expander/Fixture
Ultra High Current Expander/Fixture
Available for the B1505A. The N1265A is a test fixture which contains the current
expander to enable 500 A or 1500 A (option N1265A-015) output and measurement,
and contains the selector to switch the measurement resource connected to the DUT.
The current expander is used to configure the ultra high current unit (UHCU).
The selector is used to switch the measurement resource connected to the DUT. The
measurement resource will be the UHCU, HVSMU, HP/MPSMU, or GNDU. See
Figure 4-26.
The selector output can be extended to your prober station by using the
N1254A-524 ultra high current prober system cable. This cable supports current up
to 500 A.
The N1265A also provides the connection paths for UHVU, MFCMU via bias-tee,
and HP/MP/HC/DHCSMU.
Ultra High Current The ultra high current unit (UHCU) can be configured by using the N1265A and
Unit
two MC/HCSMU modules as shown in Figure 4-25. The UHCU output can appear
on the Selector Output by controlling the built-in selector.
The ultra high current expander/fixture can be controlled by using the UHC
Expander / Fixture tab screen of the Configuration window. See “UHC Expander /
Fixture” on page 1-72.
To Configure UHCU
B1505A
Digital I/O
Interlock
GNDU
N1265A UHC expander/fixture
Digital I/O
Interlock
GNDU
HVSMU
HP/MPSMU
HVSMU
SMU
MC/HCSMU
MC/HCSMU
UHCU
I-control
V-control
High
Selector Output
Figure 4-25
DUT
Drain
Source
Low
Agilent EasyEXPERT User’s Guide Vol. 1, Edition 1
4- 51
Function Details
Ultra High Current Expander/Fixture
Figure 4-26
Gate
Low
N1265A Built-in Selector Simplified Internal Connections
High
Sense
Low
Force
Sense
High
F: Force
Force
S: Sense
0W
10 W
100 W
or 1 kW
P.A: Protection adapter
100 kW
P.A
S
S
S
F
F
MCSMU
GNDU
4- 52
HVSMU force is
connected to
High sense line.
F
UHCU
V-control
I-control S
MCSMU MCSMU
SMU
F
F
HVSMU
Agilent EasyEXPERT User’s Guide Vol. 1, Edition 1
Function Details
HVSMU Current Expander
HVSMU Current Expander
Available for the B1505A. The N1266A is a current expander for HVSMU. The
N1266A is used to configure the high voltage medium current unit (HVMCU) with
the HVSMU module and two MC/HCSMU modules as shown in Figure 4-27.
Selector is initially installed for switching the HVSMU or the HVMCU connected
to the DUT.
The HVSMU current expander can be controlled by using the HVSMU Current
Expander tab screen of the Configuration window. See “HVSMU Current
Expander” on page 1-75.
Figure 4-27
To Configure HVMCU
B1505A
MC/HCSMU
MC/HCSMU
N1266A HVSMU current expander
I-control
V-control
High
HVMCU
HVSMU
DUT
HVSMU
Source
Open
GNDU
Digital I/O
Drain
GNDU
Low
Digital I/O
N1261A-002
or 004(*1)
*1: N1261A-002/004 protection adapter is required for connecting prober.
Not requred for connecting N1258A, N1259A, N1259A-300, or N1265A.
Agilent EasyEXPERT User’s Guide Vol. 1, Edition 1
4- 53
Function Details
Ultra High Voltage Expander
Ultra High Voltage Expander
Available for the B1505A. The N1268A is a voltage expander to enable 10 kV
output and measurement. The N1268A is used to configure the ultra high voltage
unit (UHVU) with two MC/HCSMU modules as shown in Figure 4-28.
The ultra high voltage expander can be controlled by using the UHV Expander tab
screen of the Configuration window. See “UHV Expander” on page 1-77.
Figure 4-28
To Configure UHVU
B1505A
MCSMU
MC/HCSMU
Digital I/O
Interlock
N1268A UHV expander
I-control
V-control
Digital I/O
Interlock Input
Interlock Output
DUT
Drain
High
Low
Source
Interlock circuit
4- 54
Agilent EasyEXPERT User’s Guide Vol. 1, Edition 1
Function Details
SMU Ranging Mode
SMU Ranging Mode
Agilent B1500 provides the following operation modes for the measurement range
and the output range. The ranging mode must be set for each channel.
•
“Auto Ranging”
•
“Limited Auto Ranging”
•
“Fixed Range”
•
“Compliance Range”
•
“Enhanced Auto Ranging for Current Measurement”
To Set Ranging Mode
The following points must be noted when setting the ranging mode.
For measurement
channels
For output
channels
•
If you do not specify the ranging mode, the auto ranging mode is set
automatically.
•
For the channels that perform Vf/Vm (voltage force and voltage measurement)
or If/Im (current force and current measurement), the measurement range is
always the same as the output range.
•
For measurement with pulse output, the measurement channel uses the
compliance range or the specified fixed range. The channel cannot perform the
auto ranging operation or the limited auto ranging operation.
•
For the SMU connected to the atto sense/switch unit (ASU), the 10 pA range is
the minimum for the auto ranging operation. To use the 1 pA range, select the 1
pA limited auto ranging mode or the 1 pA fixed range mode.
•
The auto ranging mode and the limited auto ranging mode are available for the
output channels.
•
When the voltage output range or the voltage compliance range is changed, the
channel forces 0 V at that moment.
Agilent EasyEXPERT User’s Guide Vol. 1, Edition 1
4- 55
Function Details
SMU Ranging Mode
Auto Ranging
Range changing is performed as below.
For measurement
channels
The measurement channel automatically searches for and measures at the range that
provides the best resolution as follows:
•
For current measurement, the measurement channel uses the present range if the
following formula is satisfied; otherwise, the channel changes the range.
Range 0.1 Measurement value Range X/100
where X=115, or 100 at the maximum range.
See also “Enhanced Auto Ranging for Current Measurement” on page 4-58.
•
For voltage measurement, the measurement channel uses the present range if the
following formula is satisfied; otherwise, the channel changes the range.
Next lower range value Measurement value Range X/100
where X=110, or 100 at the maximum range.
For output
channels
The output channel automatically searches for and forces at the lowest range that
covers the output value as follows:
•
For staircase sweep output, the output channel uses the lowest range that covers
the start and stop values. However, it uses the lowest range that covers the step
output value for the logarithmic current sweep. For the voltage sweep that sets
the power compliance, the channel uses the lowest range (20 V range or more)
that covers the step output value.
•
For pulsed bias output, the output channel uses the lowest range that covers the
base and peak values.
•
For pulsed sweep output, the output channel uses the lowest range that covers
the base, start, and stop values.
•
For quasi-pulsed output and search source output, the output channel uses the
lowest range that covers the start and stop values.
The maximum output value is as follows:
•
Maximum current output value = Range X/100
where X=115, or 100 at the maximum range.
•
Maximum voltage output value = Range value
4- 56
Agilent EasyEXPERT User’s Guide Vol. 1, Edition 1
Function Details
SMU Ranging Mode
Limited Auto Ranging
Limited auto ranging is similar to auto ranging. However, limited auto ranging does
not use the range(s) less than what you specified. For example, if you select 10 mA
limited auto ranging, the measurement module does not use the 1 mA range or less.
Consequently, the measurement time for limited auto ranging is less than for auto
ranging.
Fixed Range
The channel uses the specified range only.
For the current measurement channel, if you specify a range higher than the
minimum range that covers the compliance value, the measurement channel uses
this range (compliance range).
Compliance Range
The compliance range is effective for the Vf/Im (voltage output and current
measurement) or If/Vm (current output and voltage measurement) channel. The
measurement channel automatically selects and uses the lowest range that covers the
specified compliance value.
For the measurement channel that performs constant voltage or current output, you
can set the compliance range.
For the measurement channel that performs sweep output, you can set the power
compliance value. If you set the power compliance value, the channel uses the
lowest range that covers the lower value of either the specified compliance value or
the compliance value given by the following formula.
Current compliance = Specified power compliance value / Step voltage
Voltage compliance = Specified power compliance value / Step current
For details about setting compliance, refer to “SMU Compliance” on page 4-59.
NOTE
Range change is performed when the compliance value is set, not when the
measurement is performed.
Agilent EasyEXPERT User’s Guide Vol. 1, Edition 1
4- 57
Function Details
SMU Ranging Mode
Enhanced Auto Ranging for Current Measurement
Expanded functions are available for the auto ranging operation of the current
measurement channel. To use the functions, set Range Change Rule. See “SMU
Range Setup Window” on page 2-48. Rate value defines the boundary of ranging.
•
Range Change Rule=BY FULL RANGE:
Performs normal auto ranging operation. If a condition shown below is satisfied,
the range changes immediately, even during measurement.
Measurement value > Range X/100
Measurement value Range 0.1
where X=115, or 100 at the maximum range.
•
Range Change Rule=GO UP AHEAD:
If the following condition is satisfied, the range changes up after measurement.
Measurement value current1
•
Range Change Rule=UP AND DOWN AHEAD:
If the following condition is satisfied, the range changes down immediately,
even during measurement.
Measurement value current2
If the following condition is satisfied, the range changes up after measurement.
Measurement value current1
where current1 and current2 are given by the following formula. Then rate must be
an integer, 11 to 100.
current1 = Range rate/100
current2 = Range rate/1000
For example, if the range value is 10 mA and rate is 90, they are:
current1 = 9 mA
current2 = 0.9 mA
4- 58
Agilent EasyEXPERT User’s Guide Vol. 1, Edition 1
Function Details
SMU Compliance
SMU Compliance
Compliance is the output limiter to prevent damage to the test device from
overcurrent, overvoltage, or overpower. Voltage compliance is for the current output
channels, and current compliance is for the voltage output channels.
When a channel reaches compliance, the channel acts as a constant voltage source or
a constant current source. The channel keeps the output value when reaching
compliance.
Compliance can be set with the same resolution and accuracy as output current or
output voltage. For the values, see Agilent B1500A or B1505A User’s Guide.
Polarity and Output Area
•
Polarity of current compliance
The B1500 automatically sets current compliance for both positive and negative
polarity. For opposite polarity as the output voltage, the compliance value is
increased by an amount that is 2.5 % to 12 % of the range value in the lowest
range that covers the specified compliance value. See Figure 4-29.
•
Polarity of voltage compliance
The B1500 automatically sets voltage compliance to the same polarity as the
output current. There is no compliance for opposite polarity.
Figure 4-29
Relation of Compliance and Output
9ROWDJH
&XUUHQW
_&RPSOLDQFH_
9
9! 2XWSXW9ROWDJH
_&RPSOLDQFH_
,
,! _&RPSOLDQFH_
Agilent EasyEXPERT User’s Guide Vol. 1, Edition 1
2XWSXW&XUUHQW
_&RPSOLDQFH_
4- 59
Function Details
SMU Compliance
Power Compliance
In addition to V compliance or I compliance, you can set power compliance for the
staircase sweep source. Power compliance is not available for HVSMU.
If you specify power compliance, SMU changes the current or voltage compliance
value every sweep step. The value is the lower value of either the specified
compliance value or the compliance value given by the following formula. See
Figure 4-30.
Current compliance = Specified power compliance value / Step voltage
Voltage compliance = Specified power compliance value / Step current
Figure 4-30
Power Compliance Output Area
)RUYROWDJHVZHHS
)RUFXUUHQWVZHHS
&XUUHQW
9ROWDJH
6SHFLILHGSRZHUFRPSOLDQFH
6SHFLILHGSRZHUFRPSOLDQFH
6SHFLILHGFXUUHQWFRPSOLDQFHYDOXH
6SHFLILHGYROWDJHFRPSOLDQFHYDOXH
$FWXDOFXUUHQWFRPSOLDQFH
$FWXDOYROWDJHFRPSOLDQFH
9ROWDJH
Available values
&XUUHQW
The following values are available for the power compliance:
MPSMU/HRSMU
1 mW to 2 W
HPSMU
1 mW to 20 W
HCSMU
1 mW to 40 W (DC), 1 mW to 400 W (pulse)
DHCSMU
1 mW to 80 W (DC), 1 mW to 800 W (pulse)
MCSMU
1 mW to 3 W (DC), 1 mW to 30 W (pulse)
UHCU
1 mW to 7.5 kW (pulse, 500 A range), 1 mW to 22.5 kW
(pulse, 1500 A range)
UHVU
1 mW to 100 W (DC), 1 mW to 200 W (pulse)
HVMCU
1 mW to 600 W (pulse, 2200 V range), 1 mW to 900 W
(pulse, 1500 V range)
4- 60
Agilent EasyEXPERT User’s Guide Vol. 1, Edition 1
Function Details
SMU Compliance
Conditions after
compliance
When a channel reaches compliance, the staircase sweep source automatically stops
the sweep and forces the start value. After reaching the compliance, the
measurement data will be “NaN”.
SMU output values If you specify power compliance, the SMU changes the current or voltage
compliance every sweep step. Hence, the SMU can apply voltage or current with the
maximum power. Figure 4-31 shows the differences between the output with power
compliance and the output without power compliance, for MPSMU.
Figure 4-31
Allowable Current in Voltage Sweep (0 V to 100 V, MPSMU)
:KHQSRZHUFRPSOLDQFHLVQRWVHW
:KHQSRZHUFRPSOLDQFHLVVHW
&XUUHQWP$
&XUUHQWP$
)RUWKHVZHHS9WR9
)RUWKHVZHHS9WR9
NOTE
)RUWKHVZHHS9WR9
9ROWDJH9
9ROWDJH9
If you specify power compliance, the measurement time increases slightly because
the B1500 adjusts the compliance for every sweep step.
To Set Compliance
The following points must be noted when setting the compliance.
•
If the current compliance value is too low, the SMU will take a long settling
time.
•
The SMU will reach voltage compliance if the SMU cannot force the specified
current for the following reasons:
•
Over current for test device.
•
Another channel has reached compliance.
•
Current measurement data of another channel has reached the limit for the
present measurement range.
Agilent EasyEXPERT User’s Guide Vol. 1, Edition 1
4- 61
Function Details
SMU Pulse
SMU Pulse
SMU can apply voltage or current pulse. This section describes the pulse setup
parameters. The parameters are different by the number of pulse output channels as
shown in Figure 4-32.
To Set Pulse Output
The following points must be noted when setting the pulse output.
Figure 4-32
•
Cannot use the 1 nA output range and lower ranges.
•
Cannot use multiple pulse output channels for the tests other than the Multi
Channel I/V Sweep.
•
Cannot use multiple measurement channels for the tests other than the Multi
Channel I/V Sweep.
•
The measurement channel uses the compliance range. The channel cannot
perform the auto ranging operation or the limited auto ranging operation.
SMU Pulse Setup Parameters
1. Using one pulse output channel
Pulse period
Voltage or current
Measurement time
Peak value
Hold time
Previous value
Pulse width
Base value
2. Using multiple pulse output channels
Pulse period
Voltage or current
Measurement delay time
Peak value
Measurement time
Hold time
Previous value
Pulse width
Base value
Pulse delay time
Time
4- 62
Agilent EasyEXPERT User’s Guide Vol. 1, Edition 1
Function Details
SMU Pulse
Pulse Setup Parameters
The pulse setup parameters and the available values are shown below.
Hold time
0 s to 655.35 s, 10 ms resolution
Pulse period
5 ms to 5 s, 100 s resolution
Pulse width
HR/MP/HPSMU: 500 s to 2 s, 100 s resolution
HCSMU / dual HCSMU: 50 s to 2 s, 2 s resolution.
Maximum 1 ms and duty ratio 1 % for using 20 A range
or 40 A range.
MCSMU: 10 s to 2 s, 2 s resolution. Maximum 100 ms
and duty ratio 5 % for using 1 A range.
UHCU: 10 s to 1 ms and duty ratio 0.4 % for 500 A
range, 10 s to 500 s and duty ratio 0.1 % for 1500
A range, 2 s resolution.
UHVU: 100 s to 2 s, 2 s resolution. Maximum 1 ms for
using 100 mA range.
HVSMU: 500 s to 2 s, 2 s resolution
HVMCU: 10 s to 100 s, 2 s resolution. Maximum 1 ms
for using 2200 V / 110 mA range.
Pulse delay time
0 to Pulse period - Pulse width, 2 s resolution
0 s for using HR/MP/HPSMU
Measurement delay
time
2 s to Pulse period - Measurement time - 2 ms, 2 s
resolution
Measurement time
HR/MP/HPSMU: 16 s to 20 ms, 2 s resolution
HC/MCSMU: 2 s to 20 ms, 2 s resolution
HVSMU: 6 s to 20 ms, 2 s resolution
See “Integration Time” on page 4-65.
The setup values must satisfy the following conditions.
•
Pulse period pulse delay + width + 2 ms, for pulse delay + width 100 ms
•
Pulse period pulse delay + width + 10 ms, for pulse delay + width > 100 ms
Agilent EasyEXPERT User’s Guide Vol. 1, Edition 1
4- 63
Function Details
SMU Pulse
•
Pulse width must be the same for all of the HR/MP/HPSMU pulse output
channels. If a different value is entered, the longest value is set.
Pulse period = AUTO sets the longest one of the followings automatically.
•
Maximum period given by the pulse width and the duty ratio
•
Pulse period = 5 ms, for pulse delay + width 3 ms
•
Pulse period = pulse delay + width + 2 ms, for 3 ms < pulse delay + width 100
ms
•
Pulse period = pulse delay + width + 10 ms, for 100 ms < pulse delay + width
Measurement delay time = AUTO sets the optimum value automatically so that the
measurement is completed when the transition from peak to base is started by the
pulse output channel which starts the transition at first.
4- 64
Agilent EasyEXPERT User’s Guide Vol. 1, Edition 1
Function Details
SMU Measurement Time
SMU Measurement Time
Measurement time depends on integration time, measurement range, and other
measurement conditions, and can be expressed by the following formula:
Measurement time = Integration time + Overhead time
Integration time is the time required for measurement, and does not include such
factors as range changing or data compensation, which would be the overhead time.
Integration Time
Integration time is the time required to get measurement data. For accurate and
reliable measurement, integration time should be increased. Integration time can be
set for each type of A/D converter (ADC) used by the measurement channel.
•
High-speed ADC
Installed in each measurement module. For high speed measurement. Sets the
number of averaging samples for getting one measurement data by setting the
Mode and the Factor value. Only PLC and TIME are available for SMU pulse.
AUTO
Number of averaging samples = Factor reference
Factor = 1 to 1023
where reference is the number of averaging samples
automatically set by the B1500; this cannot be changed.
MANUAL
Specify the number of averaging samples (Factor).
Factor = 1 to 1023
PLC
Number of averaging samples = Factor 128
Factor = 1 to 100
The B1500 gets 128 samples in a power line cycle. Hence, the
Factor value is equal to the number of power line cycles.
TIME
Specify the actual measurement time (Factor).
Factor = 2 s to 20 ms, 2 s step
For HR/MP/HPSMU, it performs the operation of MANUAL.
Then the number of averaging samples is automatically set to
the following value.
Agilent EasyEXPERT User’s Guide Vol. 1, Edition 1
4- 65
Function Details
SMU Measurement Time
Number of averaging samples = Factor / Tm
Tm: Required time for one sample measurement
If Factor / Tm < 1, Number of averaging samples = 1.
•
High-resolution ADC
For high accuracy and high resolution measurement. This ADC is mounted on
the mainframe, and used by the multiple modules alternately. Sets the
integration time for getting one measurement data by setting the Mode and the
Factor value. The high-resolution ADC cannot be used for the measurements
using SMU pulse.
AUTO
Integration time = Factor reference
Factor = 1 to 127
where reference is the integration time automatically set by the
B1500; it cannot be changed.
MANUAL
Integration time = Factor 80 sec
Factor = 1 to 127
PLC
Integration time = Factor / power line frequency
Factor = 1 to 100
The Factor value means the number of power line cycles.
ADC Zero
Function
The ADC zero function is available for the high-resolution A/D converter (ADC)
and not available for the high-speed ADC. This function measures the internal offset
of the high-resolution ADC and compensates it automatically. The measurement
data displayed on the LCD will be the data after compensation.
NOTE
This function is especially effective for the low voltage measurement. Disable the
function in cases where measurement speed is more important than measurement
accuracy. This approximately halves integration time.
4- 66
Agilent EasyEXPERT User’s Guide Vol. 1, Edition 1
Function Details
SMU Measurement Time
Overhead Time
The overhead time is the time required for range changing and so on. This time
depends on the measurement condition, and cannot be specified. Major elements of
the overhead time are:
•
Range changing time during measurement (when measurement ranging mode is
set to auto or limited auto)
•
Range changing time at measurement start (when the measurement range is less
than the compliance value)
To Specify Source Output Time
You cannot specify the measurement time. However, in sweep measurement mode,
you can specify a source output time that includes the measurement time. To specify
the source output time, set the delay time and the step delay time. The step delay
time is defined as the time from the measurement trigger up to the trigger for
changing the source output value. See the figure below. The step delay time must
cover the measurement time to keep the source output time constant.
The EasyEXPERT does not support the step delay time. It is available only for the
GPIB remote mode.
7G
6RXUFHRXWSXWWLPH
7VG
6WHSGHOD\WLPH7VG
RQO\IRU5HPRWHPRGH
7G
7VG
'HOD\WLPH7G
0HDVXUHPHQWWLPH
9VWDUW
+ROGWLPH
Agilent EasyEXPERT User’s Guide Vol. 1, Edition 1
4- 67
Function Details
SMU Measurement Time
Wait Time
Wait time is the time after starting source output until changing the source output
value or until starting measurement. You can set the source wait time and the
measurement wait time individually.
The source wait time is the time the source channel always waits after it starts output
until it changes the output value. The measurement wait time is the time the
measurement channel always waits after the source channel starts output until the
measurement channel starts measurement. Refer to Figure 4-33. The wait time is
given by the following formula:
wait time = N reference
where reference is the wait time the B1500 automatically sets according to the
present settings; this wait time cannot change. Available N values are 0 to 10, 0.1
step. Initial value is 1.
It is not easy to determine the best wait time. If you specify it too short, the
measurement may start before device characteristics stable. If too long, time will be
wasted. For measurements of low capacitance or fast response devices, if
measurement speed has top priority or is more important than reliability and
accuracy, set the wait time shorter. The initial wait time may be too short for
measurements of high capacitance or slow response devices. Then set the wait time
longer.
Figure 4-33
Source/Measurement Wait Time
0HDVXUHPHQWZDLWWLPH
6RXUFHZDLWWLPH
0HDVXUHPHQW
'HOD\WLPH
+ROGWLPH
NOTE
6WHSGHOD\WLPH
7LPH
In the GPIB remote mode, if the delay time is longer than the wait time, the wait
time can be ignored.
The EasyEXPERT does not support the step delay time.
4- 68
Agilent EasyEXPERT User’s Guide Vol. 1, Edition 1
Function Details
SMU Measurement Time
Multiple Measurement Channels
To use multiple measurement channels, define multiple measurement parameters in
the Display Setup screen or the Function Setup screen. Then, measurement
sequence, time data, and measurement time for each measurement point are as
follows.
•
Sequence of measurement execution
Measurement channels perform measurement in the order shown below.
1. Measurement channels which use the high speed AD converter and the
FIXED measurement range start measurement simultaneously (parallel
measurement).
2. After the parallel measurement, the other measurement channels perform
measurement sequentially. The order is top to bottom of the channels defined
in the SMU Range Setup screen.
As a special case, for the sweep measurement with multiple pulse outputs and
for the linear sampling measurement with Interval < 2 ms, all channels start
measurement simultaneously.
•
Time data
Only the measurement start time of the channel which starts measurement at
first is recorded.
•
Measurement time
Measurement time is the sum of the measurement time by all channels.
Agilent EasyEXPERT User’s Guide Vol. 1, Edition 1
4- 69
Function Details
SMU Filter
SMU Filter
The filter is mounted on each source/monitor unit (SMU) module. It assures clean
source output with no spikes or overshooting. However, using a filter may increase
the SMU settling time.
To set the filter, refer to “Advanced Setup Window” on page 2-53.
NOTE
The SMU filter is set to OFF for the standby channels in the standby state.
4- 70
Agilent EasyEXPERT User’s Guide Vol. 1, Edition 1
Function Details
SMU Series Resistor
SMU Series Resistor
The series resistor (approx. 1 M) is mounted on each source/monitor unit module
(HRSMU, HPSMU, and MPSMU). The series resistor may be used for the device
protection, negative resistance measurement, and so on. It depends on the
characteristics of test device and measurement environment.
If you use a series resistor, the voltage you set is applied to the near side of the series
resistor. Thus, the voltage will be divided by the series resistor and the device under
test. The setting value is not the voltage at the device terminal.
To set the series resistor, refer to “Advanced Setup Window” on page 2-53.
The series resistor is not mounted on MCSMU, HCSMU, and HVSMU.
NOTE
Restrictions
The series resistor cannot be used for the measurements that use the SMU connected
to the Atto Sense and Switch Unit (ASU) or the measurements that use 1 A range of
the high power SMU (HPSMU).
The series resistor is set to OFF for the standby channels in the standby state.
Agilent EasyEXPERT User’s Guide Vol. 1, Edition 1
4- 71
Function Details
Interlock Function
Interlock Function
The interlock function is designed to prevent electrical shock when a user touches
the measurement terminals. If the Interlock terminal is open, maximum output is
limited to 42 V.
To perform high voltage measurement more than 42 V, connect the Interlock
terminal to an interlock circuit of test fixture or connector plate. The interlock circuit
must have one LED and two mechanical switches placed near the shielding box
opening doors. And they must be connected together. For details on how to install
the interlock circuit, see Agilent B1500A or B1505A User’s Guide.
The interlock function works as shown below.
•
When the interlock circuit is open, maximum output is limited to 42 V.
•
When the interlock circuit is close, source channel can force its maximum output
value.
•
When the interlock circuit is opened in the high voltage condition more than
42 V, output voltage is set to 0 V immediately.
CAUTION
If the actual output value is not set to 0 V within 120 msec, the B1500 automatically
performs the initialization. Then perform self-test. Any module may be defective.
WARNING
Dangerous voltage of up to the maximum voltage of SMUs may be present at
force, guard, and sense terminals if the Interlock terminal is closed.
4- 72
Agilent EasyEXPERT User’s Guide Vol. 1, Edition 1
Function Details
Auto Power Off Function
Auto Power Off Function
If an abnormal voltage or current is detected in the B1500, the B1500 automatically
turns off to prevent damage.
If this function is activated, the B1500 is turned off, but the Standby switch is left
ON. Perform the following steps to turn the B1500 on again.
1. If Windows is running, end all tasks, and shutdown Windows.
2. Open the measurement terminals.
3. Press the Standby switch to set it to the OFF position.
4. Remove the power cable from the B1500 rear panel.
5. Wait for 10 seconds or more.
6. Connect the power cable from the B1500 rear panel.
7. Press the Standby switch to set it to the ON position.
Abnormal voltage or current can be caused by incorrect connections of the B1500 to
the test device, excess voltage or current input, momentary power loss, defects of
the instrument, and so on.
If no cable is connected to the measurement terminals of the B1500, and the line
voltage is correct, the B1500 may have a defect. Contact the nearest Agilent
Technologies for assistance.
Agilent EasyEXPERT User’s Guide Vol. 1, Edition 1
4- 73
Function Details
Initial Settings
Initial Settings
Agilent B1500 is initialized by turning it on, the *RST command, or the device
clear. Initial settings of the B1500 are shown in the following tables.
Table 4-8
Initial Settings
Setup Item
Mainframe
SMU
Initial Setting
Auto calibration
off
Output switch
close
Filter
on
Series resistor, only for HR/MP/HP
off
ASU path/indicator
SMU side/enable
ASU 1 pA auto range
disable
Current measurement range
with pulse
compliance range
without pulse
auto
with pulse
compliance range
without pulse
auto
Voltage measurement range
A/D converter
HR/MP/HPSMU: high resolution ADC
HC/DHC/MC/HVSMU: high speed ADC
ADC integration time
high speed ADC: auto
high resolution ADC: auto
ADC zero function
off
Sweep automatic abort function
off
Hold time
0s
Delay time
0s
Pulse width
0.001 s
Pulse period
0.01 s
4- 74
Agilent EasyEXPERT User’s Guide Vol. 1, Edition 1
Function Details
Initial Settings
Setup Item
CMU
SPGU
Initial Setting
SCUU path/indicator
open/enable
Measurement parameter
Cp-G
Measurement range
auto
Measurement time
auto
Open/short/load correction
off
Phase compensation mode
auto
Measurement signal frequency
1 k, 2 k, 5 k, 10 k, 20 k, 50 k, 100 k, 200 k, 500 k,
1 M, 2 M, 5 MHz
Automatic abort function
off
Hold time
0s
Delay time
0s
Operation mode
VPULSE (PG mode)
Pulse period
1.0 s
Channel output mode
Primary Pulse, 2-level pulse output
Pulse source setup
Delay: 0 s
Width 100 ns
Leading: 20 ns
Trailing: 20 ns
ALWG setup
Cleared
Pulse switch
Disable
DUT load impedance
50
SPGU trigger output
Disable
Agilent EasyEXPERT User’s Guide Vol. 1, Edition 1
4- 75
Function Details
Initial Settings
4- 76
Agilent EasyEXPERT User’s Guide Vol. 1, Edition 1
5
Built-in Programming Tool
Built-in Programming Tool
This chapter explains the programming tool built into Agilent EasyEXPERT. The
programming tool is used to define user functions and analysis functions in the
Classic Test definitions and to define the test contents in the Application Test
definitions.
This chapter contains the following sections.
•
“Variables and Expressions”
•
“Built-in Functions”
•
“Read-out Functions”
•
“Script Program Statements”
5- 2
Agilent EasyEXPERT User’s Guide Vol. 1, Edition 1
Built-in Programming Tool
Variables and Expressions
Variables and Expressions
Variables can be used in Agilent EasyEXPERT setup editor for the following
applications. User functions and analysis functions can also be used for variables.
•
To store the value of the measurement condition input parameter
•
To store the value of the measurement result data or analysis data
•
Variable used in the test execution flow of the Application Test definition
•
User function of the Classic Test definition
•
Analysis function of the Classic Test definition
The following characters can be used for the variable name.
•
Alphabetic characters A to Z and a to z, case sensitive
•
_ (underscore)
•
Numeric characters 0 to 9
•
@ (at mark)
Numeric characters and at mark cannot be used for the first character of variable
name.
NOTE
About variable names
The variable name must be unique. If a variable is defined as a local variable in an
application test definition and its name is the same as one of the following variables,
the local variable is effective and the following variable is not effective.
•
variable that defines a built-in function in a test setup
•
variable that defines a read-out function in a test setup
•
variable defined as a test parameter
•
variable defined as a device parameter
•
variable defined as an analysis parameter
The local variables are defined by using the Local Variable Definition statement in
the Test Contents setup displayed on the Test Definition window. The test
parameters and the device parameters are defined in the Test Specification setup,
and the analysis parameters are defined in the Test Output setup.
Agilent EasyEXPERT User’s Guide Vol. 1, Edition 1
5- 3
Built-in Programming Tool
Variables and Expressions
Expressions
Figure 5-1 shows the expression effective for variable definition. The elements are
explained below.
Figure 5-1
Syntax of Expression
([SUHVVLRQ
0RQRPLDO
2SHUDWRU
([SUHVVLRQ
%LQRPLDO
2SHUDWRU
/LWHWUDO
&RQVWDQW
9DULDEOH
%XLOWLQ
)XQFWLRQ
([SUHVVLRQ
5HDG2XW
)XQFWLRQ
8VHU
)XQFWLRQ
$QDO\VLV
)XQFWLRQ
Constants
The following scientific constants are available.
•
q: electric charge. 1.60217710-19
•
k: Boltsmann’s constant. 1.38065810-23
•
e: space permittivity. 8.85418810-12
5- 4
Agilent EasyEXPERT User’s Guide Vol. 1, Edition 1
Built-in Programming Tool
Variables and Expressions
Literals
Numeric type and string type are available.
•
Numeric type
To enter a numeric value, type as follows, where [] is optional.
Dd[.d][E[S]d][s]
D: Numeric character 0 to 9
d: This means repeating D 0 times or more.
E: Exponent symbol, E or e
S: Sign, + or s: Prefix symbol. The subsequent symbols (y, z, a, f, p, n, u, m, k, M, G)
separated by the comma mean the value following the colon.
y: 10-24, z: 10-21, a: 10-18, f: 10-15, p: 10-12, n: 10-9, u: 10-6, m: 10-3,
k: 103, M: 106, G: 109
•
String type
Enclose the string by using the double quotes. To contain the double quotes into
the string, type as shown below. The example string is ABC”DEF.
"ABC""DEF"
Monomial Operators and Binomial Operators
Table 5-1 shows monomial operators and binomial operators available for an
expression. The table also shows the priority of operators and the type of operand.
For the expression that contains the same priority operators, the operations are
performed from left to right. Module type variable is one of SMU, HPSMU,
HCSMU, DHCSMU, HVSMU, MPSMU, MCSMU, HRSMU, HRSMU/ASU,
CMH, CML, UHCU500, UHCU1500, UHVU, or HVMCU.
NOTE
Operation between arrays
Operation is performed between data at the same index.
Agilent EasyEXPERT User’s Guide Vol. 1, Edition 1
5- 5
Built-in Programming Tool
Variables and Expressions
Table 5-1
Monomial Operator and Binomial Operator
Priority
Type of operand
Operator
Numeric
Vectora
String
Module
High
Low
()
Yes
Yes
Yes
Yes
NOT
Yes
Yes
No
No
^
Yes
Yes
No
No
* or /
Yes
Yes
No
No
+ or -, monomial
Yes
Yes
+: Yes, -: No
No
+ or -, binomial
Yes
Yes
+: Yes, -: No
No
>, >=, <, <=
Yes
Yes
Yes
No
=, <>
Yes
Yes
Yes
No
AND
Yes
Yes
No
No
XOR
Yes
Yes
No
No
OR
Yes
Yes
No
No
a. Two-dimensional array. The primary plane is for the primary sweep index, and the
secondary plane is for the secondary sweep index.
Built-in Functions
Agilent EasyEXPERT built-in function can be used. See “Built-in Functions” on
page 5-7.
Read-out Functions
Agilent EasyEXPERT built-in read-out function can be used. See “Read-out
Functions” on page 5-16.
User Functions and Analysis Functions
User functions and analysis functions are the user-defined functions that consist of
the variable name, unit, and expression. The functions are effective for numeric or
vector type data. To define the functions, see “Function Setup” on page 2-42.
Numeric literal, scientific constants (q, k, e), variable to store the test result data, and
a built-in function that returns the numeric or vector type data can be used in the
expression. The read-out function can also be used for the analysis functions.
5- 6
Agilent EasyEXPERT User’s Guide Vol. 1, Edition 1
Built-in Programming Tool
Built-in Functions
Built-in Functions
This section describes Agilent EasyEXPERT built-in functions. The functions
appear in alphabetical order. In the function name, the character in parentheses is a
variable.
abs(A)
Returns the absolute value of the expression A.
Example
B=abs(A)
Data type A: numeric, B: numeric. Or A: vector, B: vector.
acos(A)
Returns the arccosine value of the expression A. The A value must be between -1
and 1.
Example
B=acos(A)
Data type A: numeric, B: numeric. Or A: vector, B: vector.
asin(A)
Returns the arcsine value of the expression A. The A value must be between -1 and
1.
Example
B=asin(A)
Data type A: numeric, B: numeric. Or A: vector, B: vector.
at(A,B)
Finds a data element in the expression A, and returns the value. The data element is
specified by index B. The index number starts from 1. If B is not an integer, a linear
interpolated A value will be returned.
Example
C=at(A,B)
Data type A: vector or numeric, B: numeric, C: vector.
at(A,B,C)
Finds a data element in the expression A, and returns the value. The data element is
specified by the indices B and C. B is the index for the primary plane of a
two-dimensional array and C is the index for the secondary plane. The index number
starts from 1.
If B is not an integer, a linear interpolated A value will be returned. The linear
interpolation will be executed between A[n,C] and A[n+1,C], where n < B < n+1.
If C is not an integer, C will be n, where n < C < n+1.
Example
D=at(A,B,C)
Data type A: vector or numeric, B: numeric, C: numeric, D: numeric.
Agilent EasyEXPERT User’s Guide Vol. 1, Edition 1
5- 7
Built-in Programming Tool
Built-in Functions
atan(A)
Returns the arctangent value of the expression A.
Example
B=atan(A)
Data type A: numeric, B: numeric. Or A: vector, B: vector.
atan2(A,B)
Returns the radian value of the angle made by the X-axis and the line that passes
through the coordinates (0, 0) and (A, B).
Example
C=atan2(A,B)
Data type A: numeric, B: numeric, C: numeric. If A and/or B is vector, C: vector.
avg(A)
Returns the average value of data in the expression A. For subordinate sweep
measurement, this function returns the average values for each primary sweep.
Example
B=avg(A)
Data type A: vector or numeric, B: vector.
ceil(A)
Returns the minimum integer value more than or equal to the expression A.
Example
B=ceil(A)
Data type A: numeric, B: numeric. Or A: vector, B: vector.
cond(A,B,C,D)
This function does the following.
•
If A < B, returns C.
•
If A B, returns D.
If the A or B value is invalid, the value for the previous measurement index number
is used for the comparison.
Example
E=cond(A,B,C,D)
Data type A, B, C, D: numeric, E: numeric. If A, B, C, and/or D is vector,
E: vector.
cos(A)
Returns the cosine value of the expression A.
Example
B=cos(A)
Data type A: numeric, B: numeric. Or A: vector, B: vector.
5- 8
Agilent EasyEXPERT User’s Guide Vol. 1, Edition 1
Built-in Programming Tool
Built-in Functions
delta(A)
Returns the difference of the expression A. Calculation is performed as follows.
Dn = (A2-A1)
when n = 1
Dn = (An+1-An-1) / 2
when 1 < n < N
Dn = (AN-AN-1)
when n = N
where,
Dn
difference for the index number n
An
A value for the index number n
N
number of sweep steps or number of samples
For subordinate sweep, the first index number of each primary sweep is always 1.
If A is a data variable for a secondary sweep source, this function returns the sweep
step value of the secondary sweep.
For frequency data of C-V sweep, the calculation is performed for all frequencies.
Example
B=delta(A)
Data type A: vector or numeric, B: vector.
diff(A,B)
Returns the differential coefficient of the expression A by B. Calculation is
performed as follows.
A’n = (A2-A1)/(B2-B1)
when n = 1
A’n = (An+1-An-1)/(Bn+1-Bn-1)
when 1 < n < N
A’n = (AN-AN-1)/(BN-BN-1)
when n = N
where,
A’n:
differential coefficient for the index number n
An:
A value for the index number n
B n:
B value for the index number n
N:
number of sweep steps or number of samples
For subordinate sweep, the first index number of each primary sweep is always 1.
Example
C=diff(A,B)
Data type A, B: vector or numeric, C: vector.
Agilent EasyEXPERT User’s Guide Vol. 1, Edition 1
5- 9
Built-in Programming Tool
Built-in Functions
dim1Size(A)
Returns the number of elements in the primary plane of the vector variable A.
Example
B=dim1Size(A)
Data type A: vector, B: numeric.
dim2Size(A)
Returns the number of elements in the secondary plane of the vector variable A.
Example
B=dim2Size(A)
Data type A: vector, B: numeric.
exp(A)
Raises e (exponential) to the power of the expression A. The following example
enters eA calculation result to the variable B.
Example
B=exp(A)
Data type A: numeric, B: numeric. Or A: vector, B: vector.
floor(A)
Returns the maximum integer value less than or equal to the expression A.
Example
B=floor(A)
Data type A: numeric, B: numeric. Or A: vector, B: vector.
getNumericData(A Returns data of the numeric variable specified by A. This function is effective for
)
the variables defined in the Function Setup or Display Setup of the last Classic Test
or the analysis parameters of the last Application Test. The variables are valid in a
test definition.
Example
B=getNumericData("A")
Data type A: string (name of numeric variable), B: numeric.
getVectorData(A)
Returns data of the vector variable specified by A. This function is effective for the
variables defined in the Function Setup or Display Setup of the last Classic Test or
the analysis parameters of the last Application Test. The variables are valid in a test
definition.
Example
B=getVectorData("A")
Data type A: string (name of vector variable), B: vector.
index(A,B)
Finds the string B in the string A, and returns the index number where the string B is
first found. The index 0 indicates the first character. The following example returns
3.
Example
C=index("AGILENT","L")
Data type C: numeric.
5- 10
Agilent EasyEXPERT User’s Guide Vol. 1, Edition 1
Built-in Programming Tool
Built-in Functions
integ(A,B)
Performs numerical integration of the expression A by B. Calculation is performed
as follows.
When n = 1, n = 0
When n > 1, n is defined as follows:
AQ
L
Q
3
\\L [L [L L
where,
n:
integral of A for the index number n
yi:
A value for the index number i
xi:
B value for the index number i
If A or B contain some invalid values, the invalid values are ignored for the
calculation.
For subordinate sweep, the first index number of each primary sweep is always 1.
Example
C=integ(A,B)
Data type A, B: vector or numeric, C: vector.
isValid(A)
Returns 1 if the expression A is valid and is not double.NaN, or else returns 0.
Example
B=isValid(A)
Data type A: numeric, B: numeric.
lgt(A)
Returns the logarithm (base 10) of the expression A.
If A=0, -Overflow is returned with the status “Arithmetic error”.
If A is a negative value, the logarithm of the absolute value is returned with the
status “Arithmetic error”.
Example
B=lgt(A)
Data type A: numeric, B: numeric. Or A: vector, B: vector.
Agilent EasyEXPERT User’s Guide Vol. 1, Edition 1
5- 11
Built-in Programming Tool
Built-in Functions
log(A)
Returns the logarithm (base e) of the expression A.
If A=0, -Overflow is returned with the status “Arithmetic error”.
If A is a negative value, the logarithm of the absolute value is returned with the
status “Arithmetic error”.
Example
B=log(A)
Data type A: numeric, B: numeric. Or A: vector, B: vector.
mavg(A,B)
Returns the moving average value of data in the expression A. B specifies how
many data to use for the average. The moving average at the index number n is
defined as follows.
When n r
[Q
QU
UQ
3
[L
L When r < n N-r
[Q
QU
U
3
[L
L Q U
When N-r < n
[Q
U1 Q
1
3
[L
L Q U
where,
xn :
moving average of A for the index number n
xi :
A value for the index number i
r:
B value
N:
number of sweep steps or number of samples
If A contains some invalid values, the invalid values are ignored for the calculation.
For subordinate sweep, the first index number of each primary sweep is always 1.
Example
C=mavg(A,B)
Data type A: vector or numeric, B: numeric, C: vector.
5- 12
Agilent EasyEXPERT User’s Guide Vol. 1, Edition 1
Built-in Programming Tool
Built-in Functions
max(A)
Returns the maximum value of data in the expression A. For subordinate sweep
measurement, this function returns the maximum value of the primary sweep for
each secondary sweep step.
If there are invalid values in A, invalid values are ignored.
Example
B=max(A)
Data type A: vector or numeric, B: vector.
min(A)
Returns the minimum value of data in the expression A. For subordinate sweep
measurement, this function returns the minimum value of the primary sweep for
each secondary sweep step.
If A contains invalid values, the invalid values are ignored.
Example
B=min(A)
Data type A: vector or numeric, B: vector.
readThermometer
OfN1265A(A)
Performs the temperature measurement by using the thermometer channel specified
by the expression A, and returns the measured value. If this function is executed
when a classic test is in progress, this function returns the last measured temperature
value. To enable the thermometer channel, see “UHC Expander / Fixture” on page
1-72. If the thermometer channel is disabled, this function returns NaN.
Example
B=readThermometerOfN1265A(A)
Data type A: numeric (1 or 2), B: numeric (C).
setDeviceId(A)
Sets the value of the string variable A to the Device ID parameter of the test result
record. This value is effective for the test result records created after this function
call. If the A value is an empty string, this function does nothing.
Example
B=setDeviceId(A)
Data type A: string, B: numeric. B (returned value) is always 0.
sin(A)
Returns the sine value of the expression A.
Example
B=sin(A)
Data type A: numeric, B: numeric. Or A: vector, B: vector.
sqrt(A)
Returns the square root of the expression A.
Example
B=sqrt(A)
Data type A: numeric, B: numeric. Or A: vector, B: vector.
Agilent EasyEXPERT User’s Guide Vol. 1, Edition 1
5- 13
Built-in Programming Tool
Built-in Functions
storeAt(A,B,C,D)
Finds a data element in the expression A, and replaces it with the D value, and
returns the result vector data. The data element is specified by the indices B and C.
B is the index for the primary plane of a two-dimensional array and C is the index
for the secondary plane. The index number starts from 1. The following example
replaces the A[5, 5] value with the D value and enters the result vector data to the
variable E.
Example
E=storeAt(A,5,5,D)
Data type A: vector or numeric, B, C, D: numeric, E: vector.
string(A)
Translates the expression A to a string data, and returns it.
Example
B=string(A)
Data type A: numeric or module, B: string.
NOTE
Translating the variable defined with the numeric-symbol assignment
If the argument of the string function is a numeric variable defined with the
numeric-symbol assignment, the string function execution result will be the symbol
assigned to the numeric value, not the string value just translated from the numeric
value. The numeric-symbol assignment is defined in the “Test Specification” on
page 3-5.
For the following example setup of the numeric-symbol assignment,
string(Mode) execution result at Mode=0 is the string OFF, not the string 0.
Parameter Mode, Value=0, Symbol=OFF
substring(A,B,C)
Extracts a string from the string A, and returns it. B is the index used to specify the
first character to extract, and C is the number of characters to extract. The index
number starts from 0. If B or C is not an integer, digits over the decimal point are
used as the integer. The following example returns G.
Example
D=substring("AGILENT",1,1)
Data type A: string, B, C: numeric, D: string.
swmToModule(A)
Searches the measurement module connected to Agilent B2200/E5250 switching
matrix input port number A. And returns the module name.
Example
B=swmToModule(A)
Data type A: string (Input port number 1 to 14), B: module.
tan(A)
Returns the tangent value of the expression A.
5- 14
Agilent EasyEXPERT User’s Guide Vol. 1, Edition 1
Built-in Programming Tool
Built-in Functions
Example
B=tan(A)
Data type A: numeric, B: numeric. Or A: vector, B: vector.
value(A)
Translates the string A to a numeric data, and returns it. If the A value is invalid as
numeric literal, 0 is returned.
Example
B=value(A)
Data type A: string, B: numeric.
Agilent EasyEXPERT User’s Guide Vol. 1, Edition 1
5- 15
Built-in Programming Tool
Read-out Functions
Read-out Functions
The read-out functions are built-in functions for reading various values related to a
analysis tool which is marker, cursor, or line. You can use these functions to perform
complex analysis of the measurement results.
To read the value of the read-out function, use a numeric variable. The following
example reads the X intercept of the line 1 and enters it to the variable A.
Example
NOTE
A=@L1X
In this section, n of the function name is an integer (1 to 8), and m is 1 or 2.
You cannot assign a data variable that includes a read-out function to an axis of a
graphics plot.
If the analysis tool that is referred to by the read-out function is not displayed, the
read-out function uses the position at which it was most recently displayed. If the
analysis tool has not been displayed, the read-out function returns invalid data.
In the application test definition, to use a read-out function in a component such as
ASSIGN, IF, FOR, Application Test, and Classic Test, place the Auto Analysis
component before the component, and set the analysis tool associated with the
read-out function.
Functions for Marker
@MI
Returns the index number of measurement data at the marker location.
If interpolation mode is enabled and the marker is located between the measurement
data, this function returns a non-integer value.
@MX
Returns the value of the X coordinate at the marker location.
@MY
Returns the value of the Y coordinate at the marker location.
If there are two Y axes, this function returns the value for the selected axis.
@MYn
Returns the value of the Yn coordinate at the marker location (n: 1 to 8, integer).
5- 16
Agilent EasyEXPERT User’s Guide Vol. 1, Edition 1
Built-in Programming Tool
Read-out Functions
Functions for Cursor
@CX
Returns the value of the X coordinate at the active cursor position.
@CY
Returns the value of the Y coordinate at the active cursor position. If there are two Y
axes, this function returns the value for the selected axis.
@CYn
Returns the value of the Yn coordinate at the active cursor position (n: 1 to 8,
integer).
Functions for Line
@LmCO
Returns the correlation coefficient of the regression for Line m (m: 1 or 2).
Line m must be in regression mode. If not, this function returns invalid data.
@LmG
Returns the slope of Line m (m: 1 or 2).
If there are two Y axes, this function returns the value for the selected axis.
This function calculates the slope by using the following formula:
•
If the X and Y axes are both linear scale:
= (y1-y0) / (x1-x0)
•
If the X axis is log scale, and the Y axis is linear scale:
= (y1-y0) / (log x1- log x0)
•
If the X axis is linear scale, and the Y axis is log scale:
= (log y1-log y0) / (x1-x0)
•
If the X and Y axes are both log scale:
= (log y1-log y0) / (log x1- log x0)
where,
@LmGn
:
Slope of Line m
x0 , y0 , x1 , y1 :
X and Y coordinate values at the two points where Line m
intercepts the perimeter of the plotting area.
Returns the slope of Line m (m: 1 or 2) for the Yn axis (n: 1 to 8, integer).
This function calculates the slope by using the following formula:
Agilent EasyEXPERT User’s Guide Vol. 1, Edition 1
5- 17
Built-in Programming Tool
Read-out Functions
•
If the X and Yn axes are both linear scale:
= (y1-y0) / (x1-x0)
•
If the X axis is log scale, and the Yn axis is linear scale:
= (y1-y0) / (log x1- log x0)
•
If the X axis is linear scale, and the Yn axis is log scale:
= (log y1-log y0) / (x1-x0)
•
If the X and Yn axes are both log scale:
= (log y1-log y0) / (log x1- log x0)
where,
@LmX
:
Slope of Line m
x0 , y0 , x1 , y1 :
X and Y coordinate values at the two points where Line m
intercepts the perimeter of the plotting area.
Returns the X intercept value (Y=0) of Line m (m: 1 or 2).
If Line m is horizontal, this function returns invalid data.
@LmY
Returns the Y intercept value (X=0) of Line m (m: 1 or 2).
If there are two Y axes, this function returns the value for the selected axis.
If Line m is vertical, this function returns invalid data.
@LmYn
Returns the Yn (n: 1 to 8) intercept value (X=0) of Line m (m: 1 or 2).
If Line m is vertical, this function returns invalid data.
Functions for Two Line Display
@IX
Returns the value of the X coordinate at the intersection of Line 1 and Line 2.
This function calculates the intersection by using the following formula.
X =(y2-y1)/(2-1)
where,
X:
5- 18
Value of the X coordinate at the intersection. If the X axis is log scale,
this function returns 10X.
Agilent EasyEXPERT User’s Guide Vol. 1, Edition 1
Built-in Programming Tool
Read-out Functions
ym :
Y intercept value of Line m (m: 1 or 2). If the Y axis is log scale, ym is
the log value of the Y intercept of Line m.
m :
Slope of Line m
If Line 1 is parallel to Line 2, this function returns invalid data with the status
“Arithmetic error”.
@IY
Returns the value of the Y coordinate at the intersection of Line 1 and Line 2.
If there are two Y axes, this function returns the value for the selected axis.
This function calculates the intersection by using the following formula:
Y = y1+1 (y2-y1)/(1-2)
where,
Y:
Value of the Y coordinate at the intersection. If the Y axis is log scale,
this function returns 10Y.
ym :
Y intercept value of Line m (m: 1 or 2). If the Y axis is log scale, ym is
the log value of the Y intercept of Line m.
m :
Slope of Line m
If Line 1 is parallel to Line 2, this function returns invalid data with the status
“Arithmetic error”.
@IYn
Returns the value of the Yn (n: 1 to 8, integer) coordinate at the intersection of Line
1 and Line 2.
This function calculates the intersection by using the following formula:
Yn = y1+1 (y2-y1)/(1-2)
where,
Yn :
Value of the Yn coordinate at the intersection. If the Yn axis is log
scale, this function returns 10Yn.
ym :
Yn intercept of Line m (m: 1 or 2). If the Yn axis is log scale, ym is the
log value of the Yn intercept of Line m.
m :
Slope of Line m
If Line 1 is parallel to Line 2, this function returns invalid data with the status
“Arithmetic error”.
Agilent EasyEXPERT User’s Guide Vol. 1, Edition 1
5- 19
Built-in Programming Tool
Script Program Statements
Script Program Statements
The program statements are used to define the test execution flow on the Test
Contents tab screen of the Test Definition window. On the screen, click the Program
Component tab. The program statements are listed in the component selection area.
See also “Program Component” on page 3-26.
Local Variable
Definition
This statement defines the local variables used in the test definition. For the setup
editor, see “Local Variable Definition” on page 3-24. For the available names and
variable types, see “Variables and Expressions” on page 5-3.
The local variables are effective only for this test definition.
ASSIGN
This statement enters a value or expression to the variable as follows:
<variable> = <definition>
where, <variable> is the variable to define, and <definition> is the value or
expression.
BLOCK
Beginning of the BLOCK/END BLOCK block. The statements are added to the
program list as a pair. The test execution flow (program) must be defined between
the statements. Optionally, the following statements can be used in this block.
•
ON ERROR
This statement enables an event-initiated branch performed when an error
occurs. The routine to be performed when error occurs must be defined between
ON ERROR and END BLOCK or between ON ERROR and FINALLY.
•
FINALLY
This statement enables an event-initiated branch performed just before
terminating the block. The routine to be performed before terminating the block
must be defined between FINALLY and END BLOCK.
The statements or components between the BLOCK and END BLOCK statements
are performed from top-down. If no error occurs during program execution, the
routine below FINALLY is executed and the block is terminated.
If an error occurs, the error code is stored in the @ERROR system variable, the
routine below ON ERROR is executed, and the block is terminated. If FINALLY is
used, the routine below FINALLY is executed before the block is terminated.
5- 20
Agilent EasyEXPERT User’s Guide Vol. 1, Edition 1
Built-in Programming Tool
Script Program Statements
COMMENT
This statement enters a comment in the program line.
END
This statement terminates program execution. After the END statement, the routines
defined by the FINALLY statement are performed.
ERROR
This statement causes an error. However, no error code is stored in the @ERROR
system variable because of the fictious error.
FOR
Beginning of the FOR/NEXT loop block. FOR and NEXT are added to the program
list as a pair. The statements repeatedly performed when looping must be defined
between the statements. The FOR/NEXT statements are entered as follows:
FOR <variable> = <initial value> TO <terminate value> STEP <step value>
NEXT <variable>
where, <variable> is a variable used for the loop counter. <initial value>,
<terminate value>, and <step value> are values for the loop counter start value, stop
value, and step value respectively.
The EXIT FOR statement is available to exit from the loop before the loop count
reaches <terminate value>. After looping, the next line of NEXT is performed.
IF
Beginning of the IF/END IF block. The statements are added to the program list as a
pair. The IF statement specifies the primary branching condition. The routines
performed when the condition is satisfied are defined between the statements. The
statements are entered as follows:
IF <expression>
END IF
where, <expression> is the condition of branching. Optionally the following
statements can be used in this block.
•
ELSE IF <expression>
This statement specifies the additional branching condition used when the
previous condition is not satisfied, and defines the routines performed when this
branching condition is satisfied.
•
ELSE
This statement defines the routines performed when no branching condition is
satisfied.
Agilent EasyEXPERT User’s Guide Vol. 1, Edition 1
5- 21
Built-in Programming Tool
Script Program Statements
LOOP
Beginning of the LOOP/END LOOP block. LOOP and END LOOP are added to the
program list as a pair. The statements repeatedly performed during looping should
be defined between the statements.
The EXIT LOOP statement is available to exit from the loop. After looping, the next
line of END LOOP is performed.
Example 1
Test definition name: Vth_gmMax
Local Variables Definition
BLOCK
!***** Integration Time Setting *****
IF IntegTime="SHORT"
IntegMode = "MANUAL"
AdcFactor = 8
ELSE IF IntegTime="MEDIUM"
IntegMode = "PLC"
AdcFactor = 1
ELSE IF IntegTime="LONG"
IntegMode = "PLC"
AdcFactor = 16
END IF
!***** I-V Sweep *****
Vth_gmmax
!***** Analysis *****
Auto Analysis
END BLOCK
Line 1: Defines local variables.
Line 2: Beginning of program. Program ends by the END BLOCK statement.
Line 3: Comment line. The COMMENT statement is used.
Lines 4 to 13: Changes the integration time setting by the variable IntegTime value.
Line 14: Comment line. The COMMENT statement is used.
Line 15: Executes Vth_gmmax of the Application Test component to perform Id-Vg
measurement.
Line 16: Comment line. The COMMENT statement is used.
Line 17: Executes Auto Analysis of the Analysis component.
5- 22
Agilent EasyEXPERT User’s Guide Vol. 1, Edition 1
Built-in Programming Tool
Script Program Statements
Example 2
Test definition name: NandFlash IV-Write-IV
Local Variables Definition
BLOCK
!***** Integration Time Setting *****
IF IntegTime="SHORT"
IntegMode = "MANUAL"
AdcFactor = 8
ELSE IF IntegTime="MEDIUM"
IntegMode = "PLC"
AdcFactor = 1
ELSE IF IntegTime="LONG"
IntegMode = "PLC"
AdcFactor = 16
END IF
!***** I/V Sweep & Analysis Initial Characteristics *****
ForcePG2
Id-Vg_Initial
ResetPG
Auto Analysis
(continues to the next page)
Line 1: Defines local variables.
Line 2: Beginning of program. Program ends by the END BLOCK statement.
Line 3: Comment line. The COMMENT statement is used.
Lines 4 to 13: Changes the integration time setting by the variable IntegTime value.
Line 14: Comment line. The COMMENT statement is used.
Line 15: Executes ForcePG2 of the Application Test component to apply pulse from
the Output 2 terminal of Agilent 81110A pulse generator connected to the B1500.
Line 16: Executes Id-Vg_Initial of the Application Test component to perform
Id-Vg measurement.
Line 17: Executes ResetPG of the Application Test component to reset Agilent
81110A.
Line 18: Executes Auto Analysis of the Analysis component.
Agilent EasyEXPERT User’s Guide Vol. 1, Edition 1
5- 23
Built-in Programming Tool
Script Program Statements
(continues from the previous page)
VthInitial = getNumericData("VthBefore")
VgateList = getVectorData("Vgate")
IdInitialList = getVectorData("Idrain")
!***** Force Pulse *****
ForcePG1
ResetPG
!***** I/V Sweep & Analysis after Write *****
ForcePG2
Id-Vg_Written
ResetPG
Auto Analysis
VthWritten = getNumericData("VthAfter")
IdWrittenList = getVectorData("Idrain")
END BLOCK
Lines 19 to 21: Enters the value of the variables (VthBefore, Vgate, Idrain) defined
in the Function Setup or Display Setup of the Id-Vg_Initial test into the local
variables (VthInitial, VgateList, IdInitialList). The ASSIGN statements are used.
Line 22: Comment line. The COMMENT statement is used.
Line 23: Executes ForcePG1 of the Application Test component to perform the
NAND-type flash memory write operation.
Line 24: Executes ResetPG of the Application Test component.
Line 25: Comment line. The COMMENT statement is used.
Line 26: Executes ForcePG2 of the Application Test component.
Line 27: Executes Id-Vg_Written of the Application Test component to perform
Id-Vg measurement.
Line 28: Executes ResetPG of the Application Test component.
Line 29: Executes Auto Analysis of the Analysis component.
Lines 30 to 31: Enters the value of the variables (VthAfter, Idrain) defined in the
Function Setup or Display Setup of the Id-Vg_Written test into the local variables
(VthWritten, IdWrittenList). The ASSIGN statements are used.
Line 32: End of program
5- 24
Agilent EasyEXPERT User’s Guide Vol. 1, Edition 1