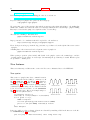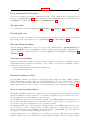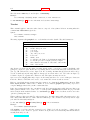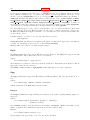
1
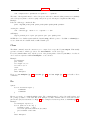
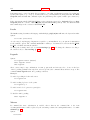
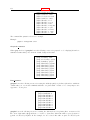
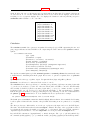
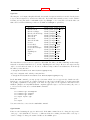
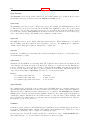
gnuplot 4.6
143
the graph in the x and y directions. Each of these ranges, as well as the rrange, may be autoscaled or set
explicitly. For details, see set rrange (p. 144) and set xrange (p. 159).
Example:
set polar
plot t*sin(t)
set trange [-2*pi:2*pi]
set rrange [0:3]
plot t*sin(t)
The first plot uses the default polar angular domain of 0 to 2*pi. The radius and the size of the graph are
scaled automatically. The second plot expands the domain, and restricts the size of the graph to the area
within 3 units of the origin. This has the effect of limiting x and y to [-3:3].
You may want to set size square to have gnuplot try to make the aspect ratio equal to unity, so that
circles look circular. See also
polar demos (polar.dem)
and
polar data plot (poldat.dem).
Print
The set print command redirects the output of the print command to a file.
Syntax:
set
set
set
set
set
print
print
print
print
print
"-"
"<filename>"
"<filename>" append
"|<shell_command>"
Without "<filename>", the output file is restored to <STDERR>. The <filename> "-" means
<STDOUT>. The append flag causes the file to be opened in append mode. A <filename> starting
with "|" is opened as a pipe to the <shell command> on platforms that support piping.
Psdir
The set psdir <directory> command controls the search path used by the postscript terminal to find
prologue.ps and character encoding files. You can use this mechanism to switch between different sets of
locally-customized prolog files. The search order is
1) The directory specified by ‘set psdir‘, if any
2) The directory specified by environmental variable GNUPLOT_PS_DIR
3) A built-in header or one from the default system directory
4) Directories set by ‘set loadpath‘
Raxis
The commands set raxis and unset raxis toggle whether the polar axis is drawn separately from grid lines
and the x axis. If the minimum of the current rrange is non-zero (and not autoscaled), then a white circle is
drawn at the center of the polar plot to indicate that the plot lines and axes do not reach 0. The axis line is
drawn using the same line type as the plot border. See polar (p. 142), rrange (p. 144), rtics (p. 144),
set grid (p. 115).
Rmargin
The command set rmargin sets the size of the right margin. Please see set margin (p. 125) for details.