1
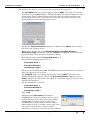
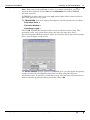
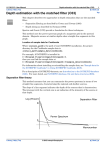
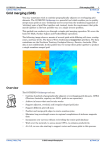
INTREPID User Manual
Library | Help | Top
Levelling—tie line levelling (G13)
1
| Back |
Levelling—tie line levelling (G13)
Top
After correcting our data for the Earth’s regional field (the Geomagnetic Reference
Field or GRF), we can now proceed to further processing of our airborne magnetic
survey data.
We want to remove any remaining data artifacts which are not geological in origin
but are the result of the acquisition procedure. This process is generally referred to as
levelling. In this tutorial we use the INTREPID Level tool to perform the next step
in our processing sequence, which is a type of network adjustment commonly referred
to as tie line levelling.
Context of this guided tour
In the context of your data processing cycle, tie line levelling follows the
magnetic diurnal correction and GRF removal. This Guided Tour assumes you have
already completed the Introduction to the Spreadsheet Editor (G04), removed the
GRF component (G12), and have a diurnally GRF corrected field in your dataset,
ready for further processing.
Overview
Our aim in processing aeromagnetic data is to produce a time-independent map of
local anomalies, with the Earth’s regional magnetic field removed, and with artifacts
caused by errors in the acquisition process removed.
There are several sources of error in a typical airborne magnetic survey. If these
sources of error are not removed during processing the data will contain significant
artifacts. It is important that these be removed before any meaningful analysis or
interpretation of the data can be undertaken otherwise you maybe mislead. For
instance, if the aeroplane flew low over a tin shed or a pipeline and there is a “BLIP”
from that source, this is not geologically significant.
However, in general it is not practical to measure enough physical parameters such
that the data can be processed consistently and predictably by different processors.
Therefore the success of the levelling methods do depend on the judgement of the data
processor.
The INTREPID Level tool allows you to perform several standard corrections on
magnetic, radiometric, FTG, FALCON, airborne gravity and digital elevation data:
•
Aircraft heading effects
•
Parallax corrections
•
Time synchronisation and subtraction of diurnal
•
GRF removal
•
Network adjustment using either polynomial or loop closure methods
The Pro version of this Levelling Tool has a similar look and feel to the original
standard tool. The extra functionality uses gradient and tensor data in the ‘engine
room’ of the separately written library. This compeletely re-written version of the tool
is now what ships as standard. The aim in the rewrite, was to add support for clever
or innovative geophysoical observations to each and every levelling process,
upgrading them away from just working for scalar signal measures. As this is a walk
on the wild side, it takes considerable effort to verify the correct workings of the
Library | Help | Top
© 2012 Intrepid Geophysics
| Back |
INTREPID User Manual
Library | Help | Top
Levelling—tie line levelling (G13)
2
| Back |
algorithms, when expressed in a more general form. So, we have changed the game
when it comes to levelling capabilities. Just you might not have realised this. In
particular, the geophysical field gradient conventions ( East North UP etc) have to be
properly brought to account for vector and tensor operations. At V5.0 INTREPID we
also add GOOGLE protobuf syntax for the batch task files.
INTREPID would recommend a training course be undertaken by groups with
innovative geophysical hardware, wishing to try out this tool. It maybe that some
issues will emerge, as what you are attempting to do, has never been done before!
This Guided Tour covers the process of tie line levelling using two different methods.
The first is the method of polynomial approximations, which involves fitting a
polynomial curve to the intersection errors along a flight, traverse or tie as a function
of time.
The second is the method of loop closure, which uses standard geodetic surveying
procedures to adjust the network of closed loops formed by the intersections of lines
and ties.
Quick review: Airborne surveys are typically flown in a grid pattern, designed to
give duplicate measurements at the intersection points (crossovers) of the tie and
traverse lines. Traverse lines give the primary data coverage. Tie lines provide
control data at the crossovers. Tie line levelling uses the differences in the traverse/
tie data at the intersection points (also called misclosure errors) to systematically
reduce the errors over the whole survey. INTREPID has the convention of storing a
cross-over dataset that mimics the original survey topology, but consists of estimates
of the signal and its gradients, at the cross overs points, together with each possible
correction contribution from the various errors. As it is a standard database, all the
other tools can be used to examins the state.
Location of sample data for Guided Tours
We provide two complete sets of sample datasets, one in INTREPID format and one
in Geosoft format. INTREPID works equally well with both formats. When you want
to open a dataset, navigate to the directory containing the required data format.
Where install_path is the path of your INTREPID installation, the project
directories for the Guided Tours sample data are
install_path\sample_data\guided_tours\intrepid_datasets and
install_path\sample_data\guided_tours\geosoft_datasets.
For example, if INTREPID is installed in
C:\Program Files\Intrepid\Intrepid4.5.nnn,
then you can find the INTREPID format sample data at
C:\Program Files\Intrepid\Intrepid4.5.nnn\sample_data\
guided_tours\intrepid_datasets
This is the default location for the sample data. If you have installed INTREPID
normally, the data resides there. If you have installed INTREPID elsewhere, the
exercises will work just as well. Just use the appropriate pathnames.
For more information about installing the sample data, see "Sample datasets—
installing, locating, naming" in INTREPID Guided Tours Introduction (G01)
For a more detailed description of INTREPID datasets, see Introduction to the
INTREPID database (G20). For even more detail, see INTREPID database, file and
Library | Help | Top
© 2012 Intrepid Geophysics
| Back |
INTREPID User Manual
Library | Help | Top
Levelling—tie line levelling (G13)
3
| Back |
data structures (R05).
Location of sample data for CookBooks
Right next to the Guided tours data, is a rich set of more exotic geophysics datasets
and grids, already prepared for the cookbook training sessions. A casual user might
also gain some trial and error insights into the capbilities of the software, just by
testing the Project Manger’s ability to preview and describe the attributes of each of
the cookbook datasets.
Library | Help | Top
© 2012 Intrepid Geophysics
| Back |
INTREPID User Manual
Library | Help | Top
Levelling—tie line levelling (G13)
4
| Back |
Steps to follow
Tie line levelling using polynomial approximations
1
Launch the Levelling Tool
Start the Project Manager. Navigate to the directory
install_path\sample_data\guided_tours\intrepid_datasets. From
the Levelling Menu, launch Tie Line levelling. The INTREPID Levelling tool
appears.
2
Open the input dataset and field
From the File menu, choose Specify Input. The Select Database chooser appears.
Select the dataset albury..DIR and choose Open. The Select Signal Field
chooser appears. Select magdigrf from the list of dataset fields and choose OK.
Library | Help | Top
© 2012 Intrepid Geophysics
| Back |
INTREPID User Manual
Library | Help | Top
3
Levelling—tie line levelling (G13)
5
| Back |
Specify the output field name
From the File menu, choose Specify Output. If a Save Dataset dialog box appears,
select albury..DIR. The Save Levelled Signal dialog box appears. Click in the
Enter New Field Name text box and delete any text that is in it (possibly Zout).
Now type magdpoly for the new field name. Choose OK.
4
Reconstruct the flights
The process of reconstructing the flights sorts the data into chronological order.
This is a necessary step if the Levelling tool is to do any time-based processing.
The sort is only applied temporarily, and it does not affect your dataset.
Quick review: INTREPID tie line levelling involves fitting a polynomial curve to
the intersection errors along a flight, traverse or tie as a function of time. These
polynomials (also called drift curves) are then subtracted from the data, reducing
the intersection errors. For the method to work properly the data must be ordered
correctly in time.
To reconstruct the flights, from File, select Reconstruct Flights, and then Date/
time Fids. The Load Date chooser appears. Select date from the list of fields and
choose OK.
The Optional Time chooser appears. Select time from the list of fields and choose
OK.
The FID Factor and date style dialog box appears. The FID factor is the number of
seconds per fiducial. Leave it as 0.1 (default). The date style for this dataset is
YYMonthDay. Select it in the date style list. If you wish you may verify this
yourself by using the Project Manager to obtain statistics for the date field.
Library | Help | Top
© 2012 Intrepid Geophysics
| Back |
INTREPID User Manual
Library | Help | Top
Levelling—tie line levelling (G13)
6
| Back |
When you are finished choose OK on the FID Factor and date style dialog box.
INTREPID sorts the dataset according to date and time. This operation takes a
few seconds. When it is completed a report appears on the right hand side of the
Levelling tool window, showing the number of acquisition lines, tie lines and
flights that make up the dataset.
Levelling produces a detailed flight reconstruction report as part of the
prolevelling.rpt file.
5
Find the crossover points
Choose Find Crossovers (The button is located at the bottom of the Levelling tool
window). The Choose Filter dialog box appears. For magnetic survey data there is
usually no need to apply a filter before finding the crossovers, as the signal has
been despiked already. Choose the default None setting. Choose OK.
The Search radius for Gradient chooser appears. Choose the default Ignore
setting. This option is only relevant for XY positional error analysis. Choose OK.
INTREPID calculates and displays the crossover points. These are the points at
which the traverse lines and tie lines intersect.
6
Display crossover point information
From the Display menu, select Misclosure. INTREPID colours the crossover
points according to the sign of the misclosure errors. Remember that the
Misclosure is the difference between the tie/traverse data value for the selected
crossover. If the traverse line data value is higher than the tie line data value, the
crossover point is coloured red. If the tie line data value is higher, it is coloured
black.
Library | Help | Top
© 2012 Intrepid Geophysics
| Back |
INTREPID User Manual
Library | Help | Top
Levelling—tie line levelling (G13)
7
| Back |
Select one of the coloured crossover points and observe the contents of the Current
Crossover report on the right hand side of the Levelling tool window. The report
provides information about that particular crossover point.
Note: If at any stage of the tutorial the Levelling tool window gets overwritten by
other windows, you can easily recover the display by choosing Zoom in then Zoom
out. Refresh problems can also be fixed by covering then uncovering the tool
window with a File Explorer window.
7
Select the Principal tie line and create a tie list
Quick review: INTREPID processes the tie lines in a certain order which must
be established by the user to get the best results. The Principal tie line is chosen
first. It is the absolute reference for the levelling and is assumed to have zero
drift. The Principal tie line should be what you consider to be the best levelled tie
line. The next 2 or 3 tie lines in the list should be as far away as practicable from
the Principal tie line.
From the Tie Line menu, select Create List. Select the middle tie line. (Keep
selecting it until it registers.) The Current Crossover report displays information
about the crossover point you have selected. From the Tie Line menu, select Show
List. An information box appears, showing you the Principal tie line you have
chosen. If you selected the middle tie line, the box shows line 174071.
Choose OK to dismiss the Information box. Now select the most eastern tieline in
the survey. The Current Crossover report updates to display information about
the crossover point you have selected. From the Tie Line menu, select Show List.
Your list of ties should now contain two lines—174071 and 174091.
Choose OK to dismiss the Information box.
Library | Help | Top
© 2012 Intrepid Geophysics
| Back |
INTREPID User Manual
Library | Help | Top
Levelling—tie line levelling (G13)
8
| Back |
From the Tie Line menu, select Complete List. Now select Show List. You should
now have a list of ties which includes all of the tie lines in your survey. Choose OK
to dismiss the Information box.
8
Select the levelling correction type
From the Corrections menu, select Polynomial levelling. The Select weighting
method parameter box appears. For this magnetic survey, choose All weights 1.
and choose OK.
9
Enter parameters for the polynomial correction
Quick review: Drift curves are approximated by fitting polynomials to the
intersection errors. The method works better if the polynomials are fitted to a
smaller section of the data called a piecewise window, and then moved along the
data, rather than trying to fit a polynomial curve to the entire dataset. The user
can control the width of the piecewise window.
The ends of the polynomial curves are smoothed to improve the fit at the ends of
traverse and tie lines. The user can control the smoothing length.
Restrictions apply on the maximum order of the fitted piecewise polynomial. The
user can control the order of correction function.
The Select defaults for polynomial box appears. Set the following parameter
values:
Smoothing length 3
Order of correction function 1
Width of piecewise window 9
Check the box alongside Level flights assuming
that tie lines are correct. When you have finished
adjusting the parameters choose OK.
Quick review: The tie line levelling process
consists of four basic stages:
Library | Help | Top
•
INTREPID levels all tie lines to the Principal tie line
•
INTREPID levels whole flights of data to the levelled tie lines
•
INTREPID levels individual traverse lines to the levelled tie lines
•
INTREPID levels tie lines to the levelled traverse lines
© 2012 Intrepid Geophysics
| Back |
INTREPID User Manual
Library | Help | Top
Levelling—tie line levelling (G13)
9
| Back |
10 Examine the drift curves and apply the polynomial fitting process
The TIE LINES drift curve graph appears. Choose NEXT. The drift curve for the
Principal tie line 174041 appears. Misclosure errors are plotted along the Y-axis
of the graph. Time is plotted along the X axis. The red squares represent the
misclosure errors for the crossover points along the line. The black line is the
polynomial curve fit to the misclosure errors.
Change the Polynomial Order parameter to 3 then select APPLY. Observe how
the drift curve changes shape.
Note: If you change any of the Polynomial Order, Piecewise Window or
Smoothing Length parameters and select APPLY, INTREPID recalculates and
replots the drift curve for the current line or flight.
Reset the parameter for the Polynomial Order to 1.
The parameters should now be set as:
Polynomial Order 1
Piecewise Window 9
Smoothing Length 3
When you are finished choose OK. INTREPID calculates drift curves for all the tie
lines. This process is very quick.
The FLIGHTS drift curve display box appears. Choose NEXT. The drift curve
graph for Flight 25 appears. Change the Piecewise Window to 29 then select
APPLY. Observe how the drift curve takes on a smoother shape as the piecewise
window size increases.
Set the parameters as follows:
Polynomial Order 1
Piecewise Window 29
Smoothing Length 3
Choose OK.
What does this Information box indicate?
INTREPID has found two flights that it cannot
correct. The reason for this is that those flights
consist only of tie lines. Since at this stage
INTREPID is using levelled tie lines to adjust
whole flights of data, if a flight consists only of tie
lines there cannot be any crossover points.
Therefore no correction is possible for these flights.
Library | Help | Top
© 2012 Intrepid Geophysics
| Back |
INTREPID User Manual
Library | Help | Top
Levelling—tie line levelling (G13)
10
| Back |
Note: This is not really an Error as such—it is simply alerting to you to an
unusual data condition. Choose OK on the Information box and INTREPID
proceeds normally.
INTREPID calculates drift curves for only those flights which contain traverse
lines. This process is very quick.
The TRAVERSES drift curve display box appears. Set the parameters as follows:
Polynomial Order 1
Piecewise Window 9
Smoothing Length 3
Choose OK. INTREPID calculates drift curves for all the traverse lines. This
operation is also very quick. Observe how the traverse lines have fewer
intersection points than the tielines, which in turn have fewer intersection points
that a typical flights worth of data.
The Please Choose chooser appears. INTREPID gives you the option of applying
another round of tie line/flight/traverse line levelling using the adjusted
misclosure errors. In practice we find that nearly all of the error adjustments are
made in the first polynomial fitting iteration. Choose No.
Library | Help | Top
© 2012 Intrepid Geophysics
| Back |
INTREPID User Manual
Library | Help | Top
Levelling—tie line levelling (G13)
11
| Back |
11 Apply the levelling adjustments to the data and create the output field
Choose Apply Corrections. (The button is located at the bottom of the Levelling
tool window). The Apply Save dialog box appears. Under Choose Corrections to
Apply, check the LevelPOLY box. Now choose Apply.
Quick review: At this stage INTREPID has only calculated the adjusted values
at each crossover point. These corrections are now interpolated along each line by
a local splining procedure, and applied to create an output field.
___
When completed an information box appears telling you that the process is
finished. INTREPID produces a report file called levelling.rpt. Choose OK on the
information box.
You have now completed the tie line levelling correction. At this point you should
have a new tie line corrected field in your dataset called magdpoly.
12 Exit from the tool.
To exit from the Levelling tool, choose Quit from the File menu. The Please
Choose chooser appears. INTREPID gives you the option of saving the crossover
points to an INTREPID point dataset. Choose No. Do you really want to quit?—
choose Yes.
The levelling.rpt file opens in Notepad. You can examine this report file if you
wish, and exit from it when you are finished.
It constains a complete summary of all the steps you have taken
1
Flight reconstruction, showing a coherent temporal view of how the data was
collected.
2
Crossover network report.
3
Before and after statistics for the signal field that is being levelled.
Tie line levelling using loop closure
The loop closure method is much simpler to run than the method of polynomial
approximations. The process itself requires no parameters. This was the first of the
more traditional levelling methods upgraded to support tensors and vectors.
Library | Help | Top
© 2012 Intrepid Geophysics
| Back |
INTREPID User Manual
Library | Help | Top
1
Levelling—tie line levelling (G13)
12
| Back |
Launch the Levelling Tool
Start the Project Manager. Navigate to the directory
install_path\sample_data\guided_tours\intrepid_datasets. From
the Levelling Menu, launch Tie Line levelling. The INTREPID Levelling tool
window appears.
2
Open the input dataset and field
From the File menu, choose Specify Input. The Select Database chooser appears.
Select the dataset albury..DIR and choose Open. The Select Signal Field
chooser appears. Select magdigrf from the list of dataset fields and choose OK.
3
Specify the output field name
From the File menu, choose Specify Output. The Save Levelled Signal chooser
appears. Click in the Enter New Field Name text box and delete Zout. Now type
magdloop for the new field name. Choose OK.
4
Reconstruct the flights—as before
5
Find the crossover points - as before
6
Select the levelling correction type
From the Corrections menu, select Loop Closure. INTREPID calculates the
required network adjustment using the loop closure method. This process is very
quick.
7
Apply the levelling adjustments to the data and create the output field
Choose Apply Corrections. (The button is located at the bottom of the Levelling
tool window). The Apply Save dialog box appears. Under Choose Corrections to
Apply, check the LevelLoop box. Now choose Apply.
When completed an information box appears telling you that the process is
finished. INTREPID produces a report file called levelling.rpt. Choose OK on the
information box.
You have now completed the tie line levelling correction. At this point you should
have a new tie line corrected field in your dataset called magdloop.
8
Exit from the tool.
To exit from the Levelling tool, choose Quit from the File menu. The Please
Choose chooser appears. INTREPID gives you the option of saving the crossover
points to an INTREPID point dataset. Choose No. Do you really want to quit?—
choose Yes.
The levelling.rpt file opens in Notepad. You can examine this report file if you
wish, and exit from it when you are finished.
Library | Help | Top
© 2012 Intrepid Geophysics
| Back |
INTREPID User Manual
Library | Help | Top
Levelling—tie line levelling (G13)
13
| Back |
Further things to consider
Which method is quicker to run—loop closure or polynomial approximation? Which
method gives better results—loop closure or polynomial approximation?
In practice loop closure levelling does not work as well as polynomial levelling in
areas of high magnetic gradient. However if the range of misclosures values is low
across the dataset it is an effective method. For this reason it also work well on other
types of data such as DEM and radiometric data which tend to have a lower range of
misclosures.
Which method gives the user more control over the levelling process?
If you have time, repeat the polynomial levelling using a higher polynomial order.
Does a higher order necessarily improve the result? —not necessarily.
Key points for this guided tour
In this guided tour you have:
•
Used the Levelling Tool to tie line level the data using polynomial approximations
•
Used the Levelling Tool to tie line level the data using loop closure
Frequently Asked Questions
Q : Can I remove bad crossover points from the levelling process?
A : Yes, individual crossover points can be turned on or off.
Q : Can I remove all crossover points which have a misclosure greater than 10
from the levelling process?
A : Yes, the Level tool support a logical expression language which allows this.
Q : Why would I want to save the crossovers to an INTREPID dataset?
A : You can re-use the crossovers which saves having to calculate them again. For a
very large dataset this saves computing time. It is also a useful quality control measure
about the survey itself.
Q : Can I do levelling of integrated signal and its gradients?
A : The Pro version of the tool uses the Observed Field datatype. This enables you to
group the signal and its three gradients and to loop level all parts simultaneously.
Q : Can I level full tensor curvature gradients?
A : Yes, the Pro version supports heading, loop and altitude corrections for full tensor
gradient data. The big difference for heading errors is that really the error is poorly
charaterised as just this, when Roll Pitch and Yaw are all implicated, and tensors are
very unforgiving when it comes to rotational errors that flow into the components due
to aircraft poor attitude measurements. INTREPID uses the 4 cardinal flying
directions to gather part survey statistics for vectors and tensors, as a basis for making
simple “Heading” corrections.
Q : Can I do an altitude drape correction?
A : New to this version is support for doing continuation of any supported signal from
an observed drape to a required drape flying height. V5.0 goes further in this regard,
by using spatial indexing and truncated Fourier series in another novel algorithm
Library | Help | Top
© 2012 Intrepid Geophysics
| Back |