1
Network Analysis
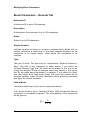
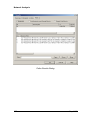
Results Graphs
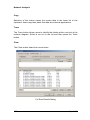
Results graphs are displayed when the user selects the ‘Results’ tab
above the right-hand NAP window. Graphs are provided for criticality
values.
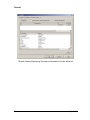
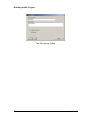
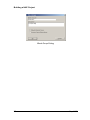
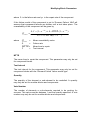
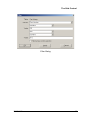
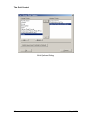
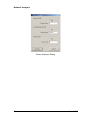
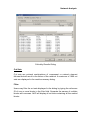
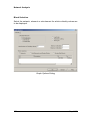
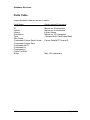
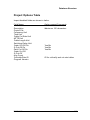
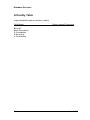
Graph options may be modified by selecting the ‘View, Graph Options’
pull-down menu option or equivalent toolbar button. The Graph Options
Dialog will appear allowing the user to modify the following settings.
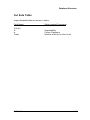
Criticality Measure
The criticality measure to be displayed.
Log Scale
Indicates a log scale is to be used if checked.
Automatic Scaling
Indicates that minimum and maximum scale values are to be automatically
if checked.
Show Grid
A background grid will be displayed if checked.
Max. Number of Criticality Values
The maximum number of criticality values to be displayed. NAP will
display the blocks with the highest criticality values.
Minimum Criticality
The minimum scale value for the graph.
Maximum Criticality
The maximum scale value for the graph.
NAP V1.0
103