1
Basic Radar Altimetry Toolbox User Manual
48
5.2. ‘Z=F(Lon, Lat)’
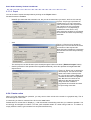
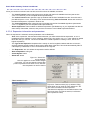
In the 'File' menu, you can save your plot, in different image format (bmp – windows bitmap – jpeg, png, pnm or
tiff).
The 'View' menu enables you
-
-
to display or not display the right-hand panel with the properties.
display the color bar or not
display the animation toolbar (if relevant, i.e. if you are visualising a series of fields with the same name
and chose the option ‘With animation’). Once in this toolbar, you can launch the animation of the fields,
stop it and control its speed.
to open the color table editor and the contour table editor
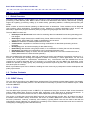
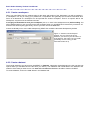
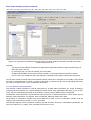
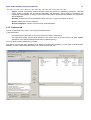
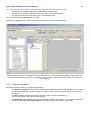
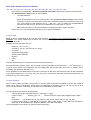
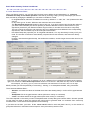
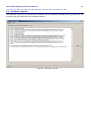
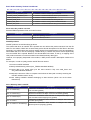
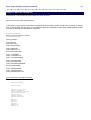
Figure 38: Animation toolbar (available for a series of fields with the same name, option ‘ With animation’ chosen).
The animation is available as visualisation (not to be saved). ‘ Animate’ launch the animation, Reset reset the
animation to the first frame. The number after is the number of the frame. ‘ Loop’ enables to loop the animation and
‘Speed’ to choose its speed (in frames per second).
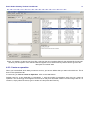
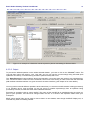
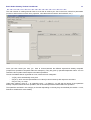
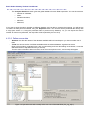
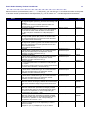
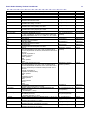
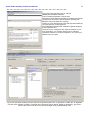
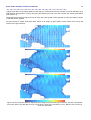
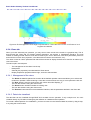
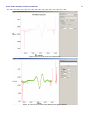
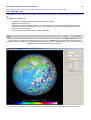
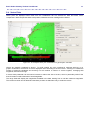
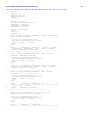
Figure 39: An example Z=F(lon, lat) visualisation, with default projection (3D) and the ‘Ozone’ color table