1
An Interactive, Source-Centric, Open Testbed for
Developing and Profiling Wireless Sensor Systems
Andrew R. Dalton, Jason O. Hallstrom
School of Computing
Clemson University
Clemson, SC 29634-0974, USA
{adalton, jasonoh}@cs.clemson.edu
Abstract
The difficulty of developing wireless sensor systems is widely recognized. Problems associated
with testing, debugging, and profiling are key contributing factors. While network simulators
have proven useful, they are unable to capture the subtleties of underlying hardware, nor the
dynamics of wireless signal propagation and interference; physical experimentation remains a
necessity. To this end, developers increasingly rely on shared deployments exposed for physical
experimentation. Sensor network testbeds are under development across the world.
We present a complementary testbed architecture that derives its novelty from three characteristics. First, the system is interactive; users can profile source- and network-level components
across a network in real time, as well as inject transient state faults and external network traffic.
Second, the system is source-centric; it enables automated source code analysis, instrumentation,
and compilation. Finally, the design is open; developers can extend the set of exposed interfaces as appropriate to particular projects without modifying the underlying middleware. We
present the testbed design and implementation, a graphical user interface, a shell-based macroprogramming interface, example scenarios that illustrate their use, and discuss the testbed’s
application in the research and teaching activities at client institutions.
Keywords: sensor networks, testbeds, testing, experimentation, instrumentation, debugging,
profiling
1
Andrew R. Dalton, Jason O. Hallstrom
1
An Interactive, Source-Centric, Open Testbed
Introduction
Wireless sensor networks are key enablers of the ubiquitous computing vision. Deployments support
ecological monitoring [66, 43, 31, 37], structural damage detection [8, 27], wildfire prediction and
tracking [29, 17], disaster response [36], intruder detection and classification [4, 1], and myriad
other scenarios. The lowest tiers of these networks are composed of “motes” [63], tiny computing
devices that sense, process, and communicate environmental stimuli. With form factors that range
from matchbox- [12] to quarter-size [13], motes can be unobtrusively deployed at ultra-dense scales.
Deployments have already surpassed the 1,000 node threshold [4].
Despite the increase in application opportunities, sensor systems remain difficult to develop.
Applications typically include network-specific data aggregation protocols, signal processing algorithms, and power management services; large-scale parallelism and distribution characterize the
common case. The resulting complexity is at tension with the limited resource capacity of the hosting devices, the gross unpredictability of the underlying channels, and the limited tools available
to support system debugging and profiling. One consequence is the widely recognized difficulty of
achieving predictable performance, and the consequent necessity of rigorous experimentation and
evaluation.
Network simulators such as ns-2 [39], and more specialized sensor network simulators such as
TOSSIM [35] and Avrora [55], have helped. Developers are able to prototype and simulate their
systems to gain initial measures of correctness and performance. The tools have not, however,
eliminated the need for physical experimentation. Existing simulators are unable to capture the
complex dynamics of wireless signal propagation and interference [71, 54], nor are they able to
capture hardware subtleties that affect performance, such as preemption priority, clock rate variation, and load-induced behavioral anomalies. As a result, empirical evidence gathered through
simulation often fails to translate to real deployments.
Yet physical experimentation presents its own challenges. Wireless network reprogramming
is possible (e.g., using Deluge [32]), but the required programming time is significantly greater
2
Andrew R. Dalton, Jason O. Hallstrom
An Interactive, Source-Centric, Open Testbed
than if the constituent devices were programmed directly (but in parallel). More important is the
void in infrastructure support for runtime debugging, profiling, and experimentation. Motes are
“headless”; debugging and profiling messages are logged to a base station, or stored in EEPROM
for later analysis. The requisite instrumentation logic must be developed and integrated a priori.
In effect, the “interesting” portions of an application —those portions that might conceal defects—
must be identified and instrumented in advance. As a result, developers do not benefit from the
rapid maintenance, deployment, and debugging cycles used to improve programmer productivity
and system reliability in other development domains.
Contributions. To address these limitations, we present the design and implementation of a
wireless sensor network testbed tailored to support system debugging, profiling1 , and experimentation. The supporting middleware platform exposes multiple physical deployments, shared, in effect,
as virtual devices accessible to a distributed research community. The installation reported here
includes 80 devices, expandable to an arbitrary size. The principal contribution of the architecture lies in the design of the supporting middleware platform, and the synergistic combination of
features it provides. The platform is engineered to be interactive, source-centric, and open.
By interactive, we refer to a design that enables users to profile source- and network-level components in real-time, as well as inject network packets and state modifications. This improves
developers’ ability to evaluate system performance, localize defects, and observe behaviors in the
presence of anomalous network conditions and transient faults. By source-centric, we refer to a
design that targets application source materials, as opposed to application images; source-centered
features include automated analysis, instrumentation, and compilation services. These services
improve programmer productivity by eliminating the need for manual integration of testbed management components. Equally important, the services increase the level of implementation detail
available to software testers, and provide a foundation for software configuration testing. A range of
application configurations can be evaluated without the expense of developing the individual vari1
We use the term “profiling” to refer to the process of collecting system events and state information during
program execution (e.g., state changes, radio events, voltage data). The collected data may be analyzed in real time,
or stored for ex post facto analysis.
3
Andrew R. Dalton, Jason O. Hallstrom
An Interactive, Source-Centric, Open Testbed
ants. Finally, by open, we refer to a design that enables developers to extend the set of interfaces
used to access the testbed without modifying —or even restarting— the underlying middleware.
Developers may choose to use the default graphical user interface, the default shell scripting interface, or a custom interface appropriate to a particular system or experimentation task.
We refer to the testbed architecture as the “ NESTbed”, for “Network Embedded Sensor Testbed”.
While much of the design is platform independent, the current implementation targets applications
developed using nesC [24] and TinyOS [30, 59]. We take this platform to represent the state-ofthe-art in sensor network platforms, and the evolving de facto standard.
Novelty. A number of testbeds have been discussed in the literature, including architectures
tailored for 802.11 networks [72, 16, 34, 47, 44, 68, 7], and more recently, wireless sensor networks [21,
61, 28, 67, 33, 64]. While a detailed discussion of related work appears in Section 6, it is useful
at this point, given the number of related systems, to preview the points of novelty in our work.
In short, the novelty lies in the three distinguishing characteristics of the supporting middleware:
interactive, source-centric, and open.
• Interactive. Existing sensor testbeds are largely batch-based; they provide few features
for real-time debugging and experimentation. They do not, for instance, provide integrated
support for real-time network- and source-level profiling (without a priori knowledge of the
elements to be profiled), nor do they support source-level fault injection. This lack of execution accessibility reduces developer productivity, and limits possible evaluation scenarios,
including those designed for assessing state-related fault tolerance properties.
• Source-Centric. Existing sensor testbeds are image-based; developers are required to upload
precompiled applications that include requisite testbed management components integrated
by the developer. Consequently, existing designs preclude automated source-level analyses,
instrumentation services, and build processes. This imposes a burden on developers responsible for testbed-specific component integration, reduces the level of implementation detail
exposed by the testbed, and limits the efficacy of software configuration testing to evaluate
4
Andrew R. Dalton, Jason O. Hallstrom
An Interactive, Source-Centric, Open Testbed
program variants.
• Open. Existing sensor testbeds are principally realized as web-based systems that expose
their services through standard forms pages. This approach prevents client institutions from
extending testbed functionality without modifying the shared server installation. Remote
developers are unable, for instance, to construct specialized testbed driver components, or
interfaces tailored to particular experimentation tasks or applications.
The point of departure for our work is the observation that these characteristics are fundamental
to a testbed engineered to support rapid debugging, profiling, and experimentation — the focus of
the NESTbed system.
Paper Organization. The remainder of the paper is organized as follows. Section 2 presents
an overview of the NESTbed system architecture, including the key hardware and software components underlying its design. Section 3 presents use-case scenarios that highlight key features and
benefits of the system. The scenarios are presented in the context of the default graphical interface.
The shell-based scripting interface is presented in Section 4, along with a representative use-case
scenario. Section 5 discusses current applications of the system in the research and teaching activities at client institutions. Section 6 compares the NESTbed system to existing testbeds discussed
in the literature. Finally, Section 7 concludes with a summary of contributions and pointers to
future work.
2
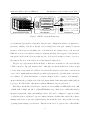
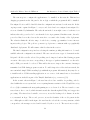
System Architecture
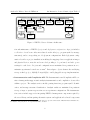
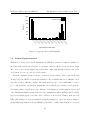
The NESTbed system architecture is illustrated in Figure 1. The architecture is composed of three
layers: (i) physical network deployments, (ii) a centralized application and database server, and
(iii) client interfaces for remote users, who may optionally connect one or more remote sensor
subnets. We briefly describe each of the architectural layers in the paragraphs that follow.
The system supports multiple physical deployments. Given the design goal of enabling interactive use, each deployment is dedicated to a single user at a given time. Multiple users may, however,
5
Andrew R. Dalton, Jason O. Hallstrom
An Interactive, Source-Centric, Open Testbed
Configuration API
Inst. and Comp. API
GUI / Shell Interface
RMI
Deployment API
USB
Profiling API
RMI
Power Control API
Custom Application Interface
Gateway Control API
SF
Physical Network Deployments
SF (IP) Ports
SF
Server Back-End
Remote Sensor Subnet
Client Interfaces
Figure 1: NESTbed System Architecture
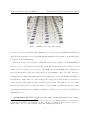
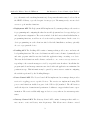
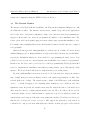
access different deployments concurrently. Our prototype configuration includes one physical deployment consisting of 80 Tmote Sky [42] devices arranged in a dense grid. Small web cameras
mounted overhead provide streaming video feeds that show the actuation state of the network.
While the feeds are not strictly necessary for gathering this state, they appear to have an important psychological benefit. Users note that the video feeds provide an improved sense of presence;
they support the view of the testbed as a locally attached virtual device.
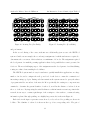
The prototype deployment is shown in Figure 2. Each mote is attached to the server through
a USB connection. The grid measures 4’x8’. Although our current facility is not large enough
to house such a deployment, the addition of wireless USB extenders would enable connections in
excess of 150’, significantly increasing the potential deployment scale, especially if the connections
were chained. No additional hardware or software changes would be required. It is natural to
question whether the geographic scale of the deployment admits of interesting (and realistic) wireless
topologies. We will return to this question with an affirmative response in Section 3.
Each Tmote Sky includes a 16-bit microcontroller clocked at 8Mhz, a 2.4GHz ZigBee radio, 48K
of ROM, 10K of RAM, and 1M of off-chip EEPROM storage. Each device additionally includes
integrated temperature, light, and humidity sensors, and can be configured to support a range
of additional sensors. Each mote exposes a unique hardware identifier that enables the software
running on the server to associate a physical grid position with the device, independent of how the
operating system assigns port addresses. This allows the server to preserve mote addressability
6
Andrew R. Dalton, Jason O. Hallstrom
An Interactive, Source-Centric, Open Testbed
Figure 2: NESTbed Prototype Deployment
across reboots. We note that the total equipment cost for the prototype installation, including the
application and database server, is less than $10,000, making the deployment economically feasible
to replicate at other institutions.
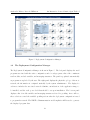
The back-end server hosts a suite of APIs that enable remote clients to work with NESTbed
projects on one or more network deployments. Each API is implemented as a collection of Java
RMI objects2 [52] referred to as “managers”. The RMI-based design simplifies the construction of
remote client interfaces, and exposes the testbed for programmatic control. We will consider two
client interfaces, designed and implemented independently, in Section 3. As illustrated in Figure 1,
the API suite consists of six core components: (i) the Configuration API, (ii) the Instrumentation
and Compilation API, (iii) the Deployment API, (iv) the Profiling API, (v) the Power Control API,
and (vi) the Gateway Control API. The manager objects within each API, and the key resource
dependencies among them, are illustrated in Figure 3. The services provided by each API are
summarized below.
• Configuration API. The Configuration API consists of managers that support the construc2
Our current API implementation uses the Java Remote Method Protocol (JRMP) for interprocess communication,
requiring that client interfaces be implemented in Java. With minor modifications, the Internet Inter-Orb Protocol
(IIOP) could be used [53] to enable CORBA compatibility, eliminating this restriction.
7
Andrew R. Dalton, Jason O. Hallstrom
An Interactive, Source-Centric, Open Testbed
Configuration
Managers
Inst. and Comp.
Managers
Deployment
Manager
Data
Adapters
nesC Weaver
File
System
Persistent
Store
Makefile
Weaver
Profiling
Manager
Power Control
Manager
GW Control
Managers
Serial
Forwarders
SF (IP)
Ports
Figure 3: NESTbed Server Software Architecture
tion and maintenance of NESTbed projects and deployment configurations. A project includes
a collection of nesC source files, meta-data about the files (e.g., program symbols, message
structures), and a corresponding set of deployment configurations. Each deployment configuration describes a project installation, including the mappings between application images
and physical devices, network- and source-level profiling to be performed, and radio power
settings for each device. Projects and configurations are maintained in a persistent store to
maintain experimental controls across runs3 . Data adapter objects abstract the underlying
storage technology (e.g., MySQL, PostgreSQL) to enable pluggable storage implementations.
• Instrumentation and Compilation API. The Instrumentation and Compilation API consists of managers that support static analysis, instrumentation, and compilation of source files
within a project. The analysis services include parsing functions, program symbol identification, and message structure identification. Analysis results are maintained in persistent
storage to improve system response time across experiment configurations. The instrumentation services include support for integrating NESTbed management components required by
the server library, and integrating alternative system- and application-level nesC components
3
Note, however, that some experimental controls can not be preserved in software. External network interference,
for instance, may vary from one experimental run to another.
8
Andrew R. Dalton, Jason O. Hallstrom
An Interactive, Source-Centric, Open Testbed
(e.g., alternative radio stack implementations). Component alternatives may be selected from
the NESTbed library, or provided as part of a user project. The managers rely on source-level
weavers to perform these functions.
• Deployment API. The Deployment API is implemented by a manager that provides services
for programming and configuring the shared network deployments based on a specified project
and deployment configuration. The services include both whole-network and individual mote
programming functions, as well as error detection and reporting features. In the event of a
device programming error, the client is notified of the failed installation, and may optionally
choose to reprogram the device.
• Profiling API. The Profiling API consists of managers that provide source- and networklevel profiling functions. The source-level functions enable remote clients to dynamically read
and write program variables associated with the application image executing on a device.
The network-level functions enable clients to subscribe to one or more message streams corresponding to the network messages received by a specified network subset. Recall that the
program symbols and message structures associated with each application are maintained in
persistent storage. This information may be queried by remote users to assist in configuring
the activities performed by the Profiling Manager.
• Power Control API. The Power Control API is implemented as a manager that provides
services for toggling power to specified devices. The services are implemented using USB
power control functions included as part of the USB 2.0 [11] standard. The API services
enable the injection of transient and persistent node failures to support fault-tolerance experimentation. The services additionally support device recovery when nodes enter unresponsive
states.
• Gateway Control API. The Gateway Control API consists of managers that enable remote users to create and destroy network gateways. This allows remote clients to extend
9
Andrew R. Dalton, Jason O. Hallstrom
An Interactive, Source-Centric, Open Testbed
static NESTbed deployments with remote networks, system controllers, and applications.
Developers can, for instance, inject live sensor data into a NESTbed deployment from an
outdoor field experiment. The API manages a set of TinyOS SerialForwarder instances4
that serve as mote-to-TCP bridges, one for each device. Messages received by a mote over its
wireless radio are forwarded through its USB connection, and retransmitted at an advertised
port by the server. Messages received at a port are forwarded to the corresponding device
through its USB connection, and retransmitted over its wireless radio.
The NESTbed system includes two default user interfaces. The first is a graphical user-interface
designed to enable “user-friendly” NESTbed access. The second is a shell-based interface that
provides scripting services for complex experimentation tasks, or tasks involving a large degree
of repetition. In the next sections, each interface is used to illustrate the testbed functionality
summarized here. We emphasize, however, that the testbed services are exposed by the NESTbed
server. Other researchers may choose to access this functionality through a custom interface. In
the case of a deployment intended for continuous use, for example, researchers might choose to
develop a scheduling system on top of the exposed services.
3
System Use-Cases
We now turn our attention to a series of use-cases that illustrate the features and benefits of the
NESTbed system. We begin with a scenario involving the development of a multi-hop sensing
application. The scenario assumes the use of the NESTbed graphical interface.
3.1
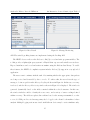
The NESTbed Manager
The interface is Java-based, and supports “one-click” web deployment using Java Web Start. The
initial NESTbed Manager window is shown in Figure 4. The first display segment lists the physical
network deployments available for use. In the prototype installation, the “Ultra-Dense Network”
4
The SerialForwarder libraries are packaged as part of the TinyOS distribution [59].
10
Andrew R. Dalton, Jason O. Hallstrom
An Interactive, Source-Centric, Open Testbed
Figure 4: NESTbed Manager
is the only available deployment. This information is configured statically by the system administrator. The second and third segments display the associated NESTbed projects and deployment
configurations populated by system users. Project and configuration management functions (e.g.,
for adding projects, cloning configurations) are realized by the Configuration API exposed by the
server.
The scenario begins with the selection of a physical network deployment, and the creation of
an associated NESTbed project and deployment configuration. As shown in the figure, the user
has created a project named “Multi-Hop Sensing Application” associated with the “Ultra-Dense
Network”, and an empty configuration within the project, named “Default Configuration”. The
Deployment Configuration Manager is then used to configure the system installation and associated
profiling settings for a particular debugging or experimentation task.
11
Andrew R. Dalton, Jason O. Hallstrom
An Interactive, Source-Centric, Open Testbed
Figure 5: Deployment Configuration Manager
3.2
The Deployment Configuration Manager
The Deployment Configuration Manager is shown in Figure 5. The left panel displays the nesC
programs associated with the active configuration, and for each program, a list of the constituent
nesC modules, module variables, and messaging structures. The panel is populated automatically
as programs are uploaded by the user. The right panel displays the physical topology of the mote
network; the information is configured statically by the system administrator. The display for
each mote includes the associated network identifier, an indication of the application image to
be installed, and the radio power level that should be set upon installation. The bottom panel
displays a list of module variables and messaging structures selected for profiling. As we will see,
these selections control the available profiling actions when the deployment configuration is used
to program the network. The NESTbed Instrumentation and Compilation API is used to generate
the displayed program data.
12
Andrew R. Dalton, Jason O. Hallstrom
An Interactive, Source-Centric, Open Testbed
Figure 6: Component Rewiring Dialog
Figure 7: Compilation Status Window
The user scenario continues with the selection of the application source directories to be archived
and uploaded to the NESTbed server. After making this selection, the user is presented with the
Component Rewiring dialog shown in Figure 6. The dialog enables the selection of alternative
operating system and application-level component implementations5 . A user might, for example,
upload a single source directory multiple times, selecting alternative radio stack and network routing
implementations in each case6 . This would eliminate the development effort normally required to
construct the individual program variants. In the scenario captured in Figure 5, the user has
uploaded the MultiHopSensing application, and chosen to use the ReliableComm component
in place of the default radio stack (GenericComm). When the application was uploaded, the
files were automatically parsed, instrumented, and compiled for use. The status window shown in
Figure 7 was displayed during this process. Upon successful completion, the left panel was updated
with the name of the uploaded program, and its associated program symbols. MultiHopSensing
defines three messaging structures and a range of program modules. The SensingM module, for
instance, includes two program variables, msg and pending, as shown in the figure.
5
The NESTbed distribution includes two alternative radio stack implementations; these are the only operating
system alternatives available for selection through the graphical interface. The system is, however, extensible to an
arbitrary number and type of alternative services.
6
The Instrumentation and Compilation API assumes interface compatibility between selected components and
user-provided alternatives. Syntactic errors introduced during the instrumentation process due to interface violations
in user-provided components will be reported at compile time. Semantic errors can of course not be checked.
13
Andrew R. Dalton, Jason O. Hallstrom
An Interactive, Source-Centric, Open Testbed
The next step is to configure the applications to be installed on the network. This involves
dragging programs from the left panel to the node(s) on which the programs should be installed.
Unconfigured devices will be disabled when the configuration is activated on the network. In the
ongoing scenario captured in Figure 5, every second device has been configured; unconfigured devices are identified by hashmarks. The value shown in the bottom right corner of each mote icon
indicates the radio power level to be set when the device is programmed. In this scenario, the radio
power level has been reduced across the network to account for the density of the deployment.
The reduction limits the effective range of each device, creating opportunities for more interesting network topologies. The goal is to generate topologies more consistent with a geographically
distributed deployment. We will return to this idea later in the section.
The final configuration step involves selecting the runtime profiling information to be made
available when the configuration is activated. The user can select two types of elements from the
left panel. Module variables selected for profiling can be inspected and modified during program
execution. Messaging structures corresponding to the types of packets transmitted over the radio
and/or USB port can also be selected. This enables the user to inspect the contents of messages
transmitted via USB during program execution. To enable inspection of the wireless network, the
user can include simple USB forwarding logic within their programs. Alternatively, they may choose
to install a radio-to-USB forwarding application on one or more of the unused motes. Several such
applications are included as part of the TinyOS distribution (e.g., TOSBase) [59].
In the scenario shown in Figure 5, the user has selected two variables for profiling, each declared within the RoutingM module. RoutingM implements a variation of the TinyOS Beaconing
Protocol [30] to maintain a shortest-path spanning tree rooted at node 0. The tree is used to route
sensor data to the root node, which in turn forwards the data through its USB port for upper-tier
processing. The first selected variable, distance, stores the hosting node’s distance from the
root, measured in hops. The second, parent, stores the identifier of the node’s parent in the
tree. Although not visible in the figure, the user has also selected the UartMsg structure, which
corresponds to the messages received and forwarded by the root node. The user is now ready to
14
Andrew R. Dalton, Jason O. Hallstrom
An Interactive, Source-Centric, Open Testbed
activate the configuration using the NESTbed Network Monitor.
3.3
The Network Monitor
The interface of the Network Monitor is similar to the Deployment Configuration Manager; we omit
an additional screenshot. The interface enables users to install, debug, and profile applications
based on the active deployment configuration. Single device and whole-network programming are
supported. In the latter case, motes are programmed in parallel to reduce installation time. The
former option, used less frequently, supports scenarios that require a particular installation order.
For example, when evaluating fault tolerance characteristics, it may be useful to introduce corrupted
nodes gradually.
Visual feedback is provided during installation to indicate success or failure. Nodes are shown
within a flashing green box during installation; solid green and solid red indicate success and failure,
respectively. Installation failures are often remedied by reprogramming the failed devices. It is
possible, however, for a mote to enter a hardware state in which the device cannot be reprogrammed.
In such a case, the device can be power-cycled to re-enable programmability. The Deployment API
is used to implement the installation and status reporting features exposed through the client
interface. The Power Control API is used to implement the power-cycling feature.
Upon successful installation, users may view video feeds of the network to inspect its actuation
state. Sample images are shown in Figures 8 and 9; each captures approximately one-half of the
network (with some overlap). The actuation state consists of the LED states of the individual
devices — a useful debugging tool for signaling phase transitions, error conditions, and other
significant events. In general, the actuation state may also include the states of external devices
under network control (e.g., lights, physical switches, motors). The goal of the feeds is to provide
convenient real-time access to this information. Again, the feeds are not strictly necessary; the
actuation state can be inspected through corresponding state variables. Users have noted, however,
that the video feeds provide a sense of presence. They support the abstraction of the testbed as
a virtual device, and provide users with additional confidence in their perception of the network
15
Andrew R. Dalton, Jason O. Hallstrom
An Interactive, Source-Centric, Open Testbed
Figure 8: NESTbed Video Feed #1
Figure 9: NESTbed Video Feed #2
state.
The user scenario continues after the installation of the active configuration. Each configured
mote is executing an instance of MultiHopSensing. The user is now interested in determining
whether a stable spanning tree has formed. In addition to the video feeds, the Network Monitor
supports real-time debugging and profiling of individual nodes; both source- and network-level
inspection are supported. After selecting the device of interest, the user is presented with the Mote
Detail window shown in Figure 10.
The window summarizes information about the selected device, including its network identifier,
physical location, and hardware characteristics. The bottom panel shows the variables and message
structures previously selected for profiling. When a variable is highlighted, the system retrieves its
current value and updates the display. In the figure, the user has queried the values of parent
and distance. Since a child of node 0 is one hop from the root, the values appear correct for
the selected device. The user may similarly choose to update a program variable. The user might
choose, for instance, to inject a transient state fault to force the selection of a new parent, or set an
invalid distance from the root to determine whether the system can recover from state corruption.
The static information displayed within the Mote Detail window is retrieved using the Configuration
16
Andrew R. Dalton, Jason O. Hallstrom
An Interactive, Source-Centric, Open Testbed
Figure 10: Mote Detail
Figure 11: Message Monitoring
API. The variable profiling features are implemented using the Profiling API.
The NESTbed server relies on the Nucleus toolkit [56] to read and write program variables. The
toolkit provides a lightweight query system for TinyOS that exposes nesC variables as attributes.
Exposed attributes can be read and written at runtime using the Nucleus Java library. To enable
these features, the NESTbed compilation system includes Nucleus [56] support in every uploaded
application.
The user scenario continues with the task of determining whether the appropriate data packets
are being received and forwarded by the root node. To achieve this, the user selects the type of
message to be intercepted from the Message Profiling tab shown in Figure 10. In this case, UartMsg
is selected, and the Message Monitoring window shown in Figure 11 is displayed. The window is
generated dynamically based on the fields contained within the selected structure. In this case,
the window includes a field to identify the source mote, and a variety of sensor readings defined
within UartMsg. The fields are updated in real-time based on the messages transmitted over the
root node’s USB port. Received messages may also be logged to the client’s local machine for later
analysis. Multiple logging sessions associated with different devices may be active simultaneously.
17
Andrew R. Dalton, Jason O. Hallstrom
An Interactive, Source-Centric, Open Testbed
It is useful to consider the implementation of this feature. When an application is uploaded to
the NESTbed server, its messaging structures are identified by the Instrumentation and Compilation
API. A corresponding Java class is generated for each structure7 . These message classes provide
methods for parsing raw packet data and populating class fields. When a structure is selected
for monitoring, the NESTbed server is notified via the Profiling API. The server in turn begins
to inspect data received through the USB port of the relevant device. When a message of the
appropriate type is received, the server constructs an instance of the corresponding Java data class,
and transmits the object to the client application. When received, the Java Reflection API [51]
is used to inspect the object, and to create a Message Monitoring window of the type shown
in Figure 11. Logged messages are recorded in Java’s serialized object format, simplifying the
construction of external analysis tools.
3.4
Topology Control
The spatial scale of the NESTbed deployment raises questions concerning its use in evaluating
applications intended for geographically distributed environments. Office space is a factor; the
current deployment measures approximately 4’x8’. If space were available, however, the existing
hardware components could be spaced to create a deployment in excess of 90’x30’ with no additional
purchases or revisions. USB extenders could be used to distribute the nodes even further, potentially
in excess of several hundred feet in both dimensions.
Still, the achievable scale is not without limits; there are target environments that outstrip the
spatial capacity of any existing testbed. To address this limitation, the NESTbed system enables
users to control the radio power level of each device. The key observation is that network link
quality varies predictably as a function of transmission power and distance. When a user desires
a deployment environment beyond the spatial capacity of the physical network, radio power can
be reduced to achieve link quality consistent with the desired distribution. The tradeoff between
distance and power, and its use in emulating target environments is also noted in [21].
7
The Message Interface Generator included as part of the TinyOS distribution is used to create this class [58].
18
Andrew R. Dalton, Jason O. Hallstrom
Distance
(ft.)
1
3
5
7
9
11
13
15
17
19
21
23
25
27
29
31
33
35
37
39
41
43
45
47
49
51
53
55
57
59
61
63
65
1
100
0
0
0
0
0
0
0
0
0
0
0
0
0
0
0
0
0
0
0
0
na
0
0
na
0
0
0
0
0
0
0
0
3
100
100
100
100
100
87
36
0
0
0
0
0
0
0
0
0
0
0
0
0
0
0
0
0
0
0
0
0
0
0
0
0
0
5
100
100
100
100
99
100
100
100
92
36
35
0
2
0
0
0
0
0
0
0
0
0
0
0
na
0
0
0
0
0
0
0
0
7
99
100
100
100
100
99
88
100
100
99
99
22
95
0
0
0
0
0
0
0
0
0
0
0
0
0
0
0
0
0
0
0
0
9
99
99
100
100
99
99
100
100
100
100
100
98
100
23
43
0
0
0
0
0
0
0
0
0
0
0
0
0
0
0
0
0
0
An Interactive, Source-Centric, Open Testbed
11
100
100
100
94
99
99
100
100
100
100
100
99
99
87
89
0
7
2
0
12
0
0
0
0
0
0
1
0
0
0
0
0
0
Power (CC2420)
13
15
17
19
100
99 100
99
99 100
99 100
100 100 100 100
99 100
99 100
99 100
99 100
100
99 100 100
99
93 100 100
100
89
99 100
100
91 100 100
93
99
99 100
100 100 100
99
89 100
99 100
100 100 100
99
98
99
99 100
99
99
99
99
0
4
38
39
77
79
79
97
28
84
94 100
2
21
49
54
56
88
93
99
3
23
38
68
15
65
80
91
35
61
66
99
1
6
61
88
1
3
1
1
0
9
2
1
39
84
98
99
0
0
21
60
0
2
11
22
0
1
4
12
2
0
na
15
8
38
54
49
60
94
98
89
21
100
100
100
100
100
100
99
100
100
100
100
100
100
100
100
54
98
100
76
98
80
94
99
99
3
75
99
77
10
na
27
56
99
23
100
99
100
95
100
100
99
100
100
100
100
99
100
100
100
83
99
100
93
99
93
99
100
99
14
36
100
96
11
39
5
84
99
25
89
100
99
99
99
100
99
100
100
100
100
99
99
100
100
96
99
99
97
99
81
98
99
99
40
90
99
99
53
28
na
96
99
27
100
100
100
94
99
100
100
99
100
100
100
97
100
100
100
89
95
100
91
99
91
99
100
99
45
91
100
99
54
35
na
79
99
29
100
100
100
100
100
100
100
99
100
100
99
100
100
99
84
86
99
100
80
99
91
100
94
91
na
61
99
99
56
20
na
98
99
31
99
99
100
100
99
100
100
100
99
100
99
99
86
100
99
93
99
100
76
98
99
98
95
96
79
93
100
98
52
10
na
99
99
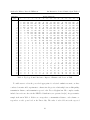
Table 1: Topology Control Reference: Impact of Distance and Power on PRR
To enable users to select the power level appropriate for a desired emulation scenario, we have
conducted extensive field experiments to characterize the precise relationship between link quality,
transmission distance, and transmission power for the Tmote Sky platform. The complete results,
included as a reference sheet in the NESTbed distribution, are presented in [62]. A representative
sample is shown in Table 1. Each row corresponds to a transmission distance; each column corresponds to a radio power level on the Tmote Sky. The value of each cell denotes the expected
19
Andrew R. Dalton, Jason O. Hallstrom
An Interactive, Source-Centric, Open Testbed
base (interference-free) packet reception rate (PRR) at the corresponding distance and power combination. To emulate an environment, the user can adjust the radio power level to achieve a PRR
consistent with the desired deployment scenario. As we will see in Section 5, even in a confined
deployment, this approach results in interesting wireless topologies.
It is useful to note that some scenarios can not be faithfully emulated using this approach;
the desired packet reception rate may be too low to achieve in a dense deployment, even at the
lowest radio power level. In such a case, a user may substitute UniformLossyComm, included as
part of the NESTbed system, in place of the default radio stack on one or more devices. (See the
Component Rewiring dialog shown in Figure 6.) The alternative radio stack discards packets with a
specified uniform probability, allowing users to emulate low-quality links consistent with large-scale
spatial distribution.
3.5
Remote Extensions
For some experimentation tasks, a fixed indoor deployment may be insufficient; users may wish
to add remote subnets, system controllers, and applications. In testing a hierarchical system, for
example, it may be useful to attach a tier of computationally rich sensor nodes that interact with
a lower-tier NESTbed deployment. A user might also wish to connect a remote field deployment
to inject live (or pre-recorded) sensor data into a NESTbed experiment, as in [21]. External
applications that analyze network performance or sensor stream data may also be required.
To enable these extensions, we adopt a variation of the serial forwarding approach described
in [67]. When a user wishes to connect a remote service, a network gateway is associated with one or
more NESTbed devices through the NESTbed Network Monitor. Each mote is assigned an advertised TCP port; the gateway creation function establishes a mote-to-TCP bridge on this port. More
precisely, the Serial Forwarder Control API constructs a set of SerialForwarder instances on
the NESTbed server. Each instance relays messages received through the USB port of its associated
device to the corresponding TCP port, and vice-versa. Remote applications connect to these ports
to interact with NESTbed devices. To attach a remote subnet, a client-side SerialForwarder
20
Andrew R. Dalton, Jason O. Hallstrom
An Interactive, Source-Centric, Open Testbed
instance is also required; a TCP-to-TCP relay forwards packets between client- and server-side
SerialForwarder instances. Several such relay applications are freely available.
3.6
Experimental Repeatability
The NESTbed system enables users to quickly save, modify, and clone deployment configurations.
These features assist in improving experimental repeatability and control. Users can quickly retrieve
and redeploy previous experiments without any risk of modifying non-environmental experimental
parameters. This is especially useful in trying to replicate experimental results among NESTbed
users. The ability to clone projects and configurations is also useful, improving control of variation
across experiments. A user can clone a deployment configuration, make a single change, and quickly
redeploy the new experiment without any risk of modifying other non-environmental parameters.
4
NESTShell Interface
The graphical user interface can be cumbersome for complex multi-phase experimentation tasks,
and tasks involving a high degree of repetition. The open design of the NESTbed system allows
end-users to provide supplementary interfaces to address these scenarios. One such interface is
NESTShell, a shell-based scripting interface. In addition to supporting automation of complex and
repetitive tasks, the scripting language provides constructs for interacting with client-side tools,
enabling users to extend the interface as appropriate to particular scenarios. Here we summarize
the key features of the NESTShell interface; a complete description is presented in [15].
The interface parallels that of a typical operating system shell, providing a file system abstraction that models the hierarchical structure of network deployments, projects, deployment
configurations, programs, and profiling data. Each directory defines a working context and a set of
UNIX-style commands. For example, when the working directory is the message profiling directory
for a particular device, the shell provides commands for recording message streams from the device.
Directories may also include files —read using the standard UNIX cat command— that provide
21
Andrew R. Dalton, Jason O. Hallstrom
An Interactive, Source-Centric, Open Testbed
/
Physical Deployment
MessageProfiling
Message
Project
...
Configuration
Motes
Programs
Mote Address
...
Program
Symbols
NetworkMonitor
Module
Mote Address
Symbol
ProfilingSymbols
...
...
Symbol
...
Messages
Message
ProfilingMessages
...
...
Message
...
SymbolProfiling
Symbol
...
...
...
...
...
Figure 12: NESTShell File System
information about the working context. A given program directory, for instance, includes a file that
specifies information about the symbols contained within the program.
The structure of the NESTShell file system is shown in Figure 12. The root of the file system
contains subdirectories corresponding to the available physical deployments, which in turn include
project subdirectories created and managed by end-users. Project directories include deployment
configuration subdirectories, user-managed through five further subdirectories: (i) Programs, (ii)
SymbolProfiling, (iii) MessageProfiling, (iv) Motes, and (v) NetworkMonitor. We
describe each in turn.
• Programs. The Programs directory contains subdirectories corresponding to the applications uploaded by end-users, and provides program upload and removal commands. When a
program is uploaded, the new corresponding directory is populated with subdirectories that
22
Andrew R. Dalton, Jason O. Hallstrom
An Interactive, Source-Centric, Open Testbed
store information about the program symbols and message structures defined by the uploaded
application (e.g., names, types). The working context provides commands for selecting these
elements for profiling.
• SymbolProfiling, MessageProfiling. The SymbolProfiling and MessageProfiling
directories contain files that represent the symbols and message structures selected for profiling. The working context includes commands to deselect profiling elements.
• Motes. The Motes directory provides a context for configuring the images to install on each
device when the configuration is deployed. Files within the directory correspond to network
nodes, and specify hardware characteristics (e.g., platform type, RAM size, ROM size) and
configuration status information. The latter includes the name of the application to install on
the device, and the radio power level to be set when the application is deployed. The working
context provides commands for configuring nodes, as well as an extended ls command that
provides network topology and configuration status information.
• NetworkMonitor. The NetworkMonitor directory includes a subdirectory for each mote,
and provides a context for controlling the network deployment. The context provides commands for installing application images (and setting radio power levels) based on the mappings
defined in the Motes directory, toggling power to individual nodes, performing soft resets,
and creating and destroying network gateways. Each mote directory includes a file detailing
the characteristics of the device, including its activity state. Possible states include unknown,
installing, programmed, failed, and gateway. The ls command is extended to include this
state information.
Two profiling directories, ProfilingSymbols and ProfilingMessages, are contained
within each mote directory. The ProfilingSymbols directory contains files corresponding
to the program symbols selected for profiling. The content of each file corresponds to the
most recent recorded value for the symbol. The working context provides commands for
23
Andrew R. Dalton, Jason O. Hallstrom
An Interactive, Source-Centric, Open Testbed
reading and writing to these files, with consequent effects on the associated nodes. The
ProfilingMessages directory is analogous; it provides commands for accessing log files
corresponding to message streams. Each log entry includes a line-separated list of the values
contained within the message fields using a simple field=value format.
The shell interface additionally supports environment variables and standard UNIX-style commands for setting (set), removing (unset), and enumerating (env) them. Variable values are
accessed using the familiar “${name}” syntax. The special variable status stores the exit status
of the last executed command. This is useful for introducing recovery actions in experimentation
scripts.
Finally, the interface provides conditional evaluation and iteration primitives. The iferror
construct conditionally executes a block of code in the event that the status variable is non-zero.
The foreach construct enables iteration over a list of items, where a user-defined variable takes
on the next value from the list during each iteration.
4.1
Example Script
To illustrate the use of the NESTShell interface and the experimentation scenarios it enables, we
consider a simple example. Listing 1 includes a portion of a script used to collect profiling information from a modified version of SurgeTelos, a spanning-tree-based, multi-hop sensing application
included as part of the TinyOS distribution. The script begins by defining variables MOTES and
LEVELS, to control the target nodes and power levels of interest, respectively (lines 1–2). Next, a
deployment configuration is created for each power level, and the SurgeTelos source materials
are uploaded to the server (elided).
Next is the main loop over each power level of interest (lines 6–33). Seven variables are selected
for profiling in each deployment configuration. The first 5 are selected from module MultiHopLQI:
rawRSSI, rawLQI, gbCurrentParent, gbCurrentHopCount, and gbCurrentLinkEst (lines
8–10). These variables correspond to the RSSI of the parent link, the LQI of the parent link, the
24
Andrew R. Dalton, Jason O. Hallstrom
An Interactive, Source-Centric, Open Testbed
parent’s network address, the distance to the root node (in hops), and an internal link quality measure defined by the application, respectively. Finally, ledsOn, declared within the LedsC module,
and low32, declared within SimpleTimeM, are selected (elided). These variables correspond to
the current state of the LEDs and the low-order bytes of the mote’s clock, respectively.
After configuring each mote to run SurgeTelos at the current power level (elided), the application
is installed on each node in the network (lines 16–18). The subsequent wait command blocks until
all pending installation requests are complete (line 19)8 . The shell command is used to invoke
the UNIX sleep program to allow the network to execute for 1 minute before profiling begins
(line 20).
The profiling portion of the script consists of two nested loops. The first loop iterates over the
target nodes (lines 21–32); the second iterates over the variables selected for profiling (lines 26–29).
The effect is to query the current value of each profiled variable on each device in the network. The
query command used in the innermost loop body updates the respective NESTShell profiling file,
and displays the retrieved value. The echo command is used to display each mote’s address to
allow users to associate profiling results with particular nodes (line 22). This information might,
for example, be used to analyze the impact of node placement on regional link quality (since each
address implies the spatial coordinates of the associated device).
Note that the experimentation script queries the value of the SimpleTimeM.low32 variable
twice for each mote, once before querying the other variables of interest, and once after (lines 24,
30). This is a common NESTShell experimentation idiom, enabling users to bound the time at
which recorded variable values held. If a time synchronization component is included in the installed
application image, this approach can be extended to impose a partial ordering on distributed system
events. Interval bounds can be tightened by interleaving additional time queries between the queries
for each of the other variables.
It is interesting to note that if the above experiment were performed using the graphical user
interface presented in Section 3, it would have required over 400 manual actions for a single run.
8
We have omitted standard error-checking and recovery logic for the sake of presentation.
25
Andrew R. Dalton, Jason O. Hallstrom
1
2
3
4
5
6
7
8
9
10
11
12
13
14
15
16
17
18
19
20
21
22
23
24
25
26
27
28
29
30
31
32
33
An Interactive, Source-Centric, Open Testbed
set MOTES="[0-79]"
set LEVELS="[1-3]"
... cd deployment; cd project ...
... mkconf for each power level ...
... upload SurgeTelos source ...
foreach powerLevel in ${LEVELS} do
... cd to the MultiHopLQI module of SurgeTelos program in current configuration ...
foreach i in rawRSSI rawLQI gbCurrentParent gbCurrentHopCount gbCurrentLinkEst do
profile ${i}
done
... cd..; cd LedsC; profile ledsOn ...
... cd..; cd SimpleTimeM; profile low32 ...
... cd .. back to configuration directory; cd Motes ...
... configure each mote to run the SurgeTelos application at the current power level ...
cd ..; cd NetworkMonitor
foreach i in ${MOTES} do
install ${i}
done
wait
shell sleep 1m
foreach mote in ${MOTES} do
echo "Querying ${mote} symbols"
cd ${mote}; cd ProfilingSymbols
query SimpleTimeM.low32
query LedsC.ledsOn
foreach sym in rawRSSI rawLQI gbCurrentParent \
gbCurrentHopCount gbCurrentLinkEst do
query MultiHopLQI.${sym}
done
query SimpleTimeM.low32
... cd ..; cd .. ...
done
done
Listing 1: SurgeTelos Experimentation Script (partial)
26
Andrew R. Dalton, Jason O. Hallstrom
An Interactive, Source-Centric, Open Testbed
Multi-phase experiments can be even more complex. Phase transitions might be triggered by wallclock time, network state conditions, or remote IP packets. Triggering these transitions reliably
using the graphical interface would present significant obstacles. However, the graphical interface is
appropriate to other scenarios, especially those involving a low degree of repetition, novice users, or
classroom use. The open design of the NESTbed system enables users to select the most appropriate
interface for the task at hand — and to extend the system with additional interfaces if necessary.
5
Applications
To gain a sense of the system’s benefits, it is useful to consider some of the contexts in which it has
been applied. The system is in active use by researchers and students from Clemson University and
Cleveland State University. The main physical deployment is installed on the Clemson campus,
and is accessed by users from both institutions through the interfaces described in the preceding
sections. A secondary deployment is installed on the Cleveland State campus. Here we summarize
a few key usage scenarios that illustrate the types of research and teaching activities enabled by
these deployments. We focus on the use of the NESTbed system and the types of results it can be
used to collect, rather than on the technical details of the contexts themselves.
5.1
Reliable Communication
Recall that a user may substitute an alternative radio stack implementation as part of the deployment configuration process. Section 3 highlighted ReliableComm, an alternative implementation
designed to improve the reliability of wireless network links. Before its inclusion as part of the
NESTbed distribution, the implementation was developed, debugged, and evaluated using the
NESTbed system.
When testing ReliableComm using the NESTbed system, we found that some nodes exhibited
unexpected behaviors under high-load. First, and most obviously, the faulty nodes exhibited unexpected LED states. Second, by observing the values of program variables at key system execution
27
Andrew R. Dalton, Jason O. Hallstrom
An Interactive, Source-Centric, Open Testbed
points, we were able to determine that certain program invariants had been violated. The runtime
observations made possible by the NESTbed design ultimately lead us to discover a synchronization error in one of the interrupt-driven state machines. Based on our past experiences debugging
similar errors, we believe the NESTbed design allowed us to correct the error in a small fraction
of the time it would otherwise have taken. The runtime network- and program-level visibility the
design affords is an important debugging aid, especially when debugging problems that are difficult to replicate. Concurrency and memory-related errors, for example, are notoriously difficult
to reproduce — and these are exactly the types of errors repeatedly encountered when developing
embedded sensor systems.
To evaluate the performance of ReliableComm, we used the NESTbed interface to install a
test program on each mote. The program instructs the host device to transmit packets to each of
its neighbors at a specified rate for a specified duration. Each mote also records the number of
messages received from each of its neighbors. By dividing the number of messages received on each
link by the number of messages transmitted on the link, we are able to calculate the PRR on the
link.
To control the experiment, we developed a Java application to communicate with a designated
leader node through its USB port. To enable connectivity from a remote location, we used the
NESTbed interface to construct a network gateway, and then connected the Java application to
this gateway. Upon termination of the experiment, we collected the results through the same
gateway. The application was tested using both GenericComm and ReliableComm to compare
the relative performance of the radio stack implementations. The NESTbed rewiring interface
was used to perform this configuration step, eliminating the need for additional programming. A
portion of the performance results collected using the NESTbed system are shown in Figures 13,14,
and 15.
Figure 13 presents a graphical representation of link quality, as measured by the test application
deployed with GenericComm. Figure 14 is analogous and corresponds to ReliableComm. Each
column represents a transmitting node, and each row represents a receiving node; the shading of
28
Andrew R. Dalton, Jason O. Hallstrom
An Interactive, Source-Centric, Open Testbed
Figure 13: Link Quality (GenericComm)
Figure 14: Link Quality (ReliableComm)
the cell at their intersection represents the PRR of the link. The cells are shaded on a uniform
scale from black to white, with black denoting a PRR of 0%, and white denoting a PRR of 100%.
The aggregate impact on link quality is illustrated by the histogram shown in Figure 15. There
are 10 link categories considered; vertical bars represent the number of links in each category. By
examining the results captured in these figures —results made possible by the NESTbed system—
it becomes immediately clear that ReliableComm significantly improves the reliability of midquality links without negatively impacting high-quality links. Packets destined for low-quality
links are silently discarded to reduce network congestion.
The implementation of ReliableComm is interesting in its own right, and serves as a useful
radio stack alternative for NESTbed users. However, we summarize our development and evaluation
experiences here only to emphasize the types of remote evaluation studies made possible by the
NESTbed design.
29
Andrew R. Dalton, Jason O. Hallstrom
An Interactive, Source-Centric, Open Testbed
1200
ReliableComm
GenericComm
1000
Frequency
800
600
400
200
0
00
0.
10
0.0
0
90
.0
90
0.0
0
80
.0
80
0.0
0
70
.0
70
0.0
0
60
.0
60
0.0
0
50
.0
50
0.0
0
40
.0
40
0.0
0
30
.0
30
0.0
0
20
.0
20
0.0
0
10
.0
10
00
0.
Packet Reception Rate (PRR)
Figure 15: Aggregate Network Link Quality
5.2
Student Experimentation
In addition to its use as a research instrument, the NESTbed system is a valuable teaching tool.
At Clemson the system is used as part of a graduate course in embedded sensor network design.
The course covers both algorithmic issues and software engineering principles as they relate to the
development of large-scale embedded deployments.
Given the emphasis on large networks, scalability is a major theme of the course. In the first
offering, before the NESTbed system was available for use, scalability issues were difficult to motivate, and even more difficult to analyze. Each student had access to only a small number of motes
(i.e., 5–10) on which to perform their assignments. As a result, they were unable to gain experience
addressing realistic congestion problems, hardware load limitations, synchronization defects, and
other difficulties magnified in large-scale networks. Assignment solutions lacking required scalability properties might appear correct since they could not be tested at scale. Further, with only a few
LEDs (and perhaps a few pre-programmed debugging messages) to expose the inner-workings of
an algorithm implementation, it was difficult for students to evaluate implementation correctness
30
Andrew R. Dalton, Jason O. Hallstrom
An Interactive, Source-Centric, Open Testbed
0
0,0
1
...
2
0,1
3
...
4
0,1
5
...
6
4,2
7
...
8
4,2
0
0,0
1
...
2
0,1
3
...
X
5
...
6
17,2
7
...
8
38,3
16
...
17
0,1
18
...
19
4,2
20
...
21
4,2
22
...
23
4,2
24
...
16
...
17
0,1
18
...
19
32,2
20
...
21
17,2
22
...
23
53,3
24
...
32
0,1
33
...
34
0,1
35
...
36
17,2
37
...
38
32,2
39
...
40
32,2
32
0,1
33
...
34
0,1
35
...
36
34,2
37
...
38
32,2
39
...
40
32,2
48
...
49
0,1
50
...
51
49,2
52
...
53
17,2
54
...
55
4,2
56
...
48
...
49
0,1
50
...
51
49,2
52
...
53
49,2
54
...
55
34,2
56
...
64
49,2
65
...
66
32,2
67
...
68
51,3
69
...
70
17,2
71
...
72
53,3
64
49,2
65
...
66
49,2
67
...
68
51,3
69
...
70
17,2
71
...
72
55,3
Figure 16: Routing Tree (Pre-Fault)
Figure 17: Routing Tree (Post-Fault)
and performance.
In the second offering of the course, students were additionally given access to the NESTbed
system. Consider as an example, the second major assignment, for which students were required to
demonstrate the correctness of their solutions on a minimum of 35 nodes. The assignment required
the development of a multi-hop sensing application that closely parallels the scenario presented in
Section 3. The most challenging aspect of the assignment was the development of a self-stabilizing
routing tree that tolerates multiple node failures.
The NESTbed system made it easy for students to quickly install their applications on a large
number of nodes, and to configure the radio power level of each device to ensure the construction of
interesting routing topologies. During each demonstration, the system was used to query the values
of program variables on a subset of the network. More specifically, the routing tree component was
examined to determine the parent identifier of each node, as well as the distance of each node from
the root of the tree. By inspecting the variables that store this information at various points in the
network, it was easy to construct quick maps of the routing tree. One such tree, constructed using
information gleaned through profiling on a slightly larger network, is shown in Figure 16.
Each circle in the figure represents a network node; nodes selected for profiling are shown in
boldface. The identifier of each node is shown at the top of its corresponding circle. The pair of
31
Andrew R. Dalton, Jason O. Hallstrom
An Interactive, Source-Centric, Open Testbed
numbers at the bottom of each circle represent the values retrieved during profiling — the identifier
of the node’s parent and its distance from the root, respectively. The arrows between each node
depict the routing links implied by these values. (Note that even in this spatially constrained
deployment, the NESTbed power management features enable interesting network topologies.)
The rapid development of such a map, made possible by the NESTbed system, provides immediate
student feedback concerning the correctness of their routing implementation.
After demonstrating the initial formation of the routing tree, students were required to demonstrate tolerance to node failure. To achieve this, power was cut to a subset of the network nodes,
causing immediate fail-stop faults. The query system was again used to construct a map of the new
routing tree. Figure 17 shows the routing map constructed immediately following a fail-stop fault
involving node 4, marked with an “X” in the figure. Arrows with solid heads represent routing
links unaffected by the fault. Arrows with hollow heads represent affected links. Again, this type
of map provides immediate feedback that would otherwise be time-consuming and error-prone to
collect.
6
Related Work
The difficulty of testing, debugging, and profiling wireless sensor systems is well recognized. A
number of tool-based solutions have been proposed to address these difficulties. We survey some
of the most relevant here.
Network Simulators. Several platform-independent wireless network simulators have been
discussed in the literature [39, 70, 5]; platform-specific sensor network simulators have also emerged [35,
55, 50]. These tools have proven effective in providing initial measures of correctness and performance. The point of departure for our work, however, was the observation that they have not
supplanted the need for physical experimentation. Simulators offer limited fidelity with respect to
modelling wireless signal propagation and interference [71, 54], as well as in capturing the behavioral
subtleties of underlying hardware platforms. Consequently, our focus has been on infrastructure
32
Andrew R. Dalton, Jason O. Hallstrom
An Interactive, Source-Centric, Open Testbed
support for physical experimentation, debugging, and profiling.
Hybrid Simulators. Hybrid approaches that combine aspects of physical experimentation and
network simulation have also been proposed. The key idea is to identify system aspects that cannot
be faithfully simulated, and factor them out to the physical world. In the context of wireless system
simulation, this typically involves deferring communication to physical devices while simulating
other system aspects (e.g., application execution, network traffic). Hybrid testbeds have been used
to evaluate both wired and wireless ethernet networks [72, 16, 68]. Similar approaches have been
used in the context of wireless sensor networks. The EmStar development platform [25], for example,
targets microservers, Linux-based sensor nodes with computational resources equivalent to a PDA
device. The platform can also target Linux-based desktops and servers. Applications developed
using EmStar can be simulated using EmSim, a simulator that allows physical radios to be used
in place of simulated network channels. EmTOS [26], an extension of EmStar, allows applications
developed using nesC and TinyOS to be simulated by a microserver (or desktop/server). As a result,
the architecture supports hybrid simulation, enabling designers to experiment with alternative
realizations of physical network interfaces. The SeNeTs framework [6] provides similar features,
but offers support for large-scale simulation through the use of distributed processing. While
hybrid frameworks have yielded important research results, they have not addressed the fidelity
issues associated with simulating mote hardware. They cannot, for example, be used to gather
precise results concerning the effects of hardware interrupts, load-induced execution anomalies, or
other complex phenomenon that cannot be faithfully simulated. Moreover, results obtained using
a particular network interface and supporting software stack rarely apply to other interfaces and
network drivers. By contrast, our work supports pure physical experimentation using standard
hardware components, offering the highest degree of experimental fidelity.
Network Testbeds. We are not the first to describe a network testbed designed to support pure
physical experimentation. Several 802.11 efforts have been discussed in the literature [34, 47, 44, 7],
and more recently, testbeds focused on wireless sensor systems have emerged. Our work aligns
most closely with the latter category. We consider some of the most important testbed efforts
33
Andrew R. Dalton, Jason O. Hallstrom
An Interactive, Source-Centric, Open Testbed
representative of the current state-of-the-art.
Harvard’s MoteLab testbed [67, 65] was one of the first sensor network testbeds discussed in the
literature. The physical network includes 190 Tmote Sky [42] devices. Each mote is attached to an
ethernet-based gateway device [41], allowing the network to be reprogrammed from a centralized
server. The server exposes a web interface that allows users to upload executable application images,
and to configure the deployment of those images on the physical network. The system also allows
users to upload Java classes that can be used to log USB data. The NESTbed approach to creating
network gateways for injecting packets from a remote location is based on a similar feature available
in MoteLab. In contrast to the NESTbed system, however, MoteLab is batch-based rather than
interactive; submitted jobs are queued for later execution. As a result, the system does not support
real-time source- or network-level profiling9 , nor does it support the injection of transient state
faults. The design is also image-centric, requiring users to generate application images, as well as
to construct the Java classes that parse application data transmitted over the USB port. In addition
to the productivity benefits provided by the NESTbed system, its source-centric design introduces
opportunities for automated source-level analysis and instrumentation. Finally, the MoteLab server
appears to be closed; it does not seem to expose an API for programmatic control, restricting users
to a single web interface for all experimentation tasks. There is no equivalent, for instance, of the
NESTShell scripting interface, nor an apparent mechanism to add such an interface.
More recently, Ohio State deployed the Kansei testbed [21, 2, 45]. The supporting physical
network is one of the largest to date, with over 400 devices. The testbed supports experimentation
over multi-tiered networks; the deployment includes Extreme Scale [18], Tmote Sky [42], and Trio
motes [19]. The basic hardware architecture is similar to that of MoteLab. Motes are attached
to ethernet-based gateway devices [14], and are programmed through a centralized server. A
key point of novelty in Kansei is its focus on sensing experiments. Sensor nodes are housed in
stationary, portable, and mobile arrays. Portable and mobile arrays are used to collect field data
for ex post facto analysis. Alternatively, the arrays can be used to inject data into the (larger)
9
This discounts the possibility of forwarding raw packet data through a gateway for remote inspection.
34
Andrew R. Dalton, Jason O. Hallstrom
An Interactive, Source-Centric, Open Testbed
stationary deployment using a forwarding system similar to that of MoteLab and NESTbed. Unlike
these systems, however, Kansei includes support for sensor stream scaling through parametric,
probabilistic, and sample-based data generation. Perhaps most interesting is the third option
which generates large-scale sensor streams by replaying pre-recorded data (usually from a smaller
portable array) with temporal and spatial shifts. The software architecture also provides some
support for job coordination.
Kansei is well-suited to batch-style experimentation, especially when the experiments are focused on high fidelity sensing of parameters that cannot be captured in a laboratory context. The
NESTbed system offers a complementary design; it is engineered to support interactive use, with
a focus on software experimentation. Like MoteLab, Kansei does not provide real-time profiling or
fault injection support. It also provides limited support for logging network traffic [46]. Further,
Kansei is image-centric, precluding source-level analysis and instrumentation. One consequence
seems to be that developers are required to integrate specialized Kansei components before compiling and uploading their application images. Finally, the degree of controllability provided to
external applications by the Kansei API is unclear. The PHP-based design seems to suggest a
closed system, precluding the addition of interface extensions such as the NESTShell scripting
interface provided by the NESTbed system.
MoteLab and Kansei exemplify testbed development projects underway at research institutions
around the world (e.g., [61, 28, 33, 60, 10, 9, 64])10 . While these testbeds share similarities with
our work, they are principally batch-based, image-centric, and closed. By contrast, the NESTbed
design is interactive, source-centric, and open.
Other Tools. In addition to testbed infrastructures, other related development and testing
tools have also recently been described in the literature. Most relevant to our work are tools designed
10
It may be useful to note that MoteLab, Kansei, the Deployment Support Network, and other testbeds include
integrated health monitoring services. The basic approach is to periodically poll each device to determine whether
it is in a programmable state. Unresponsive nodes are avoided by manual and automatic allocation strategies. Since
the NESTbed system is intended for interactive use, users are notified of device problems at the point of installation
(as indicated by programming failures). Unresponsive nodes can be power-cycled through the NESTbed interface.
Hence, while useful in batch-based systems, the benefit of periodic health monitoring is unclear in the context of the
NESTbed design.
35
Andrew R. Dalton, Jason O. Hallstrom
An Interactive, Source-Centric, Open Testbed
to improve runtime observability and controllability of network software. The Deployment Support
Network (DSN) [20] is a key example. The approach is to connect a secondary device, the “DSN
node”, to each target mote. The DSN nodes form a reliable out-of-band backbone for controlling and
observing a target mote network. The current implementation uses Bluetooth-based BTnodes [22]
for the out-of-band backbone. These devices are managed through a centralized server that exposes
an RPC interface to remote processes. The interface is used to deploy new application images,
transmit and receive messages from target devices, and monitor the status of DSN nodes and their
targets. In- and out-of-network buffering strategies are used to provide reliable communication. The
key benefit of the toolkit is to eliminate the need for wired mote connections. In effect, the toolkit
serves as a replacement for USB connections in Tmote-based (and other sensor) deployments11 . It
may be worth noting that the DSN approach has been used to construct a heterogeneous network
testbed consisting of 66 nodes at ETH Zurich [23]. The testbed has features (and consequent
limitations) analogous to those of the MoteLab testbed.
Recall from Section 3.3 that the NESTbed system uses Nucleus [56] to provide variable inspection and modification facilities. Marionette [69] is a significant extension of Nucleus to support
RPC-based interactive development and debugging. The system provides a Python interface for
exploring static program structures (e.g., modules, type declarations), reading and modifying program state at runtime, and invoking nesC commands. Like the NESTShell interface, Marionette
enables developers to script debugging and profiling activities. It is not, however, tailored for testbed
experimentation; it lacks services for managing projects and deployment configurations, reprogramming devices, constructing network gateways, and others. Further, mote interactions are handled
in-band, limiting throughput and reliability. Marionette’s integration with a popular object-based
scripting language, however, is a point of advantage over the NESTShell interface.
Finally, it may be worth noting that the NESTbed graphical interface bears some similarity to
existing integrated development environments for nesC and TinyOS. In particular, it shares design
characteristics with the various Eclipse plugins for TinyOS [49, 48, 57], as well as TOSDev [40]. By
11
We intend to investigate the use of DSN in future NESTbed enhancements
36
Andrew R. Dalton, Jason O. Hallstrom
An Interactive, Source-Centric, Open Testbed
contrast to the NESTbed system, however, these tools are focused on providing syntactic assistance
(e.g., syntax highlighting, code completion), and managing source distributions and component
dependencies. They provide support for programming a single device; they do not provide testbedrelated features.
7
Conclusion
The goal of our work is to improve developers’ ability to test, debug, and profile wireless sensor
systems. To this end, we presented the design and implementation of the NESTbed system, a
network testbed specialized for sensor system development. The design exposes an expandable set
of hardware resources to a distributed research community as, in effect, a shared virtual device.
The supporting software infrastructure is engineered to enable rapid configuration, deployment,
and analysis on a large-scale mote installation. The novelty of the system lies in its interactive,
source-centric, and open design. We presented the NESTbed architecture, the NESTbed server
API, two client interfaces, and system use-case scenarios involving the development of a multi-hop
sensing application. We additionally summarized current applications of the system in the teaching
and research activities of client institutions.
We are planning three NESTbed extensions as part of our future work. First, we are developing
a distributed predicate detection system. The enhancement will enable users to monitor the status
of distributed state conditions relevant to system correctness and performance. The enhancement
will be especially valuable in studying the behavior of self-stabilizing protocols. Second, we are
developing a distributed control flow visualization enhancement. The enhancement will enable
NESTbed users to trace the control flow of system components across network nodes. The enhancement will be of particular value in reasoning about concurrent system behaviors. Finally,
we plan to integrate support for alternative programming languages and programming language
extensions. The focus will be on languages and extensions that compile to nesC and TinyOS (e.g.,
nesC RPC extensions [38], the DESAL programming language [3]).
37
Andrew R. Dalton, Jason O. Hallstrom
An Interactive, Source-Centric, Open Testbed
One goal of this paper is to assist in bootstrapping a community interested in using our implementation and in replicating our efforts at other institutions. The software tools described in this
paper, as well as instructions for their installation and use, are available for download from the
project website (http://dsrg.cs.clemson.edu/nestbed/). We encourage other researchers
to evaluate our work, and request their suggestions for future enhancements.
Acknowledgements
The work presented in this article was funded in part by the National Science Foundation (CNS0520222) and the South Carolina Space Grant Consortium. The authors gratefully acknowledge
these agencies for their support. The authors also wish to thank Sally K. Wahba for her work in
characterizing the relationship between packet reception rate, transmission distance, and transmission power (Section 3.4, Table 1). Finally, the authors wish to thank the anonymous reviewers for
their detailed comments and suggestions, which were of great value in improving this article.
References
[1] A. Arora, P. Dutta, S. Bapat, V. Kulathumani, H. Zhang, V. Naik, V. Mittal, H. Cao,
M. Demirbas, M. Gouda, Y. Choi, T. Herman, S. Kulkarni, U. Arumugam, M. Nesterenko,
A. Vora, and M. Miyashita. A line in the sand: A wireless sensor network for target detection,
classification, and tracking. Computer Networks, 46(5):605–634, 2004.
[2] A. Arora, E. Ertin, R. Ramnath, M. Nesterenko, and W. Leal. Kansei: A high-fidelity sensing
testbed. IEEE Internet Computing, 10(2):35–47, 2006.
[3] A. Arora, M. Gouda, J. Hallstrom, T. Herman, W. Leal, and N. Sridhar. A state-based
language for sensor-actuator networks. In The International Workshop on Wireless Sensor
Network Architecture, page 6pp. IEEE Computer Society Press, April 2007.
[4] A. Arora, R. Ramnath, E. Ertin, P. Sinha, S. Bapat, V. Naik, V. Kulathumani, H. Zhang,
H. Cao, M. Sridharan, S. Kumar, N. Seddon, C. Anderson, T. Herman, N. Trivedi, C. Zhang,
M. Gouda, Y. Choi, M. Nesterenko, R. Shah, S. Kulkarni, M. Aramugam, L. Wang, D. Culler,
P. Dutta, C. Sharp, G. Tolle, M. Grimmer, B. Ferriera, and K. Parker. Exscal: Elements of
38
Andrew R. Dalton, Jason O. Hallstrom
An Interactive, Source-Centric, Open Testbed
an extreme scale wireless sensor network. In The 11th IEEE International Conference on Embedded and Real-Time Computing Systems and Applications, pages 102–108. IEEE Computer
Society Press, August 2005.
[5] R. Barr, Z. Haas, and R. Renesse. Scalable wireless ad hoc network simulation. In J. Wu,
editor, Handbook on Theoretical and Algorithmic Aspects of Sensor, Ad Hoc Wireless, and
Peer-to-Peer Networks, pages 297–311. CRC Press, 2005.
[6] J. Blumenthal, F. Reichenbach, F. Golatowski, and D. Timmermann. Controlling wireless
sensor networks using SeNeTs and EnviSense. In The 3rd IEEE International Conference on
Industrial Informatics, pages 262–267. IEEE Computer Society, August 2005.
[7] B. Chambers. The grid roofnet: a rooftop ad hoc wireless network. Master’s thesis, Massachusetts Institute of Technology, May 2002.
[8] K. Chintalapudi, T. Fu, J. Paek, N. Kothari, S. Rangwala, J. Caffrey, R. Govindan, E. Johnson,
and S. Masri. Monitoring civil structures with a wireless sensor network. IEEE Internet
Computing, 10(2):26–34, 2006.
[9] B. Chun. Mirage user manual.
https://mirage.berkeley.intel-research.net/usermanual/singlepage.html, 2004.
[10] B. Chun, P. Buonadonna, A. AuYoung, C. Ng, D. Parkes, J. Shneidman, A. Snoeren, and
A. Vahdat. Mirage: A microeconomic resource allocation system for sensornet testbeds. In
The 2nd IEEE Workshop on Embedded Networked Sensors, page 10pp. IEEE Computer Society,
May 2005.
[11] Compaq Computer Corporation, Hewlett-Packard Company, Intel Corporation, Lucent Technologies Inc., Microsoft Corporation, NEC Corporation, and Koninklijke Philips Electronics
N.V. Universal serial bus specification (revision 2.0).
http://www.usb.org/developers/docs/usb 20 05122006.zip, 2000.
[12] Crossbow Technology Incorporated. Mica2 datasheet.
http://www.xbow.com/Products/Product pdf files/Wireless pdf/6020-004206 B MICA2.pdf, 2003.
[13] Crossbow Technology Incorporated. Mica2Dot datasheet.
http://www.xbow.com/Products/Product pdf files/Wireless pdf/6020-004304 C MICA2DOT.pdf, 2003.
[14] Crossbow Technology Incorporated. Stargate datasheet.
http://www.xbow.com/Products/Product pdf files/Wireless pdf/Stargate Datasheet.pdf,
2003.
[15] A. Dalton and J. Hallstrom. A file system abstraction and shell interface for a wireless sensor
network testbed. In The 3rd International Conference on Testbeds and Research Infrastructures
for the Development of Networks and Communities. IEEE Computer Society, May 2007.
39
Andrew R. Dalton, Jason O. Hallstrom
An Interactive, Source-Centric, Open Testbed
[16] P. De, A. Raniwala, S. Sharma, and T. Chiueh. MiNT: A miniaturized network testbed for
mobile wireless research. In The 24th Annual Joint Conference of the IEEE Computer and
Communications Societies, pages 2731–2742. IEEE Computer Society, March 2005.
[17] D. Doolin and N. Sitar. Wireless sensors for wildfire monitoring. In SPIE Symposium on
Smart Structures and Materials / NDE 2005, pages 477–484. SPIE Press, March 2005.
[18] P. Dutta, M. Grimmer, A. Arora, S. Bibyk, and D. Culler. Design of a wireless sensor network
platform for detecting rare, random, and ephemeral events. In The 4th International Conference on Information Processing in Sensor Networks, pages 497–502. IEEE Computer Society,
April 2005.
[19] P. Dutta, J. Hui, J. Jeong, S. Kim, C. Sharp, J. Taneja, G. Tolle, K. Whitehouse, and D. Culler.
Trio: Enabling sustainable and scalable outdoor wireless sensor network deployments. In
Proceedings of the 5th International Conference on Information Processing in Sensor Networks,
pages 407–415. ACM Press, April 2006.
[20] M. Dyer, J. Beutel, L. Thiele, T. Kalt, P. Oehen, K. Martin, and P. Blum. Deployment support
network - a toolkit for the development of WSNs. In The 4th European Conference on Wireless
Sensor Networks, pages 195–211. Springer-Verlag, January 2007.
[21] E. Ertin, A. Arora, R. Ramnath, M. Nesterenko, V. Naik, S. Bapat, V. Kulathumani, M. Sridharan, H. Zhang, and H. Cao. Kansei: A testbed for sensing at scale. In The 5th International
Conference on Information Processing in Sensor Networks, pages 399–406. ACM Press, April
2006.
[22] ETH Zurich. BTnode rev. 3 hardware reference.
http://www.btnode.ethz.ch/Documentation/BTnodeRev3HardwareReference, 2007.
[23] ETH Zurich. Deployment support network tool.
http://tec-pc-btnode.ethz.ch/dsngui/index.php?act=GetDSN, 2007.
[24] D. Gay, P. Levis, R. von Behren, M. Welsh, E. Brewer, and D. Culler. The nesC language:
A holistic approach to networked embedded systems. In ACM SIGPLAN 2003 Conference on
Programming Language Design and Implementation, pages 1–11. ACM Press, June 2003.
[25] L. Girod, J. Elson, A. Cerpa, T. Stathopoulos, N. Ramanathan, and D. Estrin. EmStar: a
software environment for developing and deploying wireless sensor networks. In The 2004
USENIX Technical Conference. USENIX Association, June–July 2004.
[26] L. Girod, T. Stathopoulos, N. Ramanathan, J. Elson, D. Estrin, E. Osterweil, and
T.Schoellhammer. A system for simulation, emulation, and deployment of heterogeneous sensor networks. In The 2nd International Conference on Embedded Networked Sensor Systems,
pages 201–213. ACM Press, November 2004.
[27] S. Glaser. Some real-world applications of wireless sensor nodes. In SPIE Symposium on Smart
Structures & Materials / NDE 2004, pages 344–355. SPIE Press, March 2004.
40
Andrew R. Dalton, Jason O. Hallstrom
An Interactive, Source-Centric, Open Testbed
[28] V. Handziski, A. Köpke, A. Willig, and A. Wolisz. TWIST: a scalable and reconfigurable
testbed for wireless indoor experiments with sensor networks. In Proceedings of the 2nd International Workshop on Multi-hop Ad Hoc Networks: From Theory to Reality, pages 63–70.
ACM Press, January 2006.
[29] C. Hartung, S. Holbrook, R. Han, and C. Seielstad. FireWxNet: a multi-tiered portable
wireless system for monitoring weather conditions in wildland fire environments. In The 4th
International Conference on Mobile Systems, Applications, and Services. ACM Press, June
2006. (to appear).
[30] J. Hill, R. Szewczyk, A. Woo, S. Hollar, D. Culler, and K. Pister. System architecture directions for networked sensors. In The 9th International Conference on Architectural Support
for Programming Languages and Operating Systems, volume 34, pages 93–104. ACM Press,
November 2000.
[31] W. Hu, V. Tran, N. Bulusu, C. Chou, S. Jha, and A. Taylor. The design and evaluation of
a hybrid sensor network for cane-toad monitoring. In The 4th International Symposium on
Information Processing in Sensor Networks, pages 503–508. IEEE Computer Society Press,
April 2005.
[32] J. Hui and D. Culler. The dynamic behavior of a data dissemination protocol for network
programming at scale. In The 2nd International Conference on Embedded Networked Sensor
Systems, pages 81–94. ACM Press, November 2004.
[33] D. Johnson, T. Stack, R. Fish, D. Flickinger, R. Ricci, and J. Lepreau. TrueMobile: A mobile
robotic wireless and sensor network testbed. In The 25th Annual Joint Conference of the IEEE
Computer and Communications Societies. IEEE Computer Society, April 2006.
[34] A. Karygiannis and E. Antonakakis. mLab: a mobile ad hoc network testbed. In The 1st
Workshop on Security, Privacy, and Trust in Pervasive and Ubiquitous Computing, pages
88–97. Diavlos S.A., July 2005.
[35] P. Levis, N. Lee, M. Welsh, and D. Culler. TOSSIM: Accurate and scalable simulation of entire
TinyOS applications. In The 1st ACM Conference on Embedded Networked Sensor Systems,
pages 126–137. ACM Press, November 2003.
[36] K. Lorincz, D. Malan, T. Fulford-Jones, A. Nawoj, A. Clavel, V. Shnayder, G. Mainland,
M. Welsh, and S. Moulton. Sensor networks for emergency response: Challenges and opportunities. IEEE Pervasive Computing, 3(4):16–23, 2004.
[37] A. Mainwaring, J. Polastre, R. Szewczyk, D. Culler, and J. Anderson. Wireless sensor networks
for habitat monitoring. In The 1st ACM International Workshop on Wireless Sensor Networks
and Applications, pages 88–97. ACM Press, September 2002.
[38] T. May, S. Dunning, G. Dowding, and J. Hallstrom. An RPC design for wireless sensor
networks. Journal of Pervasive Computing and Communications, 1(1), 2007. (to appear).
41
Andrew R. Dalton, Jason O. Hallstrom
An Interactive, Source-Centric, Open Testbed
[39] S. McCanne and S. Floyd. Network simulator ns-2.
http://www.isi.edu/nsnam/ns/, 1997.
[40] W. McCartney and N. Sridhar. TOSDev.
http://selab.csuohio.edu/dsnrg/tosdev/index.html, 2006.
[41] Moteiv Corporation. Tmote Connect datasheet.
http://www.moteiv.com/products/docs/tmote-connect-datasheet.pdf, 2006.
[42] Moteiv Corporation. Tmote Sky datasheet.
http://www.moteiv.com/products/docs/tmote-sky-datasheet.pdf, 2006.
[43] R. Musăloiu-E., A. Terzis, K. Szlavecz, A.Szalay, J. Cogan, and J. Gray. Life under your feet:
A wireless soil ecology sensor network. In The 3rd Workshop on Embedded Networked Sensors,
pages 51–55, May 2006.
[44] E. Nordström, P. Gunningberg, and H. Lundgren. A testbed and methodology for experimental evaluation of wireless mobile ad hoc networks. In Proceedings of the 1st International
Conference on Testbeds and Research Infrastructures for the Development of Networks and
Communities, pages 100–109. IEEE Computer Society, February 2005.
[45] Ohio State University. Kansei sensor testbed.
http://ceti.cse.ohio-state.edu/kansei/, 2006.
[46] Ohio State University. Using kansei — basics.
http://exscal.nullcode.org/kansei/help.php, 2006.
[47] D. Raychaudhuri, I. Seskar, M. Ott, S. Ganu, K. Ramachandran, H. Kremo, R. Siracusa,
H. Liu, and M. Singh. Overview of the orbit radio grid testbed for evaluation of next-generation
wireless network protocols. In Wireless Communications and Networking Conference, volume 3, pages 1664–1669. IEEE Computer Society Press, March 2005.
[48] J. Sallai, G. Balogh, and S. Dora. TinyDT – TinyOS plugin for the Eclipse platform.
http://www.tinydt.net/, 2005.
[49] R. Schuler and N. Burri. TinyOS plugin for Eclipse.
http://www.dcg.ethz.ch/∼rschuler/, 2006.
[50] G. Simon, P. Volgyesi, M. Maroti, and A. Ledeczi. Simulation-based optimization of communication protocols for large-scale wireless sensor networks. In The 2003 IEEE Aerospace
Conference, volume 3, pages 1339–1346. IEEE Computer Society, March 2003.
[51] Sun Microsystems. java.lang.reflect (Java 2 platform SE 5.0).
http://java.sun.com/j2se/1.5.0/docs/api/java/lang/reflect/package-summary.html, 2004.
[52] Sun Microsystems. Java(TM) remote method invocation (Java RMI).
http://java.sun.com/j2se/1.5.0/docs/guide/rmi/index.html, 2004.
42
Andrew R. Dalton, Jason O. Hallstrom
An Interactive, Source-Centric, Open Testbed
[53] Sun Microsystems. Java(TM) RMI over IIOP documentation.
http://java.sun.com/j2se/1.5.0/docs/guide/rmi-iiop/index.html, 2004.
[54] M. Takai, J. Martin, and R. Bagrodia. Effects of wireless physical layer modeling in mobile
ad hoc networks. In The 2nd ACM International Symposium on Mobile Ad Hoc Networking &
Computing, pages 87–94. ACM Press, October 2001.
[55] B. Titzer, D. Lee, and J. Palsberg. Avrora: Scalable sensor network simulation with precise
timing. In The 4th International Symposium on Information Processing in Sensor Networks,
pages 477–482. IEEE Computer Society Press, April 2005.
[56] G. Tolle. Nucleus network management.
http://www.cs.berkeley.edu/∼get/nucleus/nucleus-manual.pdf, 2005.
[57] R. Tynan. TinyOS Eclipse plugin.
http://tide.ucd.ie/, 2006.
[58] UC Berkeley. MIG — message interface generator for nesC.
http://www.tinyos.net/tinyos-1.x/doc/nesc/mig.html, 2003.
[59] UC Berkeley. TinyOS community forum —— an open-source OS for the networked sensor
regime. http://www.tinyos.net/, 2004.
[60] UC Berkeley. Soda hall wireless sensor network testbeds.
http://www.millennium.berkeley.edu/sensornets/, 2006.
[61] University of Southern California. Tutornet: A tiered wireless sensor network testbed.
http://enl.usc.edu/projects/testbed/, 2006.
[62] S. Wahba and J. Hallstrom. An empirical evaluation of embedded link quality. In International
Conference on Sensor Technologies and Applications, page (to appear). IEEE Computer Society
Press, October 2007.
[63] B. Warneke, M. Last, B. Liebowitz, and K. Pister. Smart dust: Communicating with a cubicmillimeter computer. Computer, 34(1):44–51, 2001.
[64] E. Welsh, W. Fish, and J. Frantz. GNOMES: a testbed for low-power heterogeneous wireless
sensor networks. In IEEE International Symposium on Circuits and Systems, pages 836–839.
IEEE Computer Society Press, May 2003.
[65] M. Welsh and G. Werner-Allen. MoteLab: Harvard network sensor testbed.
http://motelab.eecs.harvard.edu/index.php, 2006.
[66] G. Werner-Allen, K. Lorincz, M. Welsh, O. Marcillo, J. Johnson, M. Ruiz, and J. Lees. Deploying a wireless sensor network on an active volcano. IEEE Internet Computing, 10(2):18–25,
2006.
43
Andrew R. Dalton, Jason O. Hallstrom
An Interactive, Source-Centric, Open Testbed
[67] G. Werner-Allen, P. Swieskowski, and M. Welsh. MoteLab: a wireless sensor network testbed.
In The 4th International Conference on Information Processing in Sensor Networks, pages
483–488. IEEE Computer Society Press, April 2005.
[68] B. White, J. Lepreau, L. Stoller, R. Ricci, S. Guruprasad, M. Newbold, M. Hibler, C. Barb, and
A. Joglekar. An integrated experimental environment for distributed systems and networks. In
The 5th Symposium on Operating Systems Design and Implementation, pages 255–270. ACM
Press, December 2002.
[69] K. Whitehouse, G. Tolle, J. Taneja, C. Sharp, S. Kim, J. Jeong, J. Hui, P. Dutta, and D. Culler.
Marionette: Using RPC for interactive development and debugging of wireless embedded networks. In The 5th International Conference on Information Processing in Sensor Networks,
pages 416–423. ACM Press, April 2006.
[70] X. Zeng, R. Bagrodia, and M. Gerla. GloMoSim: A library for parallel simulation of largescale wireless networks. In The 12th Workshop on Parallel and Distributed Simulation, pages
154–161. IEEE Computer Society, May 1998.
[71] G. Zhou, T. He, S. Krishnamurthy, and J. Stankovic. Impact of radio irregularity on wireless
sensor networks. In The 2nd International Conference on Mobile Systems, Applications, and
Services, pages 125–138. ACM Press, June 2004.
[72] J. Zhou, Z. Ji, and R. Bagrodia. TWINE: a hybrid emulation testbed for wireless networks.
In The 25th IEEE Conference on Computer Communications. IEEE Computer Society Press,
April 2006.
44