1
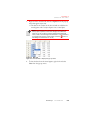
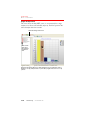
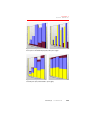
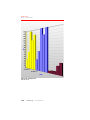
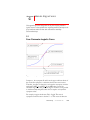
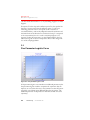
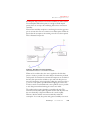
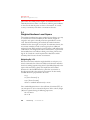
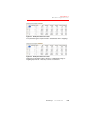
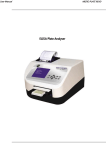
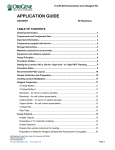
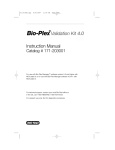
APPENDIX C
MOD
EL
EQUATIONS
can never reach the line where x= 0. Try calculating Log(0) to see what
happens.
In Figure C.1, B is the slope at the inflection point. It is the speed of the
function as it moves away from the inflection point. C is the most
interesting parameter since it corresponds to the x value that is
associated with the y value at the midpoint between the minimum and
maximum limits of the function. In a biochemical assay, C corresponds
to the concentration (since it is on the x-axis) that produces a 50%
response. In drug discovery terms, it is also known as ED50, the 50%
effective dosage. It can also be interpreted as LD50 if this dosage kills
50% of the sample population.
C.2
Five Parameter Logistic Curve
Figure C.2 Five parameter logistic curve
A five parameter logistic curve introduces an additional parameter to the
four parameter logistic model to compensate for asymmetric data. In
Figure C.2, we can see that the curve is not symmetric because the bottom
part of the curve behaves quite differently from the top portion. The
additional parameter E compensates for this behavior and corrects for
asymmetry.
C.2
MasterPlex QT
www.miraibio.com