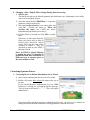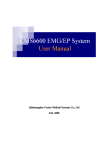
1
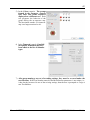
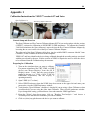
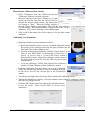
5.2.5
Science 6.0.9
[email protected]
http://www.veris-edi.com
Visual Evoked Response Imaging System
Short User Manual
Electro-Diagnostic Imaging, Inc.
200F Twin Dolphin Drive
Redwood City, CA 94065-1402
Manual-SCIS-C
VERIS™ 6.0 Science Guide
2
Table of Contents
_____________________________________________________
Chapter 1
Chapter 2
Getting Started with VERIS 6.0.9
4
Customizing your VERIS Application Preferences
4
Basic Operation of VERIS 6.0.9
7
Identifying the Patient (Subject)
7
Specifying a Test
7
Recording and Saving the Data
8
Analyzing Patient Data
11
Locating Patient Data Folders
11
Loading Data Files for Analysis
11
Viewing the Displayed Data
12
Averaging Test Data Replicated on the Same Day
13
Adding (Concatenating) Test/Analysis Protocols
13
Modifying Analysis Settings
13
Changing a Plot's Parameters
13
Changing a Plot's Digital Filter Settings
14
Correcting Operator Errors
14
Correcting Errors in Patient Information or Eye Tested
14
Inverting Polarity of Recorded Data
16
Chapter 3
Specifying and Using Baseline Files
17
Chapter 4
Creating and Using "Normals" Files
18
Creating a New "Normals" File
Sorting "Normals" by Age
Comparing Recorded Data to Normals
Specifying "Normals" in Plot Parameters
18
19
19
20
Manual-SCIS-C
VERIS™ 6.0 Science Guide
3
Chapter 5
Chapter 6
Appendix 1
Manual-SCIS-C
Creating and Editing Windows, Tabs, and Plots
21
Opening New Windows
Adding Tabs to a Standard Window
Tab Controls
Adding Plots to a Tab
Editing Plots
Plot Sources
Filtering Controls
Kernel Slices and Epochs
Scaling
21
21
21
21
22
22
23
24
24
Creating and Editing Recording Settings
25
Creating a New Recording Settings File
Creating a New Recording Settings File by Modifying an Existing One
Editing Recording Settings
25
25
26
Calibration Instructions for VERIS™ 6.0.7 and Later
28
VERIS™ 6.0 Science Guide
4
1 - Getting Started With VERIS™ 6.0.9
_____________________________________________________
Welcome to VERIS™ 6.0.9. This newly enhanced version simplifies program use for the technician while
maintaining the versatility and flexibility of previous versions.
With this new version all electrophysiological tests have been integrated with improved data handling and
control. All patient (or subject) data is automatically placed in that patient's folder with privacy protection
features.
Comparison of multiple re-tests is now easily accomplished. Recording and analysis protocols provided by
EDI now have revision controls.
All VERIS™ systems include pre-programmed Recording and Analysis protocols. In VERIS™ Science
you can also design your own Recording and Analysis protocols.
The first step in working with VERIS 6 is to customize your application preferences, defining the default
storage location for your VERIS data, the information to be entered and saved for each new patient, the type
of calibrator used with your system, and other environmental and security parameters.
Customizing Your VERIS™ Application Preferences
1. Click on the VERIS icon, located in the "dock" at the bottom
of your screen, to start the program.
2. From the VERIS pull-down menu, select "Preferences."
3. VERIS will ask you for the administrator Password.
Enter the Password.
Manual-SCIS-C
VERIS™ 6.0 Science Guide
5
4. The "Application Preferences" window will open.
W A R N I N G ! Choosing
your preferences must be
done with great care.
Subject Titles in particular
will be used for finding and
sorting files by subject
fields. If you change Titles
we strongly encourage
consistency. By default,
the program creates a title
for each recorded data file
using the entire field (Last
Name) and first letter of the
field (First Name).
EDI suggest that for the
present you proceed with
the default settings but
choose
your
own
preferences in the very near
future after you have
acquired some experience
with the software.
Adding/Removing and Creating Patient Information Fields
Under Subject Titles are three columns containing titles for subject information. The left column
contains the titles that you want VERIS to use in your application.
The center column contains additional VERIS titles you can add to your application.
The right column contains your own Custom titles.
• To add titles to the VERIS application select them from the center or right column and drag them
into the left hand column.
• To remove titles, simply drag them back to their column of origin.
• To create a Custom title, click the "Add Title" button, enter a
name and select the data type to be associated with this custom
title.
Manual-SCIS-C
VERIS™ 6.0 Science Guide
6
Specifying "Required" Information Fields
Titles in the left column having a check mark are "required" information that must be filled for a new
patient prior to continuing.
• To define required titles place a check mark by clicking to the left of any titles you may have
placed in the left column.
Assigning the Default Data Folder Location
By default, all data are saved in the "Veris Data" folder located within the Users / Documents folder.
Data can be stored on any storage device or remote server.
• To assign a different location for your Data folder, click the “Select new location” button
located at the top of the Preferences window.
Defining "Subject" Preference
You can select what the subjects of your recordings will be called, i.e. Patient (as in a clinic
environment) or Subject (as more appropriate in a research laboratory).
• To define your preferred terminology for subject, type in the text you wish to substitute under
"Terminology defaults" at the bottom of the “Preferences” window.
File Locking and Authorization for Data Security
You can lock your data files so they can be viewed within the VERIS application but cannot be
changed in any way without supplying the Administrator password.
You can also require password authorization in order to modify the program preferences.
• To "Keep files locked" or "Require Authorization", check the appropriate box at the bottom
of the "Preferences" window
Specifying Calibrator Type
• Place a check in the "Using Spot Calibrator" checkbox if using the new spot calibrator. Leave
the checkbox empty only if using the older auto-calibrator.
Specifying Power Line Frequency
• Select either 60 or 50 Hz from the Power Filter cycles drop-down menu to identify the line
frequency of AC power at your location. This automatically sets the digital notch filter frequency in
the Edit Filters window for all data analyses.
Manual-SCIS-C
VERIS™ 6.0 Science Guide
7
2 - Basic Operation of VERIS™ 6.0.9
_____________________________________________________
The fundamental steps for performing any test are as follows:
1. Identifying the patient by creating the patient's folder (or opening a previously tested patient's
folder).
2. Specifying a test
3. Recording and saving the data.
1. Identifying the patient
Creating a data folder for a new patient
After entering the patient's ID number, you will be prompted to "Fill in required fields." All fields
with asterisks must be filled in. Then you will be prompted to "Create new folder" for this patient's
data. Click on "Create new folder" and the new folder will be opened with an empty field displayed in
the File Viewer panel to the right.
Opening the data folder for a previously tested patient
If you know the patient's ID number, enter it into the ID#
field and press the keyboard "return" key. The patient's
subject information will appear and the File Viewer panel
to the right will list the data files recorded from that
patient.
If you do not know the patient's ID number, you can enter a
portion or all of the patient's first or last name in the
appropriate field, and VERIS will identify matching
records in a drop-down menu. Click on the drop-down
menu to select and open the appropriate patient's folder.
2. Specifying a test
There is a set of Test/Analysis Files provided for every EDI stimulator. Each Test/Analysis file
consisting of plots with associated analysis parameters for one or more electrophysiological tests.
1) Click "Select" on the VERIS
menu bar and choose "Select
Test/Analysis." A new file
navigator window opens,
providing access to all
test/analysis protocols on your
system.
2) Select a test/analysis file that you have used before
from the Recently used files drop-down menu or
click the small triangle next to the folder
corresponding to the stimulator hardware you are using
to show the test/analysis protocols available for that
stimulator.
3) From these protocols select an analysis file for the
specific test you want to run, then click "OK".
Manual-SCIS-C
VERIS™ 6.0 Science Guide
8
Upon opening the analysis file, a series of colored tabs will appear to the right of the Patient
(Subject) tab in the VERIS window. Each tab contains one or more plots. These plots may reflect
the same test or different tests. If there are no previous records from this patient, all plots will be
empty. If test data from the patient exist, the plots for these tests are automatically filled showing
you the most recent data.
4) Click on any tab that contains plots for the test you want to run. In some cases (e.g., fullfield ERG protocols) each tab in a file represents a different test, while in others (e.g., multifocal
ERG protocols) each tab provides a
different representation of data from the
same test.
5) For some tests, there are separate plots
for each (i.e. right or left) eye. If this is
so, click in the plot area of a plot for the
eye and test you require. A small red
recording button will appear above
under the tabs and the eye that was
selected will be shown.
Binocular Recording
Some tests (e.g., full-field ERGs) can be recorded binocularly. To record binocularly, after
selecting a plot for the specific test you want to run, click on the recording button while holding
down the keyboard <option> key. You will be instructed to connect the electrodes for the right eye
to Channel 1 and from the left eye to Channel 2. Then proceed normally to the recording window.
3. Recording and saving the data
1) Click the red button and wait. A window will appear that allows you to enter optional additional
information and comments for the eye(s) being recorded. Click "Yes" to continue.
2 ) If V E R I S detects that a
remote controlled amplifier
is
connected,
the
amplification and filter
settings are automatically
loaded from the recording
settings file when entering
recording. If a remote
controlled amplifier is not
found, VERIS reminds you
when entering recording to
manually check that the
amplifier settings are
correct. A small, spinning
colored wheel will appear
while the recording
environment is established
and a data file is created,
then the recording window
will appear.
Above figure shows recording window for full-field ERG. Subject
shown undilated, without electrodes.
Manual-SCIS-C
VERIS™ 6.0 Science Guide
9
3 ) Prepare and position the
patient for recording.
4) Clicking anywhere
within the video image
window or on the
"Calibrate Camera"
button opens a window
with brightness, contrast,
and other settings for the
eye camera and (FMS
only) fundus camera.
5) The "Edit Amplifier"
button provides access to
the current amplifier
settings and electrode
impedance measurement.
6) For full-field flash tests,
the Auto-Repeat function
mfERG Recording Window (Undilated, No Electrode)
can be turned on or off by
adding or removing a checkmark in the "Auto-Repeat" checkbox.
a) Click the Flash button to present a single flash or to initiate the pre-defined auto-repeat
sequence of flash stimuli.
For multifocal ERG or most other tests, click on the
“Record Next Segment” button to begin recording. A
"Segment Progress" bar below the buttons shows the
progress in the recording of the segment. Repeat step # 3
until all segments
have been recorded. The Record
Next Segment button now
becomes Accept Recording.
7) After the recording has been accepted, the data automatically appear in the plot and all other
plots that correspond to this test.
8) If previously recorded data for the test had been represented in the plot, they are now replaced by
the results from the new test.
9) For tabs containing plots with one
or multiple retests, you may
enable the recording of the test by
clicking on any one of the plots.
When the new record is accepted, its
data appear in the plot for the most
recent record and all previous
records are again shown in timesequential order.
10) A Test Number uniquely identifies
the recording settings for each of the
available stimulators. When a plot
Manual-SCIS-C
VERIS™ 6.0 Science Guide
10
is selected and you click on the Show Info button next to the Record button, the plotting parameters
and the Test Number for the record in the plot appear in the left boarder of the window. Double
clicking on the code brings up the settings of all the corresponding recording parameters.
Manual-SCIS-C
VERIS™ 6.0 Science Guide
11
Analyzing Patient Data
1. Locating patient data folders
Locate a patient folder any of the following ways:
1) If you know the patient's ID#, simply enter it into the ID # field of the Subject Page and press
the "tab" or ""return" key on your keyboard.
2) If you do not know the patient's ID# but do know the patient's
first or last name, begin typing it in the appropriate Name field
of the Subject Page. A "Choices" drop-down menu will
appear containing all records that match what you have typed.
Just click on the correct entry in that list to open the patient's
folder.
3) You also can simply find the folder in the File Viewer panel at
the right. Just double-click on the folder icon to open the folder and load the subject
information. This works best if you have only a small number of patient folders in the File
Viewer.
2. Loading data files for analysis
Open the patient's data folder using any of the methods above. (You can widen the File Viewer
panel so that the entire file names are visible by click/dragging it's inner boundary to the left.)
To view the most recently recorded data from the patient whose folder is open,
1) Click on Select > Select Test/Analysis... on the VERIS menu bar to open a Finder window.
2) Click on the "Recently used files" bar.
3) Select an analysis settings file appropriate for the test data you want to view and click "OK".
The analysis file will open and the most recently recorded data for that test will be displayed
automatically.
To view any data file,
1) Click on the data file's icon while holding down the keyboard <control> key. A context menu
will appear with two choices. Either,
2) "Open the File..." (replacing any analysis tabs already open in your window),
or,
"Add the File..." (appending the new file's analysis tabs to any that already are available in your
window).
When you choose either of these options, a list of all analysis files on your computer that are
appropriate to the chosen data file will be listed. The most recently used ("preferred") analysis
settings for the chosen data file will be marked with a dark diamond symbol. Just click on the
analysis file you want to use to load it with the selected data file.
or,
1) Double-click on the desired file's icon to open the file with its "preferred" analysis settings (if a
preferred analysis file is assigned).
WARNING: When you open a file by double-clicking on its icon in the File Viewer, the
sequence number of the plots displaying its data changes to that of the file being viewed. If
you save the analysis file, these plots will be saved with the changed sequence numbers.
[Important Note]: Double-clicking on a folder or data file icon while holding the keyboard <option>
key down will open it in a new window with the same analysis file that is currently open.
Manual-SCIS-C
VERIS™ 6.0 Science Guide
12
3. Viewing the displayed data
After opening a data file with an appropriate analysis settings file, a number of tabbed pages are added
to the Subject tab, each of the new tabs displaying one or more plots.
Each plot in every tab is prepared for a specific test that is identified by the plot's "test
number". Plots for the same or different tests can be displayed on the same page.
When a plot is empty, it is labeled with the test number, sequence number and channel number (in
the case of multi-channel recording) for the data that fit into the plot.
All of the patient's data files are listed in the File Viewer on the right side of the window and are
color coded.
• All data files whose data is plotted in the current tab are shown in bold green.
• Additional data that would fit into a selected plot are shown in bold black.
• Data files that are not plotted in the current tab are listed in grey.
You may drag any one of the bold black colored data file names into the blue file name displayed
in a selected plot. Two processes happen automatically:
• The data of the plot into which the file is dropped are replaced by the data of the new file.
• The files in all the plots of that tab for the corresponding test are rearranged in time
sequential order.
When there have been multiple replications of the same test for a single patient, the data
files are assigned sequence numbers according to their recording dates starting with "1" for the
most recent date of recording, "2" for the next most recent date, etc. If only one eye is tested on a
particular date, only that eye's data file receives that date's sequence number. When two or more
files are recorded applying the same test to the same eye on the same date, only the last file recorded
that day from each eye is assigned that date's sequence number.
In tabs containing plots for multiple replications of the same test, the data are automatically
presented in according to the sequence numbers assigned to the plots. Plots for tests (or eyes) not
previously recorded on a particular testing date are empty and labeled with the test number for the
type of test data that fits into the plot.
Manual-SCIS-C
VERIS™ 6.0 Science Guide
13
4. Averaging data replicated on the same day
If you repeat a test of the same eye on the same day, a new data file containing the average of two or
more of the individual recordings can be created. Select a plot appropriate for the files to be
averaged. Then simply select the files to be combined by clicking on them in the VERIS File
Viewer while depressing the <command (apple)> key of the keyboard. Finally, drag the selected
files together into the file name displayed in the selected plot. A new data file will be created with
the word "Average" in it and the plot will be updated to display the averaged data. Note that all files
to be averaged this way must be for the same eye and test number and have the same recording date.
5. Adding (concatenating) analysis protocols
A window with all its tabs and plots constitutes a test/analysis protocol. In this protocol
you may assemble all the tests and corresponding plots normally performed and save the file with
the new test sequence for future use (with VERIS Science or Pro).
If you are viewing one test/analysis protocol and feel that another one
should be added, use the Add Test/Analysis command from the Select
drop-down menu. The tabs of the added test/analysis protocol are then
automatically appended to the string of tabs in the window.
To save this combined view as a new test/analysis protocol, use the Save
As..., Save Test/Analysis As... command from the File drop-down
menu.
Similarly, you can replace one protocol with another using the Replace Test/Analysis command,
or delete a protocol's tabs with the Remove Test/Analysis command.
Modifying Analysis Settings
Revision Control: Adding new tabs and plots or modifying existing plots, requires OS X administrator
privileges and password. Modified settings should be saved under the same name as those Analysis
settings issued by EDI.
When saving modified analysis settings you must select a new file name. EDI-released settings should
be overwritten. You are responsible for the control of the settings you generate or modify.
1. Changing A Plot's Parameters
1) Select a plot by clicking anywhere within the plot area. When a
plot is selected, a series of buttons are activated on the top border
of the window.
2) Select the button labeled "Edit Parameters" to open the
parameter settings associated with that plot.
3) Change the parameter settings as needed and click OK to modify
them.
4) To use the modified plot with a new test,
enter the Test Number in the labeled field.
Manual-SCIS-C
VERIS™ 6.0 Science Guide
14
2. Changing a Plot's Digital Filter Settings During Data Processing
1) Select a plot.
The data in each plot can be filtered separately and in different ways. Additionally, each overlay
source can be uniquely filtered.
2) Select the button labeled "Edit Filters..." to open the
parameter settings for that plot.
3) Select the Overlay Source(s) you want to filter and
click OK. (Usually one wants to "Filter all
overlays the same", but VERIS also allows
independent digital filtering of overlays.)
4) Edit the Filters as needed and click OK to modify
them.
Note that you must first check the
filters you wish to add, in order to
modify their individual control
values. These are the same filters
available in VERIS 5. They are
described in detail in your VERIS 5
Reference Guide.
Since, in VERIS 6, digital filtering
is applied per plot, it is possible to
present the same data set filtered in
different ways in separate plots in
the same window or tab.
Correcting Operator Errors
1. Correcting Errors in Patient Information or Eye Tested
1) Select a plot containing the data for a file to be edited.
2) Double-click on the blue colored file name at the top of
the plot.
If you checked Require Authorization in your VERIS
Preferences, a dialog box will appear with the message:
"Do you want to edit the file “……..” ? This will require
authorization."
If you answer Yes and then supply the Administrator Password, you will access a window for
editing the patient information and the recording parameters stored in the record.
Manual-SCIS-C
VERIS™ 6.0 Science Guide
15
A Data File Editing Window
2. To correct patient information that was incorrectly entered, just edit the items as needed in
this window and click "OK". Before saving the file, you also should correct any errors in the file
name. If you save the data with a new file name, do not forget to delete the incorrect file.
3. To correct the eye tested (e.g., if the right eye was selected for recording but you accidentally
recorded from the left eye instead), click on the icon labeled "Misc" at the upper left. A window
like the one pictured below will open. Select the correct eye from the drop-down eye menu then
click "OK" at the lower right corner of this window and again in the "Edit Data File" window.
When prompted to save the file, correct the eye designation in the file name before saving it. Then
remember to delete the incorrect file from the VERIS file viewer by dragging it to the trash.
Manual-SCIS-C
VERIS™ 6.0 Science Guide
16
4. Inverting Polarity of Recorded Data
1) Highlight the data file to be corrected by clicking on its icon or file name in the VERIS File
Viewer panel at the right.
2) Select the data file you wish to change and click OK. Polarity of the selected file will be
inverted.
Manual-SCIS-C
VERIS™ 6.0 Science Guide
17
3 - Specifying and Using Baseline Files
_____________________________________________________
Overview
Sometimes it is useful to compare the results of all subsequent tests from an individual
subject to the same, single (baseline) recording. In VERIS 6.0.8 and later, you may select
any file from the File Viewer at the right of an analysis window and designate it a baseline
file. All other records of the same type (and eye) can easily be compared to the baseline
recording. In addition to its normally assigned sequence number, a baseline file always has
a sequence number of "0" (zero).
Specifying a Baseline File
1) Open the folder of a patient previously tested.
2) Select the file you wish to designate as a baseline file in the File Viewer at the right by clicking
on its file name.
3) From the VERIS menu bar, select Select > Select File as Baseline.
4) A "B" will be appended to the file name to designate its status as a baseline file and it will be
assigned a sequence number of zero in addition to its normally assigned sequence number.
Removing a Baseline Designation from a Data File
Select a file that is already designated as a Baseline file and perform the baseline file specification
procedure above. You will receive a prompt stating that the file already is a Baseline file and asking
whether or not you want to remove that designation. If you select "Yes", the "B" will be removed
from the file name and the file will no longer be a Baseline file.
Changing the Baseline File
If you select a file to designate as a Baseline file, but there already is a baseline file specified for that
test type and eye, you will receive a prompt listing the current Baseline file and the new one that you
have just specified and will be asked if you want to change the Baseline designation to the new file.
If you select "Yes", the "B" will be moved from the previous Baseline file to the newly specified
one.
Comparing Baseline Files to Other Data Files
For however long a file is designated as a Baseline file, it is assigned a sequence number of "0" in
addition to its normally assigned sequence number. To specify the baseline file as a plot source,
you need only select 0 for the plot number. Thus, display a baseline file in any plot, either by itself
or as an overlay in the same plot as another data file of the same type from the same eye. You also
can perform simple arithmetic operations between the Baseline file and any other plot source.
Manual-SCIS-C
VERIS™ 6.0 Science Guide
18
4 - Creating and Using "Normals" Files
_____________________________________________________
A VERIS "normals" file is a "combination file" comprised of averaged data recorded from
any number of normal subjects. The result can be plotted together with results from a
single subject or one can plot the differences of the subjects data and the normal data in
units of standard deviations from the normal means. The data also can be arranged
automatically into pre-defined age groups. If this option is employed, then newly recorded
data will be compared automatically to the correct age group of normal subjects.
It is most convenient, but not essential, to group your normal subjects' folders within a separate folder in
your default VERIS data folder using the OS X Finder.
1. Creating a New "Normals" File
1) From the VERIS menu bar, select File > New Combination.
2) Enter the system password, if prompted. Enter a file name for your new normals file and save it
in the Normals folder in your VERIS application directory. A combination file window will
open with a file viewer pane at the right and four different panels to the left.
3) Select one or more normal data folders from the File Viewer and drag them into the Folders
panel at the upper left. Wait while the data files from those folders are sorted and averages are
calculated. You may then continue to add more normal data folders until all have been entered
into the Folders area.
4) Now, you may either close the window or, if you have a sufficient number of normal data files,
you can select appropriate age ranges for additional sorting by age.
Manual-SCIS-C
VERIS™ 6.0 Science Guide
19
2. Sorting "Normals" by Age
Often it is appropriate to compare clinical data to recordings obtained
from normal subjects of similar age. VERIS 6 will do this
automatically if you select appropriate age ranges in your "Normals"
combination file.
1) From the VERIS menu bar, select File > Open. Select "Show
only Combination Files", then navigate to the "Normals" folder
in your VERIS application directory and open the file you wish
to change.
2) Click on the "Edit Ages" button.
3) Enter age ranges, taking care to ensure that you select ranges
which each contain a sufficient number of subjects from whom
to calculate meaningful averages and standard deviation values.
Selected age ranges must not overlap or an error message will
result.
4) Close the "Edit Ages" box by clicking on the OK button.
5) Your data files will be re-sorted and new calculations will be
made according to the age ranges you have selected.
6) When the calculations are complete, you may close the
Combinations File editing window and the file will be saved.
3. Comparing Recorded Data to "Normals"
EDI provides analysis settings files that compare most recordings to a "Normals" file that the user
selects. With VERIS Science or Pro, you can customize these files or create new ones to your own
specifications.
1) Open a recording file.
2) Open an Analysis Settings file appropriate for that recording that refers to "normals" in its file
name (e.g., "mfERG 103h 7m 200cd with normals.m21").
3) From the VERIS menu bar, choose Select > Select Normals File...
4) Choose the Normals file you want to compare to from the list of files in the "Normals" folder
of your VERIS application directory. Then select any tab. VERIS will automatically apply any
artifact rejection, spatial averaging, and filtering specified for the plots in that tab and will
display the recorded data with comparison to the chosen normal data.
5) IMPORTANT: Plots that compare subject data to averages of normal data in units of standard
deviation from the mean are re-calculated whenever there is a change to filter settings or other
parameters such as artifact rejection or spatial filtering. If you save the new parameter settings
for future use, you also should select the standard deviation plot and save the new calculations
in the current "Normals" combination file by selecting from the VERIS menu bar: File > Save
STD data. By doing this, you can avoid having to re-calculate the means and standard
deviations of the normal data every time you view a new recording.
Manual-SCIS-C
VERIS™ 6.0 Science Guide
20
4. Specifying "Normals" Files in Plot Parameters
To plot averaged normal data, simply select a plot, click on the "Edit Parameters" button, and select
"Normal Reference" from the appropriate drop-down source list in the "Plot Sources" section of the
plot parameters editing window. It is best also to place a checkmark in the "Filter all overlays the same"
check box to ensure that the same filtering is applied to the normal data and the current subject data.
Be sure to select the same eye for both normal and subject file data.
You can average right and left eye normal data for comparison by entering both as plot sources (see
image below). Select both as plot sources and choose "Avg" as the operator between them in the Plot
Sources panel of the plot parameters editing window.
IMPORTANT: Always verify that the "Reflect eye as needed" box is checked so that the data array is
properly oriented when combining data from the left and right eyes. For VERIS version 6.0.8 and
earlier, the normal data array will be oriented according to the eye that is specified first in the second
(lower) overlay pair of source boxes. In VERIS versions 6.0.9 and later, the first source of the second
overlay always will specify the "Left Eye" when both eyes are averaged in the second overlay, and the
averaged data automatically will be reflected to agree with the upper source of the 1st (upper) overlay.
Example
The example below shows the plot parameters for an 3D Response Densities plot of the differences
(in standard deviations from the normal means) in which data from the right and left eyes of the
normal subjects are averaged together after proper reflection for comparison to the subject's left eye.
Filtering is the same for all data in the plot.
Manual-SCIS-C
VERIS™ 6.0 Science Guide
21
5 - Creating and Editing Windows, Tabs, and Plots
_____________________________________________________
There are two kinds of primary windows in VERIS. Standard windows, with colored,
labeled tabs at the top edge, display data within various plots on each tabbed page.
Combination windows are used to combine data from any number of subjects for the
purpose of averaging these data and creating statistics for comparison to individual data
files. The file(s) created using combination windows can then be compared to individual
data in standard windows.
1. Opening New Windows
1) Standard Windows are created by selecting New from the File drop-down menu.
2) Combination Windows are created by selecting New Combination from the File drop-down
menu.
2. Adding Tabs to a Standard Window
Tabs are added to a window by selecting Add Tab from the
Edit pull-down menu. "Pulling" a tab by clicking on it reveals
the plots it contains.
3. Tab Controls
Double-clicking on a tab brings up the controls for labeling and
coloring the tab.
A copy of the tab and its contents can be made by placing a
check mark in the "Copy Tab" checkbox and clicking on "OK".
The tab can be deleted by placing a check mark in the "Remove
Tab" checkbox and clicking on "OK".
The plot area in a tab can be protected from accidental moving of
the plots and other contents by checking the box labeled Freeze.
4. Adding Plots to a Tab
Each tab may contain any number of plots. In VERIS 6, plots
belonging to different tests can be arranged in the same tab.
When a Tab is open and the Freeze box is not checked, plots
can be added selecting Add Plot to Tab from the Edit dropdown menu. The user selects the plot appropriate for the data to
be displayed (for a description of the plot types see Appendix I).
Manual-SCIS-C
VERIS™ 6.0 Science Guide
22
5. Editing Plots
Selecting a plot in a tab activates the Parameters Button. Clicking
on it brings up the Parameters Control Box for the plot.
Each plot has a Test Number
specified in a field near the center of
the box.
This Test Number
uniquely specifies the Record type
for that plot, i.e., the Recording
S e t t i n g s file that specifies the
recording settings of the data that
can be displayed in that plot. This
Test Number is critical in that it is
the link between every plot and the
data that it can display.
1) Section: Plot Sources (Common to all plot types)
The top section of the parameter box specifies the sources for the plot.
Each plot can combine data from up to four different source files whose data are plotted in two
overlays. The top two lines in this section specify the sources for the first overlay and the
bottom two lines those for the second overlay of the plot.
Each source can be either a data file or a Normal reference file. All refer to same Test Number
specified in the Test Number field near the center of the Parameters control box.
Sources are identified and displayed according to the following parameters:
• Eye: right or left.
• Sequence Number: Specifies the temporal ordering of the file in the plot depending on
the recording data. If multiple files with this test number and eye are present in the
patient's folder, Sequence Number 1 will select the most recent, 2 the previous, 3 the one
Manual-SCIS-C
VERIS™ 6.0 Science Guide
23
before the previous etc. This feature permits us to generate plots for multiple retests of
the same type of record in the same plot and in different plots in the same tab.
• Channel Number: If the Recording Settings specified multiple channels, this number
will select the channel number of the source.
• Percent: This parameter specifies the relative percentages of sources if more than one
source is present in a plot.
• Color: Double clicking on the color box in the overlay brings up a dialogue for
selection of the color in which of corresponding plot traces and numbers are plotted.
• On the line for each source there is a button labeled Filtering. Clicking on it brings up
the controls for the filtering of the source. The checkbox labeled ‘Filter all sources
the same’ replaces the Filtering buttons on the lines by a single one that opens the
common filtering controls.
Align to ONHC Marks: When this check box is checked, the traces of the multifocal
record are aligned to the implicit times of the Optic Nerve head Component (ONHC). The
timing marks that control this alignment are saved and stored in the ONHC Recording
Settings.
The operation selected on a pull-down menu between the two sources in each overlay specifies
if or how the source files are being combined: sum, difference, ratio or the average of the two
sources. In the case of mfVEP data it can also be the Best Combination of two recorded
channels, i.e. the best of ch 1, ch2, ch1+ch2, ch1-ch2.
Selecting the function in the pull-down between the overlays one may also form the sum,
difference, ratio or average of the two overlays. In this case, two to four sources are reduced to
a single overlay in the plot.
If a source is currently in an overlay, its file name is shown in blue toward the end of the line.
Double clicking on this file name will bring up the set-up information and recording parameters
of the file for inspection. Editing the file requires the administrator password.
2) Filtering Controls
Clicking on a "Filtering" button in a plot parameters window will bring up a window containing
controls for both digital temporal filtering as well as spatial averaging. The temporal filtering
parameters are self-explanatory.
Manual-SCIS-C
VERIS™ 6.0 Science Guide
24
Spatial averaging is specified with two parameters:
• The percentage of surrounding responses averaged into a local response.
• The number of iterations applied to this process.
If one iteration is chosen, the spatial filtering extends only to the nearest neighbors. When more
than one is iteration selected, the filtering extends to the next nearest neighbors or beyond.
3) Section: Kernel Slice and Epoch
(active in all plots generated by m-sequence stimulation)
The settings in this section apply to all sources used in the plot.
Tick Mark Bar
The tick marks specify the
kernel slice displayed.
• The number of tick marks
is equal to the kernel order.
• The spacing of the tick
marks specified the kernel
slice.
Epoch Start and Epoch End specify the range of the kernel waveform to be used in the plot.
Combine Kernel Slices
Checking the box ‘Combine Kernel Slices’ allows the user to linearly combine different
kernel slices. The user specifies the slice to be included on the tick mark bar and clicks on
the red-labeled "Include" button that appears. If a kernel slice has already been selected
with a different sign or epoch, the user is prompted to specify whether to modify the
previous selection or add the new one.
6.
Section: Scaling
This section controls all scaling of plots and plot components
• Vertical scaling of traces
• Horizontal scaling of traces
• Vertical scaling of 3D plots
• Color scaling of pseudo-color plots
The controls are self-explanatory.
Manual-SCIS-C
VERIS™ 6.0 Science Guide
25
6 - Creating and Editing Recording Settings
_____________________________________________________
In VERIS Science and Pro you can modify all recording parameters. The parameter controls are the same as
those of the corresponding recording settings in VERIS 5.
Revision Control
Modifying settings requires administrator privileges and password.
Modified settings cannot be saved under the same name as those
Recording settings issued by EDI. You must select a new Name and a
new Test Number for the edited settings. This feature permits EDI to control
protocols released by the company. You are responsible for the control of the
settings you generate or modify.
1. Creating a new recording settings file
Select "New Recording Settings" from the File drop-down menu. A "Save as.." Window will
open. Enter the name and location for the new Recording Settings file. Recording Settings files
always should be saved someplace within the "Recording Settings" folder in the VERIS 6
application folder. You may want to organize your own Recording Settings files within a folder
separate from EDI's files so that EDI's files can be updated easily without affecting your
customized files.
After saving the new Recording Settings file, a new Recording Settings Window opens.
2. Creating a new recording settings file by modifying an existing one
It usually is easier to create new recording settings file by modifying an existing one designed for a
similar test.
1) Open a Test/Analysis file containing a test similar to the one you want to create in a new VERIS
window as though you were to begin a new recording. (It is not necessary to load a data file.)
2) Click on the "Show Info" button to open an information panel at the left.
3) Select a plot for a test similar to the one you want to create.
4) Double-click on the blue "Recording settings" file name in the Information panel to open that
test's recording settings file.
5) In the Click the "Misc" icon and in the new window, enter a new, unique test number to replace
the current one.
6) Edit the recording settings and save them with a new file name as instructed below.
Manual-SCIS-C
VERIS™ 6.0 Science Guide
26
3. Editing recording settings.
All recording parameters are set as in VERIS 5 with the following exceptions:
1) Each Recording Setting must have a unique Test Number that is entered in the section
Miscellaneous (Misc).
2) In the Geometry parameters section: Multifocal stimulus elements can be grouped. Each
group can be stimulated according to its own m-step design. The Color and frame sequence for
each group are then set in the Colors parameters section.
3) Multifocal stimulus elements can
be renumbered sequentially or
using a modulus.
a) Click on "Show Numbers"/
b) Click on "Renumber" and use one
of the following options:
i) Select "Sequential from" and
the starting number,
ii) Select "Sequential mod" and
the desired modulus.
Elements with the same number
will be stimulated with the same
m-sequence lag.
4) Multifocal stimulus arrays can
now be reduced by removing
selected polygons:
a) Form a group of the elements to
remove.
b ) Click on Remove Polygons in
Selected Group.
Manual-SCIS-C
VERIS™ 6.0 Science Guide
27
5) In the Colors controls: The groups
formed in the Geometry controls
have their own frame sequences
displayed on a different row. Each
row programs the behavior of the
group during the m-sequence step.
The maximum number of frames/mstep is no longer restricted to 64.
6) In the Temporal controls, Ganzfeld
m-sequence stimulation has now
been added to the list of Stimulus
types.
7) After programming a new set of recording settings, they must be re-saved under the
new file name. If the Test Number entered in the Miscellaneous parameters is not unique, i.e.,
it has already been used in one of the existing settings, then the user is prompted to assign a
new Test Number.
Manual-SCIS-C
VERIS™ 6.0 Science Guide
28
Appendix 1
Calibration Instructions for VERIS™ version 6.0.7 and Later
Spot Calibrator in
Eye Camera Calibrator Adapter Removing Spot Calibrator
(ECCA)
General Setup and Overview
The Spot Calibrator and Eye Camera Calibrator Adapter (ECCA) are used together with the version
6 VERIS™ software for calibration of all EDI CRT or FMS stimulators. To calibrate the Ganzfeld
2 full-field stimulator, the Spot calibrator is removed from the Eye Camera Calibrator Adaptor by
loosening the set screw on the side of the Eye Camera Calibrator Adapter .
The other end of the Spot Calibrator cable plugs into the middle DB25 connector labeled "Auto
Calibrator" on the switchbox at the back of the computer.
VERIS 6.0.7 and later identifies the device being calibrated through the recording settings associated
with the test selected by the user. Earlier versions of VERIS 6.0 require the user to select the device
to be calibrated from the Calibration drop-down menu.
Preparing for Calibration
1. Turn on the stimulator that you want to calibrate.
For pattern stimulators like CRT, FMS, or EMS
devices) run "Detect Displays" from the OS X
Displays menu. Verify that the correct display
setting is chosen (e.g., 1280 x 1024 75 Hz for
FMS/EMS stimulators) and the display is
operating normally.
2. Open VERIS (6.0.7 or later).
3. Select VERIS Preferences from the VERIS drop-down menu at the upper left and enter your
password to view the VERIS Preferences window.
4. Verify that the "Spot Calibrator" checkbox is checked if you are using a Spot Calibrator or that
it is unchecked if you are using the older Auto Calibrator. Then close the preference window.
If you changed the setting, you should now close and restart the VERIS application.
5 . From the "Select" drop-down menu, click on "Replace Test/Analysis..." and choose a
Test/Analysis file that uses the stimulator you want to calibrate.
6. Click on (select) any plot that uses the device you want to calibrate.
Manual-SCIS-C
VERIS™ 6.0 Science Guide
29
Measuring the Calibrator Dark Current
1 . Select "Calibration" from the VERIS menu bar and
"Calibrator Calibration" from the sub-menu.
2. Block the opening to the Spot Calibrator so no light
reaches the detector, then click the "Read" button to
measure the detector's dark current. The button label
will change to "Stop". When the reading stabilizes,
press the ("Stop") button to stop reading. Then click the "OK" button to
save the reading. The reading should be between 300 and 400 for spot
calibrators. If it is outside this range, contact EDI Support.
3. Click on OK at the bottom left of the window to save the dark current
calibration.
Calibrating Your Stimulators
•
•
•
•
•
Mount the calibrator on your stimulator as follows:
a. Rotate the Ganzfeld so that it is face-up. Center the calibration card on
the opening of the Ganzfeld and insert the Spot Calibrator into the
hole in the center of the calibration card.
b. Securely mount the Spot Calibrator with ECCA hood attached to the
front of your FMS, EMS, or Refractor/Eye Camera lens as
shown. If you are using a 21-inch CRT display without a
Refractor/Eye Camera, suspend the calibrator, centered front of
the display with its lens 40 cm. from the CRT using the provided
suspension rod.
c. If you are calibrating a VERIS 2000 Ganzfeld, the calibrator is
internal. No Spot Calibrator or Auto Calibrator is needed.
From the Calibration drop-down menu, select Auto Calibration.
VERIS will automatically provide the correct calibration procedure
for the device used for the selected plot in the Test/Analysis
window.
Turn off the room lights, then click on the "Start" button in the calibration window.
Wait for the calibration to complete. All of the calibration curves should be continuous, looking
much like the examples shown.
Click the "OK" button at the lower right of the calibration window
to save the results. Then restart VERIS to use the saved
calibrations.
Manual-SCIS-C
VERIS™ 6.0 Science Guide