1
Δ ν = mH m F J
The additivity condition (that interactions are "first order") is easy to check after spectra
have been recorded.
|ω H − ω F|
J≪
2π
(11)
(12)
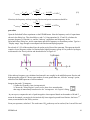
Figure 5 shows first the energy
levels (but in frequency units,
ν=E/h) of an F nucleus and a pair
of H nuclei, then the energy levels
of FH2 nuclei, but without
interaction (i.e., with J=0). The
third set of energy levels adds
energy shifts due to interaction, as
given in equation 6. Because the
two H nuclei are treated as a pair,
their mH quantum numbers are -1,
0 and +1, corresponding to H
nuclear spin configurations αα,
αβ, βα, and ββ, respectively.
A similar analysis predicts that the
CH2 proton resonance splits into a
1:3:3:1 quartet, with frequency
spacing J. The remaining proton,
the hydroxyl proton, will still be
at the unshifted proton resonance,
so the protons will appear as a
Figure 5. FH2 energy levels and transitions.
quartet (1:3:3:1) centered on a
singlet of relative intensity 4 (i.e., a 1:3:4:3:1 intensity pattern). Engel and Reid discuss AX2 and AX3
cases in section 28.8.2
Within the same first-order approximation used to predict splitting patterns, peak intensities are simply
3
proportional to the number of nuclei and to γ . If a spectrum is not too noisy, the integrated area
under a peak is a good measure of its intensity. Trifluoroethanol contains the same number of fluorine
and hydrogen nuclei but fluorine has a smaller γ , so the integral of fluorine peaks should be smaller
than the integral of hydrogen peaks.
EFNMR.odt
5