1
Project Design
318
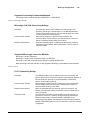
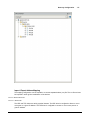
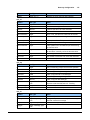
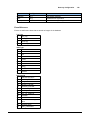
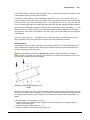
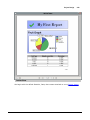
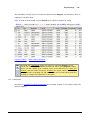
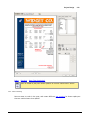
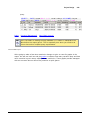
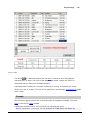
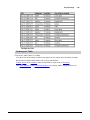
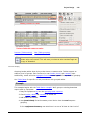
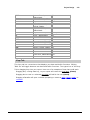
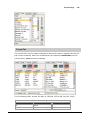
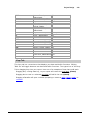
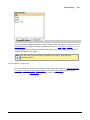
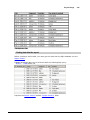
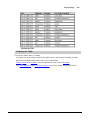
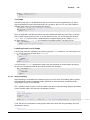
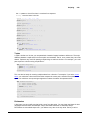
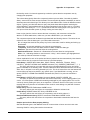
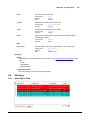
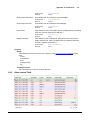
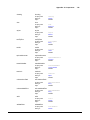
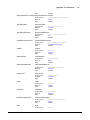
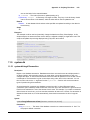
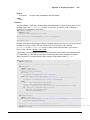
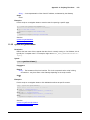
Notice that the example only has 2 unique sites. This is because we only have 12 rows of data.
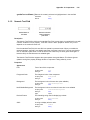
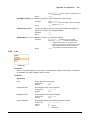
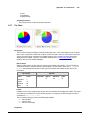
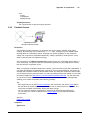
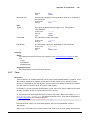
5.8.3.2.3 Graph
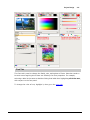
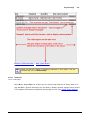
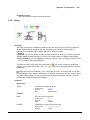
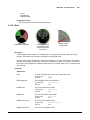
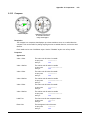
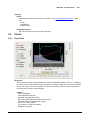
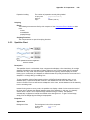
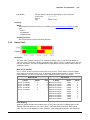
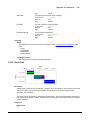
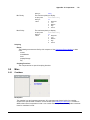
The Graph
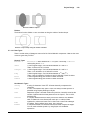
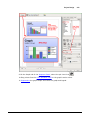
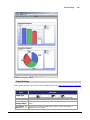
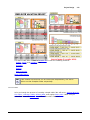
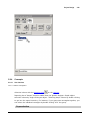
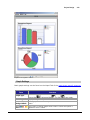
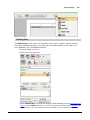
is a DataSet element like the table. It shows a 2D or 3D graphical
representation of data in the form of bar graph or pie graph. Graphs are useful for
illustrating relative amounts of summarized data.
Populating data including the concepts of data keys, sorting, and filtering are nearly
identical to that of a table. The look of the graph has a much deeper superselection model
than a table.
Example
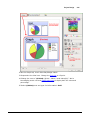
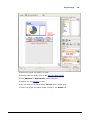
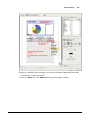
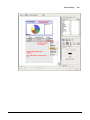
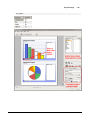
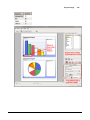
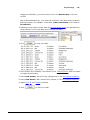
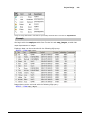
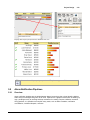
We will explore graph options with a total downtime by equipment example. The same
data is used as the table example.
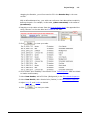
A downtime summary can be retrieved with the following SQL query:
SELECT equi pment , s um( t i me) AS t ot al Downt i me FROM downt i me GROUP BY
© 2013 Inductive Automation